 Open Access Article
Ionotronics for reverse actuation
Ehud
Haimov
 a,
Yuan
Chen†
 a,
Zaeem
Najeeb†
 a,
Michael
Urbakh
 b and
Alexei A.
Kornyshev
 *a
*a
aDepartment of Chemistry, Faculty of Natural Sciences, Imperial College London, Molecular Sciences Research Hub, White City Campus, UK. E-mail: A.Kornyshev@Imperial.ac.uk
bSchool of Chemistry, Raymond and Beverly Sackler Faculty of Exact Sciences, Tel-Aviv University, Tel-Aviv, Israel
First published on 28th July 2023
Abstract
In the midst of an ongoing energy crisis, the search for new methods of energy harvesting has never been more important. Here we explore, analyse and discuss principles of ionotronic reverse-actuator devices based on the effect of double-layer charging. The designs that we consider in this paper operate based on a common principle – using external mechanical work, which would otherwise be wasted, to produce changes in the contact area of electrode and electrolyte, translated into the time variation of the double-layer capacitance. Periodic variation of capacitance, when connected to a reference voltage source, produces alternating electric current through a load. This concept is not new and in some forms was realised in the early works of Boland, Krupenkin and several papers of our group. The goal of the present paper is to build a comprehensive analytical platform for a description of operation of such devices in terms of materials, generated power as a function of the frequency of variation of applied force, electrical load, and other factors; the understanding of which allows us to optimise these systems and navigate their construction. The first design, discussed in the paper, is based on flat electrodes. It is the simplest one and, as such, helps elucidate some key factors determining power generation. While being easy to realise experimentally, it generates relatively low power, even when optimised. The second design, based on microporous electrodes is more sophisticated and allows a much larger power harvest. The results are also compared to the recently proposed capacitive rotor device. The developed theory is set to capture the key factors that determine the functioning of the considered reverse actuators. The structures under study are matched to fit into the sole of a shoe and produce power from walking and running. However, they can also be scaled-up to larger operating systems and various external loads.
Introduction
While electronics is based on the effects of the controlled motion of electrons, ionotronics is about the motion and rearrangement of ions. A large class of ionotronic devices rests on the formation of the electrical double layers at electrode/electrolyte interfaces – a classical subject of electrochemistry that is applied to nonclassical objects. Indeed, ionic double layer electrochemistry can contribute to the development of new materials that could deliver interesting electromechanical effects. Such materials are often called functional materials,1,2 although this term may be questioned: why at all should one be interested in materials that are not functional? Even if they are purely structural, they have a well-defined function. So instead of functional, the term smart materials is widely used,3 presumably emphasising that such materials can do something that others, ‘less-smart’ ones, cannot. Ionotronic materials are among the ‘smartest’ ones. One important class of such materials includes electroactuators and reverse actuators.The term electroactuation stands for the change of the shape of an object under applied voltage. Such shape changes are of interest in the first place if they can produce useful mechanical work, and could do it inertia-free with a desired, controllable speed (see ref. 4–6). In some soft systems, the change of shape may be very easy, but it could not sustain any resistance and cannot do any significant work; such systems can however find their applications in sensing. It is thus not by chance that a renowned Elsevier journal is called “Sensors and Actuators”.
Reverse electroactuation is the conversion of mechanical motion into electricity. Whereas in the first place, it is relevant for the development of portable sustainable electrical energy generators, it can be, as well, used for sensing of mechanical motion. Reverse-actuator devices (REDs) are distinguished by their working principle. These include piezo-,7,8 nanotribological-,9,10 and capacitive-based11–13 devices.
Piezoelectric REDs operate on the principle that an applied pressure on a piezoelectric material sandwiched between two metal electrodes causes a distortion in the structure of the piezo-element, causing spontaneous polarisation, which results in a transient electric current. Releasing the strain decreases the polarisation, consequently causing current to flow backwards. Piezoelectric shoes were designed based on this principle, first seen in 2001,14 but the design was limited to harvesting approximately 1 mW power per shoe.
The triboelectric effect15 is a well-known physical phenomenon in which charges of opposite sign and equal magnitude are formed at the interface between two dissimilar insulating materials in close contact, typically generated via friction due to relative motion between the surfaces. We encounter this effect regularly in our day-to-day life in the form of static electricity; it is also the principle behind classical devices such as the Van de Graff generator.16 In REDs it is utilised to generate useful alternating currents. The formation of a dipole across the interface produces an interfacial electric field and a voltage drop between the interfaces. Utilisation of the generated voltage for energy harvesting was studied by Wang et al.10,17 There, two dissimilar polymer films in contact, backed with gold electrodes, create an interfacial potential difference, which induces current flow between the two electrodes. All triboelectric generators based on the contact of solid surfaces are prone to gradual degradation and failure after prolonged use. The scalability of triboelectric generators is also greatly limited by the surface area of contact, the number of paired contacts that can be accommodated, and the maximum surface charge density that can be generated between the materials in contact. Even with coupling electromagnetic induction with triboelectrification to create triboelectric nanogenerators (TENGs), it was demonstrated that these devices could generate peak power in the order of 50 mW m−2, using vibration frequencies of 5 Hz.18
Devices constructed under the principle of reverse electrowetting have the potential to overcome some of these limitations. Electrowetting refers to the mechanism through which an electrolyte-containing droplet can be expanded on a charge surface, the degree of spreading regulated by adjusting the applied voltage. On the other hand, reverse electrowetting involves mechanistically varying the degree of wetting, causing a variation in the system’s electrical capacitance. To accomplish this, liquid droplets can be placed between two electrodes under constant bias, where each droplet is either non- or partially wetting. By squeezing the droplets between the plates, the droplet is forced to wet the electrodes, decreasing the contact angle and increasing the contact area with the electrodes. Charge must then flow between electrodes to respond to the new value of capacitance.
The use of electrolytic droplets utilises the capacitance of the electrical double layers at the electrode/electrolyte interface. The choice of solution – the ionic strength and dielectric properties of the solvent – will affect the interfacial capacitance. Conversely, using dielectric droplets would spread the voltage drop across the gap between the electrodes, producing a capacitance orders of magnitude smaller.
An alternative approach is to manipulate with a liquid-metal droplet. Krupenkin et al.19 employed squeezing of a mercury or Galinstan droplet under variable pressure between two flat electrodes, causing the spreading of the droplet over thin insulating films that cover each electrode. This increases the capacitance, which otherwise is just inversely proportional to the thickness of the gap between the electrodes. This variable pressure was applied by either oscillating or shearing the plates across a droplet array,19 leading to greater power densities of 1 kW m−2. Liquid-metal droplets have also been previously considered by both Boland et al.20 and Krupenkin et al.,21 where the metallic droplets slide within a microchannel between separated electrodes. Notably, the droplets used were limited in size between 1 μL![[thin space (1/6-em)]](https://www.rsc.org/images/entities/char_2009.gif) 22 and 1 nL,21 where the channel size was of similar height and width as the droplet’s diameter. Boland’s device restricted the length of the microchannels imbedding one droplet each to twice the droplet’s diameter, so that each droplet was able to move small distances upon shaking. A 2D array of such channels was able to produce peak powers up to 0.3 W m−2 when oscillating at 60 Hz; the result was also dependent on the direction of oscillation with respect to gravity. Krupenkin’s device instead utilised a long channel with many droplets in it. To make this system work, one must ensure that the droplets never fuse, which is possible when the droplets do not wet the walls.
22 and 1 nL,21 where the channel size was of similar height and width as the droplet’s diameter. Boland’s device restricted the length of the microchannels imbedding one droplet each to twice the droplet’s diameter, so that each droplet was able to move small distances upon shaking. A 2D array of such channels was able to produce peak powers up to 0.3 W m−2 when oscillating at 60 Hz; the result was also dependent on the direction of oscillation with respect to gravity. Krupenkin’s device instead utilised a long channel with many droplets in it. To make this system work, one must ensure that the droplets never fuse, which is possible when the droplets do not wet the walls.
Rather than flat electrode plates, harvesters utilising both electrolytic solution and porous electrodes have been theoretically considered by Kolomeisky and Kornyshev,23 followed up by ref. 13. Here, the surface area of the electrode is increased by multiple orders of magnitude by considering many pores with micron to submicron radius, longer than they are wide. This is achieved by selecting a solvophobic electrode, by careful material choice, or simply utilising the Cassie–Baxter condition applicable for sufficiently small pores.24 This causes the ionically conducting liquid to go outside the pores when no external pressure is applied. When external pressure is applied, the liquids will enter the pore space, generating a great change in capacitance that is consecutively translated into the generated current. This, however, has not been experimentally confirmed yet.
Both the Krupenkin19 and Kolomeisky and Kornyshev23 scenarios, more the latter than the former, could suffer from contact-angle hysteresis. If the liquid is unable to return to the original position upon releasing the external pressure, the magnitude of the capacitance change in each cycle would decrease, decreasing the power output. For a porous system, this issue becomes specifically challenging, though it can in principle be mitigated by engineering, through generation of the gas pressure from the other side of the porous electrode, in order to release the liquid from the pores back to the solution.
These REDs belong to a more general category of capacitive energy harvesters, in which applied mechanical work changes the capacitance of the device, in turn inducing flow of the charge, i.e., generating transient electric currents to re-balance the charge on the electrodes subject to the changed capacitance. Alternating the capacitance periodically results in alternating currents (AC). In the above examples, capacitance was varied by squeezing liquid droplets to change their contact area with electrodes. In more recent examples, capacitance was varied instead by changing the area of submersion of the electrodes in an electrolyte,12 or sliding25 or rotating26 electrodes relative to each other. There are also other ionotronic harvesters, which utilise different types of energy, such as osmotic power – the so-called blue energy. Unlike the capacitive energy harvesters discussed above, those devices most commonly rely on membrane-based technologies, such as reverse electrodialysis or pressure-retarded osmosis. There, the osmosis of either ions or water molecules across membranes is used to create either transient electrical currents or a flow of water that will push a turbine.27
In this article, we present and analyse two different designs of double-layer capacitive-based REDs. These are designated to fit into a shoe sole and produce alternating electrical current from walking or running, but may also be scaled-up and used to generate electrical power from external pressure fluctuations utilised by larger nonwearable devices. It can also be scaled down for pressure related sensor applications.
Capacitive actuation: basic equations
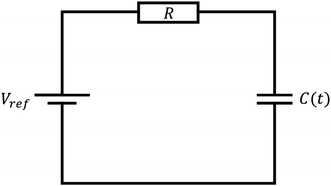
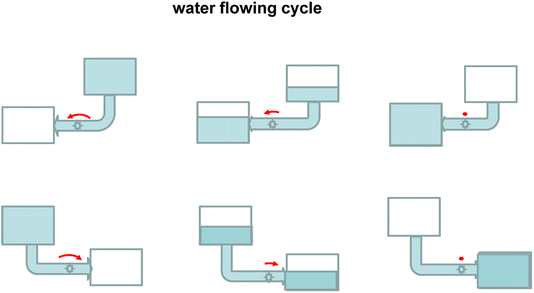
Consider the simplified electrical circuit, depicted in Fig. 1, in which a battery, an electric load and a time-varying capacitor are connected in series. Using external force to periodically vary the capacitance results in an alternating voltage difference between the terminals of the electric load, consequently producing an alternating current across it. To save on battery life, we note that the constant use of the battery is optional, as one can replace it with another pre-charged capacitor characterised by a much larger and constant capacitance, as shown in ref. 26. Such replacement will not affect the basic equations describing the operation of this system.This process has a simple mechanical analogy, shown in Fig. 2. The Kirchhoff equation governing the circuit dynamics can be written as:
 | (1) |
 | (2) |
 | (3) |
Consequently, the current is given by:
 | (4) |
and, correspondingly, the average power over a period reads as:
 | (5) |
An important point is the optimisation of the power harvested by the device as a function of the load. There are two limiting cases here. They stem from the ratio between the following two timescales: the time of capacitor charging and discharging, RC, and the change in capacitance, ω−1. When RCmax ≪ ω−1, the charging–discharging happens instantaneously, and the current is determined only by the latter timescale and is then independent of the resistance R. In that regime, the power on a load, which is proportional to j2R, should approach zero linearly with decreasing R. On the other hand, when RCmin ≫ ω−1, the charging–discharging of the capacitor is very slow compared to the changes in capacitance, consequently causing the current to die out exponentially with R alongside the power. In between those extreme regimes, there must be a maximum for the power as a function of the resistance, since the power is a continuous function that approaches zero for both extreme regimes of R.
Next, we consider two specific ionotronic capacitive RED designs for achieving a periodic change in C(t).
Results
Flat electrode design
The concept described above can be realised in its simplest form by a design illustrated in Fig. 3.A non-wetting ionic-liquid droplet is trapped between two electrode plates, of which the top one is movable. When external pressure is exerted on the top plate, the droplet is squeezed, and when the pressure is released, the droplet restores back to its original form. When the droplet is squeezed, a liquid film of electrolyte comes into contact with the electrodes. The more it is squeezed, the greater the contact area, which results in the capacitance increase. Note that if the thickness of the film is still large enough such that the double layers at the two electrodes do not overlap, the overall capacitance changes only through the electrode/electrolyte contact area. If the film thickness is smaller than this (we will not encounter this situation), the capacitance also increases as it reaches the limit of the capacitance of the ultra-thin film dielectric capacitor (see supplementary information of ref. 26).
While a full dynamic analysis of an ionic-liquid droplet squeezed between two charged plates is quite cumbersome,28 it may be avoided within the framework of an adiabatic approximation assuming that changes in the droplet’s shape happen much faster than the changes in periodic external pressure. For simplicity, a cuboid droplet is considered, where the small correction on the squeezing behaviour is accounted for in Appendix A. Within this approximation, the shape of the droplet is given by the system’s minimum of free energy at each time moment. Neglecting the small contribution to the capillary pressure due to the curvature of the liquid in the menisci at the liquid–air interface, the free energy of the system can be approximated as
 | (6) |
This expression includes various contributions from the surface tensions, electrostatics, and the work done by the external pressure. The first four terms here are due to four different surface tensions: (i) the electrode/droplet interfaces, γ1; (ii) the electrode/air interface, γ2 (for a non-wetting droplet, γ1 > γ2); (iii) the droplet/solid interface between the front and back walls, γ3; and (iv) the liquid/air interface on the left and right sides of the droplet, ![[small gamma, Greek, tilde]](https://www.rsc.org/images/entities/i_char_e0dd.gif) . p is the normal pressure exerted onto the top electrode. Note that if the liquid spreads so widely that it touches the left and right-side walls, we do not need to worry about the change in the side surface tensions, as the liquid will experience hard-wall repulsion, which we will introduce into the theory separately. Cs in the electrostatic term is the capacitance of the electrical double layers per unit surface area, assumed to be identical for both electrodes and independent of voltage between capacitor plates. The liquid was considered to be practically incompressible for the pressures applied here, which are much smaller than the bulk moduli of ionic liquids that are of the order of GPa.29 Thus, the volume of the droplet, Ω, is conserved and calculated as
. p is the normal pressure exerted onto the top electrode. Note that if the liquid spreads so widely that it touches the left and right-side walls, we do not need to worry about the change in the side surface tensions, as the liquid will experience hard-wall repulsion, which we will introduce into the theory separately. Cs in the electrostatic term is the capacitance of the electrical double layers per unit surface area, assumed to be identical for both electrodes and independent of voltage between capacitor plates. The liquid was considered to be practically incompressible for the pressures applied here, which are much smaller than the bulk moduli of ionic liquids that are of the order of GPa.29 Thus, the volume of the droplet, Ω, is conserved and calculated as
 | (7) |
The external pressure p(t) can be modulated as:
 | (8) |
varying between 0 and the maximum gauge pressure, p0, at a rate depending on the frequency ω of walk/run. The lower end of the external pressure includes the consideration of a spring-based mechanism that counteracts the electrode’s weight. Notably, the liquid will not encounter the walls of the channel until a critical pressure, p*, is reached:
 | (9) |
By substitution of eqn (8) and (7) into (6), the minimum of the free energy with respect to the width between the plates, d, can be found, where the equilibrium contact length,  , is given by
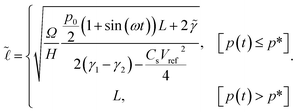 | (10) |
 to go above L. For the details on how incompressibility was modelled and included into the free energy, please refer to Appendix B.
There are two critical conditions for this system to operate. First, the droplet should restore its shape after spreading, which occurs only under the condition that its free energy decreases with a decrease in the droplet/electrode contact area. The free energy of an ionic-liquid droplet trapped between two electrode plates, given by eqn (6), shows that this condition is satisfied if the surface tension at the electrode/droplet interface (γ1) is larger than the surface tension at the electrode/air interface (γ2). This is true for non-wetting droplets with wetting angles greater than 90°. Thus, the wetting angle must be larger than 90° in order for the droplet to restore its shape after spreading. This condition greatly limits the possibilities for the materials one can use to realise such a design experimentally. Going into the specific details of possible materials is critical for the practicality of the design and is often overlooked in many papers presenting such designs. We chose to use TiO2 electrodes and a P13TFSI ionic liquid doped with 60% Li+ ions to get a contact angle of θw =131.18°.30 The corresponding values for the surface tension of such a doped ionic liquid were not measured, however we can approximate that these will not be very different from those measured for a pure ionic liquid.31 Due to the small volume of each droplet (not larger than ∼1 mm3), multiple channels can be considered, each containing a single droplet. Additionally, for a cuboid approximation to be valid, the plates distance should not go higher than some critical value in which the roundness of the droplet becomes significant. We chose the maximum separation between the plates to never exceed 0.75 of the original diameter of the unperturbed droplet. This can be achieved by adding a latch to the system. The value of the minimum length of spreading is determined by the values of Vref, ![[small gamma, Greek, tilde]](https://www.rsc.org/images/entities/i_char_e0dd.gif) , and the contact angle of the fluid on the electrode, as described in eqn (10). Notably, this severely restricts the voltage window one can apply on the droplet for the system to function.
, and the contact angle of the fluid on the electrode, as described in eqn (10). Notably, this severely restricts the voltage window one can apply on the droplet for the system to function.
Looking at eqn (10), one may ask the question whether it is beneficial to have an external pressure with an amplitude p0 much larger than p*, such as in the case of human weight, or whether it is better to have the magnitude of the external pressure equal to that critical value, i.e., p0 = p*. We investigate this question below.
The capacitance as a function of time is shown in Fig. 4 for different operation frequencies, and is calculated based on the ratio of droplet spreading, and maximum possible capacitance across the electrode, Cmax, as
 | (11) |
For an ionic-liquid setup with TiO2 electrodes, a conservative estimate for double-layer capacitance density was made such that  per channel, and the pressure exerted by a human on the shoe as ∼105 Pa.
The steady-state power profile as a function of the electric load is presented in Fig. 5, where different gauge pressures and stride frequencies are considered. This was computed according to eqn (4) (see Appendix C for details). It can be seen that an optimal power of 0.08 mW can be harvested from a single channel in the case of optimal load R = 25![[thin space (1/6-em)]](https://www.rsc.org/images/entities/char_2009.gif) 000 Ω. Creating some 50-channel system with 1 mm3 droplets would therefore produce an optimal power of 4 mW at an optimal load R = 500 Ω while still fitting within the sole of a shoe. Additionally, the currents for two different gauge pressures and two different frequencies are considered in Fig. 6. The optimal load varies for different frequencies and pressures, as seen in Fig. 5, and so different values of the load are considered in each profile, chosen about the optimal load.
000 Ω. Creating some 50-channel system with 1 mm3 droplets would therefore produce an optimal power of 4 mW at an optimal load R = 500 Ω while still fitting within the sole of a shoe. Additionally, the currents for two different gauge pressures and two different frequencies are considered in Fig. 6. The optimal load varies for different frequencies and pressures, as seen in Fig. 5, and so different values of the load are considered in each profile, chosen about the optimal load.
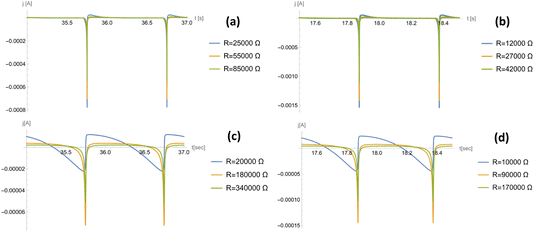 | ||
Fig. 6 Temporal profile of the electric current for a flat electrode design. Curves are plotted for two gauge pressures and two stride frequencies, each at 3 different loads. For a gauge pressure of p0 = 105 Pa, the frequencies used are (a) ω = 2π s−1 and (b) ω = 4π s−1; for a gauge pressure of p0 = p*, the frequencies used are (c) ω = 2π s−1 and (d) ω = 4π s−1. The loads were chosen based on the load at optimal power shown in Fig. 5, where two additional loads above and below the optimal value were also considered. Parameters: Vref = 1 V, ![[small gamma, Greek, tilde]](https://www.rsc.org/images/entities/i_char_e0dd.gif) = 3.44 × 10⁻² N m−2, γ1 − γ2 = 2.27 × 10⁻² N m−2, Cs = 0.1 F m−2, Ω = 10−9 m3, L = 0.1 m, and H = 10−3 m. = 3.44 × 10⁻² N m−2, γ1 − γ2 = 2.27 × 10⁻² N m−2, Cs = 0.1 F m−2, Ω = 10−9 m3, L = 0.1 m, and H = 10−3 m. | ||
Fig. 6 shows how a gauge pressure much greater than p* leads to a rapid generation of current followed by a large period of inactivity. This highlights a large amount of power being wasted due to the incompressibility of the liquid. However, the power generated from this rapid current generation is several times larger than a system where p0 = p*. This is caused by the average current profile being overall greater, leading to a greater final average power at a lower optimal load.
Note that a similar principle of the electrolytic droplet between two flat electrodes, but in a slightly different design (insulated electrodes, additional hydrophobic layers) has been considered in an experimental work reported in ref. 32. With a single 40 μL droplet they were able to generate currents up to 70 μA. There was, however, no detailed theoretical analysis of the operation of the current generation in that system.
A more complex alternative system was considered by Janssen et al.33 also based on the principle of capacitive actuation. The system they considered was based on a wetting yet spontaneously non spreading droplet between different flat electrodes connected to a time-varying bias voltage. Our system, while simpler, allows for analytical solutions and is useful for elucidating the interplay of pressure variation and the load in the generation of AC current.
Similarly, the formalism that we described here could be applied to a liquid-metal droplet squeezed between two electrodes, each coated with a thin insulating film. The difference is in how the capacitance is formed. When a metallic droplet is squeezed, the potential drop is confined to only be across the insulating areas, delivering a higher capacitance as compared to the case when the droplet is not spread. Indeed, in the latter case the major part of the capacitance will be determined by the gap between the electrodes. Since the system is not electrolytic, one may hope to be able to apply higher voltages (without onset of Faradaic processes) to boost the absolute values of the current. This option is limited, however, by a possible electrical breakdown of the coating layers; these should be thick enough to prevent electron-tunnelling between the electrodes and the liquid-metal droplet. For 10 nm-thick low-polarity insulating layers, the maximal capacitance can be easily several hundred times smaller than for electrolytic droplets. To compensate this, the applied voltage should be made at least 20 times larger.
Porous electrode design
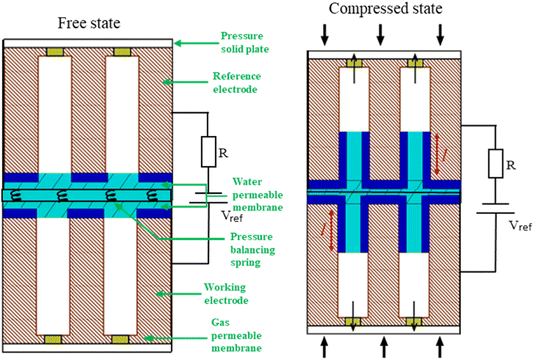
The performance of capacitive REDs is enhanced by the amplitude of the forced variation of capacitance and the absolute value of capacitance at its maximum. One of the measures to increase the capacitance is to create a dramatic increase in the surface area between electrode and electrolyte. Ref. 23 suggested a porous electrode system but did not analyse it for a finite load and optimal power production, nor was it explored in terms of possible materials. Here we consider a slightly different design based on the same idea of pores, as depicted in Fig. 7.The liquid–electrode surface area as a function of time can be described as:
 | (12) |
To obtain L(t) one can use a dynamic model for a flow through pores, such as the Washburn equation:
 | (13) |
 is the Washburn constant, k is the slip length and η is the dynamic viscosity. Usually rp > 4k, so that
  . The total pressure p(t) has several contributions:
| p(t) = pext(t) + pc + ph.s. + pe.w., | (14) |
namely the time-varying external, capillary, hydrostatic, and electrowetting pressures, respectively. Here we neglect the last two contributions. The hydrostatic pressure is neglected due to short length pores (∼mm), and the electrowetting pressure was neglected for simplicity in the first approximation, as it can always be taken into account as an added effective surface tension.23
In order for the liquid to leave the pores after the external pressure is released, assuming the pore walls are perfectly smooth to avoid pinning, we must have pc = −p0, where p0 is the amplitude of periodic external pressure and pc is the capillary pressure given by:
 | (15) |
A spring-based mechanism, shown in Fig. 7, enforces the condition of p0 = pc. The identical springs have a rest length of  . The use of this spring complex takes away the excessive pressure exerted on the system and ensures all of the liquid exits from the pore when the external press is released.
Under this condition, the solution of eqn (13) can be given by:23
 | (16) |
The capacitance as a function of time,
 | (17) |
is shown in Fig. 8 for different operating frequencies and pore radii. The current was calculated using eqn (3) (for details see Appendix C) and was plotted in Fig. 9 as a function of time for different loads and operating frequencies. The average power was calculated using eqn (12) and was plotted in Fig. 10 and 11 as a function of load for different voltages and operating frequencies.
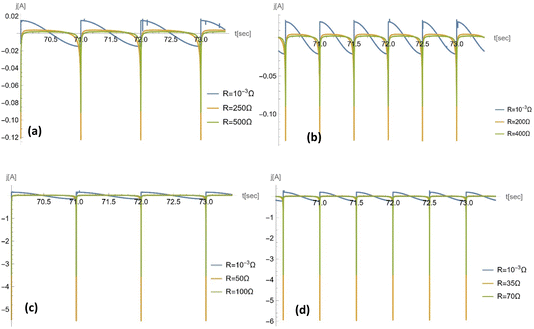 | ||
Fig. 9 Temporal profile of the electrical current for a porous electrode. For a pore size of rp = 10−5 m, the frequency used is (a) ω = 2π s−1 and (b) ω = 4π s−1; for a pore size of rp = 10−7 m, the frequency used is (c) ω = 2π s−1 and (d) ω = 4π s−1. For each plot, 3 different loads were chosen on the basis of: (1) near-zero value, which shows a temporal profile consistent with the literature with consideration of no/negligible load;23 (2) resistance at which the power reaches maximum; and (3) resistance larger than that corresponding to the maximum power. Other parameters used are: Vref = 1.5 V, ![[C with combining macron]](https://www.rsc.org/images/entities/i_char_0043_0304.gif) = 5 × 10⁻² F m−2; ST = 0.002 m2; ε = 0.5; θw = 131.18°; η = 6.3 × 10⁻² Pa s−1; and γ = 2.27 x 10⁻² N m−1. = 5 × 10⁻² F m−2; ST = 0.002 m2; ε = 0.5; θw = 131.18°; η = 6.3 × 10⁻² Pa s−1; and γ = 2.27 x 10⁻² N m−1. | ||
As shown in Fig. 8, the maximum capacitance profile decreases as the frequency of the external pressure increases. This is because the maximum capacitance is inversely proportional to the square root of the frequency. As the pore radius rp decreases from 10−5 m to 10−7 m, the maximum capacitance, inversely proportional to the square root of the pore radius.
To check our results, in Appendix D, we plot the current, j(t), for very small R (=10−3 Ω): the results coincide with those of the previous paper,23 in which the load was neglected.
Fig. 9 shows the temporal profile of the porous electrode system with various changing frequencies of external pressure and pore sizes for different resistances. When the resistance of the system is non-zero, the temporal current profiles become asymmetric. This feature stems from the asymmetric capacitance profile over time, which is a result of the Washburn equation. The Washburn equation is nonlinear in L and as L vanishes,  , i.e., as the liquid is getting pushed out of the pore, the speed at which it is moving to the exit accelerates until it has exited the pore fully and it slows down in the process of filling the pore.
As discussed previously, there is a power maximum as a function of resistance. This argument is further supported by Fig. 10 and 11. Fig. 10 shows how the power profile varies as Vref changes, while Fig. 11 shows how it varies as the frequency changes. All figures exhibit one maximum within the range of 0 to 1 kΩ. While as Vref increases, the value of the maximum power increases, the resistance of the maximum power also increases. On the other hand, the resistance for maximum power decreases as ω increases; as the frequency further increases, the maximum penetration length decreases (see eqn (16)).
Discussion
Here we presented and analysed two different designs of ionotronic RED. The first design, ‘the flat electrode’, was the simplest realisation of how one can vary the surface of the double layer using external pressure. In line with its simple setup, this device only produced menial power, of the order of 1 W m−2 when 50 channels of 1 mm3 droplets are used. A more sophisticated design of a porous electrode, which rests on the same basic idea was analysed and was calculated to produce power from 5 W m−2 when using a multiple-channel flat electrode design to 500 W m−2 with a porous electrode.The porous electrode design has, however, a few challenging bottlenecks, some of them in the regime of material engineering.
(1) The Washburn coefficient, which determines the flow through the pores as a response to external pressure, directly depends on the viscosity. The IL mixture we considered here is highly viscous, and it remains a challenge in materials science to reduce the viscosity while maintaining a contact angle larger than 90°.
(2) The capillary pressure, which determines the maximum external pressure we may use for our device, should be as high as the magnitude of the full external pressure. It remains a challenge to produce an ionic liquid with a large enough surface tension, or, alternatively, the ability to create smooth enough pore walls of the electrodes with small pore radii. (The smaller pore radii have advantages in increasing the overall electrode/electrolyte contact area, as well as causing higher capillary pressure.)
(3) Rearrangement of the liquid will need to be accompanied by instantaneous or minimal delay in the formation of the corresponding double layers, the time for which is limited by ion transport needed for the corresponding recharging of the electrical double layers. It remains a theoretical challenge to include and integrate the ‘transmission time’ for ion rearrangement to take place, and see by how much it affects the possible performance.13
Once again, one of the most challenging issues in the designs we presented, is the pinning effect. One can avoid it using smooth enough surfaces, otherwise hysteresis would emerge. A hysteresis-free capacitive rotor harvester was recently reported.26 While it has the obvious advantage of a hysteresis-free mechanism, the possible power output of the rotor device was of the order of deciwatts, and thus can produce less power than the porous electrode design.
None of the two devices discussed above has yet been built, but the developed theory will navigate its construction. Many things can be done purely experimentally following established generic laws. But there is a lot of room at the bottom: investigation of which electrolytes, ionic liquids or solvent in salt would be the best for building best performing devices – generally the search in progress since long ago.34 This extends to maximising the capacitance, reducing viscosity, facilitating the ionic transport, going from meso-gaps to nano-gaps (to boost the double-layer surface area or compactness of devices), exploring atomistic aspects of minimising nanoscale friction, etc. All these can comprise a broad multidisciplinary area of research, lying at the ‘triple-phase boundary’ of molecular electrochemistry, and chemical and electrical engineering.
Appendix A: Consideration of a droplet with curved meniscus within the Flat Shoe design
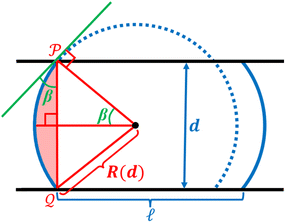
In the main text we considered, for simplicity, a cuboid shape for the droplet. Here we go beyond this assumption and consider a curved meniscus, assumed to have a cylindrical surface of radius R. The meniscus is well defined by the curvature radius, R, and the contact angle, θw, and as we considered a nonwetting droplet, the meniscus curve is convex. The geometric sketch of such a droplet squeezed between the two plates is depicted in Fig. 12.As assumed in the main text, the contact area of the droplet is determined by the free energy minimum. Therefore, in order to take the effect of meniscus curvature into account we introduced it into the free energy expression before minimisation.
Conservation of the droplet’s volume relates the spreading length of the droplet  with the separation between the plates d:
 | (A1) |
 . Substituting eqn (A1) into the free energy expression eqn (6) introduces the curved meniscus consideration.
  | (A2) |
Minimising the free energy expression in terms of d gives a relationship between the gauge pressure p and the equilibrium plate separation:
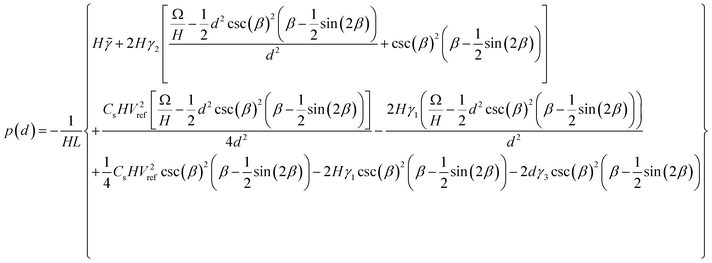 | (A3) |
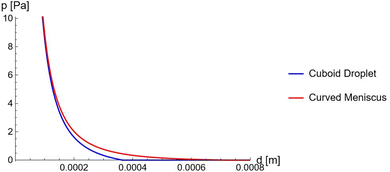 | ||
Fig. 13 The gauge pressure p as a function of the plate separation d. Plotted for a cuboid droplet as considered in the main text (Blue) and for a droplet with a curved meniscus (Red). The material of the front and back walls are considered to be PTFE,35 where the value of the plate separation when no gauge is applied can be seen to increase when the meniscus of the droplet is considered. Parameters: Vref = 1.2 V, ![[small gamma, Greek, tilde]](https://www.rsc.org/images/entities/i_char_e0dd.gif) = 3.44 × 10⁻² N m−2, γ1 − γ2 = 2.27 × 10⁻² N m−2, γ3 = 2.00 × 10⁻² N m−2, θw = 131.18°, Cs = 0.1 Fm−2, Ω = 10−9 m3, L = 0.1 m and H = 10−3 m. = 3.44 × 10⁻² N m−2, γ1 − γ2 = 2.27 × 10⁻² N m−2, γ3 = 2.00 × 10⁻² N m−2, θw = 131.18°, Cs = 0.1 Fm−2, Ω = 10−9 m3, L = 0.1 m and H = 10−3 m. | ||
When the gauge pressure reaches 0, the plate separation distance reaches a maximum. This will define the minimum contact area, which in turn determines the value of the minimum capacitance. This directly affects the variation the system can generate in capacitance and therefore the overall power output. As shown in Fig. (13), when p = 0, the droplet with a curved meniscus has a larger plate separation compared to the cuboid shaped droplet considered in the main text. This shows that a larger capacitive variation can be induced from the curved droplet, as the effect of the meniscus translates to an effectively more nonwetting droplet. Additionally, this would allow a larger range of voltages to be applied on the droplet, which would increase the value of the power by a square law.
Appendix B: modelling incompressibility as a hard-wall repulsion for the flat-electrode case
When external pressure is applied to the flat electrode system, the droplet starts to spread. When the droplet has spread over the entire length of the channel, L, it gets to the point in which a further decrease in the distance between electrodes would cause compression. Since the liquid is practically incompressible, one needs to introduce a short-range repulsive pressure that will kick-in when the contact length of the liquid with the electrode, , reaches, within a molecular distance, to L. To that end, we added a contribution to the free energy of the system, approximated as:
 | (B1) |
Appendix C: the analytical solutions for the capacitor charge
Here we show, for the various structures presented in the paper, the analytical solutions pertaining to Y(t) as defined in eqn (3), from which the charge on the capacitor electrodes may be numerically calculated by an integral.(1) For the flat electrode structure, plugging the time-varying capacitance described in eqn (11) into eqn (3), we have:
 | (C1) |
which can be rewritten as:
 | (C2) |
 , and
, and  .
.
Note that this solution is valid so long that the droplet doesn't spread to the extent it touches the walls, which is satisfied when p < p* as described in eqn (11).
The solution for the integral in eqn (C2) is well-known and is associated with the incomplete elliptic integral functions of the first kind, F(φ,k). The final outcome is:
 | (C3) |
 , and,
  The ‘Floor’ function gives the largest integer equal to- or smaller than- the argument of the function.
(2) For the porous electrode structure, eqn (3) reads as:
 | (C4) |
 . The solution for this integral is well-known, and the final outcome is:
 | (C5) |
Appendix D: the limit of small resistance in the case of porous electrode
In Fig. 14 we plotted the current for negligible load, , for the porous electrode case.
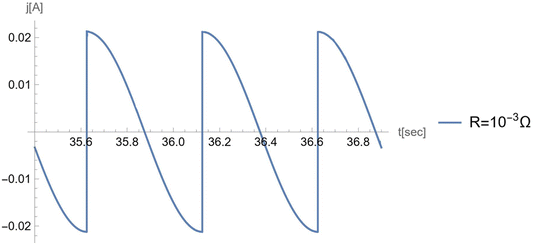 | ||
| Fig. 14 The current profile for the case of negligible load. Parameters used are: Cs = 5 × 10⁻² F m−2; ST = 0.002 m2; ε = 0.5; ϴw = 0.5; Vref = 1.5 V; η = 6.3 × 10⁻² Pa s−1; γ = 2.27 N m−1. | ||
This result coincides with the curve plotted in Kolomeisky–Kornyshev20 in which the case of negligible load was considered.
Conflicts of interest
The authors have no conflicts of interest.Funding
YC and ZN acknowledge the support of the Imperial College Faculty of Natural Sciences Dean's Fund for an award supporting their participation in the Faraday Discussion.Acknowledgements
The authors are thankful to Prof. Tom Welton and Mr Aidan Chapman for useful discussions. We also use this chance to thank Prof. Anatoly Kolomeisky, Prof. Fernando Bresme and Dr Zac Goodwin for previous joint work in this area.References
- S. Banerjee and A. Tyagi, Functional Materials, Elsevier, 2011 Search PubMed.
- A. Tiwari and L. Uzun, Advanced functional materials, John Wiley & Sons, 2015 Search PubMed.
- M. Shahinpoor, Fundamentals of smart materials, Royal Society of Chemistry, 2020 Search PubMed.
- K. Oguro, Bending of an ion-conducting polymer film-electrode composite by an electric stimulus at low voltage, J. Micromach. Soc., 1992, 5, 27–30 Search PubMed.
- M. Shahinpoor, et al., Ionic polymer-metal composites (IPMCs) as biomimetic sensors, actuators and artificial muscles-a review, Smart Mater. Struct., 1998, 7(6), R15 CrossRef CAS.
- Y. Bar-Cohen and Q. Zhang, Electroactive polymer actuators and sensors, MRS Bull., 2008, 33, 173–181 CrossRef CAS.
- P. Pillatsch, E. Yeatman and A. Holmes, A scalable piezoelectric impulse-excited energy harvester for human body excitation, Smart Mater. Struct., 2012, 21(11), 115018 CrossRef.
- M. Pozzi and M. Zhu, Plucked piezoelectric bimorphs for knee-joint energy harvesting: modelling and experimental validation, Smart Mater. Struct., 2011, 20(5), 055007 CrossRef.
- C. Wu, et al., Triboelectric nanogenerator: a foundation of the energy for the new era, Adv. Energy Mater., 2019, 9(1), 1802906 CrossRef.
- S. Wang, L. Lin and Z. L. Wang, Nanoscale triboelectric-effect-enabled energy conversion for sustainably powering portable electronics, Nano Lett., 2012, 12(12), 6339–6346 CrossRef CAS PubMed.
- T.-H. Hsu, J. Taylor and T. Krupenkin, Energy harvesting from aperiodic low-frequency motion using reverse electrowetting, Faraday Discuss., 2017, 199, 377–392 RSC.
- T. G. Morrissey, et al., Mechanical-to-electrical energy conversion with variable electric double layers, Energy Technol., 2019, 7(4), 1801007 CrossRef.
- A. A. Kornyshev, R. M. Twidale and A. B. Kolomeisky, Current-generating double-layer shoe with a porous sole: ion transport matters, J. Phys. Chem. C, 2017, 121(14), 7584–7595 CrossRef CAS.
- J. Zhao and Z. You, A shoe-embedded piezoelectric energy harvester for wearable sensors, Sensors, 2014, 14(7), 12497–12510 CrossRef CAS PubMed.
- A. Diaz and R. Felix-Navarro, A semi-quantitative tribo-electric series for polymeric materials: the influence of chemical structure and properties, J. Electrost., 2004, 62(4), 277–290 CrossRef CAS.
- Z. L. Wang, Triboelectric nanogenerators as new energy technology for self-powered systems and as active mechanical and chemical sensors, ACS Nano, 2013, 7(11), 9533–9557 CrossRef CAS PubMed.
- X. Pu, et al., Efficient charging of Li-ion batteries with pulsed output current of triboelectric nanogenerators, Adv. Sci., 2016, 3(1), 1500255 CrossRef PubMed.
- Z. L. Wang, T. Jiang and L. Xu, Toward the blue energy dream by triboelectric nanogenerator networks, Nano Energy, 2017, 39, 9–23 CrossRef CAS.
- T. Krupenkin and J. A. Taylor, Reverse electrowetting as a new approach to high-power energy harvesting, Nat. Commun., 2011, 2(1), 448 CrossRef PubMed.
- J. Boland, et al., Arrayed liquid rotor electret power generator systems. in 18th IEEE International Conference on Micro Electro Mechanical Systems, IEEE, 2005 Search PubMed.
- T. N. Krupenkin, Method and apparatus for energy harvesting using microfluidics, US Pat., patent no. 8 053 914 B1, 2011 Search PubMed.
- J. S. Boland and Y.-C. Tai, Method and system using liquid dielectric for electrostatic power generation, US Pat., patent no. 7 446 450 B2, 2008 Search PubMed.
- A. B. Kolomeisky and A. A. Kornyshev, Current-generating ‘double layer shoe’with a porous sole, J. Phys.: Condens. Matter, 2016, 28(46), 464009 CrossRef PubMed.
- A. Cassie, Contact angles, Discuss. Faraday Soc., 1948, 3, 11–16 RSC.
- X. Huang, L. Lin and Q. Zheng, Theoretical study of superlubric nanogenerators with superb performances, Nano Energy, 2020, 70, 104494 CrossRef CAS.
- E. Haimov, et al., Theoretical demonstration of a capacitive rotor for generation of alternating current from mechanical motion, Nat. Commun., 2021, 12(1), 3678 CrossRef CAS PubMed.
- X. Tong, et al., Nanofluidic membranes to address the challenges of salinity gradient power harvesting, ACS Nano, 2021, 15(4), 5838–5860 CrossRef CAS PubMed.
- H. Moffatt, H. Guest and H. E. Huppert, Spreading or contraction of viscous drops between plates: single, multiple or annular drops, J. Fluid Mech., 2021, 925, A26 CrossRef CAS.
- L. Fernández-Miguez, et al., Thermophysical characterization of TFSI based ionic liquid and lithium salt mixtures, Multidisciplinary Digital Publishing Institute Proceedings, 2019, vol. 41, p. 57 Search PubMed.
- C. Wang, et al., Revealing the wetting mechanism of Li+-doped ionic liquids on the TiO2 surface, Chem. Eng. Sci., 2023, 265, 118211 CrossRef CAS.
- H. Jin, et al., Physical properties of ionic liquids consisting of the 1-butyl-3-methylimidazolium cation with various anions and the bis (trifluoromethylsulfonyl) imide anion with various cations, J. Phys. Chem. B, 2008, 112(1), 81–92 CrossRef CAS PubMed.
- S.-H. Kwon, et al., An effective energy harvesting method from a natural water motion active transducer, Energy Environ. Sci., 2014, 7(10), 3279–3283 RSC.
- M. Janssen, B. Werkhoven and R. Van Roij, Harvesting vibrational energy with liquid-bridged electrodes: thermodynamics in mechanically and electrically driven RC-circuits, RSC adv., 2016, 6(25), 20485–20491 RSC.
- S. Nemat-Nasser and Y. Wu, Comparative experimental study of ionic polymer–metal composites with different backbone ionomers and in various cation forms, J. Appl. Phys., 2003, 93(9), 5255–5267 CrossRef CAS.
- K. Szymczyk and B. Jańczuk, Ind. Eng. Chem. Res., 2012, 51(43), 14076–14083 CrossRef CAS.
Footnote |
| † YC and ZN, equally contributed to this work. |
| This journal is © The Royal Society of Chemistry 2023 |

