 Open Access Article
Switching on/off molybdenum nitride catalytic activity in ammonia synthesis through modulating metal–support interaction†
Amanda
Sfeir
a,
Camila A.
Teles
a,
Maya
Marinova
b,
Hérve
Vezin
c,
Jean-Philippe
Dacquin
a,
Axel
Löfberg
a,
Said
Laassiri
*d and
Sébastien
Royer
 *a
*a
aUniv. Lille, CNRS, Centrale Lille, Univ. Artois, UMR 8181 – UCCS – Unité de Catalyse et Chimie du Solide, F-59000 Lille, France. E-mail: sebastien.royer@univ-lille.fr
bUniversité de Lille, CNRS, INRA, Centrale Lille, Université Artois, FR 2638 – IMEC – Institut Michel-Eugène Chevreul, 59000 Lille, France
cLaboratoire de Spectroscopie pour Les Interactions La Réactivité et L'Environnement Université de Lille, UMR CNRS 8516-LASIRE, 59000 Lille, France
dChemical & Biochemical Sciences, Green Process Engineering (CBS), Mohamed VI Polytechnic University, UM6P, 43150, Benguerir, Morocco. E-mail: said.laassiri@um6p.ma
First published on 16th January 2023
Abstract
Modulating the interaction between Mo nanoparticles and their support is an elegant approach to finely tune the structural, physico-chemical, redox and electronic properties of the active site. In this work, a series of molybdenum nitride catalysts supported on TiO2, and SBA-15 has been prepared and fully characterized. The results of characterization confirmed the high dispersion of Mo and the formation of small molybdenum nanoparticles in both the 10-Mo-N/SBA-15 and 10-Mo-N/TiO2 catalysts. In this context, we have shown that the catalytic activity of Mo species was strongly impacted by the nature of the catalytic support. Amongst the studied supports, SBA-15 was found to be the most appropriate for Mo dispersion. In comparison, when supported on a reducible oxide (TiO2), Mo species showed poor catalytic activity in both ammonia synthesis and decomposition and were prone to quick deactivation in the ammonia synthesis reaction. Evidence of charge transfer from the reducible support to the active phase, indicative of possible SMSI behaviour, has been observed by XPS and EPR. Differences in the oxidation states, redox behaviours, and electronic properties have been further studied by means of EPR, H2-TPR and H2-TPD.
1 Introduction
Possessing high catalytic activity and selectivity, molybdenum-based materials are considered key catalysts in multiple reactions of high industrial and academic interest including hydrodesulfurization (HDS),1,2 oxidative desulfurization,3,4 CO2 conversion5,6 and ammonia synthesis.7 The versatility of Mo arises from (i) its redox properties as it possesses different oxidation states and (ii) its ability, upon reaction with appropriate precursors, to form a range of carbide,8,9 nitride,10,11 phosphide12,13 and sulphide14,15 materials with different crystalline structures. The high “malleability” of Mo chemical composition allows the careful tuning of its electronic properties, textural and structural properties, surface terminations, site occupancies, defect concentration, and surface properties, which in many cases are determining parameters controlling the catalytic activity and selectivity.Over the years, molybdenum related phases have driven much interest in ammonia synthesis due to the importance of the latter in the production of reactive nitrogen for the fertilizer industry. A wide range of Mo-based catalysts has been studied for ammonia generation including Mo carbides and supported Mo carbides (β-Mo2C, Mo2C/C support, Mo2C/CeO2),16–19 nitrides and supported nitrides (γ-Mo2N, β-Mo2N, δ-MoN, δ-MoNx/ZSM-5),7,16,20 bimetallic Mo nitrides and carbides (Co3Mo3N, Ni2Mo3N, Co3Mo3C), etc.21–24 The application of Mo-based materials was not only restricted to heterogeneous catalytic ammonia synthesis but was also extended to alternative processes such as chemical looping,25 electro-chemistry,26 and photocatalysis.27,28 The interest in molybdenum activity can trace its original roots back to the earlier work of Volpe and Boudart20 and Oyama,29 reporting high catalytic activity of Mo2N for ammonia synthesis, at atmospheric pressure and 400 °C.29 However, throughout the years, the chemical composition, facet surface description, and structure of Mo have been reported to affect the catalytic activity and reaction mechanism. For instance, differences in the catalytic activity of β-Mo2N and δ-MoN were reported with the latter being less active at 400 °C and ambient pressure.30 Furthermore, the degree of Mo nitridation was reported to influence greatly the nature of the rate determining step when metallic and nitride phases are compared.31 These differences have also been reported in the case of molybdenum carbides crystallizing in different structures. The ammonia synthesis activity of β-Mo2C (5.8 mmolNH3 gcat−1 h−1) was found to be higher than that of α-MoC (2.3 mmolNH3 gcat−1 h−1) at 400 °C and 1.0 MPa.32 These results were explained based on changes observed in the adsorption–desorption properties of nitrogen, hydrogen and ammonia, being dependant on the nature of the crystalline structure of molybdenum carbide.32 Considering the structure-sensitive nature of ammonia synthesis using molybdenum, it is of paramount importance to devise new strategies to improve the catalytic activity and stability of Mo by the careful tuning of its local structure and chemical composition.
A further consideration, that is not largely envisioned when designing novel Mo-based systems, is the importance of metal–support interaction in modulating the activity for a given reaction. Such interactions, referred to in the literature as strong metal–support interactions (SMSIs), have been studied extensively, particularly for noble metal-reducible oxides such as titania, ceria or iron oxide.33 The classical SMSI is usually characterized by a migration of support-derived species over the metal surface leading to the encapsulation of the active phase which suppresses its ability to chemisorb small molecules and intermediates.34 SMSI results in fundamental changes in the electronic and geometric nature of the active phase. In ammonia synthesis, where the reaction is governed by nitrogen adsorption and activation on the surface, it is of great interest and importance to comprehend the role of metal–support interaction in engineering the electronic and geometric properties of Mo and as a consequence modulating its catalytic activity. To this end, Mo supported on mesoporous silica (SBA-15) and titanium oxide (TiO2) has been successfully prepared by incipient wetness impregnation (IWI) and studied in the ammonia synthesis reaction and in ammonia decomposition. SBA-15 was studied as a non-reducible support presenting (i) high surface area; (ii) highly ordered and uniform mesopores; and (iii) good thermal stability. On the other hand, TiO2 was studied as a reducible support capable of manifesting the SMSI effect. The effect of the support in altering the catalytic activity of molybdenum was evaluated in the ammonia synthesis reaction and in ammonia decomposition. SBA-15 was found to be the most appropriate support for molybdenum dispersion in both ammonia synthesis and ammonia decomposition. When supported on the reducible oxide TiO2, molybdenum showed poor catalytic activity and was prone to quick deactivation especially in the ammonia synthesis reaction. The effect of the nature of the support on the physicochemical properties and catalytic activity of Mo species was investigated through an extensive characterization study.
2 Experimental section
2.1 Catalyst preparation
2.1.2.1 10-Mo-N/SBA-15. SBA-15 was synthesized by a hydrothermal method, under acidic conditions as described elsewhere.35
The supported materials were synthesized by incipient wetness impregnation (IWI). The calculated weight of the Mo precursor (NH4)6Mo7O24·4H2O (Alfa Aesar) was dissolved in a volume corresponding to the pore volume of the respective support and then mixed. The mixture was aged for 5 days at 25 °C and then calcined at 400 °C (1.5 °C min−1) for 5 h. The obtained Mo–O/SBA-15 underwent a pre-treatment step at 700 °C (5 °C min−1) under a 75 vol% H2/N2 (BOC, 99.98%) (WHSV 18![[thin space (1/6-em)]](https://www.rsc.org/images/entities/char_2009.gif) 000 mL g−1 h−1) gas mixture at a total gas flow of 60 mL min−1 for 2 h in order to obtain the nitride form Mo–N/SBA-15.
000 mL g−1 h−1) gas mixture at a total gas flow of 60 mL min−1 for 2 h in order to obtain the nitride form Mo–N/SBA-15.
2.1.2.2 10-Mo-N/TiO2. Mo–N supported on TiO2 was prepared by incipient wetness impregnation (IWI) as described for the preparation of 10-Mo-N/SBA-15.
2.1.2.3 β-Mo2N preparation. Molybdenum oxide was prepared by the hydrothermal synthesis method. The Mo precursor (ammonium molybdate tetrahydrate, (NH4)6Mo7O24·4H2O, Alfa Aesar) was dissolved in distilled water. The pH was adjusted to 1 by adding dropwise a 2 M solution of HNO3. Thereafter, the solution was subjected to hydrothermal ageing at 180 °C in a Teflon autoclave for 12 h. After recovery by filtration, the solid was washed with water and dried at 60 °C overnight. The sample was then calcined at 300 °C (1.5 °C min−1) for 5 h. α-MoO3 underwent a pre-treatment step at 700 °C (5 °C min−1) under a 75 vol% H2/N2 (BOC, 99.98%) gas mixture at a total gas flow of 60 mL min−1 (WHSV 18
![[thin space (1/6-em)]](https://www.rsc.org/images/entities/char_2009.gif) 000 mL g−1 h−1) for 2 h in order to obtain the nitride form β-Mo2N.
000 mL g−1 h−1) for 2 h in order to obtain the nitride form β-Mo2N.
N.B. Herein, the samples obtained after the calcination step are denoted as X-Mo-O/support. The catalysts obtained after the pre-treatment step are referred to as X-Mo-N/support, and the post-reaction samples are referred to as X-Mo-N-PR/support, where X is the wt% of α-MoO3 (X = 10 wt%).
2.2 Catalyst characterization
![[thin space (1/6-em)]](https://www.rsc.org/images/entities/char_2009.gif) 000 mL g−1 h−1).
000 mL g−1 h−1).
2.3 Catalytic activity
![[thin space (1/6-em)]](https://www.rsc.org/images/entities/char_2009.gif) 000 mL g−1 h−1) . After the activation step, the reactor was cooled down, and the reaction was performed at 400 °C.
000 mL g−1 h−1) . After the activation step, the reactor was cooled down, and the reaction was performed at 400 °C.
The reactor effluent steam was flowed into a 200 mL H2SO4 solution (0.0018 M) and ammonia production was calculated from the decrease in conductivity. The catalytic activity was monitored as a function of reaction time.
3 Results
3.1 Textural and structural properties
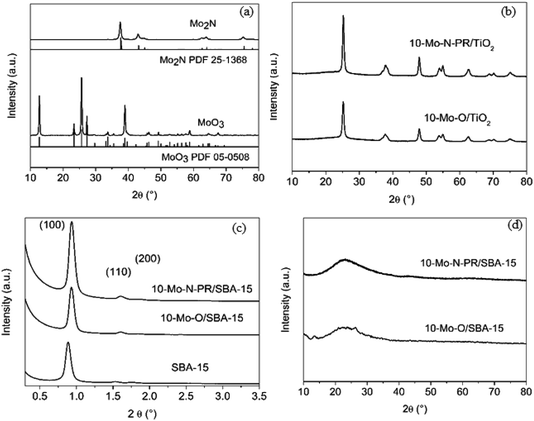
First the transformation of bulk molybdenum oxide α-MoO3 into β-Mo2N after the activation step was verified by PXRD (Fig. 1a). After the pre-treatment step, a single β-Mo2N phase was formed. The diffractogram showed intense PXRD reflections indicating the formation of a well-crystallized material with all the peaks corresponding to the β-Mo2N phase (PDF 25-1368).
PXRD diffractograms of 10-Mo-O/TiO2 and 10-Mo-N-PR/TiO2 are presented in Fig. 1b. For both materials only diffraction related to TiO2 in the anatase phase (PDF 78-2486) is observed. The absence of XRD reflections corresponding to the molybdenum oxide/nitride phase suggests that the crystallite size is small and molybdenum species are well dispersed on TiO2.
SAXS patterns of the as-prepared siliceous support were collected before and after IWI impregnation and are presented in Fig. 1c. The calcined SBA-15 displays the three characteristic well-resolved diffraction peaks that can be associated with the (100), (110), and (200) planes of the P6mm hexagonal symmetry structure, reflecting the well-defined and uniform mesoporous structure of SBA-15. Upon Mo impregnation, the SAXS pattern of 10-Mo-O/SBA-15 showed that the support maintained its pore structure (Fig. 1c). However, an apparent shift of the reflection peaks to higher 2θ angle, from 0.88° to 0.93°, can also be observed, indicating a slight pore contraction upon Mo impregnation. No further changes were observed upon reaction, confirming the stability of the 10-Mo-N/SBA-15 catalyst under reaction conditions. The effectiveness of the dispersion of Mo oxides on the surface of SBA-15 was confirmed by PXRD in the wide-angle domain (Fig. 1d). The PXRD diffractogram was characterised by broad PXRD peaks of amorphous silica, and poorly defined reflection peaks related to the molybdenum oxide phase were observed, reflecting a well dispersed active phase. Surprisingly, upon reaction, no molybdenum nitride reflections were observed.
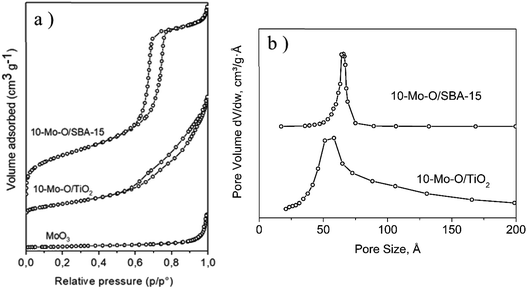 | ||
| Fig. 2 (a) N2 adsorption–desorption isotherms and (b) pore size distribution of 10-Mo-O/SBA-15 and 10-Mo-O/TiO2. | ||
| Sample | α-MoO3a (wt%) | S BET (m2 g−1) | S μ (m2 g−1) | V p (cm3 g−1) | D p (nm) | Mean particle sizef (nm) |
|---|---|---|---|---|---|---|
| a α-MoO3 content in the calcined samples measured by ICP-OES. b BET surface area. c Microporous surface area. d Total pore volume. e BJH mean pore size. f Mean particle size of MoNx estimated from HAADF-STEM analysis of a sample of 25 particles. | ||||||
| α-MoO3 | — | 4 | — | — | — | NA |
| SBA-15 | — | 760 | 131 | 1.1 | 6.5 | NA |
| 10-Mo-O/SBA-15 | 10.8 | 465 | 68 | 0.82 | 6.6 | 1.3 ± 0.3 |
| TiO2 | — | 135 | 3.8 | 0.44 | 12.0 | NA |
| 10-Mo-O/TiO2 | 13.2 | 115 | 1 | 0.27 | 9.7 | 1.7 ± 0.7 |
The unsupported α-MoO3 exhibited a type II isotherm (Fig. 2a) which is characteristic of non-porous materials and possessed a limited accessible surface area of ∼4 m2 g−1. The N2 adsorption/desorption isotherm of 10-Mo-O/SBA-15 exhibited a type IV isotherm with an H1 hysteresis loop which is characteristic of ordered mesoporous materials. Additionally, a narrow pore size distribution of cylindrical pores of ∼6.6 nm was observed. When compared to the parent material SBA-15, a significant decrease in surface area from 760 to ∼465 m2 g−1 was observed, which was accompanied by a parallel decrease in pore volume. This is in accordance with partial filling of the mesopores by the molybdenum oxide phase. However, both SBA-15 and 10-Mo-O/SBA-15 display similar pore size distribution, indicating the formation of discrete molybdenum oxide nanoparticles in the pores of SBA-15. 10-Mo-O/TiO2 exhibited a type IV isotherm with less marked hysteresis. The accessible surface area of 10-Mo-O/TiO2 was found to be ∼115 m2 g−1.
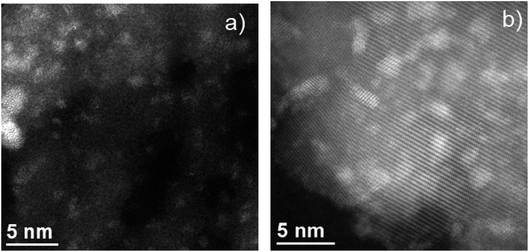
As observed in Fig. S1a,† the characteristic hexagonal array of SBA-15 with the typical 2D periodic hexagonal structure was maintained in 10-Mo-N/SBA-15 following the ammonia synthesis reaction. Furthermore, complementary EDS analysis confirms the high dispersion of molybdenum nitride species within the 2D-channels of SBA-15. In fact, the average particle size of molybdenum nitride was found to be 1.3 ± 0.3 nm (sample of 25 particles). In a similar manner, HAADF-STEM analysis revealed a high dispersion of molybdenum nitride species in the 10-Mo-N/TiO2 catalyst (Fig. S1 (b–d)†). Furthermore, the particle size of molybdenum species was slightly larger than that observed in 10-Mo-N/SBA-15, which was estimated to be 1.7 ± 0.7 nm. In both 10-Mo-N/TiO2 and 10-Mo-N/SBA-15 catalysts, STEM-EDX analysis confirmed the formation of small nanoparticles and the homogeneous distribution of molybdenum species within the support. Unfortunately, due to the small particle size, the low N concentration, and the low N K peak energy it was not possible to detect unambiguously the formation of MoNx species.
3.2 Electronic properties of supported Mo samples: XPS and EPR studies
| Mo peaks | Surface composition | |||||||||||
|---|---|---|---|---|---|---|---|---|---|---|---|---|
| Mo(VI) | Mo(V) | Mo(IV) | Mo–N | Mo(VI) (%) | Mo(V) (%) | Mo(IV) (%) | Mo–N (%) | |||||
| 3d5/2 | 3d3/2 | 3d5/2 | 3d3/2 | 3d5/2 | 3d3/2 | 3d5/2 | 3d3/2 | |||||
| a Catalyst subject to pre-treatment under reaction conditions at 700 °C for 2 h in the environmental XPS chamber before analysis. | ||||||||||||
| Mo-O/TiO2 | 232.91 | 236.05 | 231.99 | 235.13 | — | — | — | — | 70.93 | 29.07 | — | — |
| Mo-N/TiO2a | — | — | 231.00 | 234.14 | 229.7 | 232.84 | 228.49 | 231.63 | — | 0.73 | 21.89 | 77.39 |
| Mo-O/SBA-15 | 232.8 | 235.9 | — | — | — | — | — | — | 100 | — | — | — |
| Mo-N/SBA-15a | 232.26 | 235.40 | — | — | 230.05 | 233.19 | 228.36 | 231.50 | 12.76 | — | 20.84 | 66.40 |
| β-Mo2N | — | — | — | — | 229.50 | 232.65 | 228.78 | 231.92 | — | — | 36.34 | 63.65 |
| α-MoO3 | 233.19 | 236.29 | — | — | — | — | — | — | 100 | — | — | — |
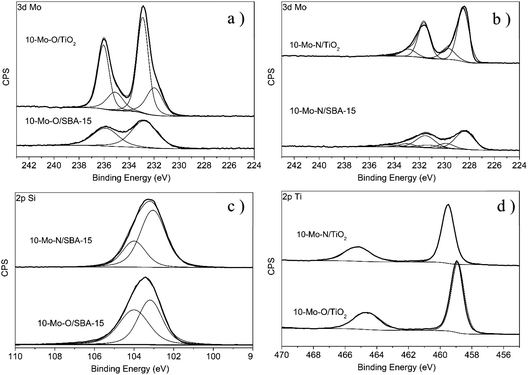
The evolution of the surface chemical composition of the supported Mo catalysts has also been studied and compared to that of the unsupported materials. For instance, 10-Mo-O/SBA-15 showed a similar Mo 3d XPS profile to the unsupported α-MoO3 phase with only two major spectral lines corresponding to the Mo 3d5/2 and Mo 3d3/2 spin–orbit components at 232.8 eV and 235.9 eV, which were attributed to the formal Mo6+ oxidation state, with a small shift when compared to the reference material (Fig. 4). Interestingly, in the case of 10-Mo-O/TiO2, the spectral decomposition of the high-resolution Mo 3d region revealed the presence of both Mo6+ and Mo5+ species.36 The distribution of Mo oxide species was determined to be ∼70.93 at% and ∼29.07 at% for Mo6+ and Mo5+ respectively (Table 2). The stabilization of a large fraction of Mo5+ in 10-Mo-O/TiO2 might be related to the strong interaction between Mo species and TiO2. The isomorphic substitution of Ti4+ species by Mo5+ has been reported in the literature as both species possess very similar ionic radii (Ti4+: 0.605 Å, and Mo5+: 0.61 Å).38
Following the pre-treatment step, a noticeable change in the Mo 3d XPS profile can be observed for both 10-Mo-N/SBA-15 and 10-Mo-N/TiO2 characterized by an important shift to lower binding energies. In 10-Mo-N/SBA-15, the high-resolution Mo 3d XPS profile can be deconvoluted into several peaks. The peaks at 228.36 eV and 231.50 eV are correlated with the 3d5/2 and 3d3/2 states of Mo–N species39 which are the main Mo species (66.40 at%; Table 2), suggesting that the nitridation of Mo species is not complete. Additional peaks at 232.26 eV and 235.40 eV that can be correlated to the presence of Mo6+ and peaks at 230.05 eV and 233.19 eV that can be correlated with Mo4+ have also been observed. In the case of the 10-Mo-N/TiO2 catalyst, the deconvolution of the high-resolution Mo 3d XPS profile revealed a chemical composition dominated by Mo–N (∼77.39 at%) and Mo4+ (∼21.89 at%). In summary, following the activation process, in all catalysts, a large fraction of Mo species were present as molybdenum nitrides (>60 at%).
Further details on the degree of molybdenum nitridation can be extracted from the high-resolution Mo 3p spectra in which N 1s can also be observed (Fig. S2†). Due to the overlapping of N 1s with Mo 3p3/2 peaks, it is difficult to deconvolute these peaks in a very detailed manner. Nevertheless, useful information can still be deduced. When compared to the oxides, the high-resolution Mo 3p XPS profiles of β-Mo2N, 10-Mo-N/SBA-15 and 10-Mo-N/TiO2 were all shifted to lower binding energies which can be associated with the nitridation of Mo species. For 10-Mo-N/SBA-15, peaks related to N 1s and Mo 3p3/2 were significantly overlapped. Nevertheless, in the case of 10-Mo-N/TiO2 an intense and well resolved peak at 398.00 eV, which is attributed in the literature to N 1s in MoN and bulk Mo2N (397.8 eV), was observed.40 The same peak was observed in our unsupported β-Mo2N materials but with less intensity. An additional, very weak in intensity peak only observed in the case of 10-Mo-N/TiO2 at 400.8 eV was also detected. This might be attributed to N–H or adsorbed NH3 as its binding energy is very close to the value reported for adsorbed NH3.41 NH3 species are formed during the activation under a N2![[thin space (1/6-em)]](https://www.rsc.org/images/entities/char_2009.gif) :
:![[thin space (1/6-em)]](https://www.rsc.org/images/entities/char_2009.gif) H2 atmosphere in conditions favourable for ammonia synthesis.
H2 atmosphere in conditions favourable for ammonia synthesis.
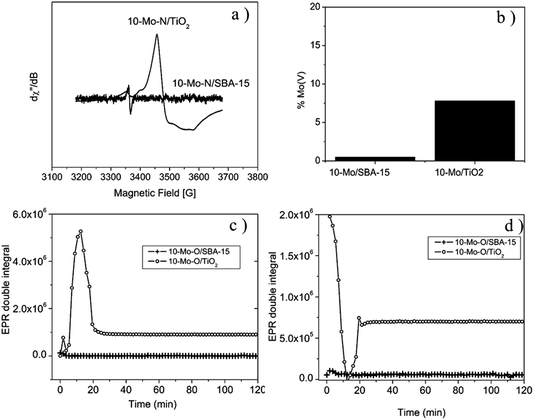
The EPR spectrum recorded for 10-Mo-O/TiO2, prior to the pre-treatment step, displays a weak isotropic signal centred at g = 1.95, indicating the presence of Mo5+ species. The presence of Mo5+ was also confirmed by XPS analysis (Table 2 and Fig. 4a). Additionally, a weak signal is observed, around g = 2, revealing the presence of oxygen vacancies.45 During the activation process, under in situ H2/N2, a sharp increase in Mo5+ content is detected, reaching a maximum after 15 minutes of reaction at 700 °C. Thereafter, the concentration of Mo5+ decreases and stabilizes after a period of 20 minutes (Fig. 5c). The spectrum displayed in Fig. 5a shows the EPR signal recorded at 293 K at the end of the kinetic evolution. The spectrum displays a weak anisotropy of the g factor with gx,y = 1.97 and gz = 1.93. In contrast, the evolution of the oxygen vacancy concentration followed the reverse of that of Mo5+. First, the concentration of oxygen vacancies decreased until reaching a minimum at 15 min of reaction and slightly increased afterwards to remain stable after 20 min. For 10-Mo-O/SBA-15 only a weak signal of Mo5+ and oxygen vacancies is detected. During the pre-treatment step no changes are observed in the concentration of both species. For the 10-Mo-O/SBA-15 catalyst, as EPR measures only Mo(V) content, the XPS results may reveal fast electron exchange between oxygen vacancies and Mo that can contribute to overestimating the Mo(V) content.
Both XPS and EPR spectroscopy proved to be effective in measuring redox changes of Mo-based catalysts during the pre-treatment step. The activation process seems to proceed differently depending on the nature of the support. It seems that the nitridation process of Mo species, when supported on SBA-15, occurs via the direct reduction of Mo species to Mo4+. However, during the nitridation process of Mo species in the case of TiO2, the formation of Mo5+ was detected, hinting that the process might proceed via the formation of an HxMo5+xMo6+1−xO3 species.46
3.3 H2-temperature programmed reduction (H2-TPR)
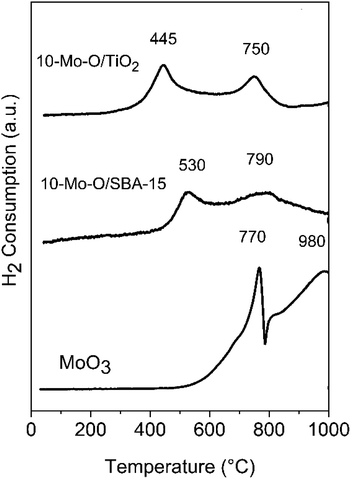
Fig. 6 depicts the results of molybdenum oxide reducibility when supported on SBA-15 and TiO2. The results were compared with the unsupported α-MoO3 phase.The reduction profile of the unsupported α-MoO3 phase was characterized by two main reduction peaks at 770 and 980 °C and a smaller shoulder at around 800 °C. However, the reduction process was not complete at a temperature as high as 980 °C. The profile agrees well with the literature with a first reduction step of α-MoO3 to MoO2, characterized by a sharp reduction peak, followed by the reduction of MoO2 to the metallic form at high temperature.47 The shoulder at around 800 °C was attributed in the literature to the formation of intermediate phases, such as Mo4O11, during the reduction process.47
The reducibility of Mo oxide species was strongly affected by their dispersion in SBA-15 and TiO2. In both 10-Mo-O/SBA-15 and 10-Mo-O/TiO2, the reduction profile shifted to lower temperature. Depending on the nature of the support, the first reduction step started at a temperature as low as 445 °C for 10-Mo-O/TiO2, and a higher reduction temperature of ∼530 °C for 10-Mo-O/SBA-15 was observed. These small differences between SBA-15 and TiO2 might be related to the differences, observed by XPS, in the surface composition of the samples (Table 2). The second reduction step has also shifted to lower temperature with slight differences observed between SBA-15 and TiO2. In summary, the reactivity of molybdenum oxides increased significantly upon their dispersion into high surface area supports, confirming the high reactivity of small nanoparticles towards hydrogen when compared to unsupported molybdenum species.
3.4 H2-temperature programmed desorption (H2-TPD)
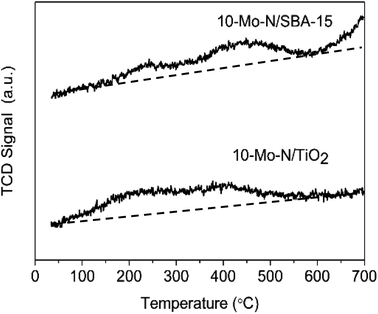
The effect of the support on the adsorption–desorption properties of 10-Mo-N/TiO2 and 10-Mo-N/SBA-15 was studied by means of H2-TPD. The results are shown in Fig. 7 and Table S5.† For 10-Mo-N/TiO2, the desorption profile was characterised by two desorption peaks, the first one appearing from 100 °C to 350 °C and the second desorption peak appearing from 350 °C to 600 °C. In both desorption events, only a small quantity of hydrogen is observed. However, in 10-Mo-N/SBA-15, the quantities of hydrogen desorbed were more pronounced, especially for the second peak of hydrogen desorption. Furthermore, H2-desorption continued at higher temperature (>600 °C) which was not the case in the 10-Mo-N/TiO2 sample. These results indicate a strong effect of the nature of the support in tuning molybdenum hydrogen adsorption–desorption properties. The drop in H2-desorption capacity at high temperature might be indicative of SMSI behaviour affecting the ability of Mo species to activate hydrogen.3.5 Catalytic activity in model reactions: ammonia synthesis and ammonia decomposition
The performance of 10-Mo-N/SBA-15 and 10-Mo-N/TiO2 in ammonia synthesis and the opposite reaction (ammonia decomposition) was studied. The results are summarized in Fig. 8 and Table 3.| Ammonia synthesis reactiona | Ammonia decompositionb | ||||||
|---|---|---|---|---|---|---|---|
| Initial rate (μmol gcatalyst−1 h−1) | Initial rate (μmol gactive phase−1 h−1) | Steady state rate (μmol gcatalyst−1 h−1) | Nc (wt%) | T 10 | T 100 | E a (kJ mol−1) | |
| a Ammonia synthesis under a 60 mL min−1 flow of 75% H2 in N2 (BOC, 99.98%) at 400 °C and atmospheric pressure. b Ammonia decomposition conducted under 15% NH3 in Ar at different temperatures and atmospheric pressure. c Nitrogen content measured by CHNS analysis of post-reaction samples. d ND: not detected. T10: temperature at which 10% NH3 conversion is achieved. T100: temperature at which 100% NH3 conversion is achieved. | |||||||
| β-Mo2N | 76 | 76 | 77 | 5.9 | — | — | — |
| 10-Mo-N/SBA-15 | 84.6 | 1208 | 50.74 | 1.1 | 460 | 585 | 71 |
| 10-Mo-N/TiO2 | NDd | ND | ND | 1.2 | 510 | — | 78 |
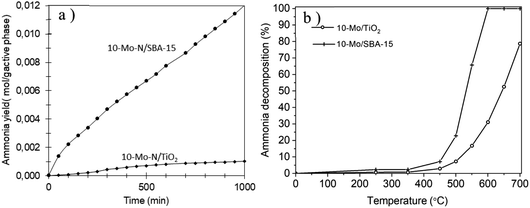
The catalytic activity of the 10-Mo-N/SBA-15 and 10-Mo-N/TiO2 catalysts was studied in ammonia synthesis and compared against the unsupported β-Mo2N (Fig. 8a, Table 3). 10-Mo-N/SBA-15 exhibits catalytic activity that is comparable to that of the reference material despite large differences in Mo loading (10-Mo-N/SBA-15: 84.6 μmol gcat−1 h−1and β-Mo2N: 76 μmol gcat−1 h−1 for the initial rate (30–60 min)). When normalised against the active phase loading, a rate of 1208 μmol gactive phase−1 h−1 is obtained over the 10-Mo-N/SBA-15 catalyst. After a period of stabilisation, the catalyst didn't show any sign of deactivation over time, demonstrating its stability in the H2![[thin space (1/6-em)]](https://www.rsc.org/images/entities/char_2009.gif) :
:![[thin space (1/6-em)]](https://www.rsc.org/images/entities/char_2009.gif) N2 stream. Surprisingly, 10-Mo-N/TiO2 displayed a very poor catalytic activity and deactivated very quickly. The limited catalytic activity of 10-Mo-N/TiO2 despite its enhanced textural and structural properties demonstrated a marked influence of the nature of the support in altering the ability of Mo to catalyse the ammonia synthesis reaction.
N2 stream. Surprisingly, 10-Mo-N/TiO2 displayed a very poor catalytic activity and deactivated very quickly. The limited catalytic activity of 10-Mo-N/TiO2 despite its enhanced textural and structural properties demonstrated a marked influence of the nature of the support in altering the ability of Mo to catalyse the ammonia synthesis reaction.
To confirm whether TiO2 will affect in a similar manner the activity of Mo species in the reverse reaction, the activity of 10-Mo-N/SBA-15 and 10-Mo-N/TiO2 has also been studied in ammonia decomposition. The catalytic activity was measured at temperatures ranging between 50 °C and 700 °C and the results are presented in Fig. 8b and Table 3. Unlike in ammonia synthesis, both catalysts, 10-Mo-N/SBA-15 and 10-Mo-N/TiO2, are active in ammonia decomposition. However, differences in the catalytic activity are observed especially at high temperature. At low temperature, 10% NH3 conversion is achieved at 460 °C on 10-Mo-N/SBA-15 while the same conversion value is achieved at slightly higher temperature (∼510 °C) in the case of 10-Mo-N/TiO2. The activation energy is slightly lower in the case of 10-Mo-N/SBA-15 (71 kJ mol−1) when compared to 10-Mo-N/TiO2 (78 kJ mol−1). At higher temperature, complete conversion of NH3 was achieved at 600 °C on 10-Mo-N/SBA-15, while on the 10-Mo-N/TiO2 catalyst complete conversion wasn't attained even at a temperature as high as 700 °C. In summary, while supporting Mo over titania didn't turn off the catalytic activity in ammonia decomposition, lower conversions are clearly obtained compared to 10-Mo-N/SBA-15.
4 Discussion
The catalytic properties of the supported Mo nitrides in both ammonia synthesis and ammonia decomposition were found to be markedly affected by the nature of the support (TiO2 or SBA-15). Depending on the catalytic reaction, disparities in how the support affects the catalytic activity of Mo species were found. When ammonia synthesis was studied, Mo nitride supported on SBA-15 was found to be active and stable over time. But when supported on TiO2 a very limited catalytic activity was observed and the catalyst deactivated quite rapidly. This indicates that the properties of Mo active species varied with the nature of the support. In ammonia decomposition, the effect of the support was not as “radical” as observed in ammonia synthesis. While 10-Mo-N/SBA-15 was far more active than 10-Mo-N/TiO2, the activity of the latter didn't turn-off completely.In the current study, the active phase, MoNx, was prepared by nitridation under a 75 vol% H2/N2 (BOC, 99.98%) gas mixture at a total gas flow of 60 mL min−1 for 2 h at 700 °C. To investigate the differences between the catalysts, the textural and structural properties have been studied. Both catalysts displayed high accessible surface area (10-Mo-O/SBA-15: 465 m2 g−1 and 10-Mo-O/TiO2: 194 m2 g−1). Furthermore, in both catalysts, no PXRD peaks related to Mo oxide or nitride phases are observed in the wide-angle domain, confirming the high dispersion of the active sites. The formation of small Mo nanoparticles was also confirmed by HAADF-STEM analysis. The particle size of molybdenum species was found to be reasonably similar in 10-Mo-N/SBA-15 (1.3 ± 0.3 nm) and in 10-Mo-N/TiO2 (1.7 ± 0.7 nm). Thus, in both catalysts, after the activation step, small size nanoparticles were formed. Hence the effect of particle size in influencing the catalytic activity can be considered minimal.
The influence of the support on the surface composition was investigated by means of XPS spectroscopy and compared against a reference material. Before the activation step, a difference in Mo species detected by XPS was already observed. In both α-MoO3 and Mo-O/SBA-15, the predominant Mo species was Mo6+ (Table 2, Fig. 4). However, ∼29.07 at% of Mo species in 10-Mo-O/TiO2 was found to be composed of Mo5+ with possible substitution of Ti4+ species by Mo5+.38 Furthermore, in 10-Mo-O/TiO2, the binding energies of Ti 2p3/2 and Ti 2p1/2 were found at 458.89 and 464.61 eV, which are slightly higher when compared with values reported in the literature which further confirms the strong interaction of Mo species with titanium species.42,43 Upon nitridation, a range of oxidation states have been detected. In both catalysts, a high proportion of Mo species were found to be in the nitride form (>60 at%). However, after the activation step, only Mo4+ species and MoNx species are detected in 10-Mo-N/TiO2 while in 10-Mo-N/SBA-15, in addition to Mo4+ species and MoNx a fraction of Mo6+ was still present in the catalyst after the activation step, indicating an incomplete nitridation process. Despite these differences, the percentage of Mo nitrides in both systems seems to be rather close (10-Mo-N/TiO2: 77.39 at% and 10-Mo-N/SBA-15: 66.40 at%). The degree of Mo species nitridation was also observed from the high-resolution Mo 3p spectra in which N 1s can also be observed. Only in the case of 10-Mo-N/TiO2 an intense and well resolved peak at 398.00 eV, which is attributed in the literature to N 1s in bulk MoN and Mo2N (397.8 eV), is observed which may reflect a different Mo/N ratio in the catalyst. An additional, very weak in intensity peak only observed in the case of 10-Mo-N/TiO2 at 400.8 eV is also detected which was attributed to N–H or adsorbed NH3.
To gain insight in the nitridation process of supported Mo oxide species, EPR and H2-TPR have been conducted. When compared to the α-MoO3 phase, the reduction process started earlier in the supported catalysts with the first reduction step starting at a temperature as low as 445 °C for 10-Mo-O/TiO2 and a slightly higher reduction temperature of ∼530 °C for 10-Mo-O/SBA-15. These differences might be related to the difference in Mo oxide species present on the surface as evidenced by XPS. Furthermore, the activation process was studied by EPR under a 75 vol% H2/N2 (BOC, 99.98%) gas mixture mimicking the activation step. Fundamental differences were observed between the 10-Mo-O/SBA-15 and 10-Mo-O/TiO2 materials. In the case of Mo supported on TiO2, the nitridation/reduction process occurs first via the formation of Mo5+ species as detected by EPR which reached a maximum concentration after 12 min reaction before the concentration started decreasing. Although only a very small fraction is detected by XPS, EPR shows that a fraction of Mo5+ (7.8%) is still present in the 10-Mo-O/TiO2 catalyst directly after the activation step. The fast formation of Mo5+ might be indicative of a multistep reduction process with first intercalation of hydrogen into α-MoO3 to form first hydrogen molybdenum bronzes HxMo5+xMo6+1−xO3.46 Hydrogen molybdenum bronzes are metastable phases that will decompose eventually to form MoO2 and water.48 In contrast, no Mo5+ was detected when Mo species were supported on SBA-15, indicating that the process is rather dominated by direct reduction of Mo6+ to Mo4+. These differences might be related to different mechanisms by which Mo species are reduced/nitrided. In the literature, different mechanisms have been proposed including the formation of either molybdenum bronze (HxMo5+xMo6+1−xO3) and/or MoO2 and Mo metallic intermediates before nitridation. Depending on the nitridation conditions (i.e. gas composition, space velocity and/or heating rate), the nitridation mechanism can be altered leading to the formation of either cubic γ-Mo2N or tetragonal β-Mo2N.49,50 The formation of β-Mo2N has been reported to follow a non-topotactic route via a multiple step reduction (MoO3 → MoO2 → Mo → MoNx).51,52 While the formation of γ-Mo2N has been reported to proceed through a topotactic route with the formation of hydrogen molybdenum bronze as an intermediate species before nitridation.53 It's clear from our investigation that the mechanism of reduction/nitridation is strongly affected by the degree of interaction between Mo species and the support species. However, due to the formation of small nanoparticles in both SBA-15 and TiO2, and the similar chemical composition of β-Mo2N and γ-Mo2N, it was rather difficult to unambiguously determine the nature of MoNx species based on XRD and XPS results. As the activity of Mo2N species in many catalytic reactions was found to vary depending on the crystallographic phase, it's tempting to explain the differences in the catalytic activity of 10-Mo-N/SBA-15 and 10-Mo-N/TiO2 in ammonia synthesis by the formation of different Mo2N allotropic forms. However, it is worth mentioning that no large differences in the catalytic activity have been found between bulk β-Mo2N and γ-Mo2N in ammonia synthesis and only the δ-MoN nitride phase was found to be poorly active in ammonia synthesis.30 As such the identification of the catalytically active site and the origin of deactivation in Mo species supported on TiO2 remains very challenging. In the literature, the performance of catalysts in the ammonia synthesis reaction has been correlated to nitrogen binding energy with the ideal surface displaying intermediate nitrogen binding energies. The adsorption properties of metal nitrides were found to be sensitive to chemical composition (surface vs. bulk), Mo oxidation states, Moδ+/N ratio, and nitrogen-deficient site density.52 To some extent, differences in H2 adsorption–desorption capacities, at least at high temperature, were observed between 10-Mo-N/SBA-15 and 10-Mo-N/TiO2. The surface composition after the activation step, and the reduction/nitridation process was found to be different depending on the nature of the support. Thus, the differences observed in the catalytic activity might be related to the differences observed in the surface composition and changes in the adsorption of ammonia synthesis reactants.
5 Conclusion
In the current study supported Mo nitride species on SBA-15 and TiO2 were prepared by nitridation under a 75 vol% H2/N2 (BOC, 99.98%) gas mixture at a total gas flow of 60 mL min−1 for 2 h at 700 °C. The results of characterisation demonstrate the formation of small molybdenum nanoparticles in both 10-Mo-N/SBA-15 and 10-Mo-N/TiO2 catalysts. Although both samples exhibited ameliorated structural properties when compared to the bulk material, β-Mo2N, only 10-Mo-N/SBA-15 was found to be active in ammonia synthesis (1208 μmol gactive phase−1 h−1) while 10-Mo-N/TiO2 only displayed a poor catalytic activity before completely deactivating over time. The catalysts were also studied for ammonia decomposition where 10-Mo-N/SBA-15 was found to be more active than 10-Mo-N/TiO2. XPS analysis showed a strong interaction between Mo species and the TiO2 support leading to differences in the Mo species reduction/nitridation process. EPR spectroscopy proved to be effective in determining the nitridation mechanism of Mo species. In the case of Mo supported on TiO2, EPR showed that the reduction/nitridation process occurred via the formation of Mo5+ species which was not the case in Mo supported on SBA-15, suggesting the formation of different Mo nitride species. Upon nitridation, the distribution of Mo oxidation states was found to be different depending on the nature of the support. Furthermore, a weak XPS signal related to adsorbed NHx species was detected in the 10-Mo-N/TiO2 catalyst. It is also worth noting that the 10-Mo-N/SBA-15 hydrogen chemisorption capacity and desorption (during TPD) were superior to those of the 10-Mo-N/TiO2 catalyst. The Mo species deactivation in ammonia synthesis when supported on TiO2 probably originates from the strong interaction between Mo species and the support. This phenomenon resulted in the alteration of the Mo nitridation mechanism, leading to a catalyst with different surface composition, and probably different surface terminations, vacancy concentrations, etc. These results demonstrate that the catalytic activity of Mo nitride species can be tuned via modulation of the interaction between the active species and the support.Conflicts of interest
There are no conflicts to declare.Acknowledgements
The authors would like to thank Pardis Simon for XPS facilities and Anne-Marie Blanchenet for TEM facilities. Laassiri wishes to acknowledge the Foundation I-SITE ULNE/France for support through the grant ERC Generator and the program MOGPA. The French national research agency is acknowledged for support via the program Make Our Planet Great Again. Chevreul Institute (FR 2638), Ministère de l’Enseignement Supérieur, de la Recherche et de l’Innovation, Région Hauts de France and FEDER are acknowledged for supporting and funding partially this work.References
- A. N. Varakin, A. V. Mozhaev, A. A. Pimerzin and P. A. Nikulshin, Appl. Catal., B, 2018, 238, 498 CrossRef CAS.
- H. Topsøe and B. S. Clausen, Appl. Catal., 1986, 25, 273 CrossRef.
- M. M. H. Mondol, B. N. Bhadra and S. H. Jhung, Appl. Catal., B, 2021, 288, 119988 CrossRef CAS.
- J. Zou, Y. Lin, S. Wu, Y. Zhong and C. Yang, Adv. Funct. Mater., 2021, 31, 2100442 CrossRef CAS.
- S. Singh, A. Modak, K. K. Pant, A. Sinhamahapatra and P. Biswas, ACS Appl. Nano Mater., 2021, 4, 8644 CrossRef CAS.
- Y. Kuwahara, T. Mihogi, K. Hamahara, K. Kusu, H. Kobayashi and H. Yamashita, Chem. Sci., 2021, 12, 9902 RSC.
- N. Liu, L. Nie, N. Xue, H. Dong, L. Peng, X. Guo and W. Ding, ChemCatChem, 2010, 2, 167 CrossRef CAS.
- N. Gavrilova, M. Myachina, V. Dyakonov, V. Nazarov and V. Skudin, Nanomaterials, 2020, 10, 2053 CrossRef CAS PubMed.
- H. B. Wu, B. Y. Xia, L. Yu, X. Y. Yu and X. W. Lou, Nat. Commun., 2015, 6, 6512 CrossRef CAS PubMed.
- M. Nagae, T. Yoshio, Y. Takemoto and J. Takada, J. Am. Ceram. Soc., 2001, 84, 1175 CrossRef CAS.
- S. Wang, H. Ge, S. Sun, J. Zhang, F. Liu, X. Wen, X. Yu, L. Wang, Y. Zhang, H. Xu, J. C. Neuefeind, Z. Qin, C. Chen, C. Jin, Y. Li, D. He and Y. Zhao, J. Am. Chem. Soc., 2015, 137, 4815 CrossRef CAS PubMed.
- P. Xiao, M. A. Sk, L. Thia, X. Ge, R. J. Lim, J.-Y. Wang, K. H. Lim and X. Wang, Energy Environ. Sci., 2014, 7, 2624 RSC.
- W. Cui, Q. Liu, Z. Xing, A. M. Asiri, K. A. Alamry and X. Sun, Appl. Catal., B, 2015, 164, 144 CrossRef CAS.
- J. Lei, Y. Xie, A. Kutana, K. V. Bets and B. I. Yakobson, J. Am. Chem. Soc., 2022, 144, 7497 CrossRef CAS PubMed.
- S. Park, A. T. Garcia-Esparza, H. Abroshan, B. Abraham, J. Vinson, A. Gallo, D. Nordlund, J. Park, T. R. Kim, L. Vallez, R. Alonso-Mori, D. Sokaras and X. Zheng, Adv. Sci., 2021, 8, 2002768 CrossRef CAS PubMed.
- R. Kojima and K. Aika, Appl. Catal., A, 2001, 219, 141 CrossRef CAS.
- A.-M. Alexander and J. S. Hargreaves, Chem. Soc. Rev., 2010, 39, 4388 RSC.
- B. Y. Fang, C. F. Zhang, Z. L. Qi, C. Y. Li, J. Ni, X. Y. Wang, J. X. Lin, C. T. Au, B. Y. Lin and L. L. Jiang, AIChE J., 2022, 68, e17849 CAS.
- B. Y. Fang, C. F. Zhang, J. H. Li, M. D. Yang, C. Y. Li, J. Ni, X. Y. Wang, J. X. Lin, B. Y. Lin and L. L. Jiang, Chem. Commun., 2022, 58, 7785 RSC.
- L. Volpe and M. Boudart, J. Phys. Chem., 1986, 90, 4874 CrossRef CAS.
- C. J. H. Jacobsen, Chem. Commun., 2000, 1057 RSC.
- I. AlShibane, A. Daisley, J. S. J. Hargreaves, A. L. Hector, S. Laassiri, J. L. Rico and R. I. Smith, ACS Sustainable Chem. Eng., 2017, 5, 9214 CrossRef CAS.
- R. Kojima and K.-i. Aika, Appl. Catal., A, 2001, 218, 121 CrossRef CAS.
- S. Al Sobhi, N. Bion, J. S. J. Hargreaves, A. L. Hector, S. Laassiri, W. Levason, A. W. Lodge, A. R. McFarlane and C. Ritter, Mater. Res. Bull., 2019, 118, 110519 CrossRef CAS.
- S. Yang, T. Zhang, Y. Y. Yang, B. X. Wang, J. Li, Z. T. Gong, Z. Y. Yao, W. G. Du, S. J. Liu and Z. L. Yu, Appl. Catal., B, 2022, 312, 121404 CrossRef CAS.
- L. Li, W. K. Yu, W. B. Gong, H. Wang, C. L. Chiang, Y. P. Lin, J. Zhao, L. B. Zhang, J. M. Lee and G. F. Zou, Appl. Catal., B, 2023, 321, 122038 CrossRef CAS.
- X.-W. Guo, S.-M. Chen, H.-J. Wang, Z.-M. Zhang, H. Lin, L. Song and T.-B. Lu, J. Mater. Chem. A, 2019, 7, 19831 RSC.
- S. Kim, Y. Park, J. Kim, T. P. Pabst and P. J. Chirik, Nat. Synth., 2022, 1, 297 CrossRef.
- S. T. Oyama, Catal. Today, 1992, 15, 179 CrossRef CAS.
- D. McKay, J. S. J. Hargreaves, J. L. Rico, J. L. Rivera and X. L. Sun, J. Solid State Chem., 2008, 181, 325 CrossRef CAS.
- K.-i. Aika and A. Ozaki, J. Catal., 1969, 14, 311 CrossRef CAS.
- B. Fang, M. Yang, C. Zhang, J. Li, C. Li, J. Ni, X. Wang, J. Lin, B. Lin and L. Jiang, Chem. Eng. Sci., 2022, 259, 117834 CrossRef CAS.
- Z. Luo, G. Zhao, H. Pan and W. Sun, Adv. Energy Mater., 2022, 12, 2201395 CrossRef CAS.
- H. Tang, Y. Su, B. Zhang, A. F. Lee, M. A. Isaacs, K. Wilson, L. Li, Y. Ren, J. Huang, M. Haruta, B. Qiao, X. Liu, C. Jin, D. Su, J. Wang and T. Zhang, Sci. Adv., 2017, 3, e1700231 CrossRef PubMed.
- D. Zhao, J. Sun, Q. Li and G. D. Stucky, Chem. Mater., 2000, 12, 275 CrossRef CAS.
- J. Baltrusaitis, B. Mendoza-Sanchez, V. Fernandez, R. Veenstra, N. Dukstiene, A. Roberts and N. Fairley, Appl. Surf. Sci., 2015, 326, 151 CrossRef CAS.
- T. Weber, J. C. Muijsers, J. H. M. C. van Wolput, C. P. J. Verhagen and J. W. Niemantsverdriet, J. Phys. Chem., 1996, 100, 14144 CrossRef CAS.
- S. Esposito, N. Ditaranto, G. Dell'Agli, R. Nasi, P. Rivolo and B. Bonelli, ACS Omega, 2021, 6, 5379 CrossRef CAS PubMed.
- L. Huo, X. Han, L. Zhang, B. Liu, R. Gao, B. Cao, W.-W. Wang, C.-J. Jia, K. Liu, J. Liu and J. Zhang, Appl. Catal., B, 2021, 294, 120254 CrossRef CAS.
- M. Nagai, J. Takada and S. Omi, J. Phys. Chem. B, 1999, 103, 10180 CrossRef CAS.
- R. J. J. Jansen and H. van Bekkum, Carbon, 1995, 33, 1021 CrossRef CAS.
- M. C. Biesinger, L. W. M. Lau, A. R. Gerson and R. S. C. Smart, Appl. Surf. Sci., 2010, 257, 887 CrossRef CAS.
- D. Mittal, W. F. Chen, P. Koshy, H. K. Chen, I. Kabir, Y. Jiang, Z. Y. Liu and C. C. Sorrell, SN Appl. Sci., 2019, 1, 234 CrossRef CAS.
- J. Wang, D. N. Tafen, J. P. Lewis, Z. Hong, A. Manivannan, M. Zhi, M. Li and N. Wu, J. Am. Chem. Soc., 2009, 131, 12290 CrossRef CAS PubMed.
- C. Drouilly, J.-M. Krafft, F. Averseng, S. Casale, D. Bazer-Bachi, C. Chizallet, V. Lecocq, H. Vezin, H. Lauron-Pernot and G. Costentin, J. Phys. Chem. C, 2012, 116, 21297 CrossRef CAS.
- A. Borgschulte, O. Sambalova, R. Delmelle, S. Jenatsch, R. Hany and F. Nüesch, Sci. Rep., 2017, 7, 40761 CrossRef CAS PubMed.
- T. Bhaskar, K. R. Reddy, C. P. Kumar, M. R. V. S. Murthy and K. V. R. Chary, Appl. Catal., A, 2001, 211, 189 CrossRef CAS.
- J. J. Birtill and P. G. Dickens, J. Solid State Chem., 1979, 29, 367 CrossRef CAS.
- J.-G. Choi, R. L. Curl and L. T. Thompson, J. Catal., 1994, 146, 218 CrossRef CAS.
- S. Jujjuri, F. Cárdenas-Lizana and M. A. Keane, J. Mater. Sci., 2014, 49, 5406 CrossRef CAS.
- F. Cárdenas-Lizana, S. Gómez-Quero, N. Perret, L. Kiwi-Minsker and M. A. Keane, Catal. Sci. Technol., 2011, 1, 794 RSC.
- N. Perret, D. Lamey, L. Kiwi-Minsker, F. Cárdenas-Lizana and M. A. Keane, Catal. Sci. Technol., 2019, 9, 1891 RSC.
- F. Cárdenas-Lizana, D. Lamey, L. Kiwi-Minsker and M. A. Keane, J. Mater. Sci., 2018, 53, 6707 CrossRef.
Footnote |
| † Electronic supplementary information (ESI) available. See DOI: https://doi.org/10.1039/d2fd00154c |
| This journal is © The Royal Society of Chemistry 2023 |

