 Open Access Article
 This Open Access Article is licensed under a
 Creative Commons Attribution 3.0 Unported Licence
Methanol synthesis from CO2 and H2 using supported Pd alloy catalysts†
Naomi
Lawes
,
Isla E.
Gow
,
Louise R.
Smith
 ,
Kieran J.
Aggett
,
James S.
Hayward
,
Lara
Kabalan
,
Andrew J.
Logsdail
,
Thomas J. A.
Slater
,
Malcolm
Dearg
,
David J.
Morgan
,
Nicholas F.
Dummer
,
Stuart H.
Taylor
,
Michael
Bowker
,
C. Richard A.
Catlow
and
Graham J.
Hutchings
*
,
Kieran J.
Aggett
,
James S.
Hayward
,
Lara
Kabalan
,
Andrew J.
Logsdail
,
Thomas J. A.
Slater
,
Malcolm
Dearg
,
David J.
Morgan
,
Nicholas F.
Dummer
,
Stuart H.
Taylor
,
Michael
Bowker
,
C. Richard A.
Catlow
and
Graham J.
Hutchings
*
Max Planck-Cardiff Centre on the Fundamentals of Heterogeneous Catalysis FUNCAT, Cardiff Catalysis Institute, School of Chemistry, Cardiff University, Main Building, Park Place, Cardiff, CF10 3AT, UK. E-mail: hutch@cf.ac.uk
First published on 21st June 2022
Abstract
A number of Pd based materials have been synthesised and evaluated as catalysts for the conversion of carbon dioxide and hydrogen to methanol, a useful platform chemical and hydrogen storage molecule. Monometallic Pd catalysts show poor methanol selectivity, but this is improved through the formation of Pd alloys, with both PdZn and PdGa alloys showing greatly enhanced methanol productivity compared with monometallic Pd/Al2O3 and Pd/TiO2 catalysts. Catalyst characterisation shows that the 1![[thin space (1/6-em)]](https://www.rsc.org/images/entities/char_2009.gif) :1 β-PdZn alloy is present in all Zn containing post-reaction samples, including PdZn/Ga2O3, with the Pd2Ga alloy formed for the Pd/Ga2O3 sample. The heat of mixing was calculated for a variety of alloy compositions with high values determined for both PdZn and Pd2Ga alloys, at ca. −0.6 eV per atom and ca. −0.8 eV per atom, respectively. However, ZnO is more readily reduced than Ga2O3, providing a possible explanation for the preferential formation of the PdZn alloy, rather than PdGa, when in the presence of Ga2O3.
:1 β-PdZn alloy is present in all Zn containing post-reaction samples, including PdZn/Ga2O3, with the Pd2Ga alloy formed for the Pd/Ga2O3 sample. The heat of mixing was calculated for a variety of alloy compositions with high values determined for both PdZn and Pd2Ga alloys, at ca. −0.6 eV per atom and ca. −0.8 eV per atom, respectively. However, ZnO is more readily reduced than Ga2O3, providing a possible explanation for the preferential formation of the PdZn alloy, rather than PdGa, when in the presence of Ga2O3.
Introduction
The direct hydrogenation of carbon dioxide to methanol has been the focus of considerable research effort over recent years.1 Not only does this process provide a route for the utilisation of CO2, thus reducing carbon emissions, it also provides a route to the “green” production of methanol.2 CO2 can be captured from the atmosphere or recovered from sources such as power plants prior to release in to the environment, and combined with H2 from a renewable source, such as solar/wind-powered water electrolysis, to provide sustainable methanol synthesis.3| CO2 + 3H2 ⇄ CH3OH + H2O, ΔH298K = −49.5 kJ mol−1 | (1) |
| CO2 + H2 ⇄ CO + H2O, ΔH298K = 41.2 kJ mol−1 | (2) |
| CO + 2H2 ⇄ CH3OH, ΔH298K = −90.6 kJ mol−1 | (3) |
Practically, selective CO2 hydrogenation to methanol is challenging, due to thermodynamic and kinetic limitations, and the possibility of competing reactions occurring, as shown in eqn (1–3). Direct CO2 hydrogenation (eqn (1)) is an exothermic process, with methanol selectivity maximised at low temperature and high pressure.4 The reverse water gas shift reaction (RWGS) can also occur (eqn (2)), leading to the production of CO. Unlike methanol synthesis, RWGS is an endothermic process, favoured at high temperatures. Typically, CO production is not considered to be detrimental to the overall conversion of CO2 to methanol, since CO can also be converted to methanol (eqn (3)), and the presence of CO in the reactant gas stream has been reported to result in improved methanol yield.5 This was attributed to the reduction in the equilibrium yield of CO via RWGS in the presence of increasing CO concentrations. Consequently, the presence of CO in the reactant feed can significantly reduce the amount of water present in the product stream. In addition to methanol and CO, methane can also be produced, although selectivity to this product is typically low (<1%). Methane production can occur directly through methanation,6 or through methanol decomposition on the catalyst surface.7 In an industrial methanol plant, liquid phase products, such as methanol and water, are separated from gaseous products (e.g. CO and CH4) and unreacted feedstock materials (CO2 and H2); and the unreacted CO2, H2 and CO are recycled back into the process. Since methane cannot be converted to methanol through the CO2 to methanol process, the production of methane is considered to be highly unfavourable, due to its accumulation during the recycling of product gas streams, thus increasing production costs through the necessitation of methane removal from the system.
As a result of the thermodynamic limitations and limited equilibrium yields of methanol at higher temperatures, considerable effort has been made to find highly active catalysts at lower temperatures.8 Palladium based catalysts have been widely studied for CO2 hydrogenation to methanol.9 Unlike CO, which strongly adsorbs on precious metal catalysts (e.g. Pd, Pt) through π-back donation, CO2 adsorption is generally weak. Nevertheless, the use of basic promoters was shown to increase methanol production, with trends observed between methanol formation rates and electronegativity of the additive cations.10 The activity and selectivity of Pd catalysts for CO2 hydrogenation can be strongly influenced by the nature of the catalyst support,11 either through the reactivity of reactants or products on the support itself, or via changes in the electronic properties of Pd, induced through metal support interactions.12
Fujitani et al. first identified Pd/Ga2O3 as an active catalyst for CO2 hydrogenation and the methanol yield was found to follow the order of oxide support: Ga2O3 > ZnO > Al2O3 > TiO2 ≈ Cr2O3 > SiO2 ≈ ZrO2.13 A more recent publication attributed the enhanced methanol selectivity achieved over Pd/Ga2O3vs. Pd/SiO2 to the formation of Pd–Ga bimetallic nanoparticles, with reduced RWGS activity compared with Pd nanoparticles.14 The nature of the active site in Pd–Ga catalysts was further investigated by the preparation, characterisation and catalytic evaluation of Pd–Ga/SiO2 catalysts with a range of Pd/Ga molar ratios.15 Here it was shown that the highest rate of methanol production was achieved over a Pd/Ga = 1 catalyst, which was comprised of a Pd2Ga alloy with small amounts of excess gallium oxide on the surface; a further increase in the gallium content was detrimental to catalytic activity due to excess layers of Ga2O3 covering the Pd–Ga surfaces and preventing catalyst reactivity. These findings were corroborated by a recent EXAFS investigation which showed the formation of Pd2Ga nanoparticles covered with a thin layer of Ga2O3 on the SiO2 support.16
Numerous investigations into Pd/ZnO catalysts have identified the β-PdZn alloy as the active phase for methanol synthesis.17–22 Previously, we have shown that the activity of Pd/ZnO catalysts can depend heavily on the reduction conditions, and consequently, the nature of the active site present.23 Whilst Pd/ZnO is an excellent RWGS catalyst, resulting in relatively low methanol productivity, pre-reducing this catalyst at temperatures exceeding 400 °C resulted in the formation of PdZn bimetallic particles with significantly improved methanol productivity. Furthermore, the importance of controlling PdZn particle size was highlighted, with methanol selectivity decreasing from 60% to 20% upon increasing the PdZn particle size from 3 to 7 nm. More recently, Pd/ZnO catalysts prepared by a range of techniques were investigated for CO2 hydrogenation;24 here it was shown that the β-PdZn alloy was formed for all materials, regardless of preparation method. This was attributed to the favourable heat of mixing for the β-PdZn 1:1 alloy, as determined by DFT studies. Interestingly, a linear relationship between methanol selectivity and CO2 conversion was observed for all of the Pd/ZnO catalyst types investigated, since the catalytic performance was determined by the presence of the β-PdZn 1:1 alloy. A recent publication by van Bokhoven and co-workers showed that methanol production over PdZn catalysts could be significantly improved by the co-existence of a ZnO phase.25 In the absence of ZnO, PdZn catalysts were shown to be highly active for RWGS but with low methanol selectivity, with methanol productivities of 30 gMeOH kgcat−1 h−1 and 184 gMeOH kgcat−1 h−1 over PdZn/SiO2 and PdZn/ZnO/SiO2, respectively. The authors attributed the noticeably improved activity to a bifunctional mechanism whereby CO2 activation occurs on the ZnO phase and hydrogen activation occurs over the PdZn alloy, enabling the reduction of adsorbed formate species to methanol.
The aim of the work presented here was to prepare a number of Pd based catalysts for the hydrogenation of CO2 to methanol, in order to further explore the formation of Pd alloys under reaction conditions and the subsequent influence on catalytic activity. Pd and PdZn catalysts supported on a variety of oxide materials (Al2O3, TiO2, Ga2O3 and ZnO) were prepared by chemical vapor impregnation and tested without a pre-reaction reduction step to investigate alloy formation under reaction conditions. In addition to characterisation of the catalysts before and after reaction, calculations into the heat of mixing of alloy components have been performed to gain further understanding regarding Pd alloy formation.
Experimental
Materials
Pd acetylacetonate (Pd(acac)2, 99%), zinc acetylacetonate (Zn(acac)2, 99%), aluminium oxide (Al2O3, nanopowder, <50 nm particle size), gallium oxide (Ga2O3, 99.99+, %), zinc acetate dihydrate (Zn(CH3OH)2·6H2O, ≥98%), ammonium carbonate ((NH4)2CO3, ≥30% NH3 basis), and zinc oxide (nanopowder, <100 nm particle size) were supplied by Sigma-Aldrich; aeroxide titanium oxide (TiO2, P25) was supplied by Evonik.ZnO synthesis
The synthesis of ZnO was performed by a method modified from that published by Farag et al.26 in order to obtain a higher surface area catalyst support than the commercially available ZnO. This method has been explained in previous work published by this group.24Precursor solutions of Zn(CH3OH)2 (0.5 M) and (NH4)2CO3 (1.0 M) were prepared. In an oil bath preheated to 60 °C, a round bottom flask was first charged with the Zn(CH3CO2)2 solution (50 mL), and then quickly but carefully the (NH4)2CO3 solution (50 mL) was added with stirring. The mixture was heated at 60 °C and stirred constantly for 1 h, then filtered under vacuum, washed with deionised water (2 L), and dried (110 °C, 16 h). To transform the zinc hydroxycarbonate intermediate to zinc oxide, the material was calcined in flowing air (450 °C, 3 h, 10 °C min−1).
The as-synthesised ZnO was used as a catalyst support, denoted ZnO(F), in comparison to the ZnO obtained commercially, denoted as ZnO(C).
Supported catalyst synthesis
The synthesis of PdZn catalyst by chemical vapour impregnation (CVI) has been previously reported for CO2 hydrogenation to methanol.27 Monometallic Pd and bimetallic PdZn catalysts supported on either ZnO, TiO2, Al2O3 or Ga2O3 have been synthesised. For the preparation of 2 g of Pd/support catalyst with a 5 wt% Pd loading, Pd(acac)2 (0.94 mmol) and the support were physically mixed. The mixture was then added to a Schlenk flask, sealed and then lowered into an oil bath preheated to 80 °C. The Schlenk line was evacuated and heated (133 °C, 1 h). The material was then recovered and calcined in static air (500 °C, 16 h).For the synthesis of 2 g of PdZn/support catalyst with a 5 wt% Pd loading and a 1:5 palladium to zinc molar ratio, Pd(acac)2 (0.94 mmol), Zn(acac)2 (4.7 mmol) and the support were physically mixed together. The method then followed the same CVI synthesis reported above.
CO2 hydrogenation catalyst testing
Catalytic performance was determined using a parallel 16 bed high-throughput catalytic reactor, designed and manufactured by Integrated Lab Solutions GmbH (ILS). The reactor was operated using Integrated Workflow Manager, based on LabVIEW software and automated using Siemens SIMATIC S7-1500 and Siemens Win CC software. The high-throughput reactor is of a fixed bed, continuous flow design, with all beds operating under the same reaction conditions due to the system configuration. All gases were fed through a capillary distribution system and the pressure in each bed was controlled using an Equilibar back pressure regulator. Four heating blocks, containing four beds each, were used to control the temperature, with a thermocouple positioned inside each block to measure the bed temperature. The pelleted catalysts (0.3 g, 425–600 μm) were placed in stainless steel reactor tubes, with an internal diameter of 4.57 mm. Catalysts were placed in the beds, excluding beds 1, 5, 9 and 13, which were left empty to run as standards. The catalysts were supported on a bed of F24 silicon carbide (750 μm) to ensure they were centred in the isothermal heating zone. F80 silicon carbide (0.45 g), with a particle size of 190 μm, was mixed with the catalysts to aid dispersion and improve heat transfer across the catalyst bed. No pre-reduction of the catalysts occurred prior to the reaction. The beds were heated to 125 °C and the reaction mixture was fed through the distribution system (CO2:H2:Ar:N2, 22:54:5:19%), achieving a flow rate of 34 mLmin−1 at atmospheric pressure. A purge feed of N2, with equivalent flow to the reaction feed, was used to ensure that no product build up was observed in the downstream lines. The pressure was increased to 20 bar using the gas feed pressure over the Equilibar back pressure regulators, which was then left to stabilise for 8 hours. The reactions were conducted at 175, 200, 225 and 250 °C, with a calibration run conducted at 125 °C. The downstream oven was set to 120 °C to stop any product condensing in the reactor lines. The gaseous products were analysed via online gas chromatography, using an Agilent 7890B system with two flame ionisation detectors (FID) and a thermal conductivity detector (TCD). Argon was used as an internal standard. Four injections were taken at each temperature, per reactor bed. Sampling of the products was achieved with a Vici stream selection valve to switch between the beds. It took ca. 8 hours to sample all beds, therefore taking 32 hours to complete one reaction temperature. CO2 conversion was calculated by comparing the moles of CO2 in the calibration at 125 °C to the moles of CO2 at each temperature, for each bed. In all cases, methanol, methane, DME and CO were the only products observed. The carbon balance was calculated using the sum of carbon containing products and reactants in the feed divided by the sum of carbon containing reactants in the calibration runs. After the reaction, the reactor was depressurised and left to cool under flowing nitrogen (50 mLmin−1).
Catalyst characterisation
Surface areas were analysed using a Quantachrome Nova 2200E instrument and calculated by the Brunauer–Emmett–Teller (BET) method. 40-point (20 point adsorption and 20 point desorption) analysis was performed at −196 °C. Prior to BET analysis samples were degassed under vacuum (150 °C, 3 h).X-ray diffraction (XRD) patterns were recorded using a PANalytical X’Pert Pro diffractometer operating at 40 kV, 40 mA using Cu Kα radiation (λ = 1.54 × 10⁻¹⁰ m) with a Ge(111) single crystal monochromator. The reflections were referenced against the International Centre for Diffraction Data (ICDD) database to identify phases present. In situ XRD measurements were recorded on a (θ–θ) PANalytical X’Pert Pro powder diffractometer. A Cu Kα radiation source (40 kV, 40 mA) was fitted with a position sensitive detector and an Anton Parr XRK reaction cell. The gas flow was controlled through a Bronkhorst mass flow controller set to 30 mL min−1 (5% H2/Ar). The temperature was ramped from 50–500 °C, at 40 °C min−1, with measurements conducted at 50 °C intervals.
X-ray photoelectron spectra (XPS) were recorded on a Kratos Axis Ultra-DLD fitted with a monochromatic Al Kα (75–150 W) source and an analyser using a pass energy of 40 eV. XPS data were analysed using Casa XPS software.
Scanning transmission electron microscopy (STEM) was performed using a JEOL ARM200F microscope at the electron Physical Sciences Imaging Centre (ePSIC) at Diamond Light Source. An acceleration voltage of 200 kV, a convergence semi-angle of 23 mrad and a high-angle annular dark field (HAADF) inner angle of 80 mrad was used for data collection. EDX acquisition was performed using a JEOL Centurio dual-detector.
Computational methodology
All calculations were performed with the “Fritz Haber Institute ab initio molecular simulations” (FHI-aims) all-electron full potential software package.28 Calculations were performed with the mBEEF exchange correlation density functional29 from the LibXC DF density functional library,30 using a light basis set and a k-grid density of (0.019 × 2π) Å−1. The self-consistent field (SCF) cycle was deemed converged when the changes in total energy and density were less than 1 × 10⁻⁶ eV and 1 × 10⁻⁶ a0−3 respectively. Throughout, a spin-paired configuration has been used with scalar relativity included via the atomic zero-order regular approximation (ZORA).31 For geometry optimizations, convergence was deemed complete when forces on all unconstrained atoms were less than 0.01 eV Å−1. The crystallographic information files were taken from the Inorganic Crystal Structure Database (ICSD).32 All structures were fully relaxed (lattice parameters and atom positions). Relaxed structures are uploaded on the Novel Material Discovery NOMAD repository33 and are also detailed in the ESI.†Results and discussion
Fig. 1 shows the methanol productivity for the various Pd and PdZn supported catalysts reported here. The materials were prepared by chemical vapor impregnation (CVI) and calcined prior to use but received no pre-reduction step. They were then exposed to the reactant gases over the temperature range 175–250 °C at a constant pressure of 20 bar. The Pd catalysts supported on TiO2 and Al2O3 gave low methanol productivities. In addition to methanol, the other products present in the reactor effluent were CO and methane, with dimethyl ether (DME) also observed over Pd/Al2O3. For example, over the Pd/TiO2 catalyst at 250 °C the selectivity to methanol was 11.7% and to CO and CH4 62.6% and 25.7%, respectively. However, a notably higher methanol selectivity was achieved over Pd/ZnO and Pd/Ga2O3. The Pd/ZnO catalyst showed good yield at the beginning of the reaction, at 175 °C, probably due to the formation of the Pd alloy already,34,35 whereas the yield increased significantly for Pd/Ga2O3 at higher temperatures, due to a big increase in selectivity, as discussed below. Of the two Pd/ZnO catalysts tested, the Pd/ZnO(F) catalyst displayed higher methanol productivity compared to Pd/ZnO(C). This may be due to the more rapid formation of PdZn alloys on the higher surface area ZnO.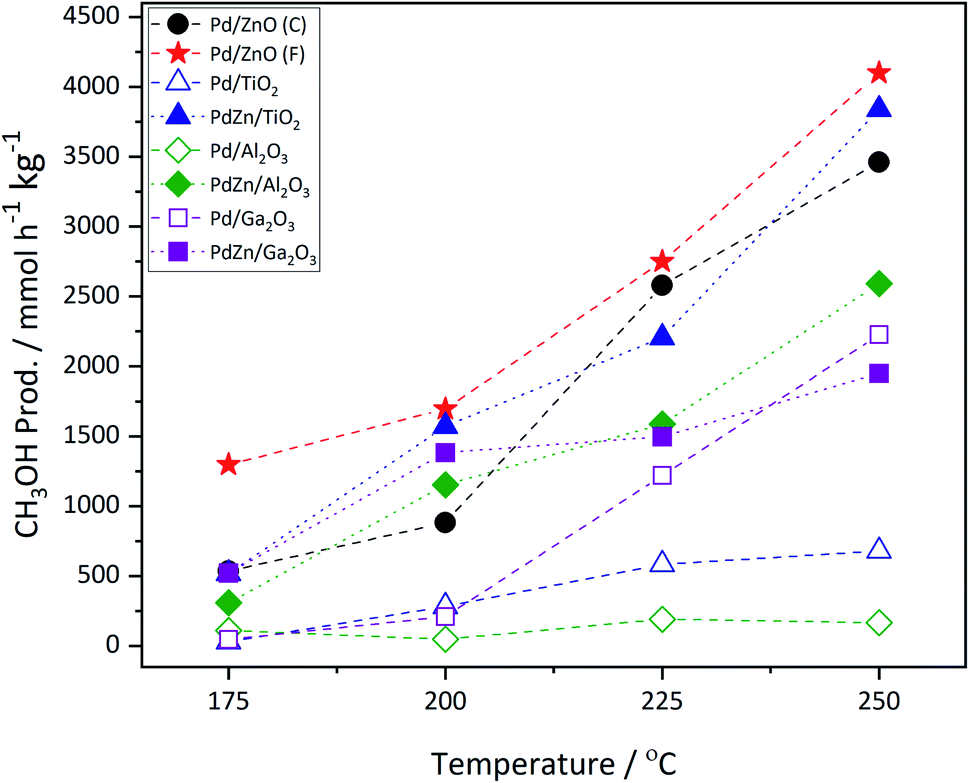 | ||
| Fig. 1 Methanol productivity as a function of CO2 hydrogenation reaction temperature over calcined Pd and PdZn supported catalysts. Pd/ZnO(C) is Pd supported on the commercial support, whereas Pd/ZnO(F) is Pd supported on the Farag-style ZnO. | ||
A linear relationship between CO2 conversion and methanol selectivity has recently been demonstrated for Pd/ZnO catalysts prepared through a variety of techniques,24 this linear relationship is shown by the PdZn line on Fig. 2. In addition to the alloy, a recent study has shown the presence of a ZnO phase to be important for achieving high methanol productivity,25 which may explain the high activity of the Pd/ZnO catalysts. A bifunctional mechanism was proposed whereby CO2 activation occurred on the ZnO phase, while H2 dissociation and spillover, allowing for formate reduction to methanol, occurred over the PdZn nanoparticles.
 | ||
| Fig. 2 Plot of CO2 conversion vs. CH3OH selectivity over calcined Pd and PdZn supported catalysts. The four data points for each entry correspond to the increasing reaction temperature (left to right) from 175 to 250 °C, corresponding with increasing conversion. The line shown is that reported recently for a range of PdZn catalysts.24 | ||
Fig. 2 shows that a similar relationship between CO2 conversion and methanol selectivity was seen for all of the PdZn catalysts, but the Pd/Al2O3 and Pd/TiO2 samples had low selectivity and also the former had very low conversion. The two Pd/ZnO catalysts lie close to the line, due to PdZn alloy formation, while the Pd/Ga2O3 shows somewhat unusual behaviour, starting with low selectivity at low conversion/temperature, but increases significantly at high conversion. As described below, this is due to the formation of a PdGa alloy as the reaction proceeds at the higher temperatures. Considering the samples where both Pd(acac)2 and Zn(acac)2 have been deposited onto the various supports, it can be immediately identified from Fig. 2 that all show much higher selectivity at low conversion. For instance, regarding Pd/Al2O3 and PdZn/Al2O3, methanol selectivity increases from 23.5% for the monometallic catalyst, at the lowest temperature, to 62.7% for the bimetallic catalyst. Similarly, for Pd/TiO2 it is 14.0%, while the bimetallic PdZn/TiO2 has a value of 54.6%. It is also notable that the PdZn/Ga2O3 shows high selectivity already at low temperature/conversion (76.4%), whereas the Pd/Ga2O3 has low selectivity to methanol (13.0%). Within experimental certainty limits (±2% on selectivity, and ±1% on conversion), CO2 conversion was noticeably lower over the two Ga2O3 supported samples at lower temperatures, compared with the others.
The incorporation of Zn into the Pd/TiO2 and Pd/Al2O3 catalysts resulted in a significant increase in methanol productivity, highlighting the importance of the PdZn alloy. Additionally, a significant decrease in methane selectivity was observed over both these supports upon addition of Zn (Table 1). In these examples, CH4 formation is greatly reduced to <1% with the other major product being CO. Whilst DME was observed over Pd/Al2O3, reaching a maximum selectivity of ca. 5% at 250 °C, none was detected over PdZn/Al2O3, further evidence of the beneficial effect of Zn addition.
| Temperature/°C | Pd/ZnO (C) | Pd/ZnO (F) | Pd/TiO2 | PdZn/TiO2 | Pd/Al2O3 | PdZn/Al2O3 | Pd/Ga2O3 | PdZn/Ga2O3 |
|---|---|---|---|---|---|---|---|---|
| 175 | 0.0 | 0.0 | 6.0 | 0.7 | 4.2 | 0.0 | 0.0 | 0.0 |
| 200 | 0.1 | 0.0 | 9.8 | 0.8 | 8.7 | 0.4 | 0.1 | 0.1 |
| 225 | 0.0 | 0.1 | 16.3 | 0.9 | 15.6 | 0.4 | 0.1 | 0.1 |
| 250 | 0.0 | 0.0 | 25.7 | 1.1 | 25.2 | 0.5 | 0.1 | 0.1 |
Returning to the trend for the Pd/Ga2O3 catalyst, which shows a greatly improved productivity above 200 °C, Fig. 3 and Table S1† illustrate the change in selectivity over the reaction period for this catalyst. It is shown that, at 200 °C, methanol selectivity increases steadily as a function of time under isothermal conditions, from ca. 15% to ca. 35%. This trend indicates a change in the catalytic material, which is suggested to be the formation of a Pd2Ga alloy, vide infra. This is further highlighted by the reaction profile as a function of time at 225 °C, where methanol selectivity increases to ca. 60%. In contrast, this significant change in selectivity was not observed for the PdZn/Ga2O3 catalyst, which can be attributed to the formation of the PdZn alloy at the beginning of the reaction.35 Previous literature has stated that the formation of the PdZn alloy is responsible for the increased activity,17,18,21,36 which the data here supports. The different trend shown for the Pd/Ga2O3 catalyst suggests the formation of a different alloy species, as discussed below, whereby the Pd2Ga alloy contributes to increased methanol formation from CO2.15
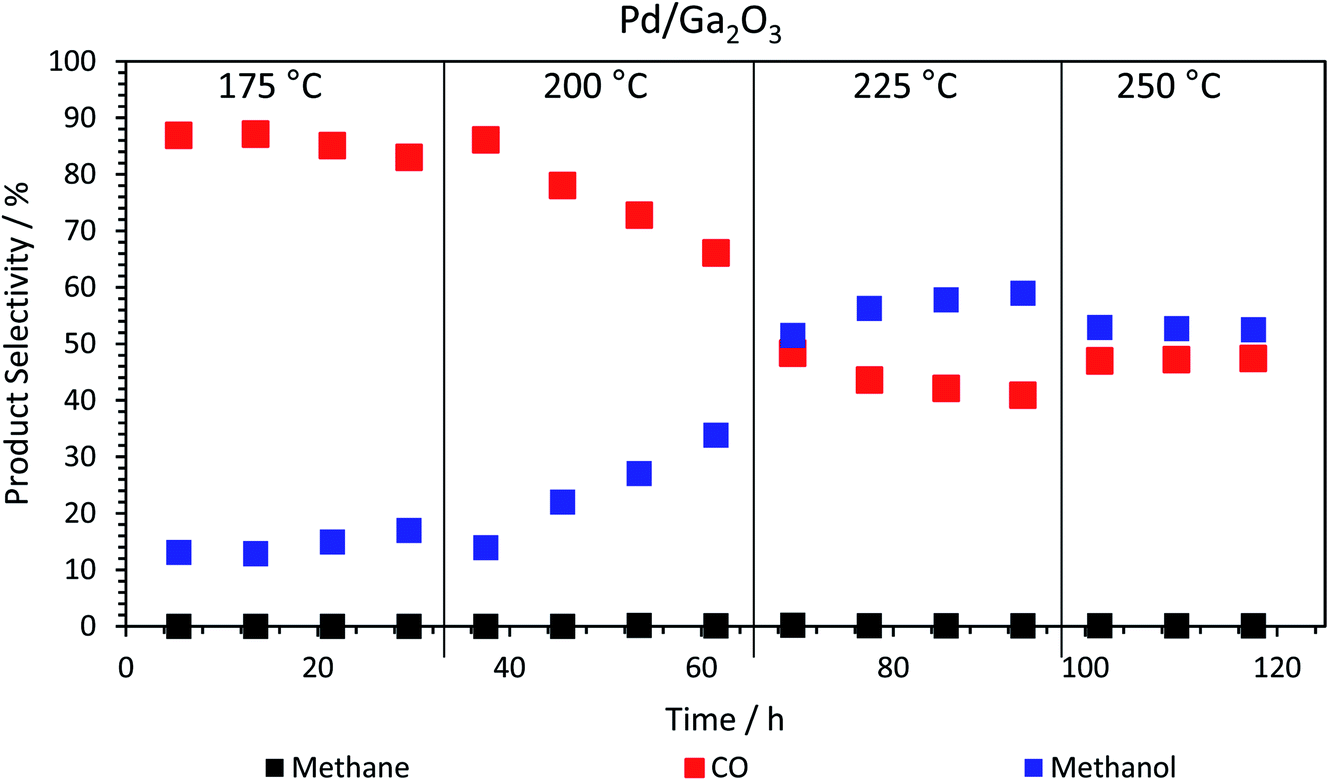 | ||
| Fig. 3 Product selectivity dependence on run time, at different isothermal temperatures for the calcined Pd/Ga2O3 catalyst. The methane never exceeds 0.2% (Table S1†). | ||
Catalyst characterisation
| Sample | Surface area/m2 g−1 |
|---|---|
| ZnO(C) | 14 |
| ZnO(F) | 23 |
| TiO2 (P25) | 54 |
| γ-Al2O3 | 168 |
| Ga2O3 | 6 |
| PdZn(1:5)/TiO2 (post reaction) |
31 |
| PdZn(1:5)/Al2O3 (post reaction) |
124 |
| PdZn(1:5)/Ga2O3 (post reaction) |
12 |
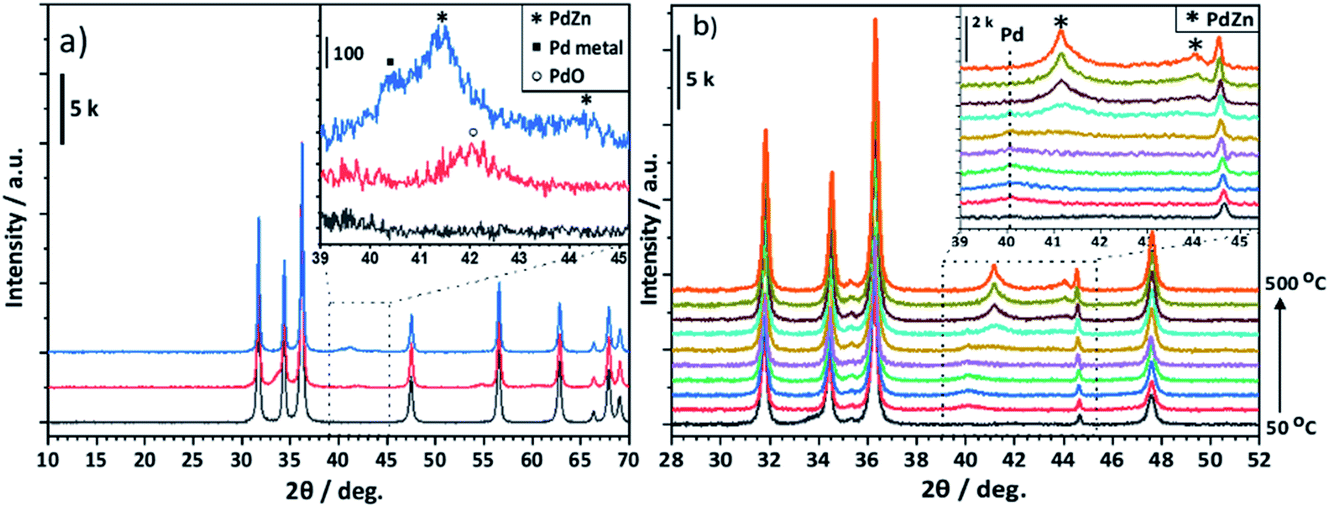 | ||
| Fig. 4 (a) X-ray diffraction pattern of ZnO(F) (black), calcined Pd/ZnO(F) (red), and post reactor Pd/ZnO(F) (blue). (b) In situ XRD of Pd/ZnO(F). Following alloy formation under reducing conditions (5% H2/Ar, 50–500 °C, 50 °C steps). | ||
Fig. 4a shows that for the Pd/ZnO post reaction sample, PdO reflections (33.6° and 41.9°, JCPDS 00-006-0515) from the calcination of the Pd(acac)2 precursor are transformed to the PdZn alloy as a result of being exposed to the reaction conditions (see Experimental). The reflections observed at 41.2° and 44.2° are characteristic of the (111) and (200) planes for the 1:1 β-PdZn alloy (JCPDS 01-072-2936). The PdZn reflection at 41.2° also shows a broad shoulder at 40.1° suggesting the presence of a small amount of Pd0 (JCPDS 00-005-0681). The in situ XRD of Pd/ZnO (Fig. 4b) showed a broad reflection with low intensity at 40.1° from reduction at 50 °C, which can be assigned to Pd0. This decreases with increasing temperature and, at 350 °C, an increase in the intensity of reflections at 41.2° and 44.1° are observed, corresponding to the 1:1 β-PdZn phase. Increasing the reduction temperature to 500 °C leads to further alloying of Pd to PdZn as indicated by the increasing intensity of the PdZn reflections, with no evidence for Pd0, even at 400 °C. Previous studies suggested an initial reduction of PdO to Pd0, leading to hydrogen spillover from the Pd to ZnO, resulting in the formation of the PdZn alloy as the oxide reduces.35,37,38
Fig. 5a shows that for Pd/Ga2O3, an alloy is also formed from PdO under reaction conditions, in this case the Pd2Ga alloy. This is indicated by the reflections at 39.6°, 40.1° and 41.3° (JCPDS 01-071-8664) in the post reaction sample. However, it is also possible that the reflection at 40.1° could be due to the presence of some Pd0, as suggested by the XPS results (Fig. 8b). Similarly, the Pd2Ga alloy formation is evident under reducing conditions in the in situ XRD (Fig. 5b). Pd0 is initially detected at lower temperatures at 40.1°, but at 300 °C a shift is observed, leading to the growth of Pd2Ga as evidenced by reflections at 39.6°, 40.2°, 41.2°.
 | ||
| Fig. 5 (a) X-ray diffraction pattern of Ga2O3 (black), calcined Pd/Ga2O3 (red), and post reactor Pd/Ga2O3 (blue). (b) In situ XRD of Pd/Ga2O3. Following alloy formation under reducing conditions (5% H2/Ar, 50–500 °C, 50 °C steps). | ||
In the case of PdZn/Ga2O3, ZnO is formed following calcination, as can be seen from the reflections at 34.4°, 36.3° and 47.5° (JCPDS 00-005-0664) (Fig. 6a). Under reaction conditions, ZnO reflections are preserved and as previously observed, the PdO formed upon calcination forms a metal alloy. The PdZn alloy reflections are observed at 41.2° and 44.1°, however, an additional reflection is present at 40.1°, which could be assigned to Pd0 or the Pd2Ga alloy. It is possible that Pd0 is also present in the Pd/Ga2O3 post reaction diffraction pattern, but this reflection is obscured by the Pd2Ga alloy. Observed via in situ XRD, the β-PdZn phase dominates for PdZn/Ga2O3, as seen with the increasing intensity of reflections at 41.4° and 44.1° from a temperature of 350 °C and above. There is no evidence for the Pd2Ga alloy, indicating that the PdZn alloy is favoured over Pd2Ga in this environment, which agrees with the ex situ analysis of post-reaction PdZn/Ga2O3. Despite Pd2Ga having a more favourable heat of mixing (Fig. 10), the enthalpy of formation of Ga2O3 and ZnO are reported as −1089.1 kJ mol−1 and −350.5 kJ mol−1, respectively,39 which suggests that Zn is more readily reduced into the alloy.
 | ||
| Fig. 6 (a) X-ray diffraction pattern of Ga2O3 (black), calcined PdZn/Ga2O3 (red), and post reactor PdZn/Ga2O3 (blue). (b) In situ XRD of PdZn/Ga2O3. Following alloy formation under reducing conditions (5% H2/Ar, 50–500 °C, 50 °C steps). | ||
Whilst some differences were observed between the ex situ XRD measurements of post reaction samples and in situ experiments, it is important to note that there were differences in the conditions: in situ XRD experiments were performed at atmospheric pressure under dilute reducing conditions up to a temperature of 500 °C, whereas post-reaction samples were exposed to CO2 hydrogenation reaction conditions for an extended period of time. Additional reflections observed in the in situ XRD experiments at 35.5° and 44.7° were a result of the sample holder (Fig. S1†).
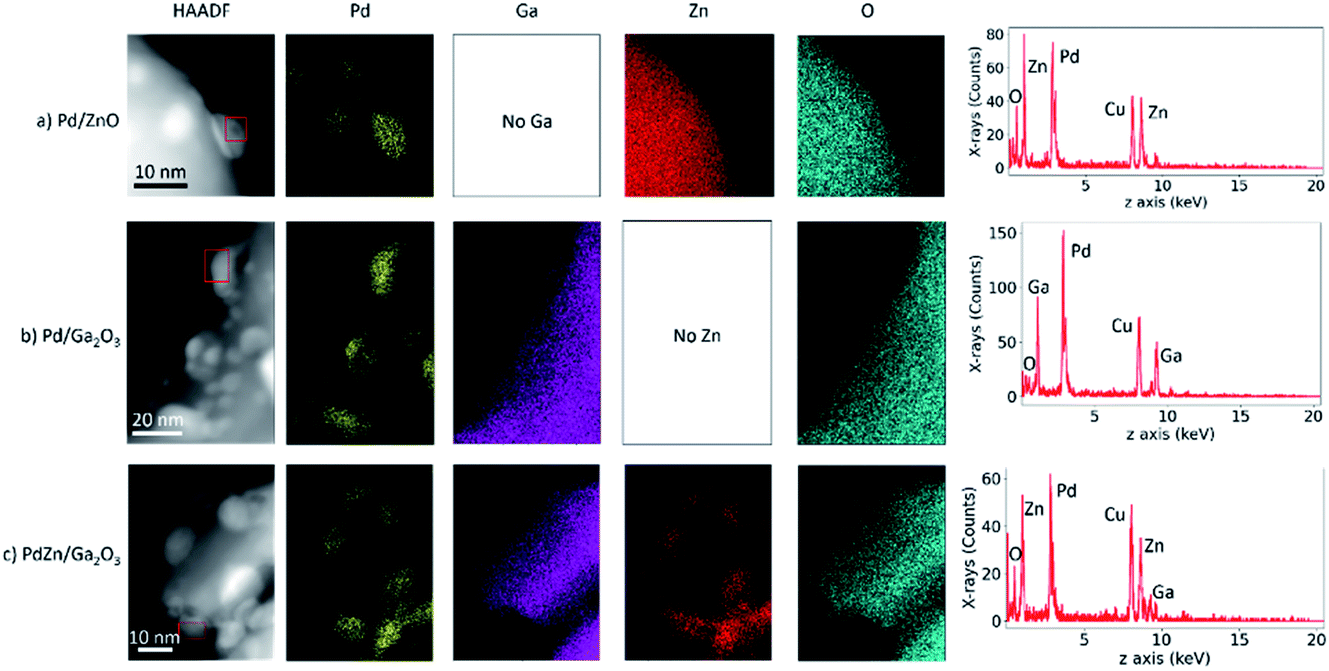 | ||
| Fig. 7 STEM-EDX data demonstrating the alloying of nanoparticles after reduction at 400 °C for (a) Pd/ZnO, (b) Pd/Ga2O3 and (c) PdZn/Ga2O3. The EDX spectra (right) are taken from the red box indicated on the corresponding HAADF-STEM image. EDX maps are produced from a sum of all counts around the Kα peak (for Ga, Zn and O) or the Lα1 peak (for Pd). Peaks are labelled with corresponding elements in the spectra for ease of interpretation. | ||
Although the EDX mapping is not so clear regarding alloying, nevertheless the spectrum in Fig. 7b clearly shows alloying between Pd and Ga in the analysed nanoparticle in the Pd/Ga2O3 sample, where Ga is detected in a spectrum obtained solely from a metallic nanoparticle. The atomic-resolution HAADF-STEM images of particles in the Pd/Ga2O3 show larger particles than in the other samples (Fig. S2b†). In terms of the PdZn/Ga2O3 sample (Fig. 7c), the STEM-EDX data is supportive of the preferential formation of the PdZn alloy, without the presence of Ga in the metal particles. The extracted elemental maps show a clear correlation between Pd and Zn, and the corresponding spectrum shows only small amounts of Ga which could arise due to the proximity of the support.
 | ||
| Fig. 8 Pd(3d) XPS for Pd/ZnO, Pd/Ga2O3, PdZn/Ga2O3 after calcination and after reaction. Pd metal, alloyed Pd and PdO in the peak fitting are represented in green (334.4 eV), blue (335.1 eV), and purple (336.2 eV) respectively. | ||
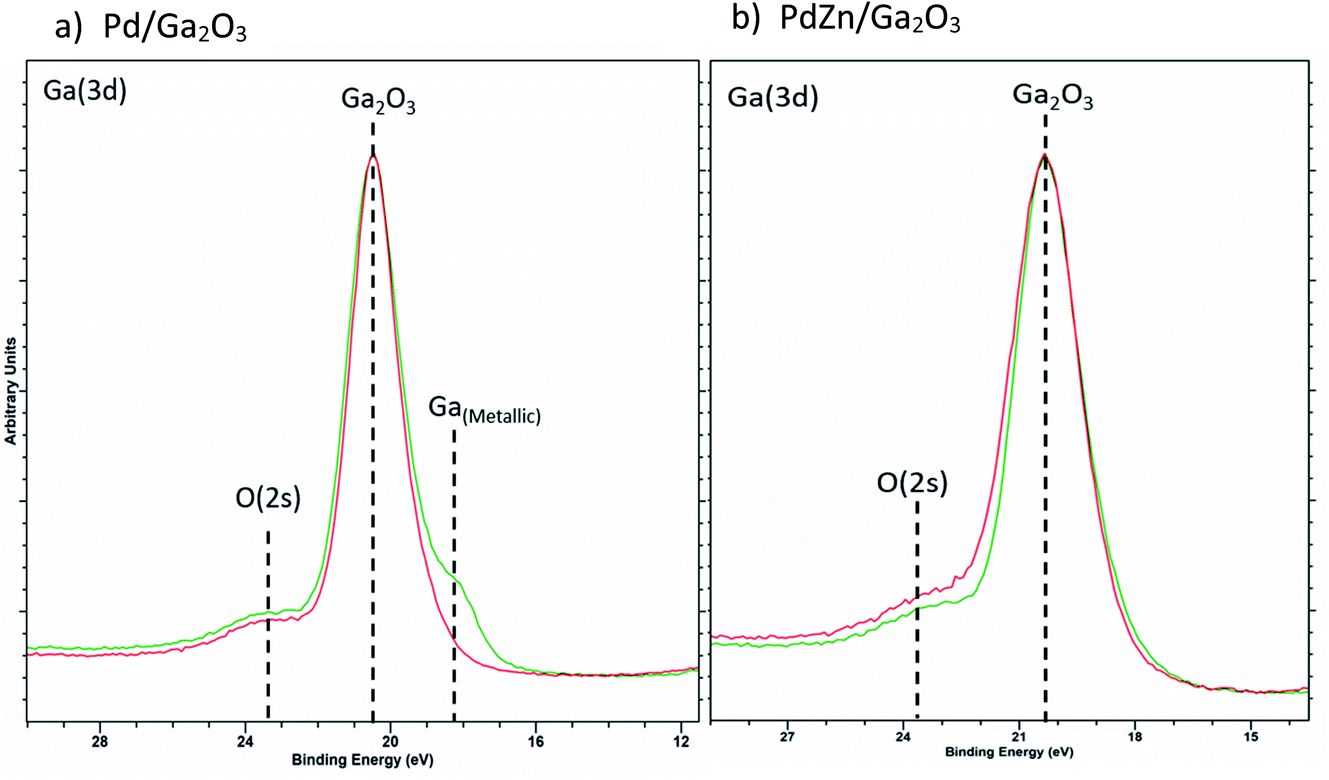 | ||
| Fig. 9 Overlay of Ga(3d) XPS for (a) Pd/Ga2O3 and (b) PdZn/Ga2O3 for calcined (red) and post reactor (green) samples. | ||
Fig. 9a shows the formation of reduced Ga for the Pd/Ga2O3 catalyst in the post reaction sample, indicating the alloy formation. In contrast, there is negligible evidence of reduced Ga present in PdZn/Ga2O3 (Fig. 9b), suggesting the PdZn alloy is favoured rather than Pd2Ga. This provides good evidence that the reflection observed at 40.1° in the post reaction XRD analysis of PdZn/Ga2O3 can be attributed to the presence of Pd0 rather than Pd2Ga, as XPS does not support the presence of any reduced Ga species. Clearly, under reaction conditions changes can be observed with the Pd nanoparticles when a suitable metal oxide is present, in this case, either ZnO or Ga2O3.
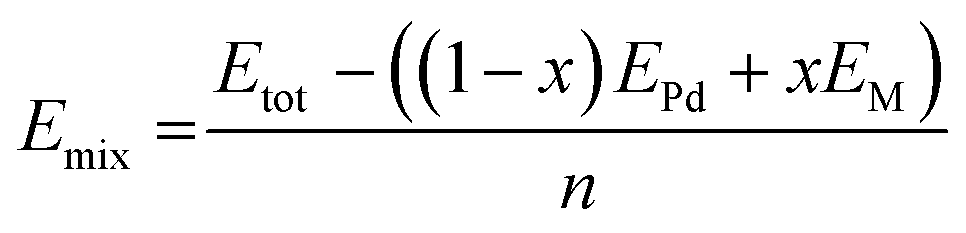
where Etot is the total energy of the structure calculated, n is the total number of atoms in the structure, M represents Zn, Ga or In, x is the concentration of M, EPd is the energy of Pd in its stable face cubic centre (FCC) phase, EM is the total energy of the M bulk system in its stable phase: Zn in the hexagonal close-packed structure (HCP) phase, Ga in the FCC phase and In in the tetragonal body centred (TBC).
For PdZn, three different compositions were investigated (33.33, 50 and 66.66% of Zn). For PdIn, six different compositions were studied (25, 33.33, 37.5, 50, 60 and 70% of Zn) and finally for PdGa, five compositions were assessed (30, 33.33, 37.5, 50 and 70% of Zn). Fig. 10 shows Emix for the three alloys. For PdGa and PdZn, systems with 50% Pd have the lowest Emix, with the range varying from −0.44 eV per atom to −0.81 eV per atom. Overall, PdGa has the most exothermic Emix, compared to PdIn and PdZn. We have limited experimental data for PdIn, so will report these later when they are more complete, but what is clear is that a variety of alloy compositions should be accessible, whereas for PdZn there is a clear maximum heat of mixing at the 50% alloy.
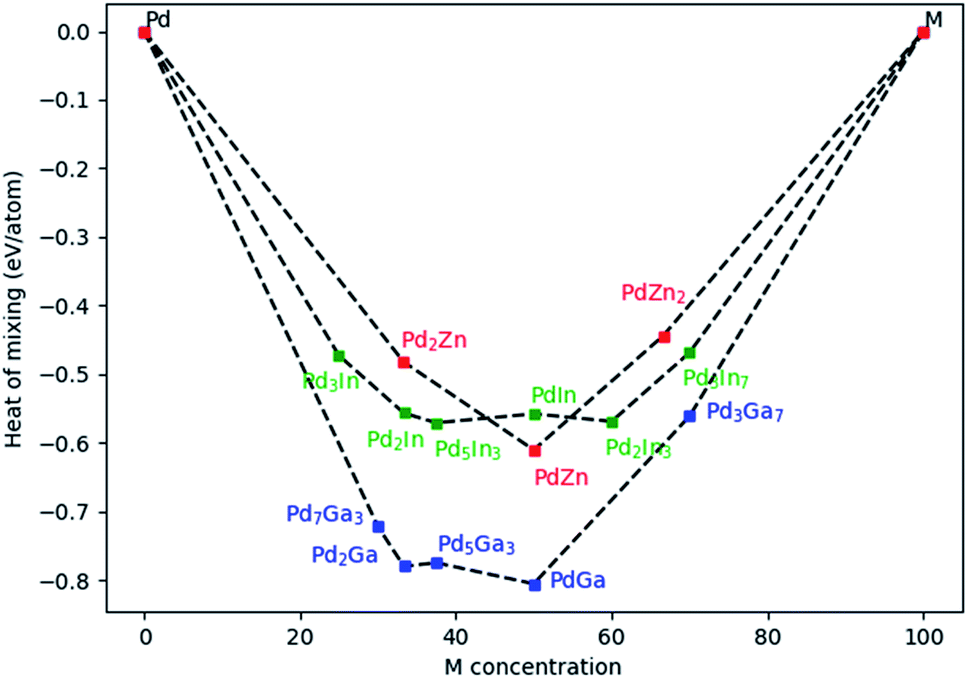 | ||
| Fig. 10 Heat of mixing for Pd alloyed with Zn, Ga, and In. | ||
For PdZn alloys, we have so far only found the 1:1 alloy forming experimentally, and the reason for this appears to be the high Emix at this ratio. The Pd2Ga alloy was formed experimentally in the Pd/Ga2O3 catalyst, which is found to give good selectivity to methanol (Fig. 2). Clearly it also has a significantly exothermic Emix, and no other ratios with similar Emix were found to be present. It is likely that the competitive phases will be formed when varying the ratios of Pd and Ga in the right way. It is shown from the PdZn/Ga2O3 catalyst that when Zn is present, Pd is unable to alloy with other metals, as shown by XRD analysis (Fig. 6). It appears that Zn still dominates alloying, even though the heat of mixing with Ga is higher. As previously suggested, the enthalpy of formation of Ga2O3 and ZnO have been reported as −1089.1 kJ mol−1 and −350.5 kJ mol−1, respectively,39 suggesting that Zn is more readily reduced into the alloy compared with the more stable Ga2O3.
To understand the alloys in a little more detail, electron distribution was considered. The Mulliken charges of the atoms were calculated and are presented in Fig. 11. The transfer of charges is always from M (Ga, Zn and In) to Pd, and it is more pronounced for PdZn (−0.46) compared to PdGa (−0.40), which implies a potential for filling the d-band of the alloys.
 | ||
| Fig. 11 Mulliken charges for, from left to right, PdIn, PdZn and PdGa alloys. Pd is represented by the blue spheres, while In, Zn, Ga are represented by the greyish spheres. The increased charge is on Pd in each case. | ||
The density of states (DOS) were calculated for Pd, PdZn, PdGa and PdIn and these are presented in Fig. 12. The Pd DOS shows one large peak in the range of −5.5 to 0.5 eV, corresponding to the Pd 3d orbitals with a nearly complete d shell, and with the d orbitals crossing the Fermi level. For PdZn, the d-orbitals are shifted deeper and away from the Fermi level at 7.5 eV, mainly due to Zn 3d electrons, while the other peaks, from −5 to −1 eV, have Pd and Zn contributions: the latter has lower intensity compared to the former, indicating a lower electron population in this range. These results are in agreement with Armbrüster et al.41 where the authors have shown similar intensities and positions for the 3d peaks.
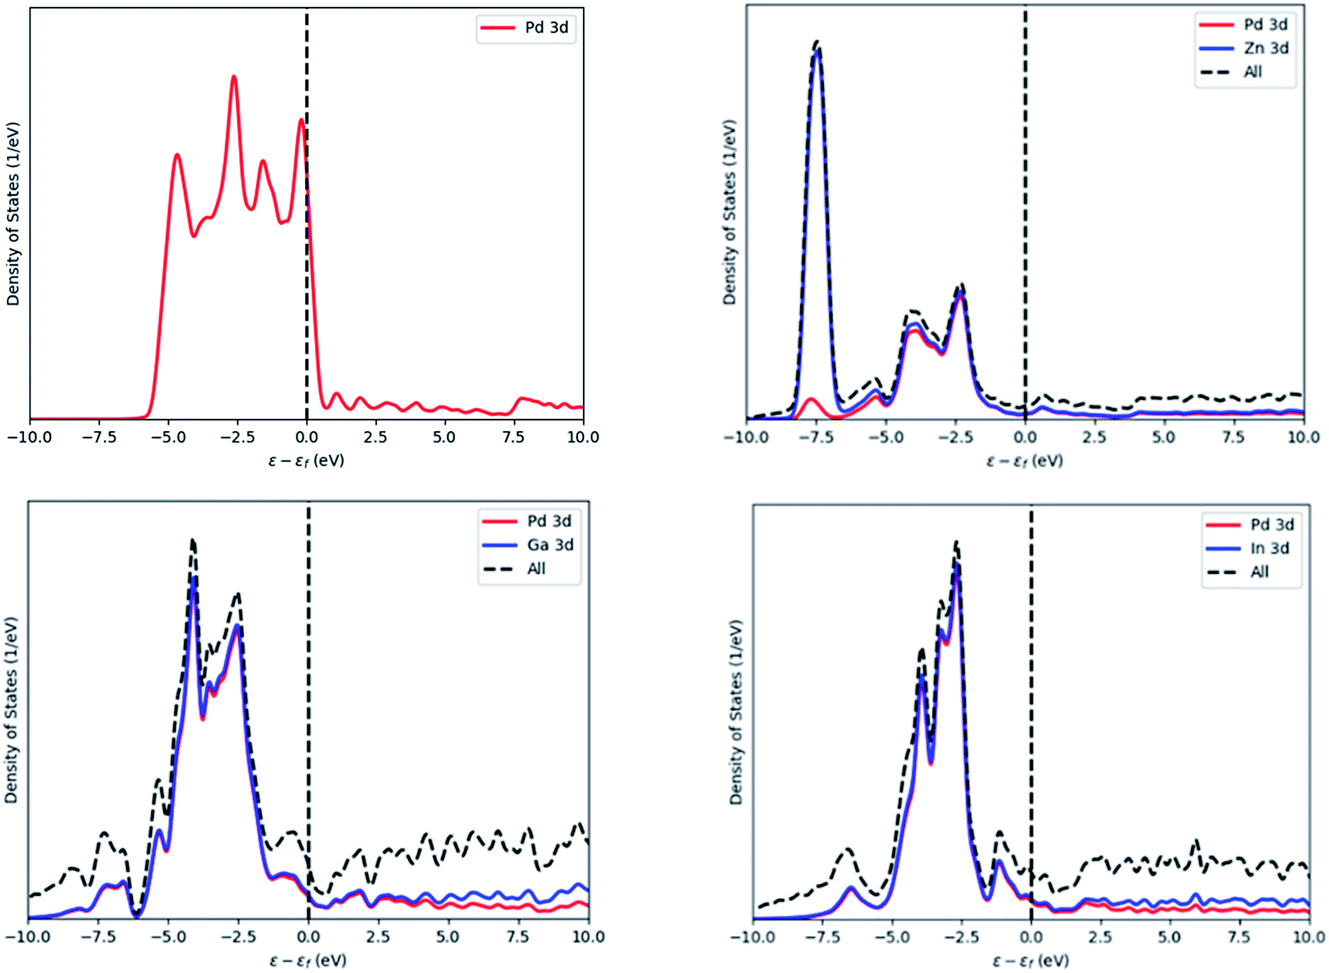 | ||
| Fig. 12 Density of states of Pd (top left), PdZn (top right), PdGa (bottom left) and PdIn (bottom right). Energy values are normalised against the Fermi level of the system. | ||
The PdGa and PdIn DOS, which are also in Fig. 12, are similar in appearance. For both alloys, Pd, In and Ga contribute equally to each of the two peaks observed, with the peak from 6 to 2 eV, having the highest intensity.
Comparing the DOS of the three binary alloys, the contribution of the Pd and Zn orbitals in the low energy range indicates some orbital overlap, which may be the reason for the preferred stability of the PdZn alloy, compared to the other two binaries.
Conclusions
Pd/Al2O3, Pd/TiO2, Pd/Ga2O3, Pd/ZnO, and PdZn analogues of these materials, have been synthesised and tested as catalysts for the hydrogenation of CO2 to methanol. Methanol selectivity was observed to be significantly higher for Pd alloy catalysts versus the monometallic counterparts. Methanol selectivities of 11.7% and 46.9% were achieved over Pd/TiO2 and PdZn/TiO2 at a reaction temperature of 250 °C, with similar improvements in methanol selectivity observed for PdZn/Al2O3 compared with Pd/Al2O3. The relationship between CO2 conversion and methanol selectivity for PdZn/Ga2O3 fell within an established selectivity–conversion relationship for PdZn, due to the formation of the β-PdZn 1:1 alloy, even in the presence of Ga2O3. Interesting behaviour was observed for Pd/Ga2O3 with methanol selectivity increasing as a function of reaction time at temperatures of 200 and 225 °C. These changes with time were indicative of increasing Pd–Ga alloy formation with increasing reaction time and temperature.
After the reaction, the catalysts were characterised by XRD and XPS, and compared with the calcined materials before reaction, in order to probe the nature of the alloys formed. The β-PdZn 1:1 alloy was formed in all Zn containing materials, including PdZn/Ga2O3, whereas Pd2Ga was formed for the Pd/Ga2O3 catalyst. These results were corroborated by in situ XRD experiments under reducing conditions and STEM-EDX data of reduced materials.
Density functional theory (DFT) was used to calculate the heats of mixing of the alloy components for a variety of alloy compositions to rationalise the observed alloy formation, and these confirm highly exothermic values for PdZn and PdGa alloy formation. They show a strong maximum in heat of mixing for the 1:1 PdZn alloy, indicating why no other alloy phases are found. However, the heat of mixing for formation of the Pd2Ga alloy is significantly higher than that for PdZn, and yet, for PdZn deposited on Ga2O3, Ga alloying does not occur. This is likely due to the lower stability and ease of reduction of ZnO compared with Ga2O3, highlighting also the role of relative oxide stability in alloy formation.
Author contributions
Experiments and data acquisition were carried out by NL, IEG, LRS, KJA, MD, DJM, JSH, TJAS. LK carried out the theoretical calculations, and AL/CRAC supervised that work and obtained funding for computer time. Supervision and direction of experimental work was carried out by MB, ND, TJAS, SHT, GJH, LS. GJH secured funding for much of the experimental work. Main writing contributors were NL, IG, LS, KA, MD, TS, ND, MB, LK, AL.Conflicts of interest
There are no conflicts to declare.Acknowledgements
The authors would like to acknowledge Integrated Lab Solutions GmbH (ILS) for the design and manufacture of the high-throughput reactor, and their continued support and technical expertise. The authors wish to acknowledge support from the EPSRC International Centre-to-Centre Project: New trimetallic nanoparticles as catalysts for the conversion of carbon dioxide to renewable fuels (EPSRC EP/S030468/1). We also thank the UK Catalysis Hub, funded through EPSRC Grants EP/R026939/1 and EP/R026815/1, and from EPSRC EP/S030468/1, EP/N010531/1. We thank Diamond Light Source for access and support in use of the electron Physical Science Imaging Centre (Instrument E01 under proposal number MG27530) that contributed to the results presented here, and EPSRC grant EP/V029797/2 for additionally supporting the electron microscopy. The research results were also carried out within the framework of the Max Planck-Cardiff Centre on the Fundamentals of Heterogeneous Catalysis (FUNCAT) at Cardiff. AJL acknowledges funding by the UKRI Future Leaders Fellowship program (MR/T018372/1). The authors acknowledge computational resources and support from: the Supercomputing Wales project, which is part-funded by the European Regional Development Fund (ERDF) via the Welsh Government; and the UK National Supercomputing Services ARCHER and ARCHER2, accessed via membership of the Materials Chemistry Consortium, which is funded by the Engineering and Physical Sciences Research Council (EP/L000202/1, EP/R029431/1, EP/T022213/1).References
- X. Jiang, X. Nie, X. Guo, C. Song and J. G. Chen, Chem. Rev., 2020, 120, 7984–8034 CrossRef CAS.
- S. Sarp, S. Gonzalez Hernandez, C. Chen and S. W. Sheehan, Joule, 2021, 5, 59–76 CrossRef CAS.
- J. Fernández-González, M. Rumayor, A. Domínguez-Ramos and A. Irabien, Ind. Eng. Chem. Res., 2022, 61, 6163–6172 CrossRef.
- R. Sahki, O. Benlounes, O. Chérifi, R. Thouvenot, M. M. Bettahar and S. Hocine, React. Kinet., Mech. Catal., 2011, 103, 391–403 CrossRef CAS.
- W.-J. Shen, K.-W. Jun, H.-S. Choi and K.-W. Lee, Korean J. Chem. Eng., 2000, 17, 210–216 CrossRef CAS.
- A. Tripodi, F. Conte and I. Rossetti, Energy Fuels, 2020, 34, 7242–7256 CrossRef CAS.
- J. Ruiz Esquius, H. Bahruji, S. H. Taylor, M. Bowker and G. J. Hutchings, ChemCatChem, 2020, 12, 6024–6032 CrossRef CAS.
- N. Koizumi, X. Jiang, J. Kugai and C. Song, Catal. Today, 2012, 194, 16–24 CrossRef CAS.
- F. Sha, Z. Han, S. Tang, J. Wang and C. Li, ChemSusChem, 2020, 13, 6160–6181 CAS.
- A. Gotti and R. Prins, J. Catal., 1998, 175, 302–311 CrossRef CAS.
- A. Erdohelyi, J. Catal., 1986, 98, 166–177 CrossRef CAS.
- C. Wu, D. Cheng, M. Wang and D. Ma, Energy Fuels, 2021, 35, 19012–19023 CrossRef CAS.
- T. Fujitani, M. Saito, Y. Kanai, T. Watanabe, J. Nakamura and T. Uchijia, Appl. Catal., A, 1995, 125, L199–L202 CrossRef CAS.
- S. E. Collins, J. J. Delgado, C. Mira, J. J. Calvino, S. Bernal, D. L. Chiavassa, M. A. Baltanás and A. L. Bonivardi, J. Catal., 2012, 292, 90–98 CrossRef CAS.
- R. Manrique, J. Rodríguez-Pereira, S. A. Rincón-Ortiz, J. J. Bravo-Suárez, V. G. Baldovino-Medrano, R. Jiménez and A. Karelovic, Catal. Sci. Technol., 2020, 10, 6644–6658 RSC.
- S. E. Collins, M. A. Baltanás, J. J. Delgado, A. Borgna and A. L. Bonivardi, Catal. Today, 2021, 381, 154–162 CrossRef CAS.
- J. Díez-Ramírez, J. L. Valverde, P. Sánchez and F. Dorado, Catal. Lett., 2016, 146, 373–382 CrossRef.
- N. Iwasa, H. Suzuki, M. Terashita, M. Arai and N. Takezawa, Catal. Lett., 2004, 96, 75–78 CrossRef CAS.
- C. Huang, Z. Wu, H. Luo, S. Zhang, Z. Shao, H. Wang and Y. Sun, ACS Appl. Energy Mater., 2021, 4, 9258–9266 CrossRef CAS.
- A. S. Malik, S. F. Zaman, A. A. Al-Zahrani, M. A. Daous, H. Driss and L. A. Petrov, Appl. Catal., A, 2018, 560, 42–53 CrossRef CAS.
- F. Brix, V. Desbuis, L. Piccolo and É. Gaudry, J. Phys. Chem. Lett., 2020, 11, 7672–7678 CrossRef CAS.
- O. A. Ojelade, S. F. Zaman, M. A. Daous, A. A. Al-Zahrani, A. S. Malik, H. Driss, G. Shterk and J. Gascon, Appl. Catal., A, 2019, 584, 117185 CrossRef CAS.
- H. Bahruji, M. Bowker, G. Hutchings, N. Dimitratos, P. Wells, E. Gibson, W. Jones, C. Brookes, D. Morgan and G. Lalev, J. Catal., 2016, 343, 133–146 CrossRef CAS.
- M. Bowker, N. Lawes, I. Gow, J. Hayward, J. R. Esquius, N. Richards, L. R. Smith, T. J. A. Slater, T. E. Davies, N. F. Dummer, L. Kabalan, A. Logsdail, R. C. Catlow, S. Taylor and G. J. Hutchings, ACS Catal., 2022, 12, 5371–5379 CrossRef CAS.
- M. Zabilskiy, V. L. Sushkevich, M. A. Newton, F. Krumeich, M. Nachtegaal and J. A. Bokhoven, Angew. Chem., Int. Ed., 2021, 60, 17053–17059 CrossRef CAS PubMed.
- H. Farag, Z. M. Hanafi, M. Dawy and E. A. El Aziz, Can. J. Pure Appl. Sci., 2010, 4, 1303–1309 CAS.
- H. Bahruji, M. Bowker, W. Jones, J. Hayward, J. Ruiz Esquius, D. J. Morgan and G. J. Hutchings, Faraday Discuss., 2017, 197, 309–324 RSC.
- V. Blum, R. Gehrke, F. Hanke, P. Havu, V. Havu, X. Ren, K. Reuter and M. Scheffler, Comput. Phys. Commun., 2009, 180, 2175–2196 CrossRef CAS.
- J. Wellendorff, K. T. Lundgaard, K. W. Jacobsen and T. Bligaard, J. Chem. Phys., 2014, 140, 144107 CrossRef.
- S. Lehtola, C. Steigemann, M. J. T. Oliveira and M. A. L. Marques, SoftwareX, 2018, 7, 1–5 CrossRef.
- W. P. Huhn and V. Blum, Phys. Rev. Mater., 2017, 1, 033803 CrossRef.
- Home|ICSD, https://icsd.products.fiz-karlsruhe.de/, accessed 20 May 2022 Search PubMed.
- C. Draxl and M. Scheffler, JPhys Mater., 2019, 2, 036001 CrossRef CAS.
- S. Penner, B. Jenewein, H. Gabasch, B. Klotzer, D. Wang, A. Knopgericke, R. Schlogl and K. Hayek, J. Catal., 2006, 241, 14–19 CrossRef CAS.
- M. W. Tew, H. Emerich and J. A. van Bokhoven, J. Phys. Chem. C, 2011, 115, 8457–8465 CrossRef CAS.
- A. Karim, T. Conant and A. Datye, J. Catal., 2006, 243, 420–427 CrossRef CAS.
- N. Iwasa and N. Takezawa, Top. Catal., 2003, 22, 215–224 CrossRef CAS.
- K. M. Eblagon, P. H. Concepción, H. Silva and A. Mendes, Appl. Catal., B, 2014, 154–155, 316–328 CrossRef CAS.
- W. M. Haynes, CRC Handbook of Chemistry and Physics, CRC Press, 92nd edn, 2011 Search PubMed.
- P. van der Heide, in X-Ray Photoelectron Spectroscopy, John Wiley & Sons, Inc., Hoboken, NJ, USA, 2011, pp. i–xvii Search PubMed.
- M. Armbrüster, M. Behrens, K. Föttinger, M. Friedrich, É. Gaudry, S. K. Matam and H. R. Sharma, Catal. Rev. Sci. Eng., 2013, 55, 289–367 CrossRef.
Footnote |
| † Electronic supplementary information (ESI) available. See https://doi.org/10.1039/d2fd00119e |
| This journal is © The Royal Society of Chemistry 2023 |