 Open Access Article
Creative Commons Attribution 3.0 Unported Licence
Interplay between interdiffusion and shape transformations in nanoalloys evolving from core–shell to intermixed structures
Diana
Nelli
 *a,
Christine
Mottet
b and
Riccardo
Ferrando
 b
b
aPhysics Department, University of Genoa, Via Dodecaneso 33, 16146, Genoa, Italy. E-mail: diana.nelli@edu.unige.it
bCINaM UMR 7325, Aix-Marseille University, CNRS, Campus de Luminy, 13288, Marseille, France. E-mail: christine.mottet@univ-amu.fr; ferrando@fisica.unige.it
First published on 17th June 2022
Abstract
Nanoalloys are often grown or synthesized in non-equilibrium configurations whose further evolution towards equilibrium can take place through complex pathways. In this work, we consider bimetallic systems with tendency towards intermixing, namely AgAu, PtPd and AuCu. We analyze their evolution starting from non-equilibrium initial configurations, such as phase-separated core@shell ones, by means of molecular dynamics (MD) simulations. These systems present some differences, since AuCu bulk alloys make ordered phases at low temperature whereas AgAu and PtPd remain in solid solution. Moreover, Cu, Au and Ag have similar cohesive energies whereas Pt is much more cohesive than Pd. We consider both truncated octahedral and icosahedral initial shapes in the size range between 2 and 3 nm. For each AB system, we consider both A@B and B@A core@shell starting configurations. The evolution is characterized by monitoring the time-dependent degree of intermixing and the evolution of the shape. The simulations are performed up to temperatures close to the melting range. The approach to thermodynamic equilibrium is monitored by MD simulations and compared with the equilibrium chemical configurations obtained by Monte Carlo simulations.
1 Introduction
Alloy nanoparticles (referred to as nanoalloys in the following) are very often experimentally produced in out-of-equilibrium configurations.1Nanoalloy structures are characterized by geometric shape and chemical ordering, the latter being the pattern in which the atomic species are distributed. In general, non-equilibrium effects can occur both in shape and in chemical ordering.
Non-equilibrium trapping into metastable geometric shapes is found in elemental metallic nanoparticles2,3 and in nanoalloys.1 Well-known examples include the trapping into the icosahedral motif at large sizes,4,5 the formation of tetrahedral structures in the gas phase6 and in wet-chemistry synthesis,7 the template growth of decahedral structures,8 and the formation of triangular leaflets.9
Also, non-equilibrium effects on chemical ordering are observed both in wet-chemistry synthesis and in gas-phase growth experiments. In particular, here we are interested in the formation of phase-separated core@shell structures in nanoalloys that are miscible at equilibrium. In the synthesis by chemical reduction, both co-reduction and successive reduction methods10–12 can lead to the formation of core@shell nanoalloys13 in miscible systems. In co-reduction, the metal with higher redox potential aggregates first, thus forming the cores of the nanoparticles, while the atoms of the second metal can subsequently aggregate to form the shells, as shown for the AgPd system.10 AgPd presents a clear tendency to form solid solutions,14 but in co-reduction experiments both Ag@Pd and Pd@Ag nanoparticles have been formed.10 In PtPd, a variety of Pt@Pd, Pd@Pt and intermixed structures have been synthesised in co-reduction and successive reduction experiments.15–21 Other highly miscible systems in which core@shell nanoalloys have been obtained by wet-chemistry methods are AuPd and AuCu.22,23 In gas-phase experiments, the formation of B-rich (AB)@B nanoalloys, where the minority element A is always concentrated at the center of the nanoparticle, has been observed in AgAu, PtPd and PtNi.24–26 The origin of this type of non-equilibrium chemical ordering has been rationalized by the depletion of the minority element in the metal vapour. The depletion takes place in the first stages of the nucleation of the nanoparticles, so that AB nanoalloys are initially formed and then covered by the major atoms in the later stages of growth.24 Ag@Au nanoalloys have been produced in the gas phase by subsequent aggregation in helium droplets,27 whereas in wet-chemistry synthesis experiments, intermixed Ag@Au and Au@Ag nanoalloys have been produced.9,28
Non-equilibrium structures are expected to naturally evolve towards equilibrium. Therefore, the core@shell nanoalloys made of miscible metals should transform into some kind of intermixed chemical ordering if they are left to evolve for sufficiently long times. At present, very little is known about the evolution pathways of these nanoalloys.
In this paper we simulate the evolution of AgAu, PtPd and AuCu nanoparticles from core@shell initial configurations by molecular dynamics (MD) simulations. All these systems are highly miscible, so that core@shell configurations of both types (B@A and A@B) are expected to be out of equilibrium.
AgAu, PtPd and AuCu are chosen because they are representative of different trends.
With regards to macroscopic samples, in both AgAu![[thin space (1/6-em)]](https://www.rsc.org/images/entities/char_2009.gif) 29 and PtPd
29 and PtPd![[thin space (1/6-em)]](https://www.rsc.org/images/entities/char_2009.gif) 30,31 there is evidence in favour of the formation of solid solutions for all compositions, without evidence of miscibility gaps31,32 or of the stabilization of ordered phases. On the other hand, in AuCu, there is strong miscibility with the formation of ordered phases33 around different compositions, such as the L10 phase at equicomposition and the L12 phase at 1
30,31 there is evidence in favour of the formation of solid solutions for all compositions, without evidence of miscibility gaps31,32 or of the stabilization of ordered phases. On the other hand, in AuCu, there is strong miscibility with the formation of ordered phases33 around different compositions, such as the L10 phase at equicomposition and the L12 phase at 1![[thin space (1/6-em)]](https://www.rsc.org/images/entities/char_2009.gif) :
:![[thin space (1/6-em)]](https://www.rsc.org/images/entities/char_2009.gif) 3 and 3
3 and 3![[thin space (1/6-em)]](https://www.rsc.org/images/entities/char_2009.gif) :
:![[thin space (1/6-em)]](https://www.rsc.org/images/entities/char_2009.gif) 1 compositions.
1 compositions.
These systems differ also in the lattice mismatch between the elements, which is negligible in AgAu (0.2%), small in PtPd (0.9%) and very large in AuCu (11.4%) (see for example ref. 34). In addition, the difference in bulk cohesive energy per atom (Ecoh) is small in AuCu (EAucoh − ECucoh = 0.32 eV), intermediate in AgAu (EAucoh − EAgcoh = 0.86 eV) and large in PtPd (EPtcoh − EPdcoh = 1.95 eV).35
In order to check the approach to equilibrium at different temperatures, the results of the MD simulations are compared to those of Monte Carlo (MC) simulations of the equilibrium chemical ordering in the truncated octahedral (TO) and icosahedral (Ih) structures.
2 Model and methods
The nanoparticles are modelled by a many-body atomistic force field developed within the second-moment approximation to the tight-binding model,36–38 also known as Gupta potential.39 Form and parameters of the potential are available in ref. 40 and 41 for AgAu and PtPd and in ref. 42 for AuCu. These force fields have been favourably tested against experiments and density-functional theory calculations for AuCu and PtPd in previous work in our group.25,42,43 For AgAu, our model predicts correctly the tendency of these metals to form solid solutions, with some Ag enrichment of the surface layer. This generally agrees well with the experimental results for nanoparticle sizes of a few nanometres,32 while for small sizes DFT calculations have shown that charge-transfer effects, not included in the Gupta model, can counterbalance to some extent this trend towards Ag surface segregation, especially in icosahedral structures.44In our MD simulations, the classical equations of motion are solved by the velocity Verlet algorithm45 with a time step of 5 fs. In all cases, the duration of the simulations is 10 μs. The simulations are made at constant temperature, keeping temperature constant using an Andersen thermostat46 whose collision frequency is chosen in such a way that diffusive properties of atoms are not altered.47
Simulations are made at different temperatures, whose range depends on the system. For each temperature, we perform at least three independent simulations, if not otherwise specified.
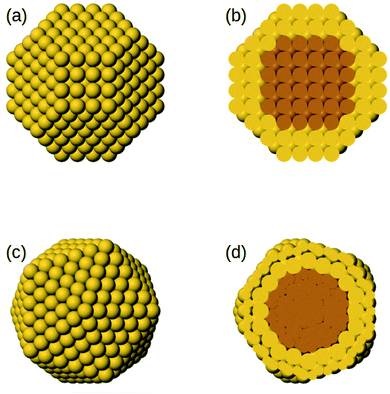
The initial core@shell structures of the MD simulations are chosen as follows. For all systems, we consider truncated octahedra of 586 atoms in which the shell has a thickness of 2 atomic layers, which corresponds to 140 and 446 atoms in the core and in the shell, respectively (see Fig. 1). Specifically, the surface is made of 272 atoms and the subsurface of 174 atoms. For each AB bimetallic system, both A@B and B@A initial configurations are considered, which correspond to the two different compositions A140B446 and A446B140. For AuCu, in which there is a large lattice mismatch, we consider also an icosahedral structure of 561 atoms, with a shell of two layers, corresponding to 147 and 414 atoms in the core and in the shell, respectively. In this case, the surface is made of 252 atoms and the subsurface of 162 atoms. Also in this case, both core@shell types are considered, namely Au@Cu at composition Au147Cu414 and Cu@Au at composition Au414Cu147. The icosahedral structure is considered because previous simulations of phase-separating systems with lattice mismatch have shown that the kinetics of the approach to equilibrium depend on the nanoparticle shape;48 here we want to check whether this effect is also present in miscible systems.
MC simulations are performed in the canonical ensemble (constant temperature). Atomic displacements and exchanges between two atoms of different species are proposed and accepted according to a Metropolis sampling,49 which insures we reach the Boltzmann distribution of the chemical configurations at equilibrium and at a given temperature. Atomic displacements are randomly proposed inside a sphere centered on the atomic position of the randomly selected atom to move. The maximum displacement amplitude varies with temperature, typically around  , d being the lattice parameter in Angstroms, which means from 0.8 Å at room temperature to 1.2 Å at 600 K. The number of atoms of each element remains constant in the cluster. Equilibrium configurations are determined at different temperatures, by slowly increasing or decreasing the temperature, typically 20 K by 20 K each 3000 macrosteps. Averages to characterize the equilibrium configurations are performed after 1000 macrosteps and integrated over 2000 macrosteps. Each macrostep consists of proposing either one displacement or one chemical exchange randomly to any atom of the cluster. We propose more displacements than exchanges. If Msteps is the number of macrosteps, ndep and nex the number of displacements and chemical exchanges per atom, the number of microsteps Nsteps is equal to:
 | (1) |
3 Results
In the following, the approach to equilibrium chemical ordering is monitored by calculating the number of mixed nearest-neighbour bonds, and the number of surface and subsurface atoms of the minority component. Structural transformations are singled out by means of the common neighbour analysis signatures,50 as explained in ref. 51.3.1 AgAu
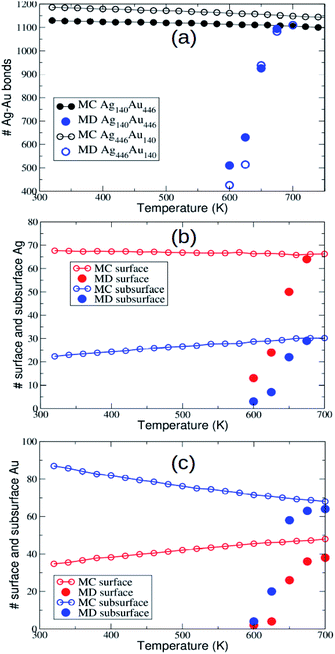
In AgAu, the evolution towards intermixing takes place within the initial fcc motif without relevant shape changes. Only some surface rearrangements and the formation/disappearance of stacking faults are observed during the simulations. Interdiffusion takes place on average in an isotropic way. As the simulation temperature increases, the MD final configurations get closer and closer to the equilibrium chemical ordering, as shown by the comparison between MD and MC data for mixed nearest-neighbour bonds, and for the number of minority surface and subsurface atoms (see Fig. 2). Here, MD data are obtained by averaging the quantities over the last microseconds of the simulations.On our MD time scale of 10 μs, an almost perfect equilibration is achieved at T = 675 K and T = 700 K for Ag140Au446 and Ag446Au140, respectively, whereas for temperatures below 600 K interdiffusion is negligible. These results indicate rather similar interdiffusion rates for both compositions. We note that, as expected, the data in Fig. 2(b and c) show that Au and Ag atoms have a certain preference for subsurface and surface sites, respectively.
3.2 PtPd
The PtPd system is characterized on average by stronger cohesion and by considerably higher melting temperatures than both AgAu and AuCu,34,35 especially on the Pt-rich side. For this reason, we expect that diffusion processes are activated at higher temperatures than in AgAu and AuCu. As a consequence, the temperature ranges in which we simulate our systems are higher, up to 900 K for Pt140Pd446 and to 1050 K for Pt446Pd140.Equilibrium surface enrichment in Pd is found in our model and in other atomistic models,25,52 and it is supported by the results of experiments and DFT calculations.21,53 Our model also predicts subsurface enrichment in Pt,25 in agreement with results in the literature.54
With regards to the evolution of the nanoparticle shapes, our simulations never show transformations from the fcc motif to decahedral (Dh) or Ih motifs. This is in agreement with the experimental evidence, since Dh and Ih structures are quite rarely observed in pure Pt![[thin space (1/6-em)]](https://www.rsc.org/images/entities/char_2009.gif) 6 and pure Pd
6 and pure Pd![[thin space (1/6-em)]](https://www.rsc.org/images/entities/char_2009.gif) 55 nanoparticles, and in their nanoalloys.25,56 In our simulations, only the formation of defects, such as islands on stacking fault sites6 and twin planes, is observed.
55 nanoparticles, and in their nanoalloys.25,56 In our simulations, only the formation of defects, such as islands on stacking fault sites6 and twin planes, is observed.
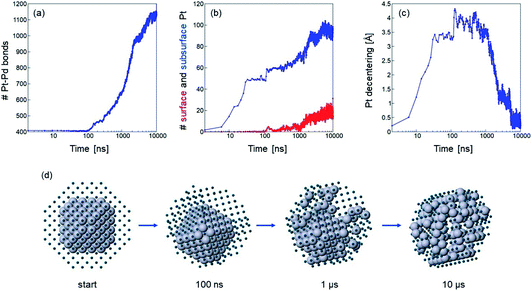
If temperature is sufficiently high, the evolution of chemical ordering is quite significant, and, in the case of Pt140Pd446, it takes place by a somewhat unexpected two-stage process. This process is shown in Fig. 3, which reports (a–c) data and (d) snapshots of the evolution in a representative simulation at T = 900 K.
In the first stage of the evolution, which takes place in the interval 10–40 ns in our three simulations at 900 K, the Pt core does not change its shape, but shifts from a central to an off-center position, in which the geometric center of the Pt core is displaced by about 3.5 Å from the geometric center of the whole nanoparticle (see Fig. 3(c)). In this off-center position, some facets of the Pt core occupy the subsurface layer, i.e. they are covered by a Pd-skin.57,58 Correspondingly, the number of Pt–Pd bonds does not change at all, but the number of subsurface Pt atoms steadily increases (see Fig. 3(a and b)). This first transformation is accompanied by a relatively modest energy gain of about 5 eV, but the structure still remains quite far from the equilibrium chemical ordering.
The off-center displacement of the Pt core is caused exclusively by the motion of Pd atoms around it, to reach a conformation of the shell that allows a better rearrangement of Pd atoms around the Pt core, because of the freedom of surface Pd atoms to relax their positions.
In the second stage, which takes place gradually from about 100 ns onwards, we observe interdiffusion of Pt and Pd atoms, which finally leads to an almost complete dissolution of the Pt core into the Pd matrix. The number of Pt–Pd bonds strongly increases, together with the number of subsurface Pt atoms, and the geometric center of the Pt atoms finally becomes close to that of the whole nanoparticle (see again Fig. 3(a–c)). A few Pt atoms finally appear in the surface layer. The energy gain in the second stage is more substantial – about 15 eV.
The whole evolution of the Pt core can be observed in Fig. 3(d).
At lower temperatures, the kinetics are slower and therefore the simulations reproduce only a part of the evolution observed at T = 900 K. Completion of the first stage may take about 1 μs and several μs at T = 800 and 750 K, respectively, while the second stage only just begins. At T = 700 K, even the first stage is not completed within the 10 μs time scale.
Pt@Pd and (PtPd)@Pd nanoparticles with off-center cores have been observed in several experiments.15,17–19,25,43 In these experiments, the nanoparticles have been grown in isotropic environments, so that the cause of the symmetry breaking leading to the off-center cores is not obvious. The mechanism revealed by our simulations could explain why these structures form, along with their long-lasting metastability.
In Pt446Pd140, the simulations show a progressive dissolution of the initial Pd core into the Pt matrix, which takes place on average in an isotropic way. In Fig. 4 we show (a–c) data and (d) snapshots of the evolution in a representative simulation at T = 1050 K. Pd atoms are able to move towards the nanoparticle surface, and, after a few tens of nanoseconds, they begin to appear at the surface. At the end of the simulation, the majority of Pd atoms have reached the surface (see Fig. 4(b)). During this process, the energy of the nanoparticle progressively decreases. This kind of behaviour is very similar to the one observed in all simulations of AgAu, so that the pathway shown in Fig. 4(d) is qualitatively representative of the evolution of both Ag@Au and Au@Ag structures.
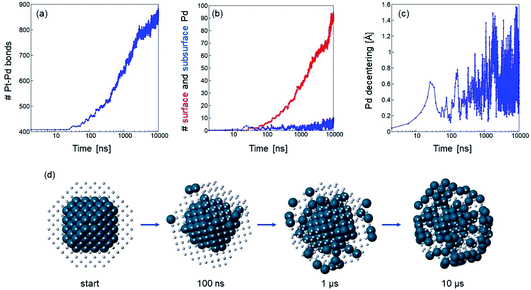 | ||
| Fig. 4 Evolution of truncated octahedral Pt446Pd140 from a Pd@Pt configuration in a simulation at T = 1050 K. Time evolution of (a) number of Pt–Pd nearest-neighbour bonds, (b) number of Pd surface (red) and subsurface (blue) atoms and (c) distance between the geometric center of Pd atoms alone and geometric center of the whole nanoparticle. Note that the distances in (c) are much smaller than those in the corresponding Pt@Pd case (Fig. 3(c)). (d) Representative snapshots from the simulation at different times. Pt and Pd atoms are coloured in grey and blue, respectively. Pt atoms are represented as small spheres to show the evolution of the Pd core. | ||
The number of Pd atoms in the subsurface is always small (see Fig. 4(b)), indicating that their diffusion from the subsurface to the surface is relatively quick. At variance with the previous case of Pt140Pd446, there is no indication of a significant displacement of the core to off-center positions, as the distance between the geometric center of the Pd atoms and the geometric center of the whole nanoparticle oscillates during the simulation, and never exceeds 1.6 Å (see Fig. 4(c)). At lower temperatures the evolution is slower but of the same type as at T = 1050 K.
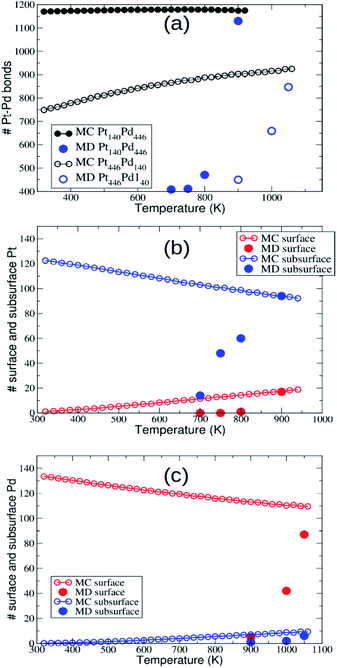
Now we check whether the evolution of the nanoparticles during the MD simulations has brought them to the equilibrium chemical ordering. As shown in ref. 43, in PtPd the equilibration of chemical ordering is much slower than that of nanoparticle shape, so that it is not warranted that it can be obtained on our time scale of 10 μs. In Fig. 5 we report the temperature dependent behaviour of the number of mixed nearest-neighbour bonds, and of the number of minority surface and subsurface atoms. Data in Fig. 5 clearly show that at the highest temperatures (900 K for Pt140Pd446 and 1050 K for Pt446Pd140) the chemical ordering obtained in the MD simulations is quite close to equilibrium, while it becomes progressively farther from equilibrium at lower temperatures.
3.3 AuCu
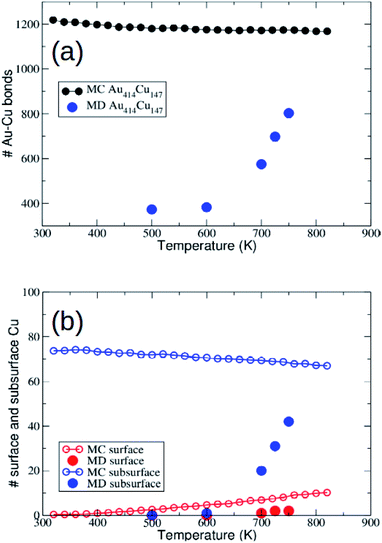
As explained in Section 2, the AuCu system exhibits a relatively large lattice mismatch, therefore we may expect different equilibration kinetics of chemical ordering in TO and Ih structures.48 However, as we will see below, this will not be the only difference in the evolution starting from these structures.In Fig. 6 we report the number of mixed nearest-neighbour Au–Cu bonds and the number of Cu surface and subsurface atoms. Our MD simulations on the scale of 10 μs show a significant increase of intermixing for T ≥ 700 K. In fact, the number of mixed bonds increases from the value 408 of the perfect Cu@Au structure to 600 and more. This is mainly due to the displacement of the Cu atoms from the core to the subsurface layer, which corresponds to the reverse displacement of the Au atoms. On the other hand, the number of Cu atoms in the surface layer remains very limited.
The comparison between MD and MC data shows that MD simulations are not able to fully reach the equilibrium chemical ordering, even at the highest MD simulation temperature of 750 K. Note that for T > 750 K the structure enters the melting range.
In the following, we analyze whether the evolution of the chemical ordering depends on the shape of the nanoparticle.
First, we notice that in the simulations starting from the TO motif the evolution towards intermixing is much faster than in the simulations starting from the Au414Cu147 icosahedron of Section 3.3.1. This is evident in the range 500–600 K, where in Au414Cu147 the number of mixed bonds stays essentially constant up to the end of the simulation (see Fig. 6(a)), while in Au446Cu140 the number of mixed bonds almost doubles in 10 μs (see Fig. 7). This is a clear indication of the slower approach to equilibrium of chemical ordering in Cu@Au Ih than in Cu@Au fcc structures.
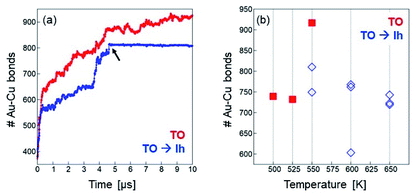 | ||
| Fig. 7 (a) Time dependence of the number of Au–Cu bonds in two simulations starting from a Cu@Au TO of composition Au446Cu140. Simulation temperature is 550 K. In the first simulation (red curve) the structure remains in the TO motif till the end, while in the second simulation (blue curve) a TO → Ih transformation takes place between 4 and 5 μs. The black arrow indicates the moment at which the transformation occurs, which corresponds to a meaningful change in the time evolution of the mixed bonds. (b) Final number (averaged over the last microseconds of the simulation) of nearest neighbour Au–Cu bonds. Red squares correspond to simulations in which the structure remains in the TO motif, whereas blue diamonds correspond to simulations in which the TO → Ih transformation takes place at some stage. Note that more than 1000 Au–Cu nearest-neighbour bonds are expected at equilibrium (see Fig. 6(a)), a value which is significantly larger than those of the MD simulations. | ||
A striking confirmation of this fact is found in Fig. 7(a), in which the number of mixed bonds is plotted as a function of time in two simulations of Au446Cu140 at 550 K. In one of these simulations, the cluster keeps the fcc structure till the end, while in the other simulation, a TO → Ih transformation takes place at t ≃ 4.7 μs. Once the transformation is accomplished, the evolution of chemical ordering essentially stops, with the number of mixed bonds keeping a constant value.
The slower diffusion of Cu atoms from the core of the Ih is due to the compression of inner sites in that structure.59 The displacement of the small Cu atoms from the central part of the Ih, and, correspondingly, the displacement of the large Au atoms in their place, cause an increase of stress in the structure that partially counterbalances the driving force towards intermixing of the two metals. As a result, interdiffusion is more difficult in the Ih than in the fcc structures.
The blocking of chemical ordering evolution in Ih structures has some unexpected consequences. With increasing temperature, the TO → Ih transformation takes places more and more rapidly, so that the fast evolution of chemical ordering is mostly limited to the ever shorter time intervals of persistence of the fcc structure, and it is nearly blocked afterwards. Therefore, the increase of temperature does not produce a faster approach to equilibrium chemical ordering, but almost the opposite (see Fig. 7(b)). This is quite a surprising result of the interplay between interdiffusion and shape changes in determining the kinetics of the approach to equilibrium.
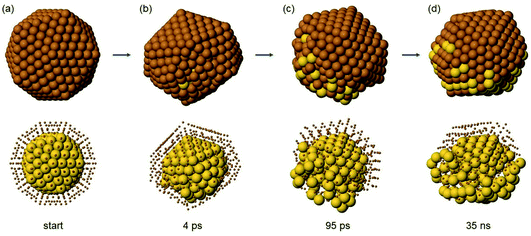
In Ih Au147Cu414 (Fig. 8) one half of the structure is heavily distorted at the very beginning of the evolution (Fig. 8(b)), while the other half keeps its Ih shape. Immediately after (Fig. 8(c)), several Au atoms are ejected into the surface layer, but only in the distorted half, while no Au atoms appear on the surface of the Ih half. This is followed by a stage in which the distorted half becomes gradually less disordered (Fig. 8(d)), leading to the formation of a highly defective Ih, which gradually evolves into a multidecahedron60,61 (not shown in the figure), and then to a Dh by mechanisms similar to those described in ref. 61. In the evolution, transitions back and forth from decahedra to bidecahedra are frequently observed. Only in one simulation does the defective Ih structure evolve back to a perfect Ih.
While the initial ejection of Au atoms to the surface is very fast, once the structure returns back to a more ordered shape, diffusion of Au becomes much slower.
At the end of the simulations (i.e. at t = 10 μs) at 600 K, about half of the Au atoms are either in the surface or in the subsurface layers. In the simulations at T = 650 and 700 K, the observed evolution mechanisms are of the same type, but the final numbers of subsurface and surface Au atoms is larger.
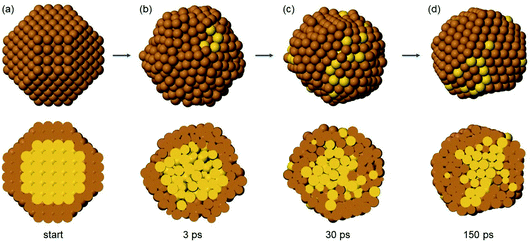
In TO Au140Cu446 (Fig. 9), the initial evolution leads to liquid-like structures, isotropically disordered on all sides (Fig. 9(b)). Correspondingly, the ejection of Au atoms to the surface layer is not one-sided as in Au147Cu414, but isotropic (Fig. 9(c)). The transition to liquid-like structures has been observed in previous simulations of phase-separating AuCo and AgNi nanoalloys evolving from intermixed configurations.48 The liquid-like structures then transform back to solid structures (Fig. 9(d)), that are in all cases imperfect Ih, which then relatively quickly evolve into multidecahedra and finally into Dh (not shown in the figure). As in the previous case, transitions back and forth from decahedra to bidecahedra are frequently observed.
4 Conclusions
The evolution of AgAu, PtPd and AuCu from core–shell configurations towards intermixing occurs through quite different pathways.In AgAu and PtPd, where lattice mismatch is negligible or small, respectively, the evolution takes place within the initial structural motif, which is the fcc truncated octahedron. Structural defects such as stacking faults are often formed, but the final nanoparticle shapes resemble the initial ones.
However, evolution of chemical ordering takes place by different pathways in Ag@Au, Au@Ag and Pd@Pt on one side, and in Pt@Pd on the other side.
In Ag@Au, Au@Ag and Pd@Pt, the core atoms exchange with the shell atoms to produce isotropic diffusion by which intermixing gradually increases. As expected on the basis of cohesive energies, diffusion is faster in AgAu than in PdPt, so that in the latter system the typical onset temperatures for interdiffusion are significantly higher.
In Pt@Pd, the evolution of chemical ordering takes place by two steps. Shell atoms are much more mobile than core atoms, also because of the much lower cohesion of Pd compared to Pt. These shell atoms gradually rearrange in such a way that the shell becomes asymmetric and the Pt core is displaced to a subsurface position, which, according to our model, is energetically more favorable than the symmetrically centered position. These off-center core positions are however metastable, so that they evolve at a later stage into intermixed configurations, that are initially somewhat asymmetric, and then progressively become symmetric. Pt@Pd nanoparticles with off-center cores have been observed in several experiments,15,17–19,25,43 which support the long-lifetime metastability of these configurations.
The AuCu system is characterized by a large lattice mismatch. At equilibrium, the larger Au atoms tend to enrich the surface, whereas Cu atoms enrich the subsurface layer, and in icosahedra, also the central part of the nanoparticle, where they can decrease the stress of the structure.
In Au414Cu147 and Au446Cu140, icosahedral shapes are energetically more favorable than truncated octahedra, even for size 586 which is a geometric ‘magic’ size for the TO. The initial truncated octahedral Cu@Au shapes therefore tend to transform into icosahedra, in which diffusion of Cu atoms from the core to the shell (and correspondingly of Au atoms from the shell to the core) is almost prevented. The TO → Ih shape transformation, and the corresponding stop of interdiffusion, takes place on shorter and shorter time scales as temperature increases. As a consequence, one finds a quite counterintuitive result – the approach to equilibrium chemical ordering is not accelerated by the temperature increase.
In Au147Cu414 and Au140Cu446 the initial Au@Cu structures present very high compression in the core, so that they evolve very quickly into disordered shapes. During the disordering process, several Au atoms are ejected to the nanoparticle surface to release the internal stress. In truncated octahedral Au140Cu446, the disordered structures are isotropic and liquid-like. In icosahedral Au147Cu414 only half of the structure becomes disordered, and Au atoms are ejected only through the disordered part. In all cases, the nanoparticles eventually evolve into more ordered shapes, which are mostly decahedral. After this stage, the diffusion of Au atoms to the surface is considerably slowed down.
In conclusion, the evolution of these nanoparticles from initial core@shell configurations to their equilibrium intermixed chemical ordering arises from a complex interplay between interdiffusion of atoms and shape rearrangements, whose effects are especially exemplified by the highly non-trivial evolution pathways of Pt@Pd, Cu@Au and Au@Cu structures.
Author contributions
DN performed and analyzed the MD simulations. CM performed and analyzed the MC simulations. RF assisted in the analysis of the simulations and supervised the work. All authors contributed to the drafting of the paper.Conflicts of interest
There are no conflicts to declare.Acknowledgements
The authors acknowledge the networking support from the International Research Network Nanoalloys of CNRS. DN and RF acknowledge financial support from the project “Understanding and Tuning FRiction through nanOstructure Manipulation (UTFROM)” (grant 20178PZCB5), funded by MIUR within the program “Progetti di Ricerca di Rilevante Interesse Nazionale (PRIN) Bando 2017”, and from the Progetto di Eccellenza of the Physics Department of the University of Genoa.Notes and references
- R. Ferrando, Structure and Properties of Nanoalloys, Elsevier, 2016 Search PubMed.
- F. Baletto and R. Ferrando, Rev. Mod. Phys., 2005, 77, 371–423 CrossRef CAS.
- L. D. Marks and L. Peng, J. Phys.: Condens. Matter, 2016, 28, 053001 CrossRef CAS.
- Z. W. Wang and R. E. Palmer, Phys. Rev. Lett., 2012, 108, 245502 CrossRef CAS.
- F. Baletto, C. Mottet and R. Ferrando, Phys. Rev. B: Condens. Matter Mater. Phys., 2001, 63, 155408 CrossRef.
- Y. Xia, D. Nelli, R. Ferrando, J. Yuan and Z. Y. Li, Nat. Commun., 2021, 12, 3019 CrossRef PubMed.
- Y. Wang, S. Xie, J. Liu, J. Park, C. Z. Huang and Y. Xia, Nano Lett., 2013, 13, 2276–2281 CrossRef CAS PubMed.
- D. M. Wells, G. Rossi, R. Ferrando and R. E. Palmer, Nanoscale, 2015, 7, 6498–6504 RSC.
- N. Ahmad, M. Bon, D. Passerone and R. Erni, ACS Nano, 2019, 13, 13333–13342 CrossRef CAS.
- D. V. Goia and E. Matijevic, New J. Chem., 1998, 22, 1203 RSC.
- G. Schmid, A. Lehnert, J. Malm and J. Bovin, Angew. Chem., Int. Ed. Engl., 1991, 30, 874–876 CrossRef.
- F.-R. Fan, D.-Y. Liu, Y.-F. Wu, S. Duan, Z.-X. Xie, Z.-Y. Jiang and Z.-Q. Tian, J. Am. Chem. Soc., 2008, 130, 6949–6951 CrossRef CAS.
- R. Ghosh Chaudhuri and S. Paria, Chem. Rev., 2012, 112, 2373–2433 CrossRef CAS PubMed.
- I. Karakaya and W. T. Thompson, Bull. Alloy Phase Diagrams, 1988, 9, 237–243 CrossRef.
- S. I. Sanchez, M. W. Small, J.-m. Zuo and R. G. Nuzzo, J. Am. Chem. Soc., 2009, 131, 8683–8689 CrossRef CAS PubMed.
- S. I. Sanchez, M. W. Small, E. S. Bozin, J.-G. Wen, J.-M. Zuo and R. G. Nuzzo, ACS Nano, 2013, 7, 1542–1557 CrossRef CAS PubMed.
- A. Medina-Mendoza, C. Angeles-Chavez, M. Cortes-Jacome and J. Toledo-Antonio, Mater. Chem. Phys., 2019, 228, 303–309 CrossRef CAS.
- C. A. Rodríguez-Proenza, J. P. Palomares-Báez, M. A. Chávez-Rojo, A. F. García-Ruiz, C. L. Azanza-Ricardo, A. Santoveña-Uribe, G. Luna-Bárcenas, J. L. Rodríguez-López and R. Esparza, Materials, 2018, 11, 1882 CrossRef.
- C. K. Narula, X. Yang, C. Li, A. R. Lupini and S. J. Pennycook, J. Phys. Chem. C, 2015, 119, 25114–25121 CrossRef CAS.
- M. Tang, B. Zhu, J. Meng, X. Zhang, W. Yuan, Z. Zhang, Y. Gao and Y. Wang, Mater. Today Nano, 2018, 1, 41–46 CrossRef.
- R. M. Anderson, L. Zhang, J. A. Loussaert, A. I. Frenkel, G. Henkelman and R. M. Crooks, ACS Nano, 2013, 7, 9345–9353 CrossRef CAS PubMed.
- C.-H. Chen, L. S. Sarma, J.-M. Chen, S.-C. Shih, G.-R. Wang, D.-G. Liu, M.-T. Tang, J.-F. Lee and B.-J. Hwang, ACS Nano, 2007, 1, 114–125 CrossRef CAS.
- S. Liu, Z. Sun, Q. Liu, L. Wu, Y. Huang, T. Yao, J. Zhang, T. Hu, M. Ge, F. Hu, Z. Xie, G. Pan and S. Wei, ACS Nano, 2014, 8, 1886–1892 CrossRef CAS.
- T.-W. Liao, A. Yadav, K.-J. Hu, J. van der Tol, S. Cosentino, F. D’Acapito, R. E. Palmer, C. Lenardi, R. Ferrando, D. Grandjean and P. Lievens, Nanoscale, 2018, 10, 6684–6694 RSC.
- D. Nelli, A. Krishnadas, R. Ferrando and C. Minnai, J. Phys. Chem. C, 2020, 124, 14338–14349 CrossRef CAS.
- T.-W. Liao, A. Yadav, P. Ferrari, Y. Niu, X.-K. Wei, J. Vernieres, K.-J. Hu, M. Heggen, R. E. Dunin-Borkowski, R. E. Palmer, K. Laasonen, D. Grandjean, E. Janssens and P. Lievens, Chem. Mater., 2019, 31, 10040–10048 CrossRef CAS.
- G. Haberfehlner, P. Thaler, D. Knez, A. Volk, F. Hofer, W. E. Ernst and G. Kothleitner, Nat. Commun., 2015, 6, 8779 CrossRef CAS.
- Z. Y. Li, J. P. Wilcoxon, F. Yin, Y. Chen, R. E. Palmer and R. L. Johnston, Faraday Discuss., 2008, 138, 363–373 RSC.
- H. Okamoto and T. B. Massalski, Bull. Alloy Phase Diagrams, 1983, 4, 30 CrossRef.
- H. Okamoto, J. Phase Equilib., 1991, 12, 617–618 CrossRef.
- Y. Lee, P. Stender, S. M. Eich and G. Schmitz, Microsc. Microanal., 2021, 1–11 Search PubMed.
- G. Guisbiers, R. Mendoza-Cruz, L. Bazán-Díaz, J. J. Velázquez-Salazar, R. Mendoza-Perez, J. A. Robledo-Torres, J.-L. Rodriguez-Lopez, J. M. Montejano-Carrizales, R. L. Whetten and M. José-Yacamán, ACS Nano, 2016, 10, 188–198 CrossRef CAS PubMed.
- H. Okamoto, D. J. Chakrabarti, D. E. Laughlin and T. B. Massalski, J. Phase Equilib., 1987, 8, 454–474 CrossRef CAS.
- https://www.webelements.com .
- C. Kittel, Introduction to Solid State Physics, University of California, Berkeley, 2005 Search PubMed.
- F. Cyrot-Lackmann and F. Ducastelle, Phys. Rev. B: Solid State, 1971, 4, 2406–2412 CrossRef.
- F. Cleri and V. Rosato, Phys. Rev. B: Condens. Matter Mater. Phys., 1993, 48, 22 CrossRef CAS PubMed.
- V. Rosato, M. Guillopé and B. Legrand, Philos. Mag. A, 1989, 59, 321 CrossRef.
- R. P. Gupta, Phys. Rev. B: Condens. Matter Mater. Phys., 1981, 23, 6265 CrossRef CAS.
- E. y. El koraychy, D. Nelli, C. Roncaglia, C. Minnai and R. Ferrando, Eur. Phys. J.: Appl. Phys., 2022, 97, 28 CrossRef CAS.
- A. Rapallo, G. Rossi, R. Ferrando, A. Fortunelli, B. C. Curley, L. D. Lloyd, G. M. Tarbuck and R. L. Johnston, J. Chem. Phys., 2005, 122, 194308 CrossRef PubMed.
- J. Q. Goh, J. Akola and R. Ferrando, J. Phys. Chem. C, 2017, 121, 10809–10816 CrossRef CAS.
- D. Nelli, M. Cerbelaud, R. Ferrando and C. Minnai, Nanoscale Adv., 2021, 3, 836–846 RSC.
- D. Rapetti and R. Ferrando, J. Alloys Compd., 2019, 779, 582–589 CrossRef CAS.
- M. P. Allen and D. J. Tildesley, Computer Simulation of Liquids, Clarendon, Oxford, 1987 Search PubMed.
- H. C. Andersen, J. Chem. Phys., 1980, 72, 2384 CrossRef CAS.
- F. Baletto, C. Mottet and R. Ferrando, Surf. Sci., 2000, 446, 31–45 CrossRef CAS.
- D. Nelli and R. Ferrando, Nanoscale, 2019, 11, 13040–13050 RSC.
- N. Metropolis, A. Metropolis, M. Rosenbluth, A. Teller and E. Teller, J. Chem. Phys., 1953, 21, 1087 CrossRef CAS.
- D. Faken and H. Jónsson, Comput. Mater. Sci., 1994, 2, 279 CrossRef CAS.
- C. Roncaglia, D. Rapetti and R. Ferrando, Phys. Chem. Chem. Phys., 2021, 23, 23325–23335 RSC.
- A. Front and C. Mottet, Theor. Chem. Acc., 2022, 141, 2 Search PubMed.
- T. L. Tan, L.-L. Wang, D. D. Johnson and K. Bai, Nano Lett., 2012, 12, 4875–4880 CrossRef CAS PubMed.
- A. D. Clercq, S. Giorgio and C. Mottet, J. Phys.: Condens. Matter, 2016, 28, 064006 CrossRef.
- D. Nelli, C. Roncaglia, R. Ferrando and C. Minnai, J. Phys. Chem. Lett., 2021, 12, 4609–4615 CrossRef CAS PubMed.
- D. Nelli, C. Roncaglia, S. Ahearn, M. Di Vece, R. Ferrando and C. Minnai, Catalysts, 2021, 11, 718 CrossRef CAS.
- V. R. Stamenkovic, B. Fowler, B. S. Mun, G. Wang, P. N. Ross, C. A. Lucas and N. M. Marković, Science, 2007, 315, 493–497 CrossRef CAS PubMed.
- E. Panizon and R. Ferrando, Nanoscale, 2016, 8, 15911–15919 RSC.
- D. Bochicchio and R. Ferrando, Phys. Rev. B: Condens. Matter Mater. Phys., 2013, 87, 165435 CrossRef.
- G. Rossi and R. Ferrando, Nanotechnology, 2007, 18, 225706 CrossRef.
- D. Nelli, G. Rossi, Z. Wang, R. E. Palmer and R. Ferrando, Nanoscale, 2020, 12, 7688–7699 RSC.
| This journal is © The Royal Society of Chemistry 2023 |

