 Open Access Article
 This Open Access Article is licensed under a
 Creative Commons Attribution 3.0 Unported Licence
Structural and optical characterization of nanoalloys mixing gold or silver with aluminium or indium: evolution under various reactive environments†
Élise
Camus
a,
Michel
Pellarin
a,
Nicholas
Blanchard
a,
Olivier
Boisron
a,
Matthias
Hillenkamp
 a,
Lucian
Roiban
b,
Pascal
Andreazza
c and
Emmanuel
Cottancin
*a
a,
Lucian
Roiban
b,
Pascal
Andreazza
c and
Emmanuel
Cottancin
*a
aUniv. Lyon 1, CNRS, iLM, UMR 5306, F- 69622 Villeurbanne, France. E-mail: emmanuel.cottancin@univ-lyon1.fr
bUniv Lyon, INSA Lyon, UCBL, CNRS, MATEIS, UMR5510, F-69621 Villeurbanne, France
cUniversité d’Orléans, CNRS, ICMN, UMR7374, F-45071 Orléans, France
First published on 22nd June 2022
Abstract
In this study, the atomic and chemical structure and the optical response of AxB1−x bimetallic nanoparticles (BNPs) combining gold or silver (A) with aluminium or indium (B) were investigated at various stoichiometries in order to examine if stable alloyed phases could exist and promote the emergence of localized surface plasmon resonance (LSPR) in the UV range. The structure and morphology of BNPs of a few nanometres, produced by laser vaporization, were analysed by transmission electron microscopy (TEM) and optical absorption measurements were performed on matrix-embedded BNPs. Information about the oxidation state of the BNPs can be inferred from a comparison between experimental optical spectra and Mie calculations in the dipolar approximation. The BNPs’ internal structures were further investigated by additional characterization techniques. Firstly, in situ X-ray photoelectron spectroscopy provided information about the chemical state of the constituent elements and their evolution with time. Secondly, synchrotron-based X-ray scattering techniques were performed on Ag–Al BNPs in a wide-angle configuration under grazing incidence, giving complementary information about structural and morphological heterogeneities in the BNPs. Finally, the restructuring of the partially oxidized Au0.33Al0.67 BNPs annealed in a reducing atmosphere was also attempted by environmental TEM. The complementary techniques of characterization show that silver-based Ag–In and Ag–Al BNPs form metallic silver-rich alloyed cores surrounded by an indium or aluminium oxide shell. The initial LSPR is in the UV range for both systems, but the difference in the kinetics of oxidation between indium and aluminium involves less blue-shifted LSPR for Ag–Al BNPs. In the case of gold-based BNPs, we show evidence of ordered nanoalloys just after air exposure and the appearance of gold and indium (or aluminium) demixing during oxidation. The initial LSPR of Au–In BNPs is the one the most in the UV range among the four systems, with an LSPR peak centred at 254 nm, which may be a sign of the formation of the Au0.33In0.67 alloy. Nevertheless, strategies to preserve BNPs from oxidation have to be developed.
A. Introduction
The optical response of a material, characterized by its dielectric function, is a tell-tale sign of its electronic structure. In metallic nanoparticles (NPs), the electronic and dielectric confinement leads to a strong resonance in the near UV-visible-IR spectral range, known as localized surface plasmon resonance (LSPR).1,2 This is essentially the result of negative values in the real part of the dielectric function, which is dominated by its Drude-like character (quasi-free conduction electrons) in the case of simple and coinage metals. Although not understood at the time, these properties have been exploited empirically for several centuries in the art of stained-glass colouring and their study has attracted much interest for over 30 years due to the possibility of fabricating them with fine control and promising applications in various fields.3–6 The LSPR characteristics are, on the one hand, known to depend on the intrinsic properties (electronic structure, size, shape) of the NPs and their surrounding medium. On the other hand, mixing two metals in the NPs gives the opportunity to tune the LSPR characteristics by altering their relative composition, which can, in addition, influence their internal structure. Moreover, as the LSPR depends on the chemical ordering in bimetallic nanoparticles (BNPs), it can also be used as a probe of their internal structure (segregation versus atomic alloying), restructuring processes under various reactive environments or even minute changes of their environment or surface (oxidation).7–9BNPs containing at least one element whose dielectric function shows a Drude-like behaviour exhibit a well-defined LSPR in the NUV–visible–NIR range. Currently, the development of nanomaterials with LSPR in the UV range is a highly active field which is rich in prospects.5,10–12 In this regard, trivalent metals (Al, In) are interesting for their UV-shifted LSPR with a good quality factor, considering that interband (IB) transitions are repelled in the far-UV range.13 However, they are strongly reactive and their LSPR is rapidly damped and red-shifted upon oxidation. Mixing them with gold or silver is a promising alternative to prevent oxidation because their phase diagrams show stable intermetallic phases that are expected to remain stable down to the nanoscale. This has previously motivated our study of silver–indium and silver–aluminium BNPs exhibiting LSPR in the UV range and for which silver-rich alloyed phases are fairly stable towards oxidation.14–16 In line with these previous works, we also investigated the optical and structural properties of gold-based Au–Al and Au–In BNPs, which are detailed further in this paper. The main difference when turning from silver to gold is a red-shift and broadening of the LSPR. Moreover, the Au–Al and Au–In systems are miscible in the bulk phase with phase diagrams analogous to those of Ag–Al and Ag–In, with the additional presence of ordered phases like AuAl, AuIn, AuAl2 and AuIn2, the last two being known as purple gold and blue gold, respectively.17 Moreover, while studies on Ag–In or Ag–Al BNPs are very scarce, Au–Al and, more specifically, Au–In systems have been investigated in more detail, either in the bulk phase18–22 or at the nanoscale.23–26 For instance, AuIn2 nanoalloys were obtained by Boyen et al. by the atomic evaporation of indium on self-assembled naked gold NPs of a rather uniform size, ranging from 0.8 to 2.9 nm.23In situ X-ray photoelectron spectroscopy showed a shift in the Au-4f photoelectron spectra after indium atomic deposition, except for 1.4 nm, corresponding to the very stable cluster Au55, leading the authors to conclude that alloying into AuIn2 had occurred for the other sizes. The oxidation of Au–In alloy nanoparticles of 2 to 20 nm in diameter was also investigated by Sutter et al.24 Bimetallic Au–In alloy nanoparticles were formed by the sequential room temperature evaporation of controlled amounts of indium and gold, before being exposed to air. Instead of a crystalline In2O3 outer shell, as previously observed in Ag–In BNPs,15 such oxidation leads to an amorphous shell of mixed Au–In oxide. This shell remains stable at high temperatures and the surface, enriched with Au, is capable of adsorbing CO and O2 to convert them to CO2. The characterization of low-Au and high-Au content BNPs showed that Au–In cores consist of the ordered alloyed structures AuIn2 and Au3In, respectively. The LSPR of Au–In BNPs was also observed at intermediate states during the formation process of oxidized Au–In BNPs.25 Au–In alloy BNPs were first obtained by combining gold NPs with indium and an LSPR emerges as a shoulder in the UV range below 350 nm. The BNPs then transform into intermetallic AuIn2 cores surrounded by a shell of amorphous indium oxide (AuIn2@InOx), before forming segregated Au–In2O3 heterodimers. The corresponding LSPR is then red-shifted because of indium oxidation.
The existence of stable ordered alloyed phases in Au–Al and Au–In BNPs, with encouraging results regarding the optical properties of AuIn2, led us to first investigate BNPs of the following compositions, Au0.50Al0.50, Au0.33Al0.67, and Au0.33In0.67, in the hope of retaining the ordered alloyed phase at the nanoscale. For Agx–Al1−x and Agx–In1−x BNPs, three compositions (x = 0.25, 0.5 and 0.75) were studied. The first results we obtained for these last systems are detailed in ref. 16 and complementary new results are reported in this manuscript, in particular results of in situ X-ray photoelectron spectroscopy and synchrotron-based X-ray scattering experiments. Indeed, the analysis of the BNP structure prior to air exposure was not possible on our setup until recently. Fortunately, it is now possible to perform in situ X-ray photoelectron spectroscopy (XPS) and analyze the chemical state of the metal atoms within the BNPs just after deposition in a chamber maintained under ultra-high vacuum. As aluminium oxidizes more rapidly than indium, we first chose to characterize Al-based BNPs (Ag–Al and Au–Al). On the other hand, as high-resolution transmission electron microscopy (HR-TEM) characterizations performed on Al-based BNPs do not allow pure metallic phases to be distinguished from alloyed phases (Au, Ag and Al have very close lattice parameters), synchrotron-based X-ray scattering spectroscopy has been performed on Al-based BNPs. Ag–Al BNPs were thus characterized by the grazing incidence wide-angle X-ray scattering technique to determine whether alloyed phases exist within the BNPs. We also present the results of TEM and optical characterizations of the four systems (Ag–In, Ag–Al, Au–In and Au–In), by more specifically focusing on Au–Al and Au–In BNPs and referring when necessary to previous results published in ref. 16 for Ag–In and Ag–Al BNPs.
B. General considerations on systems mixing gold or silver with aluminium or indium
Let us first consider the two silver-based systems: Ag–In and Ag–Al. Silver and aluminum crystallize in a face-centered cubic structure (FCC) with very close lattice parameters (4.09 Å and 4.05 Å, respectively), while indium crystallizes in a tetragonal centred structure (TC) with lattice parameters of 3.24 Å and 4.95 Å. Therefore, silver and indium can be clearly identified by HR-TEM, whereas silver and aluminium are not distinguishable. Their phase diagrams show that both Ag–In and Ag–Al systems exhibit strong miscibility, especially for high proportions of silver, for which substitute alloys (intermetallic compounds) are observed. In the case of Ag–In, the alloyed phases can be distinguished from pure silver and indium phases. For Ag–Al, the substitute phases retain an FCC structure and the alloyed phase is easily observed by HR-TEM; the ζ phase, with a stoichiometry close to Ag2Al, displays lattice distances dhkl close to those of pure silver and pure aluminium. The other one (μ phase) exhibits very low diffracted intensities, making it difficult to identify by HR-TEM.Concerning the gold-based systems, Au–In and Au–Al, we can underline that the crystallographic properties of gold and silver are similar, since gold also displays an FCC structure, with a lattice parameter of 4.08 Å. Therefore, gold and aluminium cannot be distinguished by HR-TEM either. Both mixed systems Au–In and Au–Al are miscible and their phase diagrams are similar to those of Ag–In and Ag–Al, respectively. Many defined compounds and various alloyed phases exist, especially at high gold concentrations, similar to Ag–In or Ag–Al. Table 1 shows the crystallographic characteristics of some of these alloys (a similar table is given in ref. 16 for In, Ag and Al). A remarkable feature of noble metal/trivalent metal systems involving gold is the existence of an equi-atomic compound (AuAl and AuIn, but also AuGa). Worthy of note are the defined compounds AuIn2 and AuAl2, known as “blue gold” and “purple gold”, respectively, which both crystallize as metallic salts (CaF2 structure), which can be explained by the stronger electronegativity of gold compared to silver. This structure makes them very brittle. In micro-electronics, purple gold may form in junctions and is known as the “purple plague”, because of its brittle nature.27 From a crystallographic point of view, the AuIn2 and AuAl2 alloys have characteristic interplanar distances d111 = 3.46 Å for AuAl2 and d111 = 3.75 Å and d200 = 3.25 Å for AuIn2, which should allow the unambiguous identification of these materials if they are present and well oriented in HR-TEM. For Au–In, there are several other intermetallic compounds, denoted as β, ε and γ, having hexagonal, orthorhombic and cubic structures, respectively, with indium atomic compositions of 20%, 25% and 31%, respectively.
| In | Au | Al | |
|---|---|---|---|
| r s (Å)28 | 1.83 | 1.59 | 1.59 |
| E s (J m−2)29 | 0.700 | 1.50 | 1.14 |
| λ LSPR (nm) in porous silica (dipolar approx.) | 226 | 529 | 193 |
| E LSPR (eV) | 5.48 | 2.34 | 6.42 |
| Crystallographic structure30 | BCT | FCC | FCC |
| a = 3.24 Å | a = 4.08 Å | a = 4.05 Å | |
| c = 4.95 Å | |||
| Alloys | β-Au4In (HCP),31 (a, c) = (2.92 Å, 4.80 Å) | ||
| ε-Au3In (orthorhombic),32 (a, b, c) = (5.86 Å, 4.75 Å, 5.17 Å) | |||
| γ-Au9In4 (SC),31a = 9.83 Å | |||
| AuIn (triclinic),31 (a, b, c) = (4.30 Å, 10.59 Å, 3.56 Å), (α, β, γ) = (90.54°, 90.00°, 90.17°) | |||
| AuIn2 (SC),4a = 6.50 Å | |||
| Au4Al (C),19a = 6.92 Å | |||
| Au8Al3 (HCP),33 (a, c) = (7.72 Å, 42.1 Å) | |||
| Au2Al (tetrahedral),33 (a, c) = (3.35 Å, 8.89 Å) | |||
| AuAl (monoclinic),33 (a, b, c) = (6.40 Å, 3.33 Å, 6.33 Å), β = 93.14° | |||
| AuAl2 (SC),34a = 6.00 Å | |||
| Oxides | c-In2O3 (FCC)35 | α-Al2O3 (HCP)36 | |
| h-In2O3 (HCP)35 | |||
The comparison of the surface energies of each component, as well as lattice mismatches, also yields valuable information about the possible alloyed structures at the nanoscale. Firstly, the difference in the surface energies (1.24 J m−2, 1.50 J m−2, 0.70 J m−2 and 1.14 J m−2 for silver, gold, indium and aluminium, respectively) are in favour of indium and, to a lesser extent, aluminium surface enrichment in nanoalloys mixing gold or silver with aluminium or indium. Secondly, the important lattice mismatch between silver (or gold) and indium must also favor indium surface enrichment. And since the surface energy of gold is larger than that of silver, the aluminium surface enrichment in BNPs should be more pronounced in the case of Au–Al compared to Ag–Al.
Concerning BNP reactivity towards oxidation, aluminium, indium and, to a lesser extent, silver oxidize upon air exposure and spontaneously form an oxide shell around metallic cores in NPs due to the lower surface energies of the oxides compared to those of the metals. Aluminium is the fastest oxidizing material, while silver is the slowest. Aluminium oxidation has been studied at the nanoscale, showing the formation of a passivating layer which can be of the same order as the size of the BNPs we investigated.37
C. Experimental methods
(1) Sample synthesis
The AxB1−x (A = Ag or Au, B = In or Al) BNPs of a few nanometres in diameter were produced as a beam from an alloyed target of a given composition in a high vacuum chamber with a laser vaporisation source. The laser beam of a pulsed frequency doubled Nd:YAG laser (20 Hz, 532 nm, 10 ns pulse duration) was focused at the surface of a movable target (3 mm diameter rod) and created a hot plasma quenched by a continuous helium carrier gas flow in a 2 cm3 cylindrical chamber (about 20 mbar inner pressure), inducing the growth of BNPs of various sizes. The BNP–gas mixture was ejected in a secondary vacuum chamber (5 × 10⁻⁷ mbar residual pressure) through a 0.6 mm diameter conical nozzle in the form of a supersonic beam. The emerging charged BNP beam could be deflected with a static quadrupole deviator and the BNPs were thus size-selected before deposition in a high or ultra-high vacuum chamber (see details in ref. 38 and 39). Their average size could be determined by time-of-flight mass spectrometry (TOF-MS) with an uncertainty of ±0.1 nm. The BNPs could be deposited or co-deposited simultaneously with a transparent amorphous silica matrix (200–300 nm thickness) evaporated by an electron gun on various substrates (TEM grids, nano-chips from the company DENSsolutions for environmental TEM, silicon for GIWAXS and XPS analysis or a fused silica slide for optical measurements). Co-deposition was performed by ensuring that BNPs remained in a low BNP concentration in the matrix, thus preventing coalescence and allowing a comparison of their optical absorption with calculations using Mie theory in the dipolar approximation. For GIWAXS, the size-selected BNPs were deposited under ultra-high vacuum (UHV) and then protected by a thin layer of amorphous carbon (a few nanometres) before exposure to air. For in situ XPS measurements, the samples, composed of uncoated BNPs deposited on an ultra-thin layer of carbon over silicon under ultra-high vacuum (between 5 × 10⁻¹⁰ and 10−9 mbar), were translated in another ultra-high vacuum chamber for analysis. The XPS measurements were launched a few tens of minutes after BNP fabrication.Transmission electron microscopy (TEM) experiments were performed, either with a FEI TITAN environmental (80–300 kV) transmission electron microscope operating at 300 kV in high vacuum and corrected for spherical aberrations of the objective lens (Cs corrector) or with a JEOL 2100F transmission electron microscope operating at 200 kV. The environmental mode was operated with the FEI TITAN environmental TEM microscope by direct gas injection (up to 20 mbar) near the sample. The substrates consisted in this last case of a thin film of amorphous carbon or Si3N4 deposited on a nano-chip from DENSsolutions specifically designed for the wildfire sample holder, allowing very rapid heating up to 1300 °C. Energy dispersive X-ray spectroscopy (XEDS, also abbreviated as EDX) was performed using an Oxford Instruments X-Max 80 mm2 SDD detector and the relative atomic percentages were estimated using the acquisition software’s standardless quantification method.
In situ X-ray photoelectron spectroscopy (XPS) was performed with a VG CLAM IV spectrometer using Al Kα radiation for AgAl and Mg Kα radiation for AuAl2. Wide scans and high-resolution spectra were collected with a constant pass energy of 50 and 20 eV and a step size of 1 and 0.1 eV, respectively. More details are given in the ESI.†
Grazing incidence wide angle X-ray spectroscopy (GIWAXS) measurements were carried out at the European Synchrotron Radiation Facility (ESRF) in Grenoble, France at the BM02-D2AM beamline. A photon energy of 11.91 keV was used with an angle of incidence fixed at 0.11°, which was able to reduce/optimize the analysis depth to a few nanometres without fluorescence emission. GIWAXS signals were collected with a WOS-XPAD 2D-detector, calibrated in terms of detection uniformity, spatially and energetically, and allowing a q reciprocal space vector step of detection of 0.005 nm−1. The 1D experimental scattered intensity was extracted as a function of the in-plane angle with respect to the substrate surface (defining the momentum transfer q).40,41 Then, the spectrum was compared with a simulated pattern obtained from a calculated model cluster on the basis of the Debye equation40,42 and considering the set-up geometry using a dedicated home-made software. Preliminarily, a reference pattern from a sample without particles but with a cover-layer on the substrate region was measured in the same conditions, and was subtracted from the deposited nanoparticle sample pattern. The model clusters were obtained from geometrical construction with several levels of disorder of Ag–Al atom positions or Monte Carlo (MC) simulations for Ag only, using a semi-empirical tight-binding potential. A weighted sum of the intensities from several sizes or structures was used to fit the WAXS patterns considering the size distribution coming from TEM results or TOF-MS.40,41
(2) Optical spectroscopy
The optical transmission spectra of silica-embedded BNPs deposited on fused silica were measured with a double beam PerkinElmer spectrophotometer using linearly polarized light (transverse magnetic). The sample was mounted at Brewster incidence in order to prevent Fabry–Perot interferences within the sample film. The silica matrix was shown to be slightly porous and its dielectric function was previously measured by ellipsometry; its average value was εm = 2.17, corresponding to an average optical index nm = 1.47. The experimental values of εm(λ) are used in the following for calculating the absorption spectra.D. Results and discussion
(1) TEM characterization of BNPs mixing gold or silver with aluminium or indium
The BNPs, deposited with or without the silica matrix on ultrathin amorphous carbon after size selection, were first characterized by transmission electron microscopy techniques.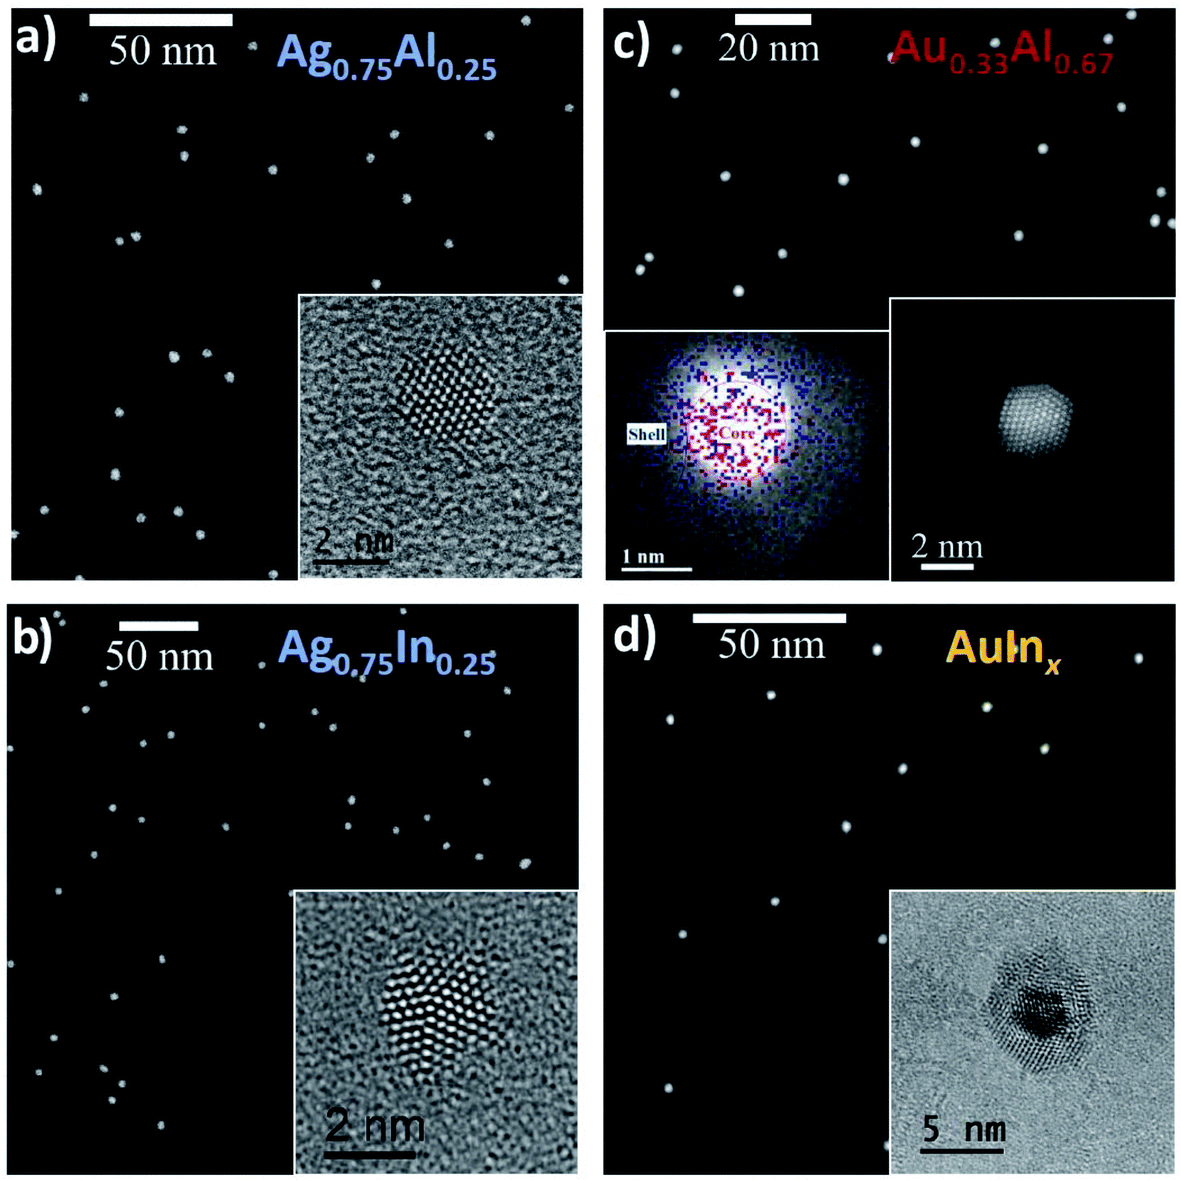 | ||
| Fig. 1 STEM-HAADF and HRTEM images of silver-based Ag0.75Al0.25, Ag0.75In0.25 BNPs and gold-based Ag0.33Al0.67 and AgInx BNPs after exposure to air. (a) Size-selected Ag0.75Al0.25 BNPs and, in the inset, the HRTEM image of a single BNP with a d-spacing of 2.34 Å (see Fig. SI6†). (b) Size-selected Ag0.75In0.25 BNPs and, in the inset, the HRTEM image of a single decahedral BNP with a d-spacing of 2.36 Å (see Fig. SI6†). (c) Size-selected Au0.33Al0.67 NPs (Ø = 4.2 nm) co-deposited in a silica matrix and, in the inset, the unprotected single particle EDX image (red: gold signal, blue: aluminium signal) and HR-STEM image revealing a core–shell structure with a d-spacing of 2.44 Å (see Fig. SI6†). (d) Size-selected AuInx BNPs (Ø = 4.0 nm) co-deposited in a silica matrix and, in the inset, the TEM image of a single BNP showing evidence of a core@shell morphology. The FFT patterns and their analysis are given in Fig. SI6.† The measured d-spacing values do not allow the structure of the BNPs to be determined unambiguously (see Part B). | ||
AgxAl1−x BNPs (x = 0.25, 0.50, 0.75) display the same tendency, with core@shell structures for higher proportions of aluminium (x = 0.50 and 0.25) consisting a priori of an aluminium oxide shell. The structure of the core cannot be determined by HRTEM because both constituents have very similar lattice parameters.16 However, aluminum does not seem to be entirely incorporated in the shells, since the cores are larger than they would have been if they were exclusively made of silver. Indeed, the comparison between the size of the cores (deduced from the size measured by mass spectrometry) and the size distribution of the cores deduced from STEM image analysis suggests that they still contain some aluminium.16 For larger proportions of silver (Ag0.75Al0.25), the BNPs do not exhibit any aluminium oxide shell (see the STEM image of an assembly of BNPs in Fig. 1a), and the average size deduced from STEM image analysis is in agreement with the size measured by mass spectrometry.16 There is no evidence of any aluminium oxide shell in the HRTEM image either (inset of Fig. 1a), and families of planes (hkl) of the BNP can correspond to an FCC structure of aluminium or silver or a mixing of silver and aluminium.
We can conclude from these TEM observations that both AgxIn1−x and AgxAl1−x contain a substantial amount of indium (or aluminium) in the metallic state. For AgxIn1−x BNPs, silver-rich alloyed phases are visible, while the type of alloys (intermetallic, ordered phases or segregated alloys) in AgxAl1−x BNPs cannot be inferred from TEM analysis. Additional characterization techniques are required to conclude how silver and aluminium are alloyed within the BNPs (see Part D.2.b).
Fig. 1c and d display STEM images of assemblies of size-selected Au0.33Al0.67 and AuInx co-deposited in a silica matrix. Similar observations were also realised on Au0.5Al0.5 BNPs (see Fig. SI1†). In all cases, we observe core@shell structures with a strong contrast, suggesting the formation of gold-rich cores with shells composed of oxides (Al2O3 or In2O3). In the case of Au0.5Al0.5 BNPs, the average core diameter, deduced from STEM image analysis (see the size distribution in Fig. SI1†) is larger than the core diameter deduced from TOF-MS and assuming a pure gold core (3.3 nm from STEM vs. 3.0 nm from mass spectrometry, see Fig. SI1†). This may be a sign that, as observed in Ag–Al BNPs, some of the aluminium is metallic inside the cores. Nevertheless, as in the case of Ag–Al BNPs, it is not possible to know how aluminium is alloyed with gold (alloying at the atomic level or segregated). HR-STEM analysis does not allow the discrimination between pure gold or alloyed phases in the cores either. Indeed, the HR-STEM or HR-TEM images, such as the one shown in the left inset of Fig. 1c, display FFC phases with a lattice parameter corresponding to gold or aluminium. We also performed EDX analysis on a single BNP (right inset in Fig. 1c). The averaging of the spectra associated with the pixels of the shell indicates that the shell is exclusively composed of aluminium (or alumina). At the core level, we find both peaks associated with gold and aluminium, but note that this signal comprises counts from the core and the shell below and above the core. This result by itself thus cannot confirm that some aluminium is alloyed with gold at the atomic level inside the cores. For AuInx BNPs, the core@shell structure is more visible in HR-TEM (see the inset in Fig. 1d) because of the higher density of In2O3 compared to that of Al2O3, but we have not yet been able to identify alloyed Au–In structures within the cores. Additional experiments are therefore required.
To conclude on gold-based Au–Al and Au–In BNPs, the TEM analyses show that the BNPs rapidly oxidized upon exposure to air, but we can reasonably assume that a part of aluminium (or indium) remains in the metallic state within the BNPs. However, no ordered alloyed phases were identified, probably because of demixing during oxidation. In order to further explore how both metals mix and if the BNPs are oxidized before air exposure, additional characterization techniques have been employed.
(2) Complementary characterizations
XPS measurements lead us to conclude that the initially prepared Au–Al BNPs and Ag–Al BNPs contain metallic aluminium, but oxidize over time, even under UHV conditions, highlighting the high sensitivity of aluminium to a reactive environment. This shows that matrix protection of the BNPs is crucial to prevent or at least to slow down aluminium oxidation. In the near future, XPS measurements will also be performed on indium-based BNPs (Ag–In and Au–In), but since indium oxidizes slower than aluminium, the initial proportion of metallic indium within BNPs is expected to be higher than in Au–Al or Ag–Al BNPs.
 | ||
| Fig. 2 (a–d) Four GIWAXS spectra of pure AgNPs and silver-based Ag0.75Al0.25, Ag0.50Al0.50 and Ag0.25Al0.75 BNPs with the superimposition of simulations of a model NP spectrum (fit from size distribution); (e) GIWAXS spectrum of annealed Ag0.75Al0.25 BNPs (sample b) at 350 °C; (f) crystalline lattice parameters a obtained from the average BNP interatomic distance extracted from the simulated spectrum, reported versus the average % of Al atoms. The black arrows in the spectra in the range 40–50 nm−1 correspond to additional contributions that may be attributed to aluminium oxide. The green arrows correspond to the signal which comes from the variation in the substrate carbon contribution from one sample to another. | ||
Finally, Fig. 2e shows the GIWAXS spectrum of the Ag0.75Al0.25 sample after annealing. The lattice parameter is close to that of the pure silver NPs (a = 4.09 Å), which is the signature of a stress relaxation and a total segregation of Al atoms, but not in a shell configuration.
The starting point is 2 mbar of H2 at room temperature. At 200 °C, with this pressure, no change is observed. The pressure of H2 is then increased to 10 mbar. At 250 °C, core@shell to Janus transitions are observed when the BNPs are exposed to the electron beam. Everywhere else, the BNPs remain core@shell. The temperature is then increased by steps of 50 °C. At 650 °C, the BNPs become more and more spherical. The temperature is increased up to 1100 °C without observing any reduction of the alumina shell. However, at this temperature, core–shell to Janus transitions, followed by the melting and diffusion of gold, are apparent, as can be seen in Fig. 3. Again, this effect is due to the electron beam. Elsewhere, the BNPs remain in a core@shell configuration.
 | ||
| Fig. 3 Sequence of TEM images extracted from the real-time tracking of two Au0.33Al0.67 BNPs co-deposited in a silica matrix at 1100 °C under 10 mbar of H2. (a) Initially, at time t0, the BNPs denoted 1 and 2 are in a core–shell and Janus configuration, respectively. After 7 seconds (b), BNP 1 changes from a core@shell structure to a Janus structure, while the core of BNP 2 begins to disappear. After one minute (c), both cores have melted and diffused. Worthy of note is that only the BNPs under the electron beam undergo a structural change. | ||
Finally, the reduction of the aluminium oxide was not observed even at a very high temperature. Aluminium oxide, known to be very stable in the bulk (see Ellingham diagrams) seems to be also stable at the nanoscale and extremely difficult to reduce. We observe here the striking difference in behaviour between aluminium oxide and indium oxide, the latter being much easier to reduce.15
(3) Optical studies
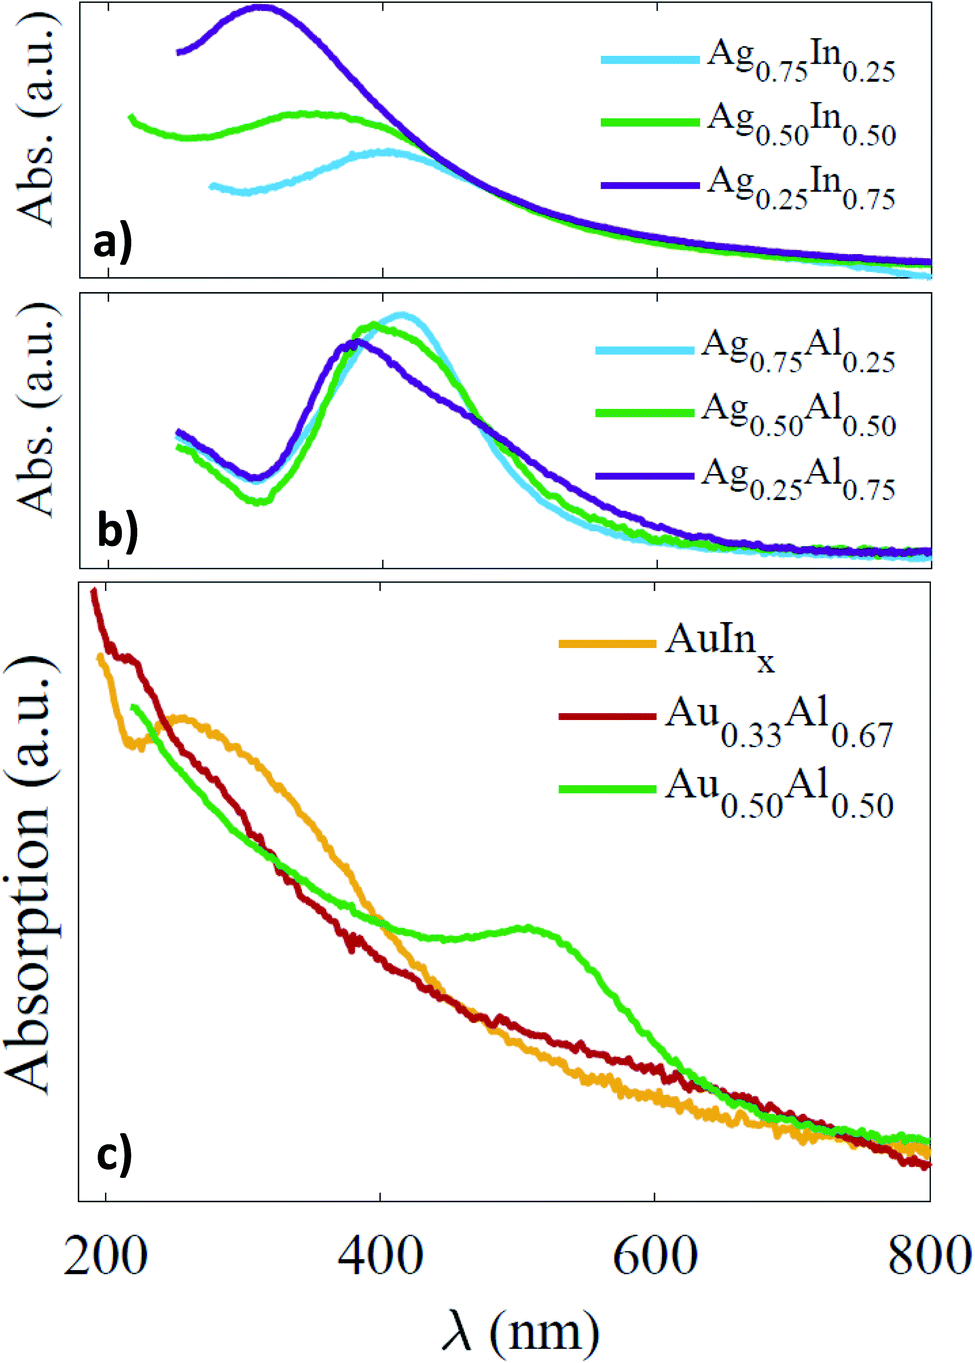 | ||
| Fig. 4 (a) Experimental absorption spectra of non-size-selected AgxIn1−x silica-embedded BNPs. The average diameter is around 4 nm with a size dispersion of 80% of their diameter. (b) Experimental absorption spectra of size-selected AgxAl1−x silica-embedded BNPs. The mean diameters are Ø = 4.3 nm, 4.1 nm and 3.8 nm for Ag0.25Al0.75, Ag0.50Al0.50 and Ag0.75Al0.25, respectively. (c) Experimental absorption spectra of size-selected Au0.33Al0.67, Au0.50Al0.50 AuInx (2 < x < 3) silica-embedded BNPs. Their mean diameters are Ø = 5.5 nm, 4.1 nm and 4.2 nm for Au0.33Al0.67, Au0.50Al0.50 and AuInx (2 < x < 3), respectively. | ||
Silver-based Ag–In and Ag–Al BNPs. Non-size-selected AgxIn1−x BNPs of about 4 nm in diameter display broad LSPR in between those of pure indium and silver NPs (Fig. 4a). They are further in the UV range the higher the proportion of indium (from 401 nm down to 312 nm from x = 0.75 to x = 0.25). Comparison with theoretical simulations (Mie theory in the dipolar approximation) shows that these LSPR spectral positions are consistent with the existence of some metallic indium within the BNPs (i.e. BNPs consisting of silver-rich indium cores surrounded by an indium oxide shell).16 This suggests that the partially oxidized BNPs retain metallic indium for the three compositions, but even though the silica matrix effectively slows down the oxidation, it does not inhibit it entirely. Moreover, the silica-embedded BNPs appeared not to be stable with prolonged air-exposure and the LSPR shifts towards lower energies because of gradual indium oxidation.16 Notably, in the case of Ag0.75In0.25 BNPs, if any shell of indium oxide could be observed by TEM after air-exposure, the evolution of the optical spectra showed evidence of a progressive indium oxidation (broadening and damping), with the indium shell probably being too thin to be observed by TEM.
Size-selected AgxAl1−x BNPs embedded in a silica matrix show better defined LSPR compared to that of AgxIn1−x BNPs, which may be related to the size selection (spectra in Fig. 4b). Nevertheless, the LSPR is less blue-shifted compared to the initial ones of AgxIn1−x BNPs, the maximum ranging from 414 nm down to 382 nm for a decreasing proportion of silver (from x = 0.75 to x = 0.25). Comparison with theoretical calculations permits us to attribute this reduced blue-shift for AgxAl1−x to a higher degree of oxidation from the first absorption measurements.16 This means that the proportion of metallic aluminium is probably lower than that of indium just after air-exposure, and that the oxidation of aluminium is faster than that of indium. Nevertheless, the absorption spectra do not evolve significantly with time; the BNPs, after being rapidly partially oxidized, are probably protected by the surrounding alumina shell.16 So finally, both Ag–In and Ag–Al BNPs, with prolonged air-exposure, are certainly oxidized in a similar proportion, but their cores still contain metallic indium or aluminium.
Gold-based Au–In and Au–Al BNPs. The optical absorption spectra of size-selected Au0.33Al0.67, Au0.50Al0.50 and AuInx (2 < x < 3) silica-embedded BNPs are displayed in Fig. 4c after a few tens of minutes of exposure to air. The silica-embedded AuInx (2 < x < 3) BNPs show an LSPR in the UV range (at about 254 nm), with the absorption increasing towards the UV range, similar to the one experimentally measured on slightly oxidized AuIn2 BNPs.25 For Au0.33Al0.67 BNPs, we observe only an increase of the absorption towards the UV range, but no clear resonance can be discerned, except for a shoulder at 210 nm, while an LSPR at around 511 nm emerges for Au0.50Al0.50 BNPs. These initial experimental spectra are compared with simulated ones in Fig. 5, in which the dielectric functions of Au, In, Al, In2O3 and Al2O3 are taken from measurements in the bulk phase.45–49
 | ||
| Fig. 5 Optical responses of Au0.50Al0.50 (a), Au0.33Al0.67 (b) and AuInx (2 < x < 3) (c and d). Solid line: experimental absorption spectra of Au0.33Al0.67, Au0.50Al0.50 and AuInx (2 < x < 3) silica-embedded BNPs at time t0 (a few tens of minutes after venting). Dotted line: experimental spectra after n days upon exposure to air (time t0 + n d). Dashed lines: simulated absorption cross-sections for various configurations – (a) Au@Al@Al2O3 spherical structure with a volume oxidation rate of 88%, (b) homogeneous alloyed sphere AuAl2 using the weighted average dielectric function of Au and Al. (d) From the yellow to the orange curve, respectively: alloyed phase AuIn2 using the weighted average dielectric function of Au and In; ordered homogeneous alloyed phase AuIn2, whose dielectric function is taken from the literature;21 spherical core–shell structure of average composition Au0.25In0.75, with a core of AuIn2 (dielectric function taken from ref. 21) and a shell of indium oxide. | ||
In the case of AuInx BNPs, the experimental absorption spectrum is in relatively good agreement with the optical absorption of a core@shell sphere AuIn2@In2O3 (overall composition: Au0.25In0.75) made of an alloyed core of AuIn2 surrounded by a shell of indium oxide (Fig. 5c and d). In these calculations, the dielectric function of AuIn2 is the dielectric function calculated by Keast et al.21 We also obtain a rather good agreement with the optical absorption of an alloyed sphere of AuIn2 with the same dielectric function.21 Conversely, the optical absorption of a homogeneous sphere of Au0.33In0.67 using the average dielectric function of both constituents Au and In gives a well-defined resonance, which does not really correspond to the experimental spectrum. The latter shows a gradual increasing of the absorption superimposed on the resonance, which may be correlated to IB transitions, but also to the onset of an increasing absorption by the silica matrix. The optical response of a core@shell sphere Au@In with the composition Au0.33In0.67 is similar to that of a homogenous sphere of Au0.33In0.67 using the weighted average functions of Au and In.
Finally, these measurements do not allow the real composition of the target to be determined. Nevertheless, the experimental–theory comparison seems to indicate that the BNPs are initially partly composed of Au0.33In0.67. However, we cannot give definite conclusions on how gold and indium initially mix (alloyed at the atomic level or segregated). Aging of the sample after a few months leads to a strong red-shift of the LSPR (see the spectrum at t0 + 173 days in Fig. 5c), resulting in a broad resonance centred at 555 nm, in agreement with the expected LSPR of a core@shell sphere of Au@In2O3. This means that a complete demixing of gold and indium takes place over time with the formation of an indium oxide shell surrounding a gold core, in agreement with TEM observations for which no ordered Au–In phases were found.
For Au0.50Al0.50 BNPs, the initial optical spectrum exhibits a strong resonance centred at 511 nm, corresponding to the LSPR of partially oxidized gold–aluminium and suggesting that aluminium oxidation occurs rapidly, after less than a few tens of minutes (time required to record the first spectrum after venting the sample). The experimental absorption spectrum agrees with the theoretical absorption cross-section of a multi-shell sphere of Au@Al@Al2O3 with a volume oxidation rate of aluminium of 88%. As the proportion of oxidized aluminium is initially high, the spectrum does not strongly change over time; the aluminium oxide shell thus formed can prevent further oxidation. We can also conclude that we did not succeed in making silica-embedded BNPs with the ordered phase Au0.50Al0.50.
For Au0.33Al0.67, we noted that the sample just after synthesis was grey and the corresponding absorption spectrum shows an increase of the absorption towards the UV range with a shoulder at about 210 nm that might be related to the emergence of LSPR (see Fig. 5b). No sign of strong oxidation appears in the optical response just after air exposure. For comparison, the simulated spectrum of an Au0.33Al0.67 sphere with the dielectric function taken as the weighted average of those of gold and aluminium also displays an increase of the absorption towards the UV range, but with a clear LSPR (a similar response can be obtained with a core@shell Au@Al with the composition Au0.33Al0.67). After a few days, the colour of the sample became slightly pink and the absorption spectrum shows a well-defined LSPR at 522 nm. This value corresponds to the LSPR peak position of a multi-shell Au@Al@Al2O3 embedded in silica. This means that Au0.33Al0.67 BNPs initially contain metallic aluminium, but they are rapidly oxidized, because of the poor protection of silica against oxidation. Note that the spectrum after aging is less red-shifted than the one of AuInx because the optical index of alumina is lower than that of Al2O3.
To conclude, optical absorption measurements on silver-based BNPs embedded in a silica matrix have shown that both Ag–In and Ag–Al systems retain metallic indium (or aluminium). Ag–In BNPs display, just after air-exposure, an LSPR deeper in the UV range as the proportion of indium increases, while Ag–Al BNPs show a less blue-shifted LSPR due to a more rapid oxidation. This more rapid oxidation of aluminium is also visible in gold-based BNPs. Au–In BNPs, just after air exposure, have the LSPR furthest in the UV range among the four systems (Ag–In, Ag–Al, Au–In and Au–Al) investigated. Nevertheless, after prolonged aging, the Ag–Al system is the only one keeping an LSPR still in the UV range, probably because of the formation of an oxide shell, which protects the remaining metallic aluminium within the cores. The initial LSPR of AuInx BNPs at around 254 nm may be attributed to the formation of blue gold (AuIn2 alloy), but its rapid red-shift over time is the sign of a rapid demixing of both elements and indium oxidation. For Au0.33Al0.67 silica-embedded BNPs, even if no LSPR appears in the far UV (it may be masked by the onset of an increasing absorption by the silica and we have to keep in mind that the LSPR of aluminium is deeper in the UV than that of indium), we do not observe any sign of oxidation just after synthesis. This suggests that the purple gold (AuAl2 alloy) is formed at the nanoscale and it is only after several days that the demixing of both elements, accompanied by aluminium oxidation, leads to the emergence of the LSPR of gold. For Au0.50Al0.50 BNPs, gold and aluminium demix on a shorter time scale, showing that the alloy AuAl, if formed, is less stable against oxidation at the nanoscale when BNPs are embedded in silica.
E. Conclusion and perspectives
In this work, the optical and structural properties of nanoalloys combining gold or silver with aluminium or indium were investigated. Despite the presence of many alloyed phases in the bulk, it remains difficult to keep purely metallic nanoalloys stable against oxidation in the long term, even when the BNPs are embedded in a silica matrix. The BNPs, produced by laser vaporization, surfactant-free and initially in the metallic state, are indeed restructured upon air-exposure or even under UHV in the case of Al-based BNPs because of the strong sensitivity of aluminium to oxidation. Nevertheless, the silver-based Ag–In and Ag–Al BNPs retain some metallic indium or aluminium even after aging (with prolonged air-exposure),15,16 while a demixing, accompanied by aluminium or indium oxidation, occurs in gold-based Au–In and Au–Al BNPs. After aging, the BNPs show a core@shell structure which generally retains some indium or aluminium inside the cores, but as the proportion of the non-oxidized trivalent metal remains poor, the corresponding LSPR is not as far in the UV range as desired.However, in some cases, some nanoalloys at the atomic level are initially formed within the BNPs. For Ag–In BNPs, the initial spectral position of the LSPR is in agreement with a core@shell In–Ag@In structure with indium poorly alloyed cores, and even after aging, the cores remain alloyed with a small proportion of indium.16 For Ag–Al BNPs, the GIWAXS analysis of carbon-coated BNPs showed evidence of the incorporation of aluminium in the silver lattice according to Vegard’s law, with, in addition, a compressive stress due to the formation of an aluminium oxide shell. This is mirrored in the optical response ,with an LSPR in the UV range at around 388 nm for aluminium-rich proportions. In this last case, the aluminium oxide formed around the cores probably protects metallic aluminium in the core from further oxidation. For gold-based BNPs, the initial optical responses of AuInx and Au0.37Al0.67 BNPs are also in favor of the formation of ordered alloys (blue gold AuIn2 and purple gold AuAl2), but the demixing, leading to core@shell structures, as observed by TEM and corroborated by the appearance of the gold LSPR, shows that they are not stable.
To keep such nanoalloys stable in air in the long term, new techniques of protection against oxidation have to be developed, such as, for instance, the use of other matrices. Another possibility is to regenerate the metallic character by annealing under reducing atmosphere, as has already been shown for silver-based Ag–In and Ag–Al BNPs.16 Such experiments are in progress, but in the case of Au–Al, the reduction of aluminium in the environmental electron microscope seems to be difficult to achieve, even at very high temperatures. Identical annealing under reducing atmosphere of samples prepared either for optical characterization or for TEM observation should be performed in order to better understand the evolution of the optical response after annealing in relation to the restructuring of the BNPs. Furthermore, as the oxide shell of alumina or indium oxide protects the cores from oxidation, the production of larger BNPs in order to get larger alloyed cores surrounded by an oxide shell, developing LSPR more in the UV range, could also be an alternative.
Concerning the structural characterization of the BNPs, anomalous GIWAXS and GISAXS (grazing incidence small angle X-ray scattering) measurements should bring complementary information about the internal structure of the BNPs. Environmental TEM and HR-STEM experiments will also be investigated in the near future and theoretical calculations will also be performed, which will be helpful to better understand the behaviour of these nanoalloys in the very small size range.
In conclusion, our results highlight the difficulties of alloying reactive trivalent metals with noble metals at the nanoscale while stabilizing them against oxidation. Despite these difficulties, we show that metallic mixed phases of varying stability can nevertheless be fabricated using a physical approach. Even though a more or less large fraction of the trivalent element is pulled to the BNP surface by oxidation, we could still show evidence of the presence of both aluminium and indium in the metallic state in the BNP core. We would, however, like to stress the importance of the complementary experimental techniques; it is only their combination that allowed us to unambiguously characterize these complex nanostructures.
Author contributions
The results presented in this publication come from a work initiated by E. Cottancin, M. Pellarin and M. Hillenkamp.All the authors participated in this work, which also corresponds to the main part of the thesis work of É. Camus. More specifically, the samples were fabricated by É. Camus, M. Pellarin, M. Hillenkamp, O. Boisron and E. Cottancin. É. Camus, N. Blanchard, L. Roiban, M. Hillenkamp and E. Cottancin participated in the TEM and EDX characterisation. The optical studies (experiments and simulations) were performed by É. Camus, M. Pellarin and E. Cottancin. The XPS experiments were performed by O. Boisron and M. Hillenkamp. The GIWAXS experiments were conducted by P. Andreazza, É. Camus and E. Cottancin at the European Synchrotron Radiation Facility (ESRF) in Grenoble, France at the BM02-D2AM beamline and the corresponding simulations were performed by P. Andreazza.
The manuscript was written by E. Cottancin and É. Camus and by P. Andreazza for the GIWAXS parts. The ESI,† containing XPS measurements, was written by M. Hillenkamp and O. Boisron. The manuscript and ESI† were carefully and critically reviewed by all the authors.
Conflicts of interest
There are no conflicts to declare.Acknowledgements
The samples were investigated at the PLYRA@iLMtech facility with technical support from C. Albin, C. Clavier and S. Hermelin, who are warmly thanked. The authors also gratefully acknowledge the Centre Technologique des Microstructures (CTμ) and especially Xavier Jaurand for his availability and technical expertise. The authors also thank Mimoun Aouine and the Consortium Lyon Saint-Etienne de Microscopie (CLYM) for access to the FEI Titan ETEM. The authors acknowledge TEM access provided by the METSA network and J. Ramade for preliminary results obtained during his PhD work on Ag–In BNPs. The authors thank the ESRF facility access, and more specifically Nils Blanc and all the staff from the BM02-D2AM beamline at the ESRF facilities. Murilo Moreira is also warmly thanked for his support during the week of experiments performed at ESRF. The experiments at ESRF were made possible thanks to the financial support of the ESRF (proposal A02-2/870). The authors would like to acknowledge support from the Nanoalloys International Research Network (IRN) “Nanoalloys” of CNRS. This work was also partially financed by the French National Research Agency (Agence Nationale de Recherche, ANR) via the project ‘SchNAPSS’, ANR-21-CE09-0021.References
- U. Kreibig and M. Vollmer, Optical Properties of Metal Clusters, Springer, Berlin, 1995 Search PubMed.
- E. Cottancin, M. Broyer, J. Lermé and M. Pellarin, in Handbook of Nanophysics, ed. K. D. Sattler, Taylor & Francis CRC Press, 2010, vol. 6, pp. 24-21–24-25 Search PubMed.
- E. Ozbay, Science, 2006, 311, 189–193 CrossRef CAS PubMed.
- S. A. Maier, Plasmonics: Fundamentals and Applications, Springer, New York, NY, 2007 Search PubMed.
- H. A. Atwater and A. Polman, Nat. Mater., 2010, 9, 205–213 CrossRef CAS PubMed.
- M. Sun and H. Xu, Small, 2012, 8, 2777–2786 CrossRef CAS.
- E. Cottancin, N. D. Fatti and V. Halté, in Nanoalloys, ed. D. Alloyeau, C. Mottet and C. Ricolleau, Springer, London, 2012, pp. 331–368 Search PubMed.
- R. Ferrando, Structure and Properties of Nanoalloys, Elsevier, 2016, vol. 10 Search PubMed.
- F. Rabilloud, E. Cottancin and M. Pellarin, in Nanoalloys – From Fundamentals to Emergent Applications (Second Edition); Chapter 5 - Optical Properties of Metallic Nanoalloys: From Clusters to Nanoparticles, ed. F. Calvo, Elsevier, Oxford, 2020, pp. 151–192, DOI:10.1016/B978-0-12-819847-6.00011-5.
- H. A. Atwater, ACM SIGDA Newsletter, 2007, 37, 1 Search PubMed.
- S. K. Jha, Z. Ahmed, M. Agio, Y. Ekinci and J. F. Löffler, J. Am. Chem. Soc., 2012, 134, 1966–1969 CrossRef CAS PubMed.
- U. Aslam, V. G. Rao, S. Chavez and S. Linic, Nat. Catal., 2018, 1, 656–665 CrossRef.
- M. W. Knight, N. S. King, L. F. Liu, H. O. Everitt, P. Nordlander and N. J. Halas, ACS Nano, 2014, 8, 834–840 CrossRef CAS PubMed.
- E. Cottancin, C. Langlois, J. Lerme, M. Broyer, M.-A. Lebeault and M. Pellarin, Phys. Chem. Chem. Phys., 2014, 16, 5763–5773 RSC.
- J. Ramade, C. Langlois, M. Pellarin, L. Piccolo, M. A. Lebeault, T. Epicier, M. Aouine and E. Cottancin, Nanoscale, 2017, 9, 13563–13574 RSC.
- É. Camus, J. Ramade, M. Pellarin, N. Blanchard, M. Hillenkamp, C. Langlois, L. Roiban and E. Cottancin, Eur. Phys. J.: Appl. Phys., 2022, 97, 59 CrossRef.
- U. E. Klotz, Gold Bull., 2010, 43, 4–10 CrossRef CAS.
- L.-Y. Chen and D. W. Lynch, Phys. Status Solidi B, 1988, 148, 387–394 CrossRef CAS.
- H. Büchler and K.-J. Range, J. Less-Common Met., 1990, 161, 347–354 CrossRef.
- S. Supansomboon, A. Maaroof and M. B. Cortie, Gold Bull., 2008, 41, 296–304 CrossRef CAS.
- V. J. Keast, K. Birt, C. T. Koch, S. Supansomboon and M. B. Cortie, Appl. Phys. Lett., 2011, 99, 111908 CrossRef.
- V. J. Keast, B. Zwan, S. Supansomboon, M. B. Cortie and P. O. Å. Persson, J. Alloys Compd., 2013, 577, 581–586 CrossRef CAS.
- H. G. Boyen, A. Ethirajan, G. Kästle, F. Weigl, P. Ziemann, G. Schmid, M. G. Garnier, M. Büttner and P. Oelhafen, Phys. Rev. Lett., 2005, 94, 016804 CrossRef.
- E. A. Sutter, X. Tong, K. Jungjohann and P. W. Sutter, Proc. Natl. Acad. Sci. U. S. A., 2013, 110, 10519–10524 CrossRef CAS PubMed.
- T. R. Gordon and R. E. Schaak, Chem. Mater., 2014, 26, 5900–5904 CrossRef CAS.
- N. Gazit, G. Richter, A. Sharma, L. Klinger and E. Rabkin, Mater. Des., 2019, 165, 107557 CrossRef CAS.
- J. A. Jones, Gold aluminium intermetallics current and future considerations, Electronic component conference, EECC’97, Proceeding of the 3rd ESA Electronic Component conference held 22–25 April, 1997 at ESTEC, ed. B. Kaldeich-Schürmann, ESA SP-395, Noordwijk, The Netherlands, Paris, 1997, p. 411 Search PubMed.
- N. W. Ashcroft and N. D. Mermin, Solid State Physics, International Edition, Saunders College, Philadelphia, 1976 Search PubMed.
- W. Tyson and W. Miller, Surf. Sci., 1977, 62, 267–276 CrossRef CAS.
- W. B. Pearson, A Handbook of Lattice Spacings and Structures of Metals and Alloys, Elsevier, 1958 Search PubMed.
- M. Pušelj and K. Schubert, J. Less-Common Met., 1975, 41, 33–44 CrossRef.
- S. E. R. Hiscocks and W. Hume-Rothery, Proc. R. Soc. London, Ser., 1964, 282, 318–330 CAS.
- B. Predel, Phase Equilibria, Crystallographic and Thermodynamic Data of Binary Alloys, Springer, 2006 Search PubMed.
- C. D. West and A. W. Peterson, Z. Kristallogr. - Cryst. Mater., 1934, 88, 93–94 CrossRef CAS.
- M. Marezio, Acta Crystallogr., 1966, 20, 723–728 CrossRef CAS.
- C. T. Prewitt, R. D. Shannon, D. B. Rogers and A. W. Sleight, Inorg. Chem., 1969, 8, 1985–1993 CrossRef CAS.
- D. Gérard and S. K. Gray, J. Phys. D: Appl. Phys., 2015, 48, 184001 CrossRef.
- R. Alayan, L. Arnaud, A. Bourgey, M. Broyer, E. Cottancin, J. R. Huntzinger, J. Lermé, J. L. Vialle, M. Pellarin and G. Guiraud, Rev. Sci. Instrum., 2004, 75, 2461–2470 CrossRef CAS.
- A. Perez, P. Melinon, V. Dupuis, L. Bardotti, B. Masenelli, F. Tournus, B. Prevel, J. Tuaillon-Combes, E. Bernstein, A. Tamion, N. Blanc, D. Tainoff, O. Boisron, G. Guiraud, M. Broyer, M. Pellarin, N. D. Fatti, F. Vallee, E. Cottancin, J. Lermé, J.-L. Vialle, C. Bonnet, P. Maioli, A. Crut, C. Clavier, J.L. Rousset and F. Morfin, Int. J. Nanotechnol., 2010, 7, 523–574 CrossRef CAS.
- P. Andreazza, in Nanoalloys – Synthesis, Structure and Properties, ed. D. Alloyeau, C. Mottet and C. Ricolleau, Springer Verlag, Berlin, 2012, pp. 69–112 Search PubMed.
- P. Andreazza, A. Lemoine, A. Coati, D. Nelli, R. Ferrando, Y. Garreau, J. Creuze and C. Andreazza-Vignolle, Nanoscale, 2021, 13, 6096–6104 RSC.
- J. Penuelas, P. Andreazza, C. Andreazza-Vignolle, C. Mottet, M. De Santis and H. C. N. Tolentino, Eur. Phys. J. Spec. Top., 2009, 167, 19–25 CrossRef.
- D. Zanchet, B. D. Hall and D. Ugarte, J. Phys. Chem. B, 2000, 104, 11013–11018 CrossRef CAS.
- F. Bertolotti, D. Moscheni, A. Migliori, S. Zacchini, A. Cervellino, A. Guagliardi and N. Masciocchi, Acta Crystallogr., Sect. A, 2016, 72, 632–644 CrossRef CAS.
- P. B. Johnson and R. W. Christy, Phys. Rev. B: Solid State, 1972, 6, 4370–4379 CrossRef CAS.
- J. Lemonnier, G. Jezequel and J. Thomas, J. Phys. C: Solid State Phys., 1975, 8, 2812–2818 CrossRef CAS.
- I. Hamberg, C. G. Granqvist, K. F. Berggren, B. E. Sernelius and L. Engström, Vacuum, 1985, 35, 207–209 CrossRef CAS.
- E. D. Palik, Handbook of Optical Constants of Solids, Academic Press, New York, 1985–1991 Search PubMed.
- Handbook of Optical Constants of Solids, Acad. Press, San Diego, Calif., 1998 Search PubMed.
Footnote |
| † Electronic supplementary information (ESI) available. See https://doi.org/10.1039/d2fd00109h |
| This journal is © The Royal Society of Chemistry 2023 |