 Open Access Article
Creative Commons Attribution 3.0 Unported Licence
Simulating long term discolouration behaviour in large diameter trunk mains
Iftekhar
Sunny
,
Stewart
Husband
 * and
Joby
Boxall

Department Civil & Structural engineering, University of Sheffield, S1 3JD, UK. E-mail: s.husband@sheffield.ac.uk
First published on 2nd February 2023
Abstract
Simulating the long term discolouration behaviour of large diameter trunk mains can aid water utilities to understand and pro-actively manage these critical assets and mitigate a key source of customer dissatisfaction. Validation of such modelling capability is presented for the Variable Condition Discolouration Model (VCDM). This is based on over a year's field data from three similar physical and hydraulically operated trunk mains supplied from the same source that undergo different planned hydraulic maintenance regimes. In single long-term simulations, measured turbidity responses are reproduced with a general accuracy of ±0.25 NTU with comparable model parameters empirically calibrated for the range of managed and unplanned hydraulic events. Validation of long-term capability supports the concepts of continuous material mobilisation and accumulation processes and that accumulation can be modelled as occurring simultaneously for all wall-bound material shear strengths, critical for quantifying how discolouration potential changes. Benefits from understanding and having the tools to track this behaviour include informing operational risk assessment, evidencing hydraulic management strategies, resilience and scenario planning and optimising network maintenance.
Water impactThe paper presents validation of a modelling approach that is transforming how UK Water Utilities manage discolouration risk in water distribution systems delivering significant efficiencies, savings and service improvements. The ability to simulate, and therefore plan and mitigate, long term discolouration behaviour is demonstrated, providing a key reference that underpins the impact and highlights the capability to a global audience. |
Introduction
Water supply systems are designed to ensure drinking water is safe for human consumption and compliant with stringent regulatory standards. Drinking water is not sterile, so even after high quality treatment, particles and soluble organic and inorganic material remain in the bulk water. During transport through the drinking water distribution systems (DWDS) these materials can and do accumulate on pipe walls. This accumulated material results in discolouration incidents when mobilised due to system, primarily hydraulic, disequilibrium. Discolouration is the most apparent water quality failure reported around the world, with customer contacts often used as a key performance indicator by the water authorities and their regulators.1 Discoloured water samples can also breach other quality parameters, for example iron and manganese.2Discolouration events are sporadic in nature, and of relatively short duration (up to a few hours) as causes are mostly short term hydraulic disturbances, e.g. valve or hydrant operation or burst. As a result, they are unlikely to be captured by regulatory network sampling. Discolouration events from large diameter transmission (trunk) mains are a particularly significant risk as they can supply large downstream populations, potentially millions of people for a single event.3 Although customer observed events are typically recorded as occurring in downstream distribution areas, 30–50% of discolouration events in the UK have been identified as originating from the upstream trunk main, highlighting the criticality of trunk main discolouration maintenance.4
To improve water quality and reduce the number of discolouration contacts, the water industry requires tools to predict long-term discolouration processes so that risks can be strategically managed and maintenance interventions planned and optimised. A discolouration model that can therefore track long term discolouration potential is needed. While one such model has been proposed, the lack of long-term continuous water quality data that includes distinct hydraulic events and resulting turbidity responses has prevented validation of the underpinning discolouration material behaviour concepts and hence the long term modelling.
Background
1. Discolouration processes
Discolouration was traditionally conceptualised as the re-suspension of gravity-driven sediments. Study of discolouration particle size distribution and density analysis revealed that the particles responsible are small in size, between 2–50 μm.5–7 Hence self-weight effects are small and when re-suspended, they only settle due to gravitational effects during prolonged quiescent conditions.5Discolouration events are typically observed following hydraulic disequilibrium.8,9 Flushing fieldwork has demonstrated that each step increase in shear stress releases additional material, suggesting the accumulated material exhibits cohesive strength properties.3,5,10 In contrast, if material was accumulated by sedimentation processes, all material (of a given particle size) would release instantaneously once critical thresholds are exceeded. A number of investigations have demonstrated particle mobilisation in response to velocity and shear stress and concluded that particles cannot bind in non-cohesive conditions unless the peak velocity remains sufficiently low.6,11 This indicates that accumulating materials have cohesive properties, a result consistent with findings from full scale temperature controlled experimental pipe facilities.12,13
In repeated flushing trials to investigate temporal behaviour, the return of discolouration material has been observed with similar response patterns, indicating a consistent process of accumulation occurring on pipe surfaces.2,14–16 Repeated flushing trials have also showed the amounts of accumulated material mobilised was similar irrespective of seasonal influences, suggesting material accumulated linearly over time.2,17
Repeat flushing trials in different parts of the UK using an increasing stepped flow profile demonstrated similar turbidity responses correlating to shear stress increases with the initial flushing trial.15 This repeating turbidity response supports material accumulation and mobilisation processes occurring simultaneously and with defined shear strength characteristics. This behaviour has also been recorded in laboratory trials in full-scale temperature controlled pipe facilities.13 From these studies, a continual and simultaneous mobilisation–accumulation cycle is highlighted that exhibits consistent patterns across the full shear strength range induced by hydraulic forces. Combined with the ever-changing conditions within distribution networks, this leads to complex material conditions on pipe walls with varying amounts of material and with different cohesive shear strengths being present at any given time.
2. Factors influencing material accumulation
Research has been conducted into how bulk water quality influences material accumulation. Husband and Boxall (2011)15 observed complete re-accumulation of material on distribution pipe walls ranging from 1.5 to 4.0 years depending on source waters. In trials in the Netherlands even with the use of ultra-filtration (0.1 μm), material accumulation was still evident but at a much reduced rate as measured by turbidity responses to specialised flushing trials.18 Similar percentages of metal concentrations have been reported in samples collected from flushing at different velocities (and hence pipe wall shear stress), indicating uniform inorganic composition across the accumulated material and cohesive shear strengths.2 Discolouration samples are also observed to include significant organics,19 and the significance of biofilms has been identified.20,21No correlation has been found between pressure and discolouration risk,22 although hydraulic transients may contribute to material mobilisation.23–25 Material accumulation, and hence discolouration risk, have been reported to be influenced by daily hydraulic conditions,2,11,26 pipe material15 and water temperature.16,27 While some studies have showed temperature and microbial influence on discolouration risk,16,27–29 the variation of accumulation processes and rates seasonally has not yet been rigorously demonstrated.
3. Modelling discolouration processes
Various discolouration models exist which attempt to describe material mobilisation. These include the particle sedimentation model,7 artificial neural network model,30 discolouration risk model,31 discolouration propensity model32 and the PODDS (Prediction of Discolouration in Distribution Systems) model.8 The PODDS model uses excess shear stress criteria for mobilisation, verified from extensive flushing and laboratory trials.15 Unlike other discolouration models, PODDS also included an integrated material accumulation function. This was coded as the reverse of the mobilisation process, hence describing material accumulation as occurring from strongest to weakest shear strength material. This however does not describe the accumulation processes observed from the laboratory13 and field observations that indicates accumulation occurring simultaneously across all shear strengths.33In 2014 a revised version of the PODDS model was proposed to describe discolouration behaviour as observed from laboratory and field data, known as the Variable Condition Discolouration Model (VCDM).34 The model captures key mechanisms which govern discolouration by incorporating the following:
a) The model assumes that wall bound cohesive layers are defined by prevailing (conditioning) hydraulic shear (τc).
b) Material at the pipe wall accumulates over the full range of layer strengths of applied shear stresses (τa) < τc.
c) Material is mobilised from the pipe wall and entrained and completely mixed within the bulk water due to imposed excess shear stress (τa–τc) when τa > τc. In this context, the VCDM retains the same mobilisation mechanism as the verified PODDS model.
d) The model represents the relative amount, or condition, or the stored pipe wall material by dividing the shear strength range into bands and for each tracking simultaneously mobilisation and accumulation processes.
e) The model assumes material adheres uniformly across pipe walls.
f) The model assumes a linear accumulation rate when τa < τc.
The model tracks pipe wall condition with respect to discolouration material using a relative material quantity φ (τ, t), a unitless parameter that is bound between 0 and 1, where 0 represents no material and 1 maximum accumulation.34 The VCDM simulates discolouration using two validated mobilisation parameters (βe and α; a rate term and a scaling factor respectively), initially tested through synthetic data and then successfully calibrated for small diameter pipes and a single trunk main.35 The calibration results demonstrated that the VCDM retains the mobilisation functionality of the PODDS model, with comparable quality of fit to measured data. A third parameter is a linear accumulation rate. To aid user understanding and application this rate is input as an accumulation period (βr), the time required for φ to go from 0 to 1 if no intervening mobilisation (i.e. τa < τc for the duration). Due to limited long-term hydraulic and turbidity datasets with multiple turbidity events to facilitate extended period calibration, the accumulation mechanism of VCDM remains to be validated.
The aim of this paper is therefore to assess if the VCDM can simulate the long-term turbidity behaviour observed from multiple independent operational trunk mains with similar characteristics but different hydraulic management regimes by tracking both mobilisation and the observed accumulation behaviour. If validated, this model could provide a valuable tool to inform management options to mitigate discolouration risk.
Methods and materials
1. Experimental design
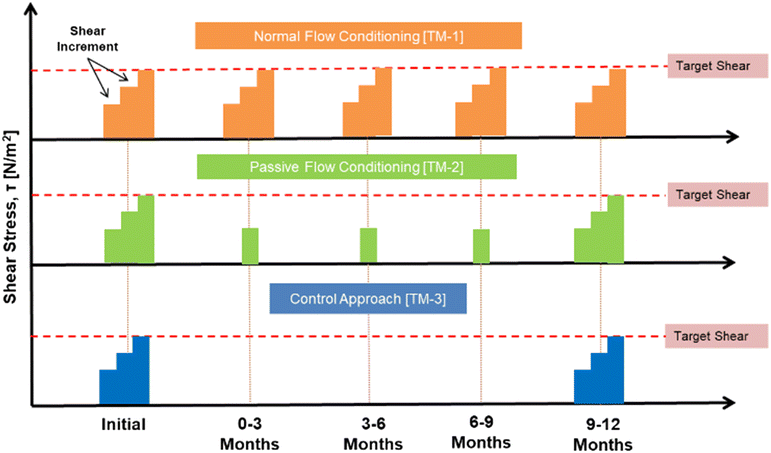
In order to assess the VCDM's ability to simulate long-term material mobilisation and accumulation behaviour, hydraulic and turbidity time-series data is required. To facilitate model calibration, this must include observable turbidity responses due to atypical hydraulic changes interspersing normal and stable operation. While unplanned hydraulic events may occur creating a discolouration response, there is no certainty or control. Hence an experimental design was implemented involving periodically imposed excess shear stress events. Termed flow conditioning,20,36 controlled hydraulic increases enable management of the location, time and critically magnitude of turbidity responses. Delivery of this strategy at this site and the impact on material loading was reported in Sunny et al. (2020).33 In this work the long-term hydraulic data is used to calculate shear stresses as the VCDM input variable with turbidity data facilitating model calibration and hence concept validation.A key assumption of the VCDM is that cohesive layers accumulate with varying strengths simultaneously. If valid, this attribute would allow the model to simulate discolouration behaviour across a range of events and site conditions. In order to validate this, it is necessary to repeat the imposition of different magnitude hydraulic events and measure the associated turbidity. Two different magnitude flow conditioning events were therefore planned and implemented in two operationally and compositionally similar trunk mains; one with high imposed excess shear stress events, termed normal flow conditioning, and another with relatively lower events termed passive flow conditioning. For each type of operation, a quarterly return interval was planned to allow investigation of accumulation rates. A third, and again similar, trunk main, was used as a control with flow conditioning operations only at the start and end of the investigation period and no quarterly interventions. Fig. 1 shows the different flow conditioning interventions implemented on the three trunk mains to provide the range of events and across different strength profiles. Target shear stress for initial and final flow conditioning was the same for all three trunk mains. The initial shear increments were planned to ensure equivalent layer conditions at the trial outset whilst the final conditioning would allow investigation of the long-term effects on higher shear strength material following the different interventions. While natural hydraulic events may also occur, these planned events with managed conditions ensured that necessary data would be available for model validation.
System flow, pressure and pipe properties are required for accurate hydraulic representation within VCDM, with headloss and pipe diameter then used to determine shear stress. Turbidity data is then used to calibrate the discolouration functionality. Collecting the data for such calibration purposes is effective during both planned flow conditioning events and unplanned hydraulic events (e.g. bursts). The periods between planned and unplanned events are different and unknown, hence full duration high temporal logging was required to capture system behaviour throughout the trial period. Flow, pressure and turbidity monitoring equipment was therefore deployed for continuous data capture, facilitating single long-term simulations and calibration to assess model capability to track long-term discolouration behaviour.
As bulk water quality, hydraulic conditions and pipe material can all influence material accumulation rates, for scientific rigour it is important to minimise variables. Therefore the three trunk mains were selected with similar physical properties and pipe material, supplied from a single water source and having similar hydraulic operating conditions (including shear stress and Reynold numbers). No effect of pressure on discolouration has been identified and hence ensuring a similar pressure regime in the selected trunk mains was not considered a constraint during site selection.
2. Site details and treated water quality
The three independent trunk mains identified were all supplied from a single water treatment works (WTW). Fig. 2 presents a schematic of these with key monitoring points indicated. The three trunk mains normally operated independently. TM-2 and TM-3 run parallel to each other over much of their investigated length, serving separate downstream distribution zones. Cross connections between the mains were closed, other than during an operational response to a burst event. The trunk mains are mostly in semi-urban non-paved areas with moderate vegetation. Table 1 summarises the details of the three trunk mains and PRV settings.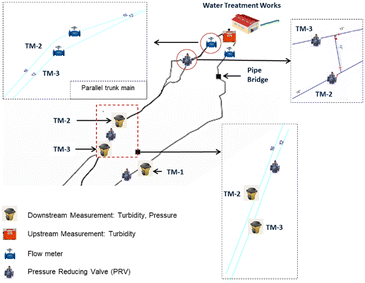 | ||
| Fig. 2 Schematic of the three trunk main system studied, showing monitor and control asset locations. | ||
| Trunk main | Pipe Ø [mm] | Pipe material | Study length [km] | PRV setting | |
|---|---|---|---|---|---|
| Inlet [m] | Outlet [m] | ||||
| a TM-3 had two PRVs with a = nearer to the WTW and b = nearer to the downstream monitoring point. | |||||
| TM-1 | 305 | Unlined CI (30% lined) | 6.4 | 97.0 | 19.0 |
| TM-2 | 407 | Unlined CI | 5.6 | 44.0 | 20.0 |
| TM-3a | 305 | Unlined CI | 5.9 | 38.0(a), 79.0(b) | 19.0(a), 16.0(b) |
Inlet and outlet monitoring points were selected such that each of the trunk main lengths could be assessed as separate single pipe lengths with consistent physical properties. The inlet point ensured no additional water mixing from other sources except the treated water. The outlet was selected such that there were no significant intermediate connection points or take-offs so hydraulic conditions remained consistent over the pipe lengths. The trunk mains are gravity fed from the WTW, directly supplying downstream distribution zones. Normal daily flow followed demand driven diurnal patterns. Planned hydraulic events were achieved by opening existing fire hydrants to increase flows at peak times, minimising the additional demand required to achieve target flows. Data was collected continuously and during trials at hydrant flushing locations.
The WTW is supplied from an upland surface water reservoir and uses a ferric based coagulant as part of the treatment process that has seen no changes in operation during the periods reviewed in this work. Access to data from January 2013 to May 2017 and plotted in Fig. 3 presents key regulated water quality parameters of the final treated water which could affect accumulation rates; Total Organic Carbon (TOC), water temperature and metal concentrations (Fe, Al and Mn). From Fig. 3 it can be observed that higher inorganic (Fe and Al) and organic (TOC) content was found in the treated water during the warmer months indicating higher bulk water loading in the summer season. The low background concentrations of manganese do not appear to demonstrate seasonal variation.
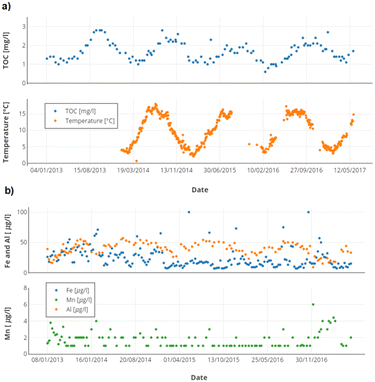 | ||
| Fig. 3 WTW outlet treated water quality from discrete samples, January 2013 to May 2017 a) TOC and temperature b) iron, aluminium and manganese. | ||
3. Hydraulic conditions within the trunk mains
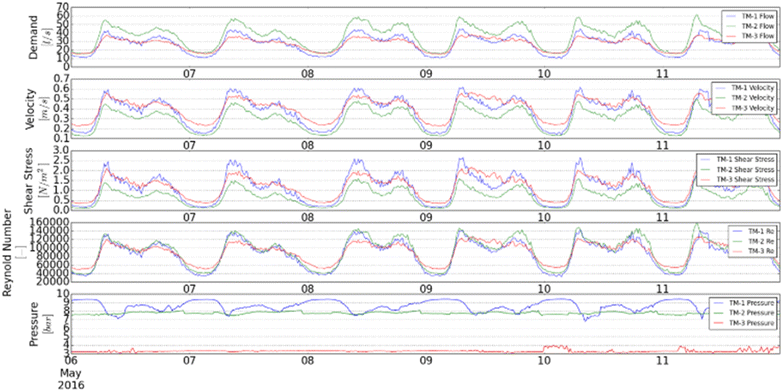
The trunk mains were selected to have comparable hydraulic performance. Fig. 4 presents the hydraulic conditions in each of the three trunk mains for a typical sequence of 6 days showing repeating comparable conditions. Pressure is different between the trunk mains, but has been shown not to be associated with discolouration processes. The pressures were controlled by the PRVs as shown in Fig. 2 and Table 1. TM-1 was pressurised for the full monitoring length, TM-2 had partial pressure reduction, TM-3 had pressure reduction over the entire monitoring length. For experimental purposes, the three trunk mains are considered as having similar physical, chemical and biological properties that facilitate comparison of turbidity result for model validation in response to different imposed hydraulic regimes.4. Fieldwork procedure and timeline
The flow conditioning trials were designed using the PODDS model,8 identifying stepped increases in flow to create controlled turbidity responses not exceeding 1.0 NTU, thereby minimising discolouration risk. Initial PODDS model parameters were taken from calibration in a similar network.20 TM-1 was designed with a 40% shear stress increase above the normal daily peak shear stress, applied in multiple steps to avoid excess turbidity response, at quarterly intervals. TM-2 had 40% stepped shear stress increase above the peak shear for initial (time zero) and final trial (12 months) and single 15% increases in shear stress at quarterly intervals. TM-3 was designed as a control with no quarterly interventions and only the 40% stepped shear stress increase above peak flows for initial and final trial assessment (see Fig. 1). To maintain trial and data integrity, all flow conditioning work was undertaken under similar conditions, i.e. the same time of day and using the same equipment. Additional demand for flow conditioning were implemented at the time of morning peak (Fig. 4) to minimise flushing discharge rate and volume.5. Data monitoring during flow conditioning
The turnover or transit time for water to travel the length of each trunk main is approximately 3.5 hours. As a result, 15 minute sampling resolution was considered acceptable to define the expected turbidity responses due to the flow conditioning. Continuous data (both flow and turbidity) was measured at a 15 minute sampling frequency to maintain consistency with trial data. Flow increases were monitored and controlled by purpose built Langham hydrant standpipes with electromagnetic ABB Aquamaster 3 flow meters with ±5% reading accuracy and maximum working pressure of 12 bar. Turbidity responses during flow conditioning were measured by ATI NephNet instruments using an infrared (IR) nephelometric measurement process with functioning range limited to 0–4 NTU for high resolution with ±0.001 accuracy. Turbidity was spot checked with discrete samples tested using a 2100Q Hach handheld instrument which was laboratory calibrated using multiple turbidity standards and set to 0–100 NTU range with ±2% reading accuracy.6. Long term continuous data monitoring
Aquamaster 3 flow meters were installed at the inlet of each trunk main prior to the investigation to capture long-term flow data. Upstream treated water turbidity was monitored by a Sigrist Aquascat 2 WTM turbidity meter at the treatment outlet. This uses IR nephelometric measurement and has an operating range was 0–4 NTU with reading accuracy of ±0.001 NTU. To capture the long term impacts of the trunk mains on turbidity, including in the case of any unplanned event (e.g. burst), there was continuous downstream turbidity monitoring on each of the three trunk mains. From October 2015 to February 2016 these were ATI NephNet instruments set to a 0–4 NTU range. After February 2016, Evoqua Hydraclam instruments were deployed which use the same IR nephelometric measurement, a range of 0–10 NTU and accuracy of ±5% of reading. Continuous data was planned to be spot checked every two weeks using the same laboratory calibrated 2100Q Hach handheld instrument as used during the flow conditioning events, although changes in equipment suppliers and network events meant some periods of missing data occurred.To calibrate pipe roughness, up and downstream pressure data was collected using Syrinix Transientminder at 15 minute sampling frequency for each of the three trunk mains. The pressure logger range was 0–20 bar with an accuracy of 0.1% of full-scale output.
7. Data processing and analysis
Optic lens fouling can occur causing drift in turbidity measurements over time.22 To reduce potential drift effects, ATI NephNet lenses were planned to be cleaned on-site fortnightly during its deployment period (from October 2015 to February 2016). No drift and good agreement with spot checks were observed following this procedure. Hydraclam turbidity loggers were deployed after February 2016 with any potential drift adjusted using a patented proprietary Evoqua post-processing algorithm. Results again demonstrated agreement with on-site handheld spot checks. The Aquascat 2 WTM turbidity logger maintenance was conducted regularly as part of regulatory work and no significant issues reported.Noise was observed in the continuous downstream turbidity data with relatively lower signal to noise for the ATI compared to the Hydraclam instruments. One cause could be the sampling protocol with the ATI using a continuous 0.5 l min−1 sample flow versus the Hydraclam using a purging method (no fixed sample flow) with a 6 litre discharge just prior to measurement every 15 minutes. As the turbidity instruments were attached directly to the trunk main via a hydrant riser, it is possible that effects within the riser may have contributed to the noisy signals observed, with greater impact arising from the purging process. The 6 litre purge volume was selected based on hydrant chamber drainage to avoid potential flooding. To reduce the impacts of noise in the turbidity data, a 1 hour rolling mean was applied. Different rolling means were investigated with 1 hour window selected based on minimising the signal to noise effects while retaining the measured behaviour. Fig. 5 shows a rolling mean sensitivity study for typical turbidity data measured from TM-2.
Turbidity measured during the planned flow conditioning operations did not exhibit noise as conditions were well mixed by the higher continuous flow through the hydrant and hence no filtering was applied to this data.
8. VCDM process for the investigated trunk main
It was anticipated that the trunk main with the highest periodically imposed shear stress would produce the most distinct turbidity responses. Therefore, calibration of TM-1 was undertaken first to assess the VCDM simulation performance and then explore parameter transferability on the other two trunk mains.Prior to VCDM simulation, hydraulic representation of each trunk main was calibrated for normal daily hydraulic conditions. Accurate simulation of headloss is required as the VCDM uses this to calculate the imposed shear stress. The pipe roughness (ks) boundary condition required to calculate headloss was determined from measured pressure differences, and internal diameter (ID) was estimated from the concept of a 1 mm ks reduces effective ID by 2 mm.37 Hydraulic parameters were identified using PEST calibration software38 in conjunction with EPANET39 model to select unique paired (ks and ID) values where calibrated ID was constrained by the ID in the water companies GIS records. Zero leakage was considered for hydraulic calibration. Table 2 presents the optimised hydraulic properties where the three trunk mains were modelled as single pipe lengths with no changes in ID or branches (offtakes).
| Trunk main | Internal pipe diameter [mm] | Roughness, ks [mm] | Length [km] | |
|---|---|---|---|---|
| TM-1 | 303.2 | 8.50 | 6.4 | |
| TM-2 | 395.8 | 10.35 | 5.6 | |
| TM-3 | 292.3 | 7.50 | 5.9 | |
Calibration of hydraulic models and pipe wall material conditions were established with an initial 9 months of data with then a further 12+ months data used for turbidity model calibration. Model calibration was undertaken by manually tuning the three parameters (βr, βe, α) with initial values extrapolated from previous findings.35 Manual calibration enabled understanding of the effects of the parameters on simulation behaviour. The measured treated water turbidity was used to confirm that there were no turbidity events originating from the WTW that could be erroneously attributed to the pipe network with the result incoming turbidity was set as zero in all simulations. WTW turbidity is included in later plots to enable visual assessment of this simplification. The quality of the model fit was quantified by Nash–Sutcliffe Efficiency (NSE), widely used to describe both hydraulic and hydrological model performance. It assesses the quality of the model fit relative to the average of measured data (values can range from −∞ to 1 with NSE = 1 corresponding to a perfect match, NSE = 0 indicates model predictions are as accurate as the mean of the observed data and NSE < 0 when the observed mean is a better predictor than the model40). NSE is sensitive to outliers and mean values, hence it was assessed for both the full simulation period, dominated by general low background turbidity, and hydraulic events with periods of elevated turbidity.
The VCDM tracks the amount of material across a range of layer strengths with the initial conditions needing to be defined at the start of a simulation. A nine-month period prior to the flow conditioning events was used to ensure accurate estimation of this initial layer state. At simulation start a layer condition of maximum material (φ = 1.0) was assumed. This causes initial high modelled turbidity as weaker material is removed, yet due to the rapid rate of mobilisation a realistic condition in balance with daily flows is achieved within a few days. This data is not used for VCDM turbidity calibration but allows for the effects of historical elevated flows on layer condition to be accounted for.
The VCDM discretises the shear stress range into independent bands, considered to be analogous to co-existing layers of material with discrete shear strength properties. How many bands are required is a non-trivial selection between accuracy and computational expense. To identify the suitable number a sensitivity analysis was conducted with increasing numbers of strength bands. Fig. 6 shows the results of this for TM-1. The sensitivity study showed that 20 or more bands produced a lower error metric (higher NSE) for TM-1 with little change in computational time. To ensure accuracy at this stage, the model was set to simulate the response by dividing the input shear stress range into 100 discrete strength bands.
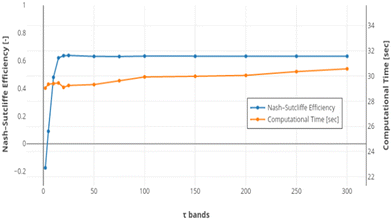 | ||
| Fig. 6 Sensitivity analysis of model calibration as a function of number of discrete strength bands tracked within the VCDM. | ||
Results
1. Long-term data monitoring
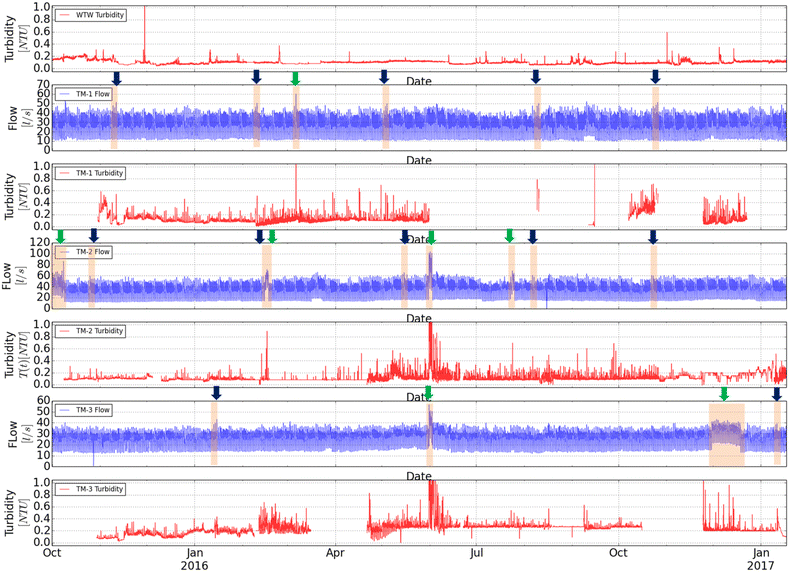
Fig. 7 shows the long-term (15 months) measured flow and turbidity for upstream (post treatment) and downstream in each trunk main. Fig. 7y-axis is clipped to 0–1 NTU to allow visual assessment of the long term responses. While all the flow conditioning trials (dark blue arrows on Fig. 7) were initially planned to be undertaken at similar times, TM-3 trials started later due to operational constraints. The data shows that treated water turbidity was between 0.05–0.2 NTU, indicating high consistency in water-quality exiting the treatment works.A number of burst events (cross-validated with water company repair and customer contact records) impacted the flow in the trunk mains during the trial period and these are indicated with green arrows in Fig. 7. Most of the bursts occurred in downstream distribution zones. A significant event impacting TM-2 and TM-3 in May/June 2016 however was directly on the trunk main. It occurred in TM-3 on 31st May 2016, 1.3 km from the WTW outlet. Due to the required repairs, TM-3 demand was added to TM-2 until the first available cross-connection at 1.7 km from the treatment works and the resulting additional 40 l s−1 flow at peak demand in the 1.7 km section of TM-2 led to material mobilisation and a notable turbidity event. With the cross connection open, the turbidity could also propagate through TM-3 and with comparable travel times in both mains, the response was observed passing the downstream monitoring stations of TM-2 and TM-3 at similar times. Due to the complexity and uncertainty of this event it could not be used for validation. A longer running but less significant TM-3 event in December 2016 was due to a leak on the trunk main itself that induced an additional 6 l s−1 about 2 km from the WTW outlet. This was repaired without any rezoning activities.
2. Trunk main 1
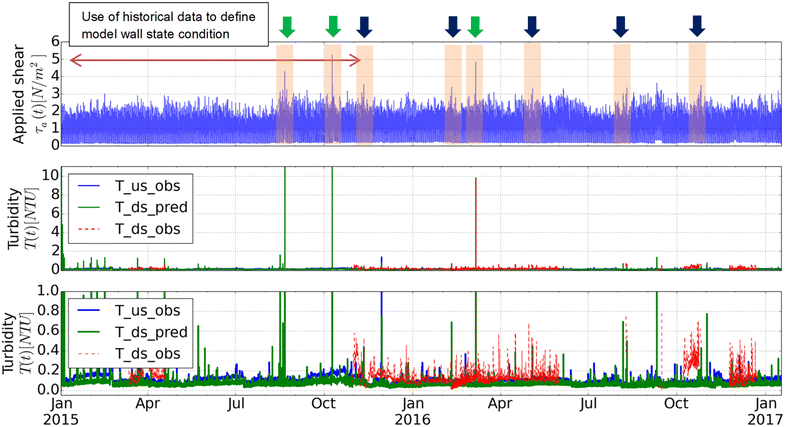
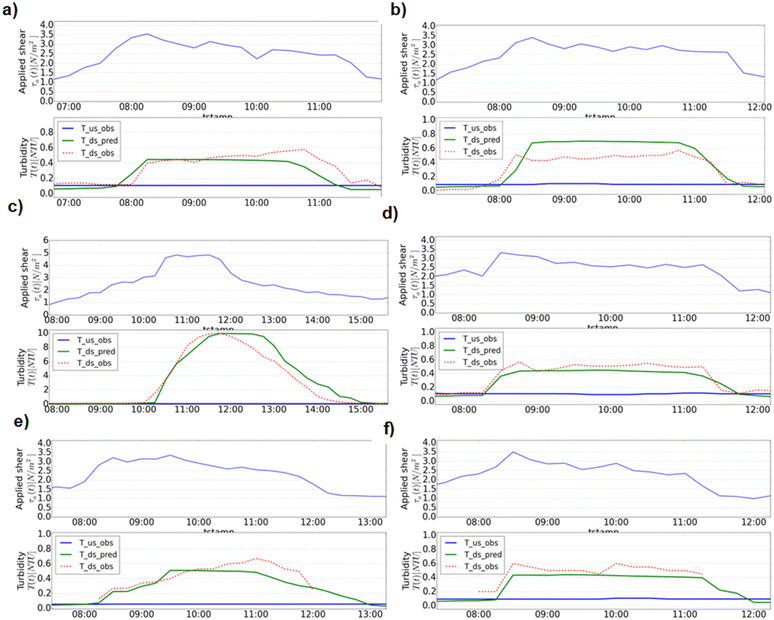
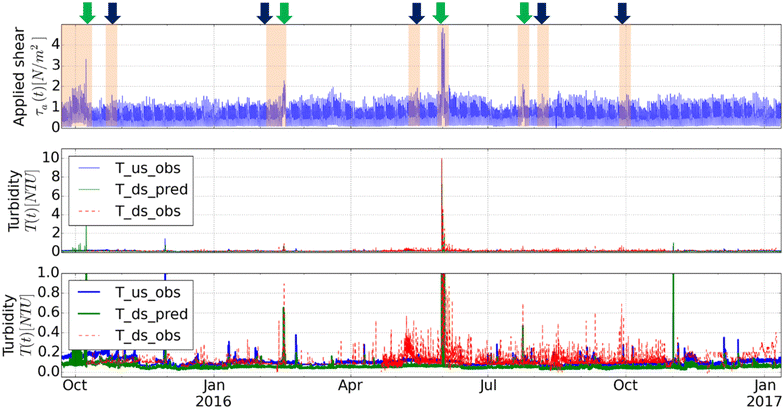
TM-1 VCDM calibration results showing imposed shear stress with simulated and measured turbidity responses from a single long term simulation between January 2015 to January 2017 are shown in Fig. 8. The plot includes the nine-months pre-trial (January to September 2015) used for the model to develop initial wall state conditions. As expected the model over-predicts the initial turbidity response in this period as the starting condition is set with all layers fully developed (φ = 1). With realistic layer conditions established, the model was then calibrated for October 2015 to January 2017. The ability of the model to simulate turbidity events is important, hence calibration focuses on these periods, with acceptable values of NSE achieved for all events with a single long term simulation and parameter values fixed for the full period. NSE of 0.62 for the complete period is considered positive as prolonged data with low variation (typical background behaviour) and the occasional outliers can distort and dominate NSE calculations.Fig. 9 presents results for the flow conditioning and burst event measured and simulated turbidity from TM-1. Fig. 9(a) shows that the 0.5 NTU measured turbidity response was simulated successfully following an increase of imposed shear up to 3.5 N m−2. After three months (February 2016), the turbidity response indicates the network accumulated enough material to cause a 0.45 NTU turbidity responses due to an equivalent 3.5 N m−2 shear stress event with the VCDM showing a slight over prediction in Fig. 9(b), and corresponding lower NSE in Table 3. Fig. 9(c) presents the burst event in TM-1 that occurred in March 2016 where shear stress increased rapidly up to 5.0 N m−2 (≡60 l s−1) for about 2 hours with a resulting 10.0 NTU observed and simulated. With a shorter accumulation period after the burst, Fig. 9(d) presents the conditioning event in May 2016 that produced a turbidity response of 0.5 NTU, again simulated effectively by the VCDM. Fig. 9(e) and (f) further demonstrate the ability of the VCDM by recreating flow conditioning event responses undertaken in August and October 2016. The simulation results for all planned and unplanned events from Fig. 8 and 9 show the model simulated peak measured turbidity with an average accuracy of ±0.2 NTU.
| Calibration point | Total [+12 mos] | Trial | |||||
|---|---|---|---|---|---|---|---|
| 1 | 2 | Burst March 2016 | 3 | 4 | 5 | ||
| NSE (−) | 0.62 | 0.78 | 0.63 | 0.96 | 0.79 | 0.80 | 0.86 |
Overall it was possible to calibrate the VCDM model to represent the turbidity behaviour of TM-1. This supports the modelling concepts proposed, including simultaneous accumulation and mobilisation across all layer strengths. In addition, the use of single values for the three model parameters over the entire two-year simulation highlights potential for long-term application including scenario planning and maintenance scheduling.
3. Trunk main 2
The VCDM mobilisation and accumulation functionality were further validated for TM-2 using the parameters derived for TM-1 as initial values. Fig. 10 shows the applied shear stress of TM-2 from October 2015 till January 2017 including upstream-downstream measured turbidity and simulated turbidity response from a single simulation. The TM-2 simulation was again initialised using shear stress data from January 2015 till September 2015. This is not presented in Fig. 10 as there were no measured flow events in this period and thus in this case a week's flow data would have been sufficient for estimation of initial model layer state.TM-2 was the passive flow conditioning main with lower quarterly shear stress events. Several large burst events, inducing much higher flows than for the planned trials, were recorded during the monitoring period. Due to these bursts mobilising material from the pipe wall none of the planned events produced significant turbidity responses. As a result, the bursts that produced notable turbidity were used for testing VCDM simulation performance. The overall calibration of +12 months' data is presented in Table 4 indicating a satisfactory but low overall NSE value of 0.44. Average NSE values for the burst induced responses however were 0.77, indicating strong event calibration.
| Calibration point | Total [+12 months] | Burst February 2016 | Burst June 2016 | Burst July 2016 |
|---|---|---|---|---|
| NSE (−) | 0.44 | 0.81 | 0.78 | 0.72 |
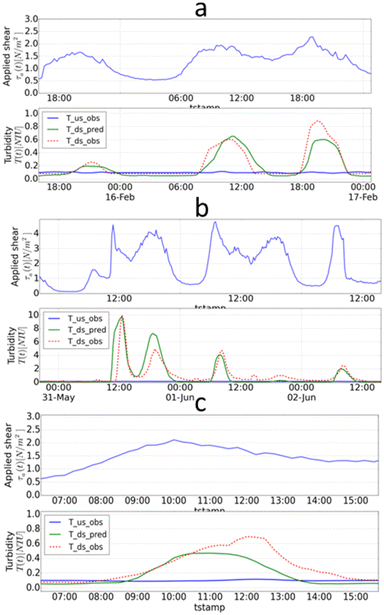
Fig. 11 presents results for the burst events with measured and simulated turbidity from TM-2. Fig. 11(a) shows a burst event that impacted flow and turbidity for 3 days in February 2016 where maximum measured turbidity response was 0.8 NTU. There was increasing daily maximum shear stress and repeated turbidity responses. The VCDM simulated events over these three days generally well, although a slight under-prediction is noted on the final day (peak measured 0.85 NTU, modelled 0.6 NTU). Fig. 11(b) shows results from a significant burst event in TM-3 in May 2016. As part of rezoning during the 60 hour repair period, shear stress in TM-2 was increased up to 4.4 N m−2 (normal preceding peak shear stress was 1.5 N m−2, effectively 60 l s−1 to 100 l s−1) leading to a 10 NTU turbidity response. The resulting imposed excess shear stress during the short period of daily peak demand was high, but due to the short duration not all material up to this shear strength was mobilised. As a result, repeated daily peaks in demand led to a sequential yet decreasing turbidity response, evidence that a new conditioned state delivering higher network resilience is being achieved. The simulation generally captures the four significant turbidity responses well across the multiple days of this post-burst rezoning event. Fig. 11(c) show an event occurring in July 2016 with 0.7 NTU observed, effecting a single day. Simulation of turbidity is acceptable with a slight under-prediction during the decay phase, although the secondary turbidity rise suggests a further increase in hydraulics that may not have been captured by the 15 minute flow data.
TM-2 results in conjunction with TM-1 confirms the ability of the VCDM to simulate observed turbidity behaviour in a single long term simulation and with fixed parameter values. The ability of the model to capture accumulation and sequential mobilisation for larger and multi day events is also highlighted, highlighting value for risk assessment, scenario planning and pro-active maintenance strategies.
4. Trunk main 3
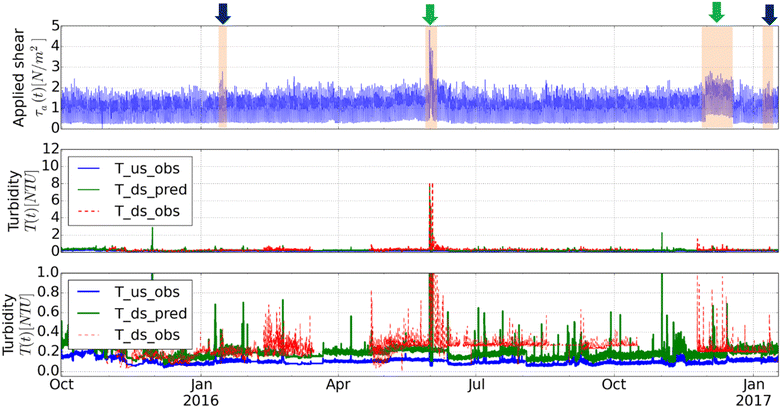
The model was further validated using the data collected on TM-3, assigned as a control with only start and end flow conditioning events planned. Fig. 13 shows the results of simulating TM-3 using a single simulation and calibrating to the same 15 months' period using initial parameter values established in TM-1 and TM-2. As previously the model was initially run for nine months (January 2015 to September 2015) to define the material layer conditions at the start of the period for model calibration, although for this main the first flow conditioning was delayed. Two burst events occurred, in June and December 2016 (Fig. 7 and 12), although the former impacted TM-2 with the response observed here due to an open cross-connection during repairs. No significant turbidity response was measured from the burst in December 2016 due to its low magnitude and location at the upstream point. The planned trial in January 2016 was therefore the sole event for model calibration and returned a strong NSE model calibration value of 0.91 (+12 month total NSE value was 0.24). Fig. 13 shows the results from this flow conditioning where 0.45 NTU turbidity was observed, demonstrating the good agreement between the measured and simulated turbidity.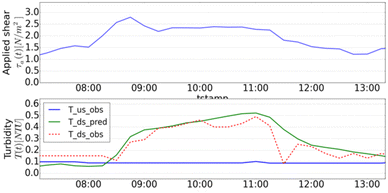 | ||
| Fig. 13 TM-3 Trial 1 January 2016, top graph shows applied shear stress and bottom graph the modelled and measured turbidity response. | ||
5. VDCM parameters
The calibrated parameters for all three mains were found to be similar with the mobilisation rate (βe) between 3 × 10⁻⁵ and 7.0 × 10⁻⁵ N−1 m2 s−1, material release coefficient (α) between 1.5 and 3.15 NTU m s−1 and the accumulation period between 1.65 to 1.85 years. The lowest accumulation period was found in TM-1 of 1.85 years, the partially lined main, whilst TM-2 was 1.65 years and TM-3 was 1.7 years, both mains unlined CI.6. Investigating accumulation behaviour
Previous research suggests that the rate at which material accumulates may be a function of temperature due to its influences on microbial and chemical processes. Hence it is possible that the field data collected here could show seasonal variation with temperature (Fig. 3). To explore seasonal variation in accumulation (βr), the model was calibrated for each quarterly measured period by changing βr while mobilisation parameters (βe, α) were held constant. Such seasonal calibration of βr requires distinctive turbidity responses at approximately quarterly intervals, hence this was only possible for TM-1. Table 5 illustrates the calibrated βr results for every three-month period starting from the first flow conditioning trial. βr was assumed null during first planned trial response as there was no previous calibration point available. The improvement in fit can be seen in the NSE values in Table 5. These are not directly comparable to the values in Table 3 that are for event duration only.Quarterly calibration for TM-1 indicate that βr was slower during the colder months (period for full material accumulation is greater) and quicker in warmer periods of the year. The slowest accumulation period of TM-1 was calibrated at 2.7 years when the average treated water temperature was 4 °C, and the fastest 1.6 years at 15 °C. These results support laboratory based observations that (water) temperature does influence the material accumulation processes in operational systems.22,41
Discussion
1. VCDM performance
VCDM validation was undertaken using long-term data from three similar trunk mains that included multiple shear stress (elevated hydraulic) induced turbidity events. Calibration results show the model successfully simulated the turbidity behaviour by tracking continual material accumulation and mobilisation behaviour as determined by the imposed system shear stress. High NSE assessment scores, particularly during events, demonstrated strong parameter calibration in all 3 mains with the model simulating turbidity for both planned and unplanned events over the range of forces and durations. The model simulated peak turbidity response within an average accuracy of ±0.25 NTU using fixed parameter values for the complete simulation period for each trunk main. One of the potential applications of the VCDM is to inform hydraulic management (e.g. flow conditioning) to minimise future discolouration risk. In the UK the regulatory turbidity at consumer's taps is 4.0 NTU. With the VCDM accuracy range identified in this work, it can be a suitable tool to plan against potential turbidity failures, especially when output values can be constrained, e.g. to 1.0 NTU.With multiple planned and unplanned events, the model is shown through successful calibration capable of simulating a range of operationally representative shear stress scenarios. These included relatively low increases in system shear stress above daily demands, such as the passive flow conditioning, higher elevations as in the normal conditioning trials and extreme events such as unplanned bursts. In addition, with a linear accumulation rate the model is shown able to account for the varying periods and hence material layer development between events. These results support the validity and application of the VCDM and the concepts that underpin it. Specifically, that the cohesive behaviour of material that causes discolouration occurs across the operational shear stress range and can be discretised into bands, with accumulation occurring simultaneously across all shear strengths. The results also further validate model mobilisation functionality, and that together with a linear accumulation rate the turbidity behaviour may be tracked, and hydraulic responses simulated and therefore predicted, over long and future periods.
For this study, model calibration was conducted using a manual search process. The VCDM has three empirical parameters to calibrate, making it relatively easier than its predecessor PODDS model with four parameters. While manual calibration cannot guarantee global minima or unique solutions with reduced parameter uncertainty, the parameter transferability found in three trunk mains provides confidence in model optimisation. An automatic calibration process could be used to facilitate optimisation. However, NSE scores also indicated that care is required to avoid over sensitivity towards outliers or background turbidity trends when calibrating across long term monitoring periods.
The study highlighted that the tracked number of shear strength bands within the VCDM is important for model accuracy (Fig. 6). It was found that a low number of bands (<20) produced unacceptable error with the shear stress range investigated here. Yet with no significant difference in computational time observed, selecting a higher level of discretisation was not an issue and hence the 100 bands selected in this work.
Prior to use for scenario planning and greater understanding of field calibrated parameters, empirical calibration is currently essential to develop confidence in model output. Careful and further investigation is required for the variety and range of networks to understand the significance of parameter variance. With greater understanding, and acknowledging the agreement shown in parameters calibrated here, it is hoped preliminary calibration may become unnecessary.
2. Parameters and accumulation
The final parameter calibration results were similar between the trunk mains for the mobilisation rate (βe) and material release coefficient (α). βe is a function of excess shear stress and α is a scaling factor. The accumulation period parameter (βr) is the time taken for a material shear strength band to go from no material to a fully developed layer representing maximum discolouration risk, and was also found to be similar in all three trunk mains. It is anticipated that the model parameters were similar due to the hydraulic, asset and water quality similarities between the trunk mains (see Fig. 4). Similar conclusions were suggested from previous studies.35The accumulation period parameter value of 1.65–1.85 years found here for trunk mains is comparable with that estimated previously for pipes in reticulation or local distribution systems, which found around 1.5 to 2 years in UK systems with cast iron pipes15 and within 1.5 years in a network in Netherland.18 Both these studies used calculations from turbidity data to estimate the accumulation period, rather than via model fitting as reported here. The values found are also comparable with previous VCDM modelling assessment where values were found between 0.5–5.0 years depending on water source and pipe materials.34,35 However, these previous studies have limited repeated turbidity mobilisation events and hence low confidence. The ability to determine an accumulation period, or transition to maximum risk, by fitting to flow and turbidity data highlights significant potential for this modelling approach as this offers the possibility to assess and quantify network performance and discolouration risk with respect to water quality. By using this non-invasive approach, operators may now also investigate factors such as changes in temporal or spatial performance and the impact of different capital or operational strategies.
Similar accumulation period values found for the three trunk mains suggests that the variables that were fixed for this dataset, including bulk water quality, are more significant for accumulation periods than varying operational conditions. This finding is significant for network management as it indicates that irrespective of intervention e.g. invasive cleaning such as jetting or pigging, new pipe or lining, discolouration material and hence risk is not impacted and will regenerate post-event at the same rate. For managing discolouration risk therefore all cleaning strategies may be equally effective, with the primary difference being the amount of wall-bound material that may be removed as more invasive strategies may remove higher shear stress material that under normal operational conditions would not however pose a mobilisation risk. Critically it highlights that ongoing periodic maintenance is required as one-off strategies can only deliver short-term value. Knowledge of site-specific accumulation periods (βr) is therefore a key move towards developing proactive discolouration management as risk return and hence maintenance intervals can be determined that can also help inform Water Safety Plans and Whole Life Costing models.
The βr parameter was found to be lower (faster accumulation) in the unlined CI mains (TM-2 and TM-3) than the partially lined trunk main (TM-1), although the small differences and limited repeated mobilisation events in TM-2 and 3 limit this finding. Previous research has however showed that corrosion contributes to discolouration risk.2,3,15 This is consistent with the accumulation period modelling analysis for the partial unlined pipe. The longer accumulation period found for partially lined systems indicates a negative impact to water quality from unlined cast iron mains. This result agrees with the understanding of replacing or lining unlined cast iron mains to minimise discolouration risk.
The changes in TM-1 βr parameter values across different periods suggests that temperature has an influence on accumulation processes. This supports the theory that material accumulation is a biologically mediated process as higher water temperature is associated with increased microbiological and therefore biofilm activity.27,29 It would therefore be expected to observe more material accumulating during warmer periods, as also seen by Blokker and Schaap.9 Higher material accumulation in the warmer seasons however could also be linked to the higher treated water organic and inorganic metal concentrations loadings, as shown in Fig. 3. Higher temperatures also increase reaction rates42,43 including corrosion and accelerate disinfection decay rates, although research has indicated counter-intuitively that higher chlorine concentrations returned greater discolouration risk.21 Linking accumulation rates to biofilms is supported by research suggesting biofilms provide a surface matrix that captures discolouration particles.44,45 With potentially greater biofilm growth, it can be proposed more material may trap into the biofilms, elevating the discolouration risk.13,16,28
The higher βr (slower regeneration) found for cold temperatures could be an artefact of the dataset as there is only one cold period analysed. However, considering the loading variations of organic–inorganic water quality parameters (Fig. 3) and temperature influence on microbial processes,46 it can be suggested that material accumulation can vary seasonally as a function of temperature. The temperature effect is critical for water utilities, especially with growing concerns about long-term impacts of climate change on water quality. In the Netherlands, water temperature is regulated at a maximum 25 °C (ref. 47) to reduce potential water quality failures that may be associated with temperature and biological stability. The VCDM could therefore benefit by having an integrated time variant sub-accumulation model encapsulating water temperature.48 Adding the sub model, e.g. temperature or biofilm regrowth model, the time-variant βr would increase modelling complexity and computational time. However, the current model simulation performance is satisfactory and this simplified time-invariant model has been demonstrated here to produce accurate long-term turbidity simulations.
Conclusions
This paper demonstrates validation of the Variable Condition Discolouration Model that simulates material mobilisation and accumulation processes simultaneously with the resulting capability of tracking long-term turbidity behaviour. Key findings are:• The VCDM can track long-term material mobilisation and accumulation behaviour occurring in large diameter trunk mains based on imposed hydraulic forces. It is shown capable of recreating the observed downstream turbidity responses with an average peak turbidity accuracy of ±0.25 NTU using three fixed empirical parameters.
• Accurate model calibration supports the concepts of:
○ material mobilisation and accumulation occurring continuously
○ cohesive wall bound discolouration material can be discretised into independent shear strength bands
○ simultaneous linear accumulation across all layer shear strengths.
• VCDM calibrated accumulation periods showed consistency for all mains investigated here, with similar network characteristics and source water quality, irrespective of imposed hydraulic conditions or time between events for accumulation periods.
• Tracking pipe wall layer condition, in particular the accumulation functionality validated here for the first time that informs discolouration risk, facilitates pro-active management for hydraulic based scenarios including periodic maintenance planning.
Author contributions
Iftekhar Sunny conducted the fieldwork and prepared the draft paper with project administration and supervision undertaken by Stewart Husband and Joby Boxall. Analysis and writing review shared equally.Conflicts of interest
There are no conflicts to declare.Acknowledgements
The authors are grateful to Scottish Water for supporting the research by giving network access and allowing data collection. Special thanks to Will Furnass from the University of Sheffield for VCDM development and to Graeme Moore, Nick Drake, Kevan Mckenzie, David Main and Kes Juskowiak from Scottish Water for facilitating the research work. This study was sponsored by Scottish Water and the Pennine Water Group under platform grant EP/1029346/1. Authors declare no conflict of interests.For the purpose of open access, the author has applied a creative commons attribution (CC BY) license to any author accepted manuscript versions arising.
References
- M. Polychronopolous, K. Dudley, G. Ryan and J. Hearn, Water Supply, 2003, 3, 295–306, DOI:10.2166/ws.2003.0117.
- D. Cook and J. B. Boxall, J. Pipeline Syst. Eng. Pract., 2011, 2, 113–122 CrossRef.
- S. Husband and J. B. Boxall, J. Environ. Eng., 2010, 136, 86–94 CrossRef CAS.
- D. Cook, S. Husband and J. B. Boxall, Urban Water J., 2015, 13, 382–395 CrossRef.
- J. B. Boxall, P. J. Skipworth and A. Saul, Water Software Systems: V. 1: Theory and Applications, Water Eng. Manage., 2001, 263–273 Search PubMed.
- J. H. G. Vreeburg, Doctorate of Philosophy, Technical University of Delft, 2007 Search PubMed.
- G. Ryan, P. Mathes, G. Haylock, A. Jayaratne, J. Wu, N. Noui-Mehidi, C. Grainger and B. V. Nguyen, Particles in Water Distribution System: Characteristics of particulates Matter in Drinking Water Supplies, CRC, Australia, 2008 Search PubMed.
- J. B. Boxall and A. Saul, J. Environ. Eng., 2005, 131, 716–725 CrossRef CAS.
- E. J. M. Blokker and P. G. Schaap, Computing and Control for the Water Industry, Procedia Engineering, Unted Kingdom, 2015, pp. 280–289 Search PubMed.
- J. B. Boxall, P. J. Skipworth and A. Saul, Water Sci. Technol.: Water Supply, 2003, 3, 179–186 Search PubMed.
- I. W. Pothof and E. J. M. Blokker, Drinking Water Eng. Sci., 2012, 5, 87–92 CrossRef CAS.
- S. Husband, J. B. Boxall and A. Saul, Water Res., 2008, 42, 4309–4318 CrossRef PubMed.
- R. L. Sharpe, C. Biggs and J. B. Boxall, Proc. Inst. Civ. Eng.: Water Manage., 2017, 1–11 Search PubMed.
- S. Husband, J. Whitehead and J. B. Boxall, Proc. Inst. Civ. Eng.: Water Manage., 2010, 163(8), 397–406 Search PubMed.
- S. Husband and J. B. Boxall, Water Res., 2011, 45, 113–124 CrossRef PubMed.
- E. J. M. Blokker and P. G. Schaap, Computing and Control for the Water Industry, Procedia Engineering, United Kingdom, 2015, pp. 290–298 Search PubMed.
- J. B. Boxall, A. Saul, J. D. Gunstead and N. Dewis, World Water & Environmental Resources Congress, American Society of Civil Engineers, Philadelphia, Pennsylvania, United States, 2003, pp. 1–9 Search PubMed.
- J. Vreeburg, D. Schippers, J. Q. J. C. Verberk and J. C. van Dijk, Water Res., 2008, 42, 4233–4242 CrossRef CAS PubMed.
- V. Gauthier, B. Gérard, J.-M. Portal, J. C. Block and D. Gatel, Water Res., 1999, 33, 1014–1026 CrossRef CAS.
- S. Husband and J. B. Boxall, Water Res., 2016, 107, 127–140 CrossRef CAS PubMed.
- K. E. Fish, N. Reeves, S. Husband and J. B. Boxall, npj Biofilms Microbiomes, 2020, 6, 34, DOI:10.1038/s41522-020-00144-w.
- J. W. Gaffney and S. Boult, J. Environ. Eng., 2012, 138, 637–644 CrossRef CAS.
- A. Aisopou, I. Stoianov and N. Graham, Water Distribution Systems Analysis, American Society of Civil Engineers, Tucson, Arizona, United States, 2010, pp. 522–534 Search PubMed.
- S. L. Weston, R. P. Collins and J. B. Boxall, Environ. Sci.: Water Res. Technol., 2019, 12 10.1039/c9ew00686a.
- S. L. Weston, R. P. Collins and J. B. Boxall, Water Res., 2021, 194 DOI:10.1016/j.watres.2021.116890.
- E. J. M. Blokker, J. H. G. Vreeburg, P. G. Schaap and J. C. Dijk, Water Distribution Systems Analysis, American Society of Civil Engineers, Tuscon, USA, 2010, pp. 187–199 Search PubMed.
- K. E. Fish, R. L. Sharpe, C. Biggs and J. B. Boxall, PLOS Water, 2022, 18, e0000033, DOI:10.1371/journal.pwat.0000033.
- M. P. Ginige, J. Wylie and J. Plumb, Biofouling, 2011, 27, 151–163 CrossRef CAS PubMed.
- S. Husband, K. E. Fish, I. Douterelo and J. B. Boxall, Water Sci. Technol.: Water Supply, 2016, 16(4), 942–950 Search PubMed.
- G. Meyers, Z. Kapelan and E. Keedwell, Water Res., 2017, 124, 67–76 CrossRef CAS PubMed.
- N. Dewis and M. Randall-Smith, Water Asset Management International, 2005, vol. 1, pp. 16–18 Search PubMed.
- K. McClymont, E. Keedwell, D. Savić and M. Randall-Smith, J. Hydroinf., 2013, 15, 700–716 CrossRef.
- I. Sunny, S. Husband and J. B. Boxall, Water Res., 2020, 169 DOI:10.1016/j.watres.2019.115224.
- W. R. Furnass, R. P. Collins, S. Husband, R. L. Sharpe, S. R. Mounce and J. B. Boxall, Water Sci. Technol.: Water Supply, 2014, 14(1), 81–90 Search PubMed.
- W. R. Furnass, R. P. Collins, S. Husband, R. L. Sharpe, S. R. Mounce and J. B. Boxall, Smart Water, 2019, 4, 1–24 CrossRef.
- S. Husband and J. B. Boxall, J. Water Supply: Res. Technol.--AQUA, 2015, 64, 529–542 CrossRef.
- J. B. Boxall, A. J. Saul and P. J. Skipworth, J. - Am. Water Works Assoc., 2004, 96, 161–169 CrossRef CAS.
- J. Doherty, PEST, Model-independent parameter estimation—User manual, with slight additions, Watermark Numerical Computing, Brisbane, Australia, 5th edn, 2010 Search PubMed.
- L. Rossman, Epanet 2: User Manual, USEPA, Cincinnati, OH, 2000 Search PubMed.
- J. E. Nash and J. V. Sutcliffe, J. Hydrol., 1970, 10, 282–290 CrossRef.
- C. Calero Preciado, V. Soria-Carrasco, J. B. Boxall and I. Douterelo, Front. Microbiol., 2022 DOI:10.3389/fenvs.2022.962514.
- H. M. Ramos, D. Loureiro, A. Lopes, C. Fernandes, D. Covas, L. F. Reis and M. C. Cunha, Water Resour. Manag., 2009, 24, 815–834 CrossRef.
- J. J. Vasconcelos, L. A. Rossman, W. M. Grayman, P. F. Boulos and R. M. Clark, J. AWWA, 1997, 89(7), 54–65 CrossRef CAS.
- R. G. Burns and J. E. M. Stach, Dev. Soil Sci., 2002, 28(2), 17–42 Search PubMed.
- I. Douterelo, R. L. Sharpe and J. B. Boxall, Water Res., 2013, 47(2), 503–516 CrossRef CAS PubMed.
- N. B. Hallam, J. R. West, C. F. Forster and J. Simms, Water Res., 2001, 35(17), 4063–4071 CrossRef CAS PubMed.
- C. M. Agudelo-Vera, E. J. M. Blokker, H. Kater and R. Lafort, Drinking Water Eng. Sci., 2017, 10, 83–91 CrossRef.
- E. J. M. Blokker and E. J. Pieterse-Quirijns, J. AWWA, 2013, 105, 1, DOI:10.5942/jawwa.2013.105.0011.
| This journal is © The Royal Society of Chemistry 2023 |

