
Effect of bacterial growth stage on the response to two-dimensional nanomaterials†
Zachary
Shepard
 a,
Zachary S. S. L.
Saleeba
b,
Muchun
Liu
c,
Robert H.
Hurt
b and
Vinka
Oyanedel-Craver
*a
a,
Zachary S. S. L.
Saleeba
b,
Muchun
Liu
c,
Robert H.
Hurt
b and
Vinka
Oyanedel-Craver
*a
aDepartment of Civil & Environmental Engineering, University of Rhode Island, Kingston, RI 02881, USA. E-mail: craver@uri.edu
bSchool of Engineering, Brown University, Providence, RI 02912, USA
cDepartment of Civil and Environmental Engineering, Massachusetts Institute of Technology, Cambridge, MA 02139, USA
First published on 2nd December 2022
Abstract
Bacterial growth stage plays an important role in how bacteria interact with nanoparticles, but the effect that two-dimensional nanomaterials may have on this interaction has yet to be rigorously studied. The goal of this study is to explore the role of the growth stage (non-growing, exponential, transitional, and stationary) of Escherichia coli (E. coli) in its response to graphene oxide (GO), MoS2, and MoSe2 colloidal nanosheets (ranging 0.00–2.52 μg GO–TOC, MoS2–Mo, or MoSe2–Mo mL−1). This study is the first to comprehensively examine the response of E. coli at its various growth stages to two-dimensional nanomaterials. We also examine bacterial response to novel two-dimensional nanomaterials (MoS2 and MoSe2) compared to an extensively studied material (GO). The bacterial responses were quantified in terms of respiration and growth rate and membrane permeability. A novel, high throughput technique was applied to rapidly reveal the range of biological responses that occurred. E. coli response to nanosheet exposure was dependent on the concentration and type of nanomaterial, and the bacterial growth stage. GO at 2.27 μg GO–TOC mL−1 led to a 17% reduction in respiration rate. Reductions in growth rate for this condition during the transitional and stationary stages were 9% and 87% respectively, compared to the 0.00 μg GO–TOC mL−1 control condition growth rate. When rapidly growing E. coli in a nutrient-rich environment is exposed to GO, the growth rate increased (up to 22% for the 2.27 μg GO–TOC mL−1 sample). Under these conditions, E. coli can use GO as a scaffold for cellular growth, leading to an increase in growth rate. MoS2 and MoSe2 have little impact on the growth and respiration of E. coli regardless of the environment. The membrane permeability assay shows that the Mo nanosheets lead to a greater increase in membrane permeability in E. coli compared to GO. Our characterization of the Mo materials shows that they are smaller and stiffer compared to GO, so they are more likely to puncture the membrane. This study demonstrates that microorganisms have a range of responses to nanosheets and that the physiological condition of the bacteria and the nanosheet type play important roles in their response.
Environmental significanceThis work has implications for the response of biological systems to nanosheets in suspension and applications in environmentally relevant technologies. Here, we show that the growth stage of the bacteria are important factors influencing biological response to the nanomaterial. We also use a high throughput technique that can be applied to demonstrate the range of bacterial responses to two-dimensional nanomaterials. Finally, the bacterial response to the nanosheets studied here indicates that the nanomaterials studied here could be used as biocompatible coatings for microbial fuel cell electrodes. |
Introduction
The properties and potential applications of two-dimensional (2D) materials have been the subjects of significant research, with studies focusing on topics ranging from flexible transistors, to super capacitors, to biosensing to environmental toxicity.1–3 The class of 2D nanosheets consists of a single layer or few layers of covalently bonded atoms that extend laterally in the XY plane in the micro- to nano-meter range to create sheet-like or plate-like particles.2 Some nanosheets in colloidal suspension have multiple layers that are held together by weak van der Waals forces.2 This study focuses on three types of nanosheets: graphene oxide (GO), molybdenum disulfide (MoS2), and molybdenum diselenide (MoSe2). GO nanosheets are single layers of hexagonally arranged carbon atoms (graphene nanosheets), decorated on the faces and edges with oxygen-containing functional groups, many of which protrude out of the nanosheet plane.4 The oxygen-containing groups impart polarity and hydrophilicity that enables GO nanosheet dispersion in aqueous media, often in the form of fully-dispersed, unstacked monolayers.1,3–5 MoS2 and MoSe2 are transition metal dichalcogenides (TMDs), which consist of a central layer of transition metal (molybdenum) atoms with layers of chalcogen atoms (sulfur or selenium) on either side.6 The transition metal and chalcogen atoms are covalently bonded to each other.6 MoS2 and MoSe2 nanosheets are relatively new types of two-dimensional nanomaterials and their interactions with microorganisms are less widely studied compared to GO. The large surface area, electronic properties, and mechanical strength of GO, MoS2, and MoSe2 make them attractive as enabling components in a variety of applications, including water treatment, electronics, electrocatalysts, microbial fuel cells, and sensors.1,5,6In the literature on bacterial–nanosheet interactions, GO is the most well-studied of the 2D nanomaterials studied here. The ability of GO to inhibit bacterial growth or cause physical damage to a cell depends on nanosheet size, shape, surface functionalization, concentration, solvent, and whether the nanosheets are in suspension or deposited on a surface.7–9 The mechanisms leading to reductions in bacterial proliferation and viability include cellular entrapment,7,10,11 cellular membrane damage from sharp edges,10,12 and oxidative stress.7 Graphene nanosheets have also been shown to penetrate mammalian cell membranes, beginning at sharp corner sites or asperities, which then initiates cell uptake and often complete internalization.13 The ultrathin (single-atom) geometry of GO and its micron-scale lateral dimension leads to an extreme aspect ratio (>1000) and associated paper-like flexibility that enables folding,13 wrinkling and crumpling,14,15 and conformal bacterial cell entrapment.13
Some studies have shown that bacterial cell growth can improve after contact with GO.8,16–18 Larger GO aggregates have been reported to act as scaffolds for bacterial growth.8,16 Rapidly growing communities of bacteria quickly occupy GO surfaces, which may shield the remaining planktonic bacteria from any GO effects.8,18,19 MoS2 and MoSe2 are less widely studied compared to GO. These nanosheets have been reported to have little impact on bacterial respiration and structure.20–22 These studies have focused on how the properties of the nanosheet affect bacterial response. This often leads to the hybridization of MoS2 and MoSe2 with other active nanomaterials to achieve the desired antibacterial or therapeutic properties.22–25 MoS2 and MoSe2 are representatives of the important class of transition metal dichalcogenides (TMDs), and they are sensitive to air oxidation leading to gradual dissolution in aqueous suspension either in storage or during use.26 These suspensions must be considered mixtures of solid nanosheets and soluble products, either one of which or both may drive biological responses.2 This is a potential co-exposure scenario in which the relative amount of solid (nanosheet) and soluble dissolution product (e.g. MoO42− ion in the case of MoS2 and MoSe2) may vary over time as the oxidative dissolution process proceeds.26
The impact of nanomaterials on a bacterial community can be studied using kinetic parameters, such as the respiration rate, growth rate (μ), or maintenance coefficient (ms).27–29 Respiration assays take advantage of the electron transport chain to measure the aerobic metabolism of a microorganism.30 The growth rate for a culture indicates how quickly the bacteria are reproducing.27,28 Specific growth rate, the rate of biomass generation for a cell population, is important because it is used as an intrinsic parameter for the growth of the culture.31 Respiration and growth rates have been used to quantify the effects of nanomaterials, including dysprosium nanoparticles,29 silver nanoparticles,32 and carbon nanotubes33 on bacteria.
Metabolic activity is an important aspect of bacterial response to nanoparticles.28,29,32,34 Previous studies have shown that bacteria with increased metabolic activity experience more toxic effects (reductions in respiration rate, substrate utilization, biomass concentration, etc.) following exposure to nanoparticles.28,29 In this study, we examine the effect of growth stage on bacterial response to two-dimensional nanomaterials. Studies examining the interactions between bacteria and two-dimensional nanomaterials have focused on how the properties of the nanomaterial affect the bio/nano interaction. The goal of this study is to address the lack of information regarding the impact of bacterial growth on the response of E. coli to GO, MoS2, or MoSe2. The effects of the nanosheets on the metabolic and physical characteristics of the E. coli were quantified using respiration, growth, and membrane permeability assays. A high throughput approach was used to explore the range of bacterial responses more effectively over a wide range of conditions.
Methods
Nanosheet preparation for bacterial assays
The nanosheets used in these experiments were synthesized using previously published methods (see ESI†) and characterized using X-ray diffraction, X-ray photoelectron spectroscopy, and scanning and transmission electron microscopy.2,13 Prior to use in any experiment, the nanomaterial suspensions were bath sonicated for 20 minutes in an L&R solid state ultrasonic T-288 bath sonicator. Nanomaterial concentrations were determined using a Shimadzu TOC-L (GO) and ICP-MS 2030 (MoS2 and MoSe2) before application in any experiments. Total organic carbon (TOC) quantification for the GO was performed according to Standard Method 5310B.35 The Mo95 isotope was used to quantify MoS2 and MoSe2 nanosheet concentrations after they were digested with hydrogen peroxide and 2% nitric acid (1 mL sample: 1 mL 30% hydrogen peroxide: 2 mL 2% nitric acid) for 48 hours.26 TOC and ICPMS samples were measured in duplicate. Here, we present the concentration of the nanosheets as μg GO–TOC, MoS2–Mo, or MoSe2–Mo mL−1, for the GO, MoS2, and MoSe2 nanosheets, respectively. These units signify that the nanosheet concentrations are presented as μg TOC mL−1 for GO and μg Mo mL−1 for the molybdenum nanosheets.Nanosheets were added to the bacterial suspensions at a constant mass dose of 0.00–2.52 μg GO–TOC, MoS2–Mo, or MoSe2–Mo mL−1. The range of nanosheet concentrations utilized here is on the lower end of the concentration range that has been shown to elicit responses from microorganisms in previous studies.7,8,18,36–41 This concentration range was selected to be close to the environmentally relevant range of concentrations in the environment. The concentration of nanosheets in the environment has yet to be rigorously quantified, but is likely similar to other engineered nanomaterials (TiO2, silver nanoparticles, carbon nanotubes, etc.).42,43 These materials are in the μg L−1 to ng L−1 range in surface waters.42,43 In order to determine the concentration of the dissolved fraction of the MoS2 and MoSe2 nanosheets, samples were filtered on 3 kDa polyethersulfone centrifugal filters at 5000 RPM for 30 minutes and the filtrate analyzed for atomic Mo as described above.
Bacteria culture and assay preparation
The model organism for the bacterial experiments described here was a strain of E. coli (BTF 132) expressing the gene for the production of green fluorescent protein (GFP).44,45 For each experiment, E. coli were grown for 12 hours in Lysogeny broth (LB) media (50 mL).29,32 The cells were pelleted via centrifugation and washed twice with 10 mL of 10% phosphate buffer solution (PBS).32 The 10% PBS used for the washing step was 1.12 g L−1 dibasic potassium phosphate, 0.48 g L−1 monobasic potassium phosphate, 0.002 g L−1 ethylenediaminetetraacetic acid (EDTA).32 All transfers were made under aseptic conditions. After washing, the E. coli were resuspended in 25 mL of 10% PBS and refrigerated for 30 minutes to slow the growth of the bacteria.29Respiration, growth, and membrane permeation assays
The respiration (nutrient-limited) and growth (nutrient-rich) assays were conducted in 384 well microplates, which were filled using an OpenTron pipetting robot (OT2) to ensure accuracy and reproducibility. Each microplate contained E. coli exposed to GO, MoS2, or MoSe2 at different concentrations (see Table S1† for the plate layout). 16 samples and 8 blanks (without bacteria) were analyzed per nanosheet concentration in each microplate.The media for the respiration experiments was 10% PBS with 0.08 g L−1 glucose and tetrazolium dye (1![[thin space (1/6-em)]](https://www.rsc.org/images/entities/char_2009.gif) :100 dilution of Biolog Inc Dye Mix A) per well.29 After refrigeration, the E. coli cells were diluted by a factor of 4 with 10% PBS for an initial optical density at 600 nm (OD600) of 0.5–0.6. The absorbance of the bacteria/nanosheet suspensions was read every 10 minutes for 4 hours at 590 nm using a BioTek Synergy Mx plate reader.29,46 The microplates were incubated at 25 °C and shaken continuously throughout the measurement in the plate reader. The total number of samples analyzed for the respiration assay was 112 per nanomaterial condition (7 microplates).
:100 dilution of Biolog Inc Dye Mix A) per well.29 After refrigeration, the E. coli cells were diluted by a factor of 4 with 10% PBS for an initial optical density at 600 nm (OD600) of 0.5–0.6. The absorbance of the bacteria/nanosheet suspensions was read every 10 minutes for 4 hours at 590 nm using a BioTek Synergy Mx plate reader.29,46 The microplates were incubated at 25 °C and shaken continuously throughout the measurement in the plate reader. The total number of samples analyzed for the respiration assay was 112 per nanomaterial condition (7 microplates).
The microplates used for the growth assays had the same layout (Table S1†) and nanomaterial concentrations as the respiration assay. After refrigeration, the E. coli stock solution was diluted by a factor of 40 using M9 media for an initial OD600 of 0.05–0.06. The M9 media that was used for the growth assays contained M9 salts (0.011 g L−1), casaminoacids (50 g L−1), magnesium sulfate (0.24 g L−1), calcium chloride (0.011 g L−1), thiamine (0.0003 g L−1), and glucose (0.5 g L−1). A higher concentration of PBS (2.8 g L−1 potassium phosphate dibasic, 1.2 g L−1 potassium phosphate monobasic, and 0.005 g L−1 EDTA) was required in the growth assay media compared to the respiration assay media because the bacteria were much more active under these conditions. Without a more concentrated buffer, the media acidified. Absorbance was read at 590 and 600 nm every 10 minutes until the nanosheets were added to the microplate. The microplates were incubated at 37 °C in the plate reader until the bacteria reached the desired growth phase. The nanosheets were added to the growth assays during the exponential (OD600 ∼0.14), transitional (OD600 ∼0.55), and stationary phases (OD600 ∼0.85) of E. coli growth (Fig. S2†). At that point, the plate was removed and the nanosheets were added to the culture. The OpenTron was used to add the nanomaterials to the cultures and maintain the temperature of the microplate. Once the nanomaterials were added, the absorbance was measured at 590 and 600 nm every 10 minutes for up to 12 hours.
E. coli for the membrane permeability assay were cultured, purified, washed, and refrigerated following the same procedures as the previous assays.29,32 Samples were prepared for respiration and growth conditions as previously discussed except at a larger volume (to facilitate washing the bacteria). The tetrazolium dye was excluded from the respiration and growth medias to prevent interference with the fluorescence. The highest and lowest concentrations for each material were used as the conditions for this assay. After incubation with the nanomaterials for 2 hours, the cultures were centrifuged at 3000 RPM for 10 minutes. Incubations were performed at 25 °C and 37 °C for the respiration and growing conditions, respectively, in a shaker/incubator. The resulting pellet was washed twice with 10% PBS. After washing, the OD600 of the solution was measured and the sample was diluted with 10% PBS in a 96 well microplate to get an OD600 of 0.082 ± 0.016 in a volume of 100 μL.28 In total, sample preparation (from the end of the exposure to plating) required about 40 minutes. Standards were prepared by diluting refrigerated bacteria 1:4 in 10% PBS. 2 samples (1 mL each) of 1:4 diluted bacteria were removed and pelleted via centrifugation for 10 minutes at 3000 RPM. One pellet was resuspended in 10% PBS and the other was resuspended in 70% isopropanol. Both suspensions were incubated at room temperature and vortex mixed every 15 minutes for 1 hour. These solutions were diluted to an OD600 of 0.076 ± 0.004 and mixed in various ratios (final volume: 100 μL) to generate a calibration curve of bacteria with a range of membrane permeabilities. A 1:1 mixture of propidium iodide (PI) and SYTO 9 was diluted in DI water (6 μL stain solution mL−1) and 100 μL was added to each sample and standard.28 The resulting solution was mixed and incubated in the dark for 15 minutes before analysis on the microplate reader.28 Excitation/emission wavelengths were 495/520 nm and 535/617 nm for SYTO 9 and PI, respectively.28,29,47 Each microplate contained a calibration curve, samples, and blanks (see Table S2† for microplate layout).
Data analysis
The respiration rate and μ values were calculated using the slope of OD590 or OD600 (respectively) normalized to the initial bacteria OD vs. time.28,29T tests assuming equal variances (α = 0.05) were used for statistical testing with the respiration and growth data.48 Outlier testing was performed using the Dixon's r22 ratio on Minitab 18 (α = 0.05) for the respiration and growth data. The Dixon's r22 outlier test is designed for sample sets with greater than n = 14 samples.49 The Mann–Whitney U test was used for statistical testing with the membrane permeability data. Outlier testing with the membrane permeability data set was not possible because of the small number of samples.Results
Nanosheet characterization
The as-synthesized materials are monolayer to few-layer nanosheets with irregular in-plane shapes. Typical lateral dimensions are ∼1 μm for graphene oxide, ∼250 nm for MoS2, and ∼400 nm for MoSe2 (Fig. S1†).26,50 Monolayer thickness for the three materials increases in the order MoS2 < MoSe2 < GO, but among these three types of materials the thickness varies only ±20% of the average. Using the interlayer spacings in stacked films as a measure of fundamental monolayer thickness, MoS2 is measured here as 0.59 nm by XRD (Fig. S3A†) and has been reported in the literature as 0.65 nm.51 MoSe2 thickness was measured here as 0.65 nm (Fig. S3B†), which is similar to previous studies.50 GO interlayer spacing depends on its hydration state and is measured here by XRD in the nominally dry state to be 0.8 nm (Fig. S3C†), which is similar to the 0.7 nm reported in Nair et al. 2012 under controlled low humidity conditions.52 XPS analysis on GO drop cast films (Fig. S4†) confirmed the presence of both oxygen and carbon-based peaks observed at ∼540 eV and ∼295 eV, with a C:O atomic ratio of 2:1. Falling within the typical C:O range for GO produced via the modified Hummers method of ∼1.5 to 2.5. Furthermore, high resolution carbon scans show the presence of GO's five primary peaks, which correspond to the non-oxygenated aromatic GO structure C![[double bond, length as m-dash]](https://www.rsc.org/images/entities/char_e001.gif) C, C–C with the addition of C–O, CO, and trace amounts of O–CO bonding (Fig. S4†), representing attached oxygenated carbonyl and carboxyl functional groups. Young's moduli for monolayer sheets have been previously reported in the literature using specialized testing methods for MoS2 (270 ± 100GPa)53 and graphene oxide (207 ± 23.4GPa).54
C, C–C with the addition of C–O, CO, and trace amounts of O–CO bonding (Fig. S4†), representing attached oxygenated carbonyl and carboxyl functional groups. Young's moduli for monolayer sheets have been previously reported in the literature using specialized testing methods for MoS2 (270 ± 100GPa)53 and graphene oxide (207 ± 23.4GPa).54
Effect of nanosheets on bacterial respiration & growth
The respiration assay can be used to determine the impact that the nanosheets have on the metabolic processes performed by E. coli.29Fig. 1 displays the results of the respiration assay performed for each of the nanomaterials. The curves in this figure display the distribution of data points collected for each condition in this part of the study. The shape of this curve relates to the distribution of bacterial responses to the nanosheets. The maximum, average, and minimum values for each data set presented in Fig. 1 have been summarized in Table S3.† Of the nanosheets studied here, GO had the largest impact on the respiration rate of E. coli (Fig. 1A). The conditions with the highest concentrations of GO (1.14 and 2.27 μg GO–TOC mL−1) experienced a significant decrease in the E. coli respiration rate. The respiration rate declined 5.4% for the 1.14 μg GO–TOC mL−1 condition (1.1 × 10⁻³ min−1) compared to the control condition (1.2 × 10⁻³ min−1). A 16.7% decline was measured for the 2.24 μg GO–TOC mL−1 condition (1.0 × 10⁻³ min−1) compared to the control. MoS2 (Fig. 1B) and MoSe2 (Fig. 1C) had minimal impact on the respiration rate compared to the control. Fig. 1C shows that one of the MoSe2 conditions (1.26 μg MoSe2–Mo mL−1) has an increased respiration rate (1.3 × 10⁻³ min−1) compared to the control (1.2 × 10⁻³ min−1).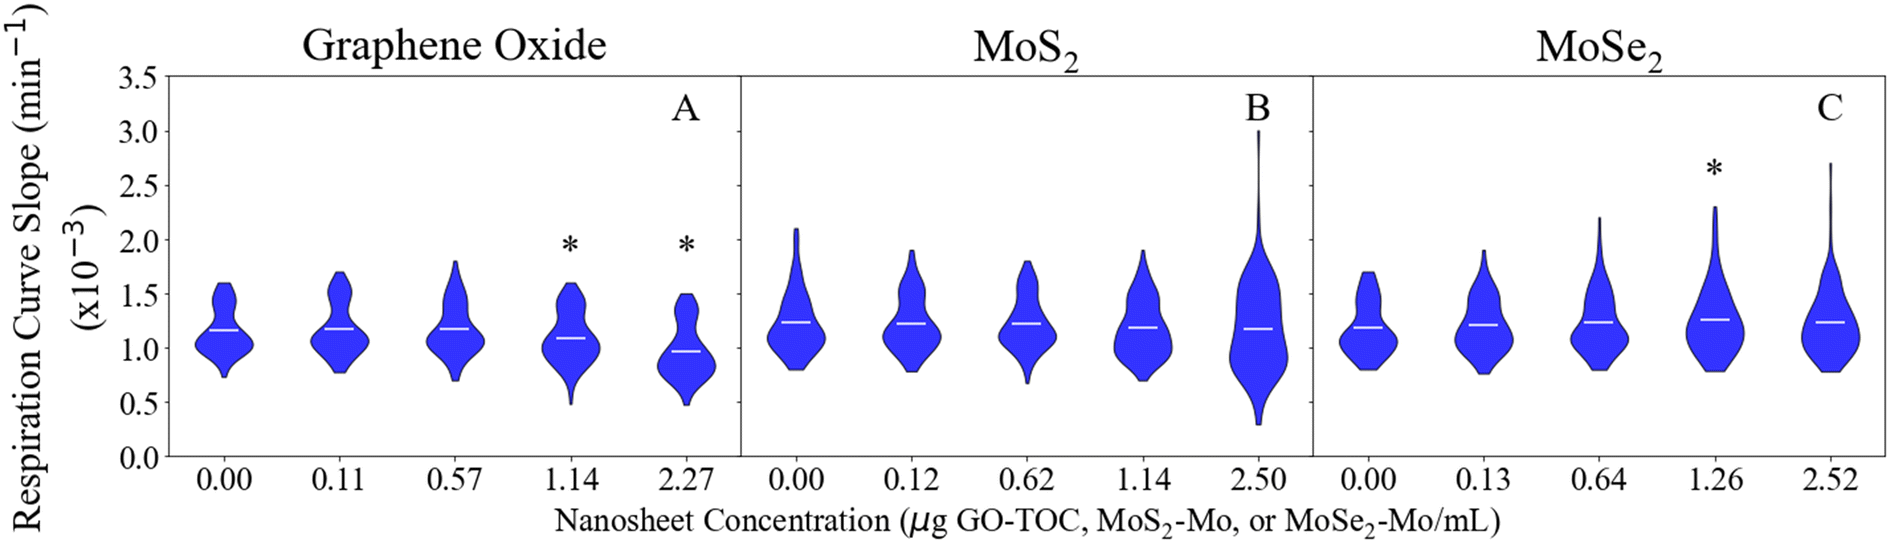 | ||
| Fig. 1 Effect of GO (A), MoS2 (B), and MoSe2 (C) on E. coli respiration (n = 111–112). Conditions that are statistically different compared to the 0.00 μg mL−1 controls (T-test) are marked with an asterisk (‘*’). The horizontal lines within the violin plots mark the mean for each condition. | ||
Fig. 2 shows the growth rate of E. coli after the introduction of the nanosheets during the exponential, transitional, and stationary growth stages. The maximum, minimum, and average values for each data set in Fig. 2 can be found in Tables S4–S6.† The growth rates measured in this assay ranged 0.74–0.79 h−1, 0.31–0.35 h−1, and 0.022–0.023 h−1 for the 0.00 μg mL−1 conditions during the exponential, transitional, and stationary phases, respectively. These values are within the expected range based on the results of previous studies.28,55,56 As in the respiration analysis, GO had the largest impact on the growth of the E. coli. This impact was dependent on the concentration of the material and the growth stage during at which they were introduced. GO at 2.27 μg GO–TOC mL−1 had a significant impact on the growth of the bacteria at every growth stage (Fig. 2A–C). Whether the growth of the bacteria was positively or negatively affected depended on the growth stage in which the nanomaterials were introduced. During the exponential phase, the 2.27 μg GO–TOC mL−1 GO increased the growth rate of the E. coli by 22.0%. At this concentration, the introduction of GO during the transitional and stationary phases led to reductions in growth rate of 9.1 and 87.5%, respectively. Bacteria exposed to MoS2 at 2.50 μg MoS2–Mo mL−1 during the exponential growth phase experienced a 4.5% decline in the growth rate (Fig. 2D). Besides this result, MoS2 and MoSe2 have very little effect on the growth of E. coli (Fig. 2D–I).
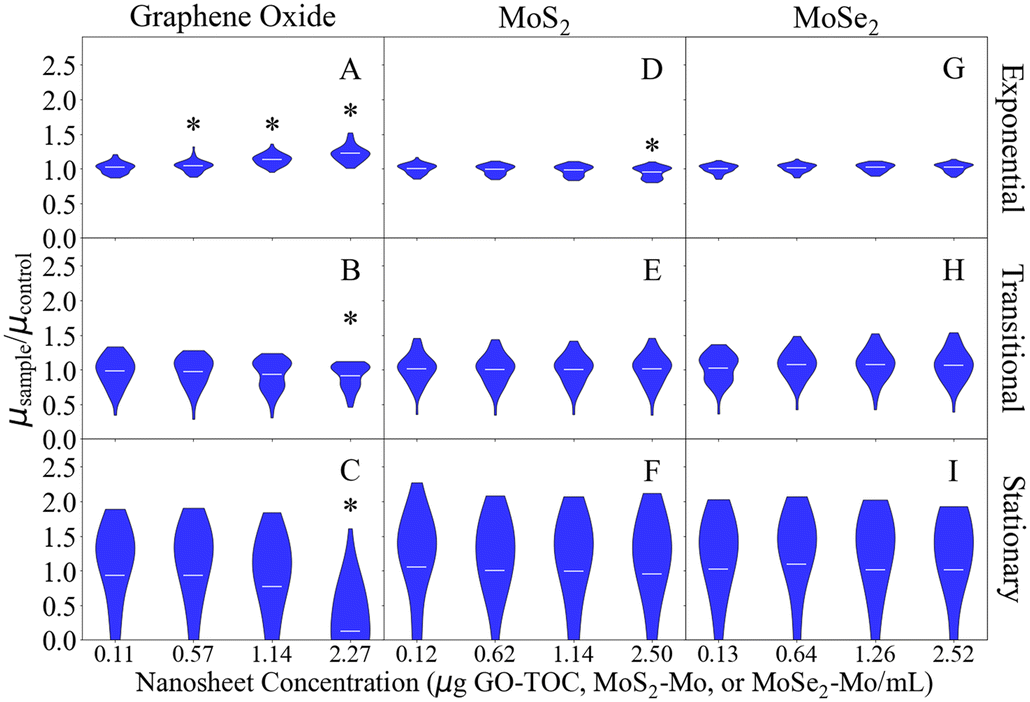 | ||
| Fig. 2 Effect of the nanosheets on the growth rate (μ) of GFP E. coli during each stage of growth (n = 47–48). Here, the growth rates have been normalized to the average control (0.00 μg mL−1) growth rate for each of the nanomaterials. The GO results are in the first column (panels A–C), MoS2 results are in the second column (panels D–F), and MoSe2 results are in the final column (panels G–I). The growth rates after nanosheet addition in the exponential, transitional, and stationary phases can be found in the top (panels A, D, and G), middle (panels B, E, and H), and bottom rows (panels C, F, and I), respectively. Conditions that are statistically different compared to the 0.00 μg mL−1 controls (T-test) are marked with an asterisk (‘*’). The horizontal lines within the violin plots mark the mean for each condition. | ||
Nanosheet impacts on membrane permeability
The membrane permeability assay was used to assess the changes in the physical structure of the bacteria after exposure to the nanosheets. Sample preparation for this assay had minimal impact on the membrane permeability of the cells. Undisturbed cell membrane (UCM) ranged 88–97% for the control (0.00 μg mL−1) conditions depending on the growth stage from which the bacteria were harvested. Bacterial exposure to nanosheets under respiration conditions had little impact on the membrane permeability. For cells harvested following nanosheet exposure in growing conditions, there were small, but statistically significant, changes in membrane permeability after exposure to nanosheets. The Mo nanomaterials had more of an impact on membrane permeability compared to GO. In cultures exposed to Mo nanosheets UCM values were 1.4–13.0% less than the control (depending on the growth stage of the bacteria). Introduction of GO nanosheets led to UCM values that ranged 1.7–6.4% less than the control. These reductions in UCM are lower compared to what previous studies have shown with this assay. Silver nanoparticles (ranging 1–10 μg mL−1) can reduce the UCM of E. coli 10–90%.28Nanosheet stability during respiration and growth assays
MoS2 has been shown to have a pH-dependent dissolution in aqueous solutions, including biological media, driven by slow oxidation of the nanosheets by dissolved O2.26 ICP-MS analysis was undertaken to assess the fraction of the total Mo in solid (nanosheet) vs. dissolved (ionic) forms under typical conditions and exposure times in our E. coli experiments. Fig. S5† shows that the dissolved fraction varies depending on the type of media and the growth stage of the bacteria, making up 23–32% and 18–27% of the total atomic Mo in the MoS2 and MoSe2 nanosheet suspensions, respectively. The primary dissolved species is likely molybdate (MoO42−), which has been reported to be the main product of nanosheet oxidation during storage, handling, and media exposure during the assays.26 The results indicate that the samples used here consist primarily of intact solid nanosheets, which are available to interact with the bacteria throughout the time that the growth and respiration rates are measured.Discussion
In this study, we demonstrate that bacterial growth stage plays an important role in bacterial response to GO. Under nutrient limited conditions (such as in the respiration media or during the transitional and stationary growth phases), the introduction of GO led to a reduction in the respiration (Fig. 1A) and growth rates (Fig. 2B and C). This is in line with Palmieri et al. which showed that GO (3–6 μg mL−1) limits E. coli growth in nutrient limited conditions.8 Unlike Palmieri et al., our results indicate that bacterial deposition and wrapping with GO are more likely than a membrane cutting mechanism.8 Only small changes in membrane permeability were measured for GO exposures, which makes membrane cutting unlikely as the major toxicity pathway. Under nutrient limited conditions, bacteria favor surface attachment, which would promote adhesion to the nanosheets.57–59 Once attached, bacteria become dormant due to a lack of nutrients.60 These GO nanosheets have a larger specific surface area (m2 g−1) than the MoS2 or MoSe2 nanosheets and would likely collect more bacteria and lead to larger reductions in respiration/growth rate at the same mass dose. The GO nanosheets are ultra-thin, and have large lateral dimension making them sheet-like in their bending and folding behavior, and their wrapping of slow growing bacteria here could also lead to the reductions in respiration and growth rates without increasing membrane permeability (Fig. 3).7,10,11,36,61,62 The large surface area of GO can also adsorb media components, which has been shown to reduce the available nutrients for mammalian cell growth.63 Under nutrient rich conditions, this scavenging would not play a very important role, but in nutrient limited conditions this could have a more pronounced effect.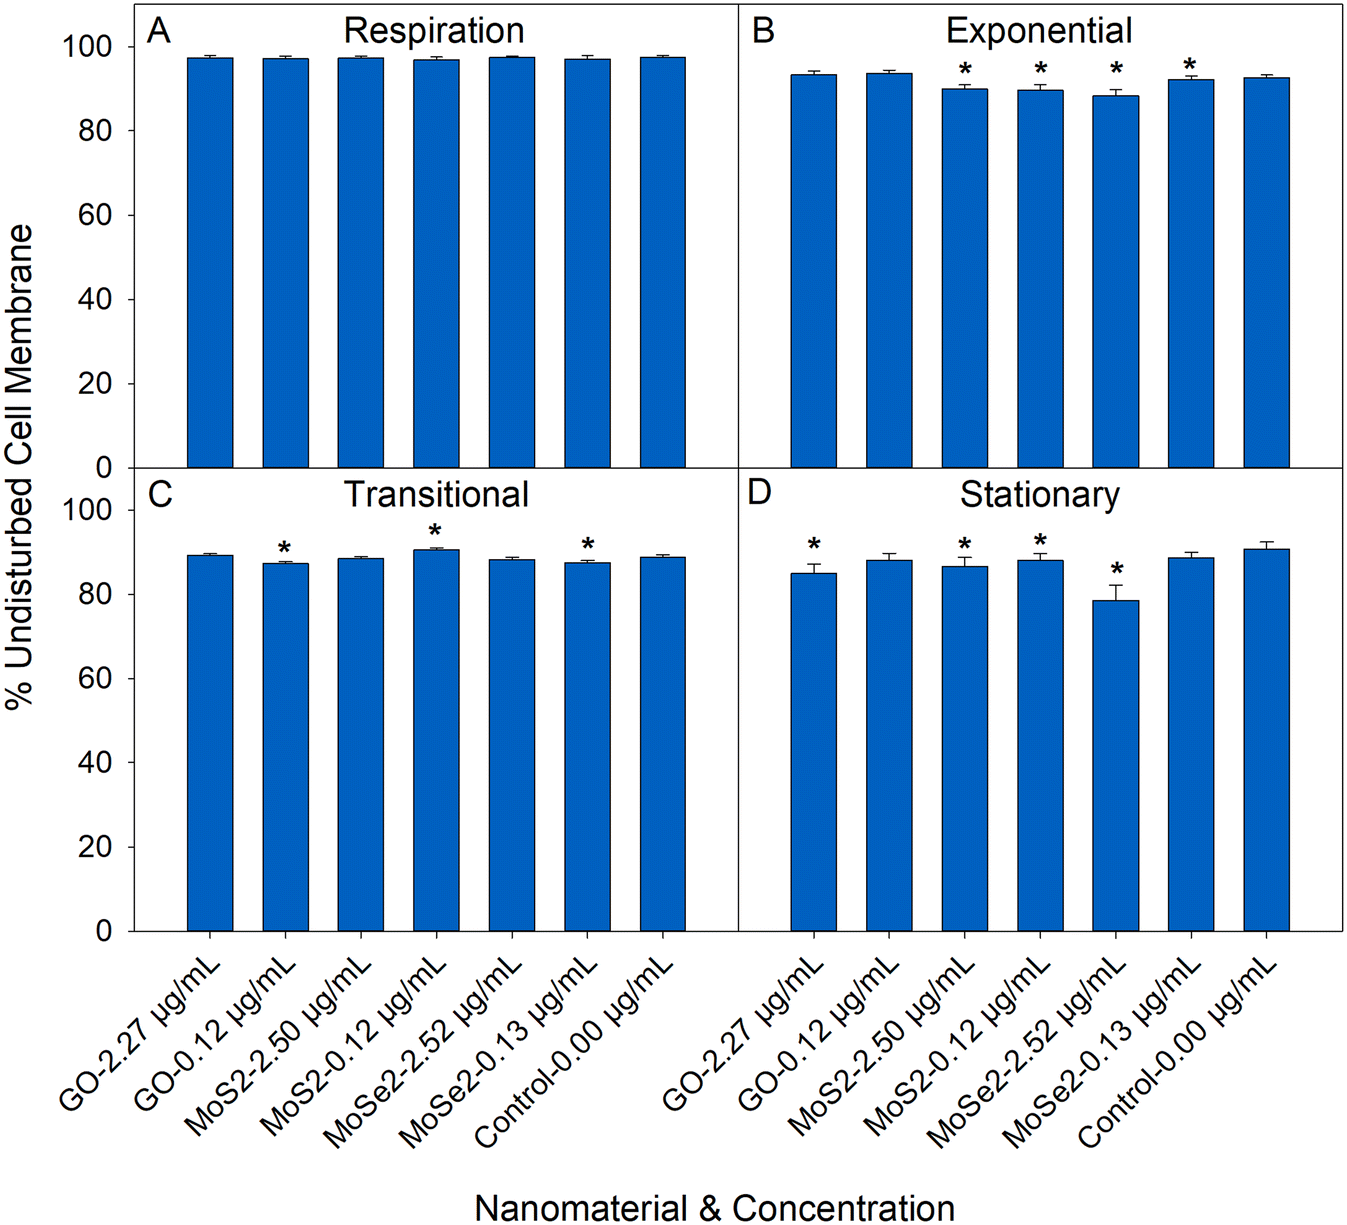 | ||
| Fig. 3 Membrane permeability of E. coli post exposure to nanosheets under (A) respiration, (B) exponential phase growth, (C) transitional phase growth, and (D) stationary phase growth (n = 5–6). Conditions that are statistically different compared to the 0.00 μg mL−1 controls (Mann–Whitney U test) are marked with an asterisk (‘*’). | ||
In contrast, exposure to GO when the bacteria were actively growing in the exponential phase led to an increase in E. coli growth rate. In a nutrient rich environment, surface sites on the GO become occupied by bacteria that are actively growing. Unlike the slower growing bacteria in the respiration media or transitional/stationary growth phases, rapidly growing bacteria can use the GO as a scaffold, promoting cellular growth.8,18,19 Ruiz et al. showed that E. coli grows faster in a nutrient rich environment in the presence of GO.18 Actively growing bacteria in Ruiz et al. attached to GO and proliferated, generating a large amount of biomass and extracellular polymeric substances (EPS) adhered to the GO.18 This biomass and EPS occupies surface sites on the GO and allows bacteria in suspension to grow freely.8,19 Cellular attachment and proliferation and the occupation of surface sites lead to an increased growth rate for E. coli in the presence of GO.
The molybdenum nanosheets used in this study experience pH dependent dissolution.26 It is unlikely that this dissolution had a major impact on the results presented here. ICPMS analysis demonstrates that 68–82% of the nanosheets were in the solid form (Fig. S5†) throughout the period that the bacteria were exposed. Wang et al. demonstrated molybdenum nanosheet dissolution over a much larger time scale than what is considered here.26 Dissolved Mo is an essential nutrient and can be used as a cofactor in enzymes employed during E. coli carbon, sulfur, and nitrogen metabolism.64–68
This study is the first to demonstrate that the growth stage of E. coli has little effect on its response to MoS2 and MoSe2 nanosheets. In this study, bacteria are exposed to a solution of Mo nanosheets and their soluble products (notably, Mo which is a micronutrient). While most of the Mo was in the nanosheet form (Fig. S5†), the dissolved Mo still represents an important constituent of the solution added to the bacterial culture. Our results indicate that the solutions of Mo nanosheets and dissolved Mo have little impact on E. coli respiration (Fig. 1B and C) and growth (Fig. 2D–I), regardless of the growth state of the bacteria during nanosheet introduction. Other experimental conditions may lead to an effect, but, in this case, there were no observed differences between exposed bacteria and the controls. Our results are supported by previous studies which have shown that these materials have little impact on bacterial growth and respiration under conditions similar to those used here (growing and nongrowing).20–22 The membrane permeability assay (Fig. 3) suggests that the Mo nanosheets have more of an impact on the physical structure of the cell compared to GO. Our results do not uniquely identify the underlying interaction mechanism, but MoS2 and/or MoSe2 materials have been reported to induce membrane stress through contact with the cell wall and reactive oxygen species generation.21,22,69,70
The results from the membrane permeability assay (Fig. 3) show that there are some small changes in permeability under the conditions that were studied here. Significant changes in membrane permeability rarely align with the trends in the growth and respiration assays. The inconsistencies between the membrane permeability assay and the others are likely due to some of the limitations of this assay. The membrane permeability assay has a relatively high limit of detection.71,72 The changes in membrane permeability were lower (1.4–13.0% reduction compared to the control) compared to what previous studies have shown using this technique (10–90% reduction in membrane permeability with silver nanoparticles).28 The smaller magnitude of the changes here could be preventing exact quantification of changes in membrane permeability.71,72 Intermediate states (damaged cells expressing the stains indicating both intact and permeable membranes) are also common in the membrane permeability assay.73 It could also be that there are small changes in membrane permeability post-nanosheet exposure that do not have a significant impact on bacterial respiration/growth. Physical membrane disruption has been reported for GO,74–77 MoS2,21,70,78 and MoSe2,21,70 indicating that there is support in the literature for the data acquired in this assay. Overall, the results of this assay indicate that the nanosheets have some physical effect on E. coli membranes, but the limitations of the assay prevent rigorous quantification of the effect.
In this study, we utilized a novel, high throughput approach for examining the interactions between E. coli and suspensions of GO, MoS2, or MoSe2. Most studies use 2–4 replicates when examining nanosheet interactions with bacteria, which limits the statistical power of the measurement.8,18,38,79–83 We were able to demonstrate small, but statistically significant, differences between experimental groups by increasing the number of samples. This may be important as more studies examine the biological response to nanosheets in the environmentally relevant concentration range (μg L−1 to ng L−1 range).42,43 Lower nanosheet concentrations will elicit less of a bacterial response during testing and a high throughput approach could be used to improve detection. This technique also allows us to see the range of interactions that the bacteria have with nanosheets in suspension. The E. coli have a bimodal distribution of responses to the nanosheets under many of the conditions examined here (Tables S7–S10† for skewness, kurtosis, and Ryan–Joiner test results). In a bimodal distribution, a distinct subpopulation of bacteria creates a secondary peak in the distribution of responses. Previous studies have shown that bacteria can have a bimodal distribution of responses to antibiotics, but this has not been demonstrated for nanosheets until now.84–87 A bimodal distribution of responses to antibiotics indicates the development of resistance.85–87 In this case, the bimodality of the bacterial responses could indicate the presence of several mechanisms through which the bacteria respond to nanosheets.
The results of this study demonstrate that GO, MoS2, and MoSe2 could be applied in technologies that require compatibility with bacteria. One example of such a technology would be microbial fuel cells (MFCs). In this context, compatible nanosheets could promote electricity generation in MFCs by increasing electrode surface area, conductivity, cellular attachment, and extracellular electron transfer.88–97 GO (ref. 91, 92, 94 and 95) and MoS2 (ref. 88 and 93) have already been shown to have some promise for this application. These studies focus on how the properties of the nanosheet affect interactions with bacteria and the generation of electricity. Future research in this area could examine the physiology of the microorganisms in MFCs and how that could affect electricity production. This is especially interesting for GO, which enhanced the growth of rapidly growing E. coli. A nutrient-rich environment could promote positive interactions between the bacteria and GO, improving electricity generation.
Conclusion
Bacterial responses to two-dimensional nanomaterials are complex and typically depend on multiple material properties as well as the physiological state of the bacteria. Here, we examined the responses of E. coli to GO, MoS2, and MoSe2 at different growth stages. A high throughput technique was applied to quantify small changes in respiration and growth rates and study the range of bio/nano responses. The responses were dependent on the structure and concentration of the nanosheet as well as the physiological state of the bacteria. GO improved the growth rate of actively growing E. coli and caused reductions in growth rate and respiration rate for slow growing or static E. coli. MoS2 and MoSe2 had little impact on the growth and respiration of the E. coli regardless of growth stage under the conditions tested here. The membrane permeability assay showed that the nanosheets caused a small increase in permeability that could not be reliably quantified. Previous studies have demonstrated the inactivation of bacteria in response to exposure to two-dimensional nanomaterials. Here, we show that the responses of E. coli to nanosheets were not limited to toxic effects, there were a range of bacterial responses based on the physiology of the bacteria and the properties of the nanosheet.Conflicts of interest
There are no conflicts to declare.Acknowledgements
This work was funded by USGS Award #GS21AP10622, the Rhode Island Water Resources Center, and the University of Rhode Island College of Engineering. The authors are also grateful for financial support from the U.S. National Science Foundation, grant CBET-2151804 from the Nanoscale Interactions program (Nora Savage, Program Director). We would like to thank Caroline Canales for her assistance in this project.References
- C. Tan, X. Cao, X. Wu, Q. He, J. Yang, X. Zhang, J. Chen, W. Zhao, S. Han, G. Nam, M. Sindoro and H. Zhang, Recent Advances in Ultrathin Two-Dimensional Nanomaterials, Chem. Rev., 2017, 117, 6225–6331, DOI:10.1021/acs.chemrev.6b00558.
- Z. Wang, W. Zhu, Y. Qiu, X. Yi, A. von dem Bussche, A. Kane, H. Gao, K. Koski and R. Hurt, Biological and environmental interactions of emerging two-dimensional nanomaterials, Chem. Soc. Rev., 2016, 45(6), 1750–1780, 10.1039/c5cs00914.
- H. Zhang, Ultrathin Two-Dimensional Nanomaterials, ACS Nano, 2015, 9(10), 9451–9469, DOI:10.1021/acsnano.5b05040.
- V. C. Sanchez, A. Jachak, R. Hurt and A. Kane, Biological Interactions of Graphene-Family Nanomaterials-An Interdisciplinary Review, Chem. Res. Toxicol., 2012, 25(1), 15–34, DOI:10.1021/tx200339h.
- M. Fojtu, W. Z. Teo and M. Pumera, Environmental impact and potential health risks of 2D nanomaterials, Environ. Sci.: Nano, 2017, 4, 1617–1633, 10.1039/c7en00401j.
- M. Chhowalla, H. S. Shin, G. Eda, L. Li, K. P. Loh and H. Zhang, The chemistry of two-dimensional layered transition metal dichalcogenide nanosheets, Nat. Chem., 2013, 5, 263–275, DOI:10.1038/NCHEM.1589.
- F. Perreault, A. F. De Faria, S. Nejati and M. Elimelech, Antimicrobial Properties of Graphene Oxide Nanosheets: Why Size Matters, ACS Nano, 2015, 9(7), 7226–7236, DOI:10.1021/acsnano.5b02067.
- V. Palmieri, F. Bugli, M. C. Lauriola, M. Cacaci, R. Torelli, G. Ciasca, C. Conti, M. Sanguinetti, M. Papi and M. De Spirito, Bacteria Meet Graphene: Modulation of Graphene Oxide Nanosheet Interaction with Human Pathogens for Effective Antimicrobial Therapy, ACS Biomater. Sci. Eng., 2016, 3, 619–627 CrossRef PubMed.
- W. Hu, C. Peng, W. Luo, M. Lv, X. Li, D. Li, Q. Huang and C. Fan, Graphene-Based Antibacterial Paper, ACS Nano, 2010, 4(7), 4317–4323, DOI:10.1021/nn101097v.
- T. Pulingam, K. L. Thong, M. E. Ali, J. N. Appaturi, I. J. Dinshaw, Z. Y. Ong and B. F. Leo, Graphene oxide exhibits differential mechanistic action towards Gram-positive and Gram-negative bacteria, Colloids Surf., B, 2019, 181, 6–15, DOI:10.1016/j.colsurfb.2019.05.023.
- Y. Gao, J. Wu, X. Ren, X. Tan, T. Hayat, A. Alsaedi, C. Cheng and C. Chen, Impact of graphene oxide on the antibacterial activity of antibiotics against bacteria, Environ. Sci.: Nano, 2017, 4, 1016–1024, 10.1039/c7en00052a.
- X. Zou, L. Zhang, Z. Wang and Y. Luo, Mechanisms of the Antimicrobial Activities of Graphene Materials, J. Am. Chem. Soc., 2016, 138(7), 2064–2077, DOI:10.1021/jacs.5b11411.
- Y. Li, H. Yuan, A. von dem Bussche, M. Creighton, R. H. Hurt, A. B. Kane and H. Gao, Graphene microsheets enter cells through spontaneous membrane penetration at edge asperities and corner sites, Proc. Natl. Acad. Sci. U. S. A., 2013, 110(30), 12295–12300, DOI:10.1073/pnas.1222276110.
- P. Chen, J. Sodhi, Y. Qiu, T. M. Valentin, R. S. Steinberg, Z. Wang, R. H. Hurt and I. Y. Wong, Multiscale Graphene Topographies Programmed by Sequential Mechanical Deformation, Adv. Mater., 2016, 28(18), 3564–3571, DOI:10.1002/adma.201506194.
- Y. Chen, F. Guo, A. Jachak, S. Kim, D. Datta, J. Liu, I. Kulaots, C. Vaslet, H. D. Jang, J. Huang, A. Kane, V. B. Shenoy and R. H. Hurt, Aerosol Synthesis of Cargo-Filled Graphene Nanosacks, Nano Lett., 2012, 12(4), 1996–2002, DOI:10.1021/nl2045952.
- O. Akhavan and E. Ghaderi, Escherichia coli bacteria reduce graphene oxide to bactericidal graphene in a self-limiting manner, Carbon, 2012, 50(5), 1853–1860, DOI:10.1016/j.carbon.2011.12.035.
- G. Wang, F. Qian, C. W. Saltikov, Y. Jiao and Y. Li, Microbial Reduction of Graphene Oxide by Shewanella, Nano Res., 2011, 4(6), 563–570, DOI:10.1007/s12274-011-0112-2.
- O. N. Ruiz, K. A. S. Fernando, B. Wang, N. A. Brown, P. G. Luo, N. D. McNamara, M. Vangsness, Y. P. Sun and C. E. Bunker, Graphene oxide: a nonspecific enhancer of cellular growth, ACS Nano, 2011, 5(10), 8100–8107, DOI:10.1021/nn202699t.
- L. Hui, J. Piao, J. Auletta, K. Hu, Y. Zhu, T. Meyer, H. Liu and L. Yang, Availability of the Basal Planes of Graphene Oxide Determines Whether It Is Antibacterial, ACS Appl. Mater. Interfaces, 2014, 6(15), 13183–13190, DOI:10.1021/am503070z.
- N. Wu, Y. Yu, T. Li, X. Ji, L. Jiang, J. Zong and H. Huang, Investigating the Influence of MoS2 Nanosheets on E. coli from Metabolomics Level, PLoS One, 2016, 11(12), e0167245, DOI:10.1371/journal.pone.0167245.
- X. Yang, J. Li, T. Liang, C. Ma, Y. Zhang, H. Chen, N. Hanagata, H. Su and M. Xu, Antibacterial activity of two-dimensional MoS2 sheets, Nanoscale, 2014, 6(17), 10126–10133, 10.1039/C4NR01965B.
- D. Ma, C. Xie, T. Wang, L. Mei, X. Zhang, Z. Guo and W. Yin, Liquid-Phase Exfoliation and Functionalization of MoS2 Nanosheets for Effective Antibacterial Application, ChemBioChem, 2020, 21(16), 2373–2380, DOI:10.1002/cbic.202000195.
- S. Pandit, S. Karunakaran, S. K. Boda, B. Basu and M. De, High antibacterial activity of functionalized chemically exfoliated MoS2, ACS Appl. Mater. Interfaces, 2016, 8(46), 31567–31573, DOI:10.1021/acsami.6b10916.
- M. Tong, F. Liu, Q. Dong, Z. Ma and W. Liu, Magnetic Fe3O4-deposited flower-like MoS2 nanocomposites for the Fenton-like Escherichia coli disinfection and diclofenac degradation, J. Hazard. Mater., 2020, 385, 121604, DOI:10.1016/j.jhazmat.2019.121604.
- G. Zhang, X. Zhang, Y. Yang, H. Zhang, J. Shi, X. Yao and X. Zhang, Near-Infrared Light-Triggered Therapy to Combat Bacterial Biofilm Infections by MoSe2/TiO2 Nanorod Arrays on Bone Impants, Adv. Mater. Interfaces, 2020, 7(1901706), 1–13, DOI:10.1002/admi.201901706.
- Z. Wang, A. von dem Bussche, Y. Qiu, T. M. Valentin, K. Gion, A. B. Kane and R. H. Hurt, Chemical Dissolution Pathways of MoS2 Nanosheets in Biological and Environmental Media, Environ. Sci. Technol., 2016, 50, 7208–7217, DOI:10.1021/acs.est.6b01881.
- H. S. Fogler, Essentials of Chemical Reaction Engineering, Prentice Hall, Boston, 2018 Search PubMed.
- F. Faghihzadeh, N. M. Anaya, C. Astudillo-Castro and V. A. Oyanedel-Craver, Kinetic, metabolic and macromolecular response of bacteria to chronic nanoparticle exposure in continuous culture, Environ. Sci.: Nano, 2018, 5(6), 1386–1396, 10.1039/c8en00325d.
- N. M. Anaya, F. Solomon and V. Oyanedel-Craver, Effects of dysprosium oxide nanoparticles on Escherichia coli, Environ. Sci.: Nano, 2016, 3(1), 67–73, 10.1039/c5en00074b.
- E. Grela, J. Kozwlowska and A. Grabowiecka, Current methodology of MTT assay in bacteria-A review, Acta Histochem., 2018, 120, 303–311, DOI:10.1016/j.acthis.2018.03.007.
- P. D. Gaspar, J. Alves and P. Pinto, Simplified Approach to Predict Food Safety through the Maximum Specific Bacterial Growth Rate as Function of Extrinsic and Intrinsic Parameters, ChemEngineering, 2021, 5(2), 22, DOI:10.3390/chemengineering5020022.
- N. M. Anaya, F. Faghihzadeh, N. Ganji, G. Bothun and V. Oyanedel-craver, Comparative study between chemostat and batch reactors to quantify membrane permeability changes on bacteria exposed to silver nanoparticles, Sci. Total Environ., 2015, 565, 841–848, DOI:10.1016/j.scitotenv.2016.03.039.
- R. S. Chouhan, A. Qureshi, B. Yagci, M. A. Gülgün, V. Ozguz and J. Niazi, Biotransformation of multi-walled carbon nanotubes mediated by nanomaterial resistant soil bacteria, Chem. Eng. J., 2016, 298, 1–9, DOI:10.1016/j.cej.2016.04.019.
- F. Faghihzadeh, N. M. Anaya, L. A. Schifman and V. Oyanedel-Craver, Fourier transform infrared spectroscopy to assess molecular-level changes in microorganisms exposed to nanoparticles, Nanotechnol. Environ. Eng., 2016, 1(1), 1–16, DOI:10.1007/s41204-016-0001-8.
- American Public Health Association, American Water Works Association; Water Environment Federation, Standard Methods for the Examination of Water and Wastewater, American Public Health Association, Washington, DC, 2012 Search PubMed.
- I. Sengupta, P. Bhattacharya, M. Talukdar, S. Neogi, S. Pal and S. Chakraborty, Bactericidal effect of graphene oxide and reduced graphene oxide: Influence of shape of bacteria, Colloid Interface Sci. Commun., 2019, 28, 60–68 CrossRef CAS.
- H. Zhao, C. Zhang, Y. Wang, W. Chen and P. J. J. Alvarez, Self-Damaging Aerobic Reduction of Graphene Oxide by Escherichia coli: Role of GO-Mediated Extracellular Superoxide Formation, Environ. Sci. Technol., 2018, 52, 12783–12791, DOI:10.1021/acs.est.8b03753.
- E. C. Salas, Z. Sun, A. Lüttge and J. M. Tour, Reduction of graphene oxide via bacterial respiration, ACS Nano, 2010, 4(8), 4852–4856, DOI:10.1021/nn101081t.
- Q. Zhang and C. Zhang, Chronic exposure to low concentration of graphene oxide increases bacterial pathogenicity via the envelope stress response, Environ. Sci. Technol., 2020, 54(19), 12412–12422, DOI:10.1021/acs.est.0c04538.
- P. Shah, T. N. Narayanan, C. Z. Li and S. Alwarappan, Probing the biocompatibility of MoS2 nanosheets by cytotoxicity assay and electrical impedance spectroscopy, Nanotechnology, 2015, 28(315102), 1–7 Search PubMed.
- W. Z. Teo, E. L. K. Chng, Z. Sofer and M. Pumera, Cytotoxicity of Exfoliated Transition-Metal Dichalcogenides (MoS2, WS2, and WSe2) is Lower Than That of Graphene and its Analogues, Chem. – Eur. J., 2014, 20(31), 9627–9632, DOI:10.1002/chem.201402680.
- D. G. G. Goodwin, A. S. Adeleye, L. Sung, K. T. Ho, M. Robert and E. J. Petersen, Detection and Quantification of Graphene Family Nanomaterials in the Environment, Environ. Sci. Technol., 2019, 52(8), 4491–4513, DOI:10.1021/acs.est.7b04938.
- F. Gottschalk, T. Sun and B. Nowack, Environmental concentrations of engineered nanomaterials: Review of modeling and analytical studies, Environ. Pollut., 1987, 2013(181), 287–300, DOI:10.1016/j.envpol.2013.06.003.
- L. B. Pinheiro, M. D. Gibbs, G. Vesey, J. J. Smith and P. L. Bergquist, Fluorescent reference strains of bacteria by chromosomal integration of a modified green fluorescent protein gene, Appl. Microbiol. Biotechnol., 2008, 77(1), 1287–1295, DOI:10.1007/s00253-007-1253-9.
- I. Morales, J. Atoyan, J. Amador and T. Boving, Transport of Pathogen Surrogates in Soil Treatment Units: Numerical Modeling, Water, 2014, 6(1), 818–838, DOI:10.3390/w6040818.
- B. Klimek and M. Niklinska, Zinc and Copper Toxicity to Soil Bacteria and Fungi from Zinc Polluted and Unpolluted Soils: A Comparative Study with Different Types of Biolog Plates, Bull. Environ. Contam. Toxicol., 2007, 78(2), 112–117, DOI:10.1007/s00128-007-9045-6.
- L. Boulos, M. Prevost, B. Barbeau, J. Coallier and R. Desjardins, LIVE/DEAD BacLight: application of a new rapid staining method for direct enumeration of viable and total bacteria in drinking water, J. Microbiol. Methods, 1999, 37, 77–86 CrossRef CAS PubMed.
- National Institute of Standards and Technology, NIST/SEMATECH e-Handbook of Statistical Methods, 2012 Search PubMed.
- Select the Analysis Options for Outlier Tests; https://support.minitab.com/en-us/minitab/18/help-and-how-to/statistics/basic-statistics/how-to/outlier-test/perform-the-analysis/select-the-analysis-options/.
- C. J. Castilho, D. Li, Y. Xie, H. Gao and R. H. Hurt, Shear failure in supported two-dimensional nanosheet van der Waals thin films, Carbon, 2021, 173, 410–418, DOI:10.1016/j.carbon.2020.10.079.
- Z. He and W. Que, Molybdenum disulfide nanomaterials: Structures, properties, synthesis and recent progress on hydrogen evolution reaction, Appl. Mater. Today, 2016, 3, 23–56, DOI:10.1016/j.apmt.2016.02.001.
- R. R. Nair, H. A. Wu, P. N. Jayaram, I. V. Grigorieva and A. K. Geim, Unimpeded Permeation of Water Through Helium-Leak-Tight Graphene-Based Membranes, Science, 2012, 335(6067), 442–444, DOI:10.1126/science.1211694.
- S. Bertolazzi, J. Brivio and A. Kis, Stretching and Breaking of Ultrathin MoS2, ACS Nano, 2011, 5(12), 9703–9709, DOI:10.1021/nn203879f.
- J. W. Suk, R. D. Piner, J. An and R. S. Ruoff, Mechanical Properties of Monolayer Graphene Oxide, ACS Nano, 2010, 4(11), 6557–6564, DOI:10.1021/nn101781v.
- M. Berney, H. Weilenmann, J. Ihssen, C. Bassin and T. Egli, Specific Growth Rate Determines the Sensitivity of Escherichia coli to Thermal, UVA, and Solar Disinfection, Appl. Environ. Microbiol., 2006, 72(4), 2586–2593, DOI:10.1128/AEM.72.4.2586-2593.2006.
- J. Ihssen and T. Egli, Specific growth rate and not cell density controls the general stress response in Escherichia coli, Microbiology, 2004, 150(6), 1637–1648, DOI:10.1099/mic.0.26849-0.
- J. W. Lengeler, G. Drews and H. G. Schlegel, Biologyof Prokaryotes, Blackwell Science, Stuttgart, New York, 1999 Search PubMed.
- N. R. Stanley and B. A. Lazazzera, Environmental signals and regulatory pathways that influence biofilm formation, Mol. Microbiol., 2004, 52(4), 917–924, DOI:10.1111/j.1365-2958.2004.04036.x.
- M. K. Thomason, F. Fontaine, N. De Lay and G. Storz, A small RNA that regulates motility and biofilm formation in response to changes in nutrient availability in Escherichia coli, Mol. Microbiol., 2012, 84(1), 17–35, DOI:10.1111/j.1365-2958.2012.07965.x.
- L. K. Vestby, T. Grønseth, R. Simm and L. L. Nesse, Bacterial Biofilm and its Role in the Pathogenesis of Disease, Antibiotics, 2020, 9(2), 59, DOI:10.3390/antibiotics9020059.
- O. Akhavan, E. Ghaderi and A. Esfandiar, Wrapping Bacteria by Graphene Nanosheets for Isolation from Environment, Reactivation by Sonication, and Inactivation by near-Infrared Irradiation, J. Phys. Chem. B, 2011, 115, 6279–6288, DOI:10.1021/jp200686k.
- S. Liu, M. Hu, T. H. Zeng, R. Wu, R. Jiang, J. Wei, L. Wang, J. Kong and Y. Chen, Lateral Dimension-Dependent Antibacterial Activity of Graphene Oxide Sheets, Langmuir, 2012, 28(33), 12364–12372, DOI:10.1021/la3023908.
- M. A. Creighton, J. R. Rangel-Mendez, J. Huang, A. B. Kane and R. H. Hurt, Graphene-Induced Adsorptive and Optical Artifacts During In Vitro Toxicology Assays, Small, 2013, 9(11), 1921–1927, DOI:10.1002/smll.201202625.
- R. R. Mendel, The Molybdenum Cofactor, J. Biol. Chem., 2013, 288(19), 13165–13172, DOI:10.1074/jbc.R113.455311.
- R. Hille, J. Hall and P. Basu, The Mononuclear Molybdenum Enzymes, Chem. Rev., 2014, 114(7), 3963–4038, DOI:10.1021/cr400443z.
- C. Iobbi-Nivol and S. Leimkühler, Molybdenum enzymes, their maturation and molybdenum cofactor biosynthesis in Escherichia coli, Biochim. Biophys. Acta, Bioenerg., 2013, 1827(8–9), 1086–1101, DOI:10.1016/j.bbabio.2012.11.007.
- R. R. Mendel and S. Leimkühler, The biosynthesis of the molybdenum cofactors, J. Biol. Inorg. Chem., 2015, 20(2), 337–347, DOI:10.1007/s00775-014-1173-y.
- S. Leimkuhler and C. Iobbi-Nivol, Bacterial molybdoenzymes: old enzymes for new purposes, FEMS Microbiol. Rev., 2016, 40(1), 1–18, DOI:10.1093/femsre/fuv043.
- Y. Yu, L. Lu, Q. Yang, A. Zupanic, Q. Xu and L. Jiang, Using MoS2 Nanomaterials to Generate or Remove Reactive Oxygen Species: A Review, ACS Appl. Nano Mater., 2021, 4(8), 7523–7537, DOI:10.1021/acsanm.1c00751.
- T. I. Kim, J. Kim, I. Park, K. Cho and S. Choi, Chemically exfoliated 1T-phase transition metal dichalcogenide nanosheets for transparent antibacterial applications, 2D Mater., 2019, 6(025025), 1–14, DOI:10.1088/2053-1583/ab070e.
- F. Ou, C. McGoverin, S. Swift and F. Vanholsbeeck, Absolute bacterial cell enumeration using flow cytometry, J. Appl. Microbiol., 2017, 123(2), 464–477, DOI:10.1111/jam.13508.
- J. Robertson, C. McGoverin, F. Vanholsbeeck and S. Swift, Optimisation of the Protocol for the LIVE/DEAD® BacLightTM Bacterial Viability Kit for Rapid Determination of Bacterial Load, Front. Microbiol., 2019, 10, 801, DOI:10.3389/fmicb.2019.00801.
- M. Berney, F. Hammes, F. Bosshard, H. Weilenmann and T. Egli, Assessment and Interpretation of Bacterial Viability by Using the LIVE/DEAD BacLight Kit in Combination with Flow Cytometry, Appl. Environ. Microbiol., 2007, 73(10), 3283–3290, DOI:10.1128/AEM.02750-06.
- S. Liu, T. H. Zeng, M. Hofmann, E. Burcombe, J. Wei, R. Jiang, J. Kong and Y. Chen, Antibacterial Activity of Graphite, Graphite Oxide, Graphene Oxide, and Reduced Graphene Oxide: Membrane and Oxidative Stress, ACS Nano, 2011, 5(9), 6971–6980, DOI:10.1021/nn202451x.
- O. Akhavan and E. Ghaderi, Toxicity of Graphene and Graphene Oxide Nanowalls Against Bacteria, ACS Nano, 2010, 4(10), 5731–5736, DOI:10.1021/nn101390x.
- Y. Tu, M. Lv, P. Xiu, T. Huynh, M. Zhang, M. Castelli, Z. Liu, Q. Huang, C. Fan, H. Fang and R. Zhou, Destructive extraction of phospholipids from Escherichia coli membranes by graphene nanosheets, Nat. Nanotechnol., 2013, 8(12), 594–601, DOI:10.1038/nnano.2013.275.
- C. S. Romero-Vargas, F. Perreault, A. F. de Faria and M. Elimelech, Interaction of Graphene Oxide with Bacterial Cell Membranes: Insights from Force Spectroscopy, Environ. Sci. Technol. Lett., 2015, 2(4), 112–117, DOI:10.1021/acs.estlett.5b00066.
- R. Wu, X. Ou, R. Tian, J. Zhang, H. Jin, M. Dong, J. Li and L. Liu, Membrane destruction and phospholipid extraction by using two-dimensional MoS2 nanosheets, Nanoscale, 2018, 10(43), 20162–20170, 10.1039/C8NR04207A.
- X. Wu, S. Tan, Y. Xing, Q. Pu, M. Wu and J. X. Zhao, Graphene oxide as an efficient antimicrobial nanomaterial for eradicating multi-drug resistant bacteria in vitro and in vivo, Colloids Surf., B, 2017, 157, 1–9, DOI:10.1016/j.colsurfb.2017.05.024.
- C. Thomas, S. George, A. Horst, Z. Ji, R. Miller, J. Peralta-Videa, T. Xia, S. Pokhrel, L. Madler, J. Gardea-Torresdey, P. Holden, A. Keller, H. Lenihan, A. Nel and J. Zink, Nanomaterials in the Environment: From Materials to High-Throughput Screening to Organisms, ACS Nano, 2011, 5(1), 13–20, DOI:10.1021/nn1034857.
- A. Nel, T. Xia, H. Meng, X. Wang, S. Lin, Z. Ji and H. Zhang, Nanomaterial Toxicity Testing in the 21st Century: Use of a Predictive Toxicological Approach and High-Throughput Screening, Acc. Chem. Res., 2012, 46(3), 607–621, DOI:10.1021/ar300022h.
- T. Qiu, T. H. T. Nguyen, N. Hudson-Smith, P. Clement, D. C. Forester, H. Frew, M. Hang, C. Murphy, R. Hamers, Z. V. Feng and C. Haynes, Growth-Based Bacterial Viability Assay for Interference-Free and High-Throughput Toxicity Screening of Nanomaterials, Anal. Chem., 2017, 89, 2057–2064, DOI:10.1021/acs.analchem.6b04652.
- S. George, T. Xia, R. Rallo, Y. Zhao, Z. Ji, S. Lin, W. Xiang, H. Zhang, B. France, D. Schoenfield, R. Damoiseaux, R. Liu, S. Lin, K. Bradley, Y. Cohen and A. Nel, Use of a High Throughput Screening Approach Coupled with In Vivo Zebrafish Embryo Screening to Develop Hazard Ranking for Engineered Nanomaterials, ACS Nano, 2011, 5(3), 1805–1817, DOI:10.1021/nn102734s.
- M. Egervarn, M. Danielsen, S. Roos, H. Lindmark and S. Lindgren, Antibiotic Susceptibility Profiles of Lactobacillus reuteri and Lactobacillus fermentum, J. Food Prot., 2007, 70(2), 412–418 CrossRef PubMed.
- F. Megraud, Resistance of Helicobacter pylori to antibiotics, Aliment. Pharmacol. Ther., 1997, 11(1), 43–53 CrossRef CAS PubMed.
- M. S. Ammor, A. B. Florez, A. H. A. M. van Hoek, G. C. G. de los Reyes, H. J. M. Aarts, A. Margolles and B. Mayo, Molecular Characterization of Intrinsic and Acquired Antibiotic Resistance in Lactic Acid Bacteria and Bifidobacteria, J. Mol. Microbiol. Biotechnol., 2008, 14, 6–15, DOI:10.1159/000106077.
- G. E. Burrows, R. J. Morton and W. H. Fales, Microdilution antimicrobial susceptibilities of selected gram-negative veterinary bacterial isolates, J. Vet. Diagn. Invest., 1993, 5, 541–547 CrossRef CAS PubMed.
- X. Lou, Z. Liu, J. Hou, Y. Zhou, W. Chen, X. Xing, Y. Li, Q. Liao and X. Zhu, Modification of the anodes using MoS2 nanoflowers for improving microbial fuel cells performance, Catal. Today, 2021, 364, 111–117, DOI:10.1016/j.cattod.2019.11.029.
- J. Y. Chen, P. Xie and Z. P. Zhang, Reduced graphene oxide/polyacrylamide composite hydrogel scaffold as biocompatible anode for microbial fuel cell, Chem. Eng. J., 2019, 361, 615–624, DOI:10.1016/j.cej.2018.12.116.
- D. Paul, M. T. Noori, P. P. Rajesh, M. M. Ghangrekar and A. Mitra, Modification of carbon felt anode with graphene oxide-zeolite composite for enhancing the performance of microbial fuel cell, Sustain. Energy Technol. Assess., 2018, 26, 77–82, DOI:10.1016/j.seta.2017.10.001.
- Y. Li, J. Liu, X. Chen, X. Yuan, N. Li, W. He and Y. Feng, Enhanced electricity generation and extracellular electron transfer by polydopamine–reduced graphene oxide (PDA–rGO) modification for high-performance anode in microbial fuel cell, Chem. Eng. J., 2020, 387(92), 123408, DOI:10.1016/j.cej.2019.123408.
- A. Pareek, J. S. Sravan and S. V. Mohan, Exploring chemically reduced graphene oxide electrode for power generation in microbial fuel cell, Mater. Sci. Energy Technol., 2019, 2(3), 600–606, DOI:10.1016/j.mset.2019.06.006.
- Y. Xu, S. Zhou and M. Li, Enhanced bioelectricity generation and cathodic oxygen reduction of air breathing microbial fuel cells based on MoS2 decorated carbon nanotube, Int. J. Hydrogen Energy, 2019, 44(26), 13875–13884, DOI:10.1016/j.ijhydene.2019.04.040.
- N. Yang, Y. Ren, X. Li and X. Wang, Effect of Graphene-Graphene Oxide Modified Anode on the Performance of Microbial Fuel Cell, Nanomaterials, 2016, 6(9), 174, DOI:10.3390/nano6090174.
- S. Khalid, F. Alvi, M. Fatima, M. Aslam, S. Riaz, R. Farooq and Y. Zhang, Dye degradation and electricity generation using microbial fuel cell with graphene oxide modified anode, Mater. Lett., 2018, 220, 272–276, DOI:10.1016/j.matlet.2018.03.054.
- R. B. Song, C. E. Zhao, P. P. Gai, D. Guo, L. P. Jiang, Q. Zhang, J. R. Zhang and J. J. Zhu, Graphene/Fe3O4 Nanocomposites as Efficient Anodes to Boost the Lifetime and Current Output of Microbial Fuel Cells, Chem. – Asian J., 2017, 12(3), 308–313, DOI:10.1002/asia.201601272.
- M. Mouhib, A. Antonucci, M. Reggente, A. Amirjani, A. J. Gillen and A. A. Boghossian, Enhancing bioelectricity generation in microbial fuel cells and biophotovoltaics using nanomaterials, Nano Res., 2019, 12(9), 2184–2199, DOI:10.1007/s12274-019-2438-0.
Footnote |
| † Electronic supplementary information (ESI) available. See DOI: https://doi.org/10.1039/d2en00716a |
| This journal is © The Royal Society of Chemistry 2023 |