
 Open Access Article
 This Open Access Article is licensed under a Creative Commons Attribution-Non Commercial 3.0 Unported Licence
Monitoring the adsorption of per- and polyfluoroalkyl substances on carbon black by LDI-MS capable of simultaneous analysis of elemental and organic carbon†
Ke
Min
 ab,
Shenxi
Deng
a,
Zhao
Shu
a,
Yong
Li
ac,
Bo
Chen
b,
Ming
Ma
b,
Qian
Liu
*ad and
Guibin
Jiang
a
ab,
Shenxi
Deng
a,
Zhao
Shu
a,
Yong
Li
ac,
Bo
Chen
b,
Ming
Ma
b,
Qian
Liu
*ad and
Guibin
Jiang
a
aState Key Laboratory of Environmental Chemistry and Ecotoxicology, Research Center for Eco-Environmental Sciences, Chinese Academy of Sciences, Beijing 100085, China. E-mail: qianliu@rcees.ac.cn
bKey Laboratory of Phytochemical R&D of Hunan Province, Ministry of Education Key Laboratory of Chemical Biology & Traditional Chinese Medicine Research, Hunan Normal University, Changsha 410081, China
cNational Engineering Laboratory for Applied Forest Ecological Technology in Southern China, Faculty of Life Science and Technology, Central South University of Forestry and Technology, Changsha 410004, China
dTaishan Institute for Ecology and Environment (TIEE), Jinan 250100, China
First published on 17th July 2023
Abstract
Elemental carbon (EC) and organic carbon (OC) exist ubiquitously and interact mutually in the environment. Simultaneous analysis of EC and OC will greatly advance our understanding of the behavior and fate of EC and OC, but is however still a great challenge due to the lack of suitable analytical tools. Here, we report a matrix-free laser desorption/ionization mass spectrometry (LDI-MS) method capable of simultaneous analysis of EC and OC by monitoring two independent groups of specific MS fingerprint peaks. We found that EC itself can generate carbon cluster peaks in the low mass range under laser excitation, and meanwhile it can also serve as a matrix to assist the ionization of OC in LDI-MS. By using per- and polyfluoroalkyl substances (PFASs) as a typical set of OC and carbon black (CB) as a model EC, we successfully monitored the adsorption process of PFASs on CB enabled by LDI-MS. We show that hydrophobic interaction dominates the sorption of PFASs to CB, which was affected by the functional groups and carbon chain length of PFASs. Furthermore, environmental substances in water such as humic acid (HA) and surfactants can significantly affect the adsorption of PFASs on CB probably by changing the adsorption sites of CB. Overall, we demonstrate that LDI-MS offers a versatile and high-throughput tool for simultaneous analysis of EC and OC species in real environmental samples, which makes it promising for investigating the environmental behaviors and ecological risks of pollutants.
Environmental significanceEC and OC exist ubiquitously and interact mutually in the environment. Simultaneous analysis of EC and OC will greatly advance our understanding of their behaviors and fate, but is however still a great challenge due to the lack of suitable analytical tools. Here, we used LDI-MS capable of simultaneous analysis of EC and OC to successfully monitor the adsorption process of PFASs on CB. The new method offers a versatile tool for simultaneous analysis of EC and OC species in real environmental samples, which makes it promising for investigating the environmental behaviors and ecological risks of pollutants. |
Introduction
Soot particles, also known as black carbon (BC), are fractal-like aggregates produced from the incomplete combustion of biomass and fossil fuels.1,2 The chemical composition of soot is complex and can be roughly divided into the nonvolatile elemental carbon (EC) inner core and surface-adsorbed organic carbon (OC) outer shell, such as hydrocarbons, carboxylic acids, polycyclic aromatic hydrocarbons (PAHs), and organic polymers.3,4 EC and OC exist ubiquitously in environmental matrices. Their interactions are closely associated with their environmental fate, and also affect their toxicity and ecological risks. However, due to the lack of suitable analytical methods, it is still very difficult to analyze EC and OC simultaneously; in particular, analysis of EC alone remains challenging due to the interference from other carbonaceous substances.5,6Generally, analysis of EC and OC needs different analytical techniques. For example, the main techniques for quantification of OC in environmental media are organic mass spectrometry, including HPLC-MS and GC-MS methods,7–10 which, however, are often not suitable for analyzing EC and other inorganic components. For EC, it is often analyzed and characterized by light microscopy, scanning/transmission electron microscopy, or soot particle aerosol mass spectrometry (SP-AMS).11,12 The optical/electronic observation methods usually give poor accuracy in quantification, and SP-AMS applying laser vaporization is limited to analyzing gaseous samples since it finds it difficult to handle liquid or solid samples.13–15 In addition, a Single Particle Soot Photometer (SP2) and OC/EC analyzer are also available for measurements of EC and OC; however, these techniques provide less molecular information for identification of different species.11,14 Taken together, it remains a great challenge to obtain information on multiple components including EC and OC from environmental samples simultaneously.
Per- and polyfluoroalkyl substances (PFASs) are a set of OCs with strong C–F bonds, and have been widely used as emulsifying agents in polymer synthesis, surface treatment agents in photolithography, fire retardants, furniture cleaners, paper and cloth coatings.16,17 It has been well documented that PFASs are environmentally persistent, bio-accumulative and widely distributed.18–20 Aquatic toxicology of PFASs has attracted much attention, mainly due to the prevalence of water pollution caused by PFASs and potentially adverse risks on animals and humans.8,21 Soot can easily enter the aquatic environment through atmospheric deposits, and then interact with other OC in water phase.22 With its large specific surface area and abundant surface functional groups, soot manifests a strong sorption capacity for various OCs (e.g., antibiotics and PAHs).23–25 Despite the ubiquitous coexistence of soot and PFASs in water, their potential interactions have not been fully investigated yet. Thus, it is necessary to develop an approach to uncover the intertwined relationship of soot and PFASs, because soot may significantly change the environmental fate and ecological risks of PFASs.
Laser desorption/ionization mass spectrometry (LDI-MS) is a powerful mass spectrometry tool with attractive properties such as high throughput, simple and minimal sample preparation, and rapid analysis.26–28 Meanwhile, LDI is a relatively soft ionization technique that can retain certain cluster structures when ionizing particulate materials.4,29,30 Herein, by using PFASs as a typical set of OC and carbon black (CB) as a standard and alternative soot material (i.e., a model EC), we found that LDI-MS generated two kinds of independent and specific characteristic MS fingerprint peaks for EC and OC. Of note, EC itself not only can absorb the laser energy ionization to generate carbon clusters in a low mass range, but also serves as a matrix to assist the ionization of OC in LDI-MS, which thus enabled simultaneous analysis of EC and OC. By using this new technique, we monitored the adsorption process of PFASs on CB to better understand the environmental behaviors and ecological risks of PFASs. Furthermore, the effect of common co-existing environmental substances in water, including natural HA and surfactants, on the adsorption of PFASs on CB was investigated. Considering the ubiquity of EC and OC in diverse environmental matrices, this method provides a versatile tool for simultaneous quantification of EC and OC in environmental samples.
Materials and methods
Reagents and chemicals
Acetonitrile, methanol, hexane, and acetone of HPLC grade were purchased from Innochem Technology Co. (Beijing, China). Ethanol, potassium hydroxide (KOH) and hydrochloric acid (HCl, 37%) of analytical grade were purchased from Sinopharm (Beijing, China). Carbon black (CB) was purchased from Aladdin (Shanghai, China). Perfluorooctanesulfonic acid potassium salt (PFOS, 98%) was purchased from Beijing J&K Scientific Co. (Beijing, China). Perfluorooctanoic acid (PFOA, 96%) was purchased from Sigma-Aldrich (Germany). Perfluorononanoic acid (PFNA, 97%) and perfluorododecanoic acid (PFDoA, 96%) were purchased from Alfa Aesar Chemical Co. (China). Perfluorodecanoic acid (PFDA, 98%) was purchased from Aladdin (Shanghai, China). Surfactants including tetradecyl dimethyl benzyl ammonium chloride (TDBAC) and cetyl trimethyl ammonium bromide (CTAB) were purchased from AccuStandard (USA) and Sigma-Aldrich (Germany), respectively. Humic acid (HA) was purchased from Alfa Aesar Chemical Co. (China). Filter membranes (polyethersulfone material, 0.22 μm) were purchased from Anpel Laboratory Technology Co. (Shanghai, China). Deionized water was obtained using a Milli-Q Direct ultrapure water system (Millipore, USA).Instruments and parameters
LDI-MS experiments were performed on a Rapiflex MALDI Tissuetyper (Bruker Daltonics, Germany) working in the negative-ion mode. The measurement conditions controlled by a FlexControl workstation were as follows: laser working frequency 5000 Hz, laser shots 1000, laser power 90%, and mass range m/z 20–600. A single analysis involves dropping 1.0 μL of sample solution on a MALDI target plate (MTP 384 polished steel, Bruker Daltonics, Germany) followed by air-drying before LDI-MS analysis. The FlexAnalysis 4.0 software was used for MALDI-MS data processing.A Q-TOF-MS (Agilent 6540) instrument for method validation was used in the negative electrospray ionization mode. Mass spectra were acquired in full-scan (m/z 20–600) mode and the instrument conditions included: mobile phase, acetonitrile/water (v/v, 70![[thin space (1/6-em)]](https://www.rsc.org/images/entities/char_2009.gif) :30); injection volume, 1 μL; and liquid flow rate, 0.3 mL min−1. The conditions of the MS interface controlled by a MassHunter workstation were as follows: 10.0 L min−1 for desolvation gas flow rate, 35 psi for nebulization gas pressure, and 350 °C and 300 °C for source and desolvation gas temperatures. The single run time is ∼1 min with no need of chromatographic separation.
:30); injection volume, 1 μL; and liquid flow rate, 0.3 mL min−1. The conditions of the MS interface controlled by a MassHunter workstation were as follows: 10.0 L min−1 for desolvation gas flow rate, 35 psi for nebulization gas pressure, and 350 °C and 300 °C for source and desolvation gas temperatures. The single run time is ∼1 min with no need of chromatographic separation.
The other instruments used in this study included an environmental scanning electron microscope (SEM, model SU8020, Hitachi, Japan) instrument equipped with an energy dispersive X-ray spectrometer (EDS) instrument, nanoparticle tracking analyzer (NTA, model Nanosight NS300, Malvern, UK), high-speed refrigerated centrifuge (model 5810R, Eppendorf, Germany), high-power ultrasonic cleaning machine (model KQ-600KDE, Kunshan Ultrasonic Instrument Co., China), vortexing machine (model VORTEX-8, Qilin Bell Instrument Manufacturing Co., Jiangsu, China), desktop constant temperature magnetic stirrer (model S23-2, Sile Instrument Co., Shanghai, China), and electronic microbalance (model ME204/02, Mettler toledo, Switzerland).
Preparation of standard solutions
The stock solutions of PFOS (2.0 mg mL−1), PFOA (1.0 mg mL−1), PFNA (1.0 mg mL−1), PFDA (1.0 mg mL−1), and PFDoA (1.0 mg mL−1) were prepared in deionized water, and stored in a refrigerator at 4 °C. The working solutions of PFOS (0.4, 5, 20, 40, 60 and 100 ng mL−1) and PFOA (0.4, 5, 20, 40, 60 and 100 ng mL−1) were obtained by dilution with deionized water for establishing calibration curves. CB (100 mg) was homogenized and dispersed in 50 mL of water using a constant temperature magnetic stirrer for 2 h followed by ultrasonication for 30 min to obtain a stock solution of CB (2.0 mg mL−1). The dispersion of CB was then diluted to prepare a concentration of 0.2 mg mL−1 for further adsorption experiments. Of note, the standard solutions of PFOS (100 ng mL−1) and PFOA (100 ng mL−1), which were close to environmental concentration levels, and CB (0.2 mg mL−1) were selected for investigation of the adsorption behaviors and interactive mechanisms.Monitoring the adsorption of PFASs on CB by LDI-MS
Taking PFOS as an example, 100 ng mL−1 of PFOS standard was prepared with water, and an appropriate amount of CB (0.2 mg mL−1) was added. The mixed solution was first ultrasonicated for 5 min to obtain a pre-equilibrium state, and then left to stand for a period of time until an adsorption equilibrium was reached. To monitor the adsorption behaviors of PFOS on CB in the water, the mixed solutions were sampled at regular adsorption time intervals (1, 5, 20, 40, 60, 120 and 180 min) by two approaches, including without membrane filtration and with filtration through a 0.22 μm membrane. The first approach allowed the direct detection of MS intensities of OC and EC during the adsorption process. The second approach with membrane filtration could be used to quantify the residual OC after performing EC adsorption (the OC-adsorbed EC could be removed by the membrane filtration) by LDI-MS and Q-TOF-MS, which also allowed the results of the method to be verified. All sample solutions dropped on the MALDI target plate were air-dried prior to LDI-MS measurements. Of note, [MPFOS–H]− (m/z 499) and C6− (m/z 72) were selected as characteristic ions for PFOS and CB, respectively, and in this case their MS intensity ratio (Im/z 499/Im/z 72) was assigned as the ratio of OC to EC (OC/EC value).Effects of co-existing environmental substances on the adsorption process
The interaction of CB and co-existing substances in the aquatic environment can greatly affect the adsorption behavior of organic contaminants.31–33 Thus, the effects of substances widely existing in environmental waters, including humic acid (HA) and surfactants, on the adsorption behaviors of PFASs on CB were also studied. Adsorption rate (%) was used to evaluate the surface adsorption efficiency of particles.34,35 Taking PFOS as an example, the adsorption capacity of PFOS on CB was calculated using the following formula:| Adsorption rate (%) = (Iinitial PFOS − Ifinal PFOS)/Iinitial PFOS × 100% |
Application to real environmental wastewater from a fluorochemical manufactory
PFASs-containing wastewater samples were collected from a fluorochemical manufactory in December 2020, located downstream of the tributary of the DuanGang Reservoir in Hubei Province, China.36 The raw wastewater sample was filtered through a Whatman glass microfiber filter GF/F 0.7 μm prior to analysis. An appropriate amount of CB (0.2 mg mL−1) was added to the wastewater sample, followed by ultrasonication for 5 min to obtain a pre-equilibrium state, and then the mixed solution was sampled at 20 min time of adsorption with filtration through a 0.22 μm membrane. Finally, the sample solution was directly dropped onto the MALDI target plate followed by air-drying prior to LDI-MS measurements.Results and discussion
Establishment of the LDI-MS platform for simultaneous analysis of EC and OC
Carbon black (CB) has often been used as a standard material for soot quantification, so it was selected as a model EC for method development.37,38 We found that the extracted soot from the environmental samples and CB standard had the same MS fingerprints, and similar morphology and size distribution (see Fig. S1†). Immediately afterwards, we explored the feasibility of LDI-MS for simultaneous analysis of EC and OC. First, two environmentally dominant PFASs, PFOS and PFOA (as representatives of OC), were mixed with CB (a model EC). Notably, strong MS signals of both EC and OC were clearly obtained in a single LDI-MS spectrum. Clustering of characteristic peaks of C3−–C10− at m/z 36, 48, 60, 72, 84, 96, 108, and 120 is specifically generated by CB (see Fig. 1a and b, and Table S1†). PFOS yielded [MPFOS–C2F4–H]−, [MPFOS–CF2–H]−, and [MPFOS–H]− peaks at m/z 399, 449, and 499, respectively (see Fig. 1a and Table S1†). Fig. 1b shows the characteristic peaks of PFOA at m/z 281, 331, 369 and 413 corresponding to [MPFOA–CF4COOH]−, [MPFOA–F2COOH]−, [MPFOA–COOH]−, and [MPFOA–H]−, respectively. Thus, the EC (i.e., CB) and OC (i.e., PFOS and PFOA) generated two kinds of characteristic fingerprint peaks in the same MS spectrum by LDI-MS without mutual interference. In addition, the corresponding characteristic peaks mentioned above were also separately verified by the individual standards of CB, PFOS, and PFOA (see Fig. 2).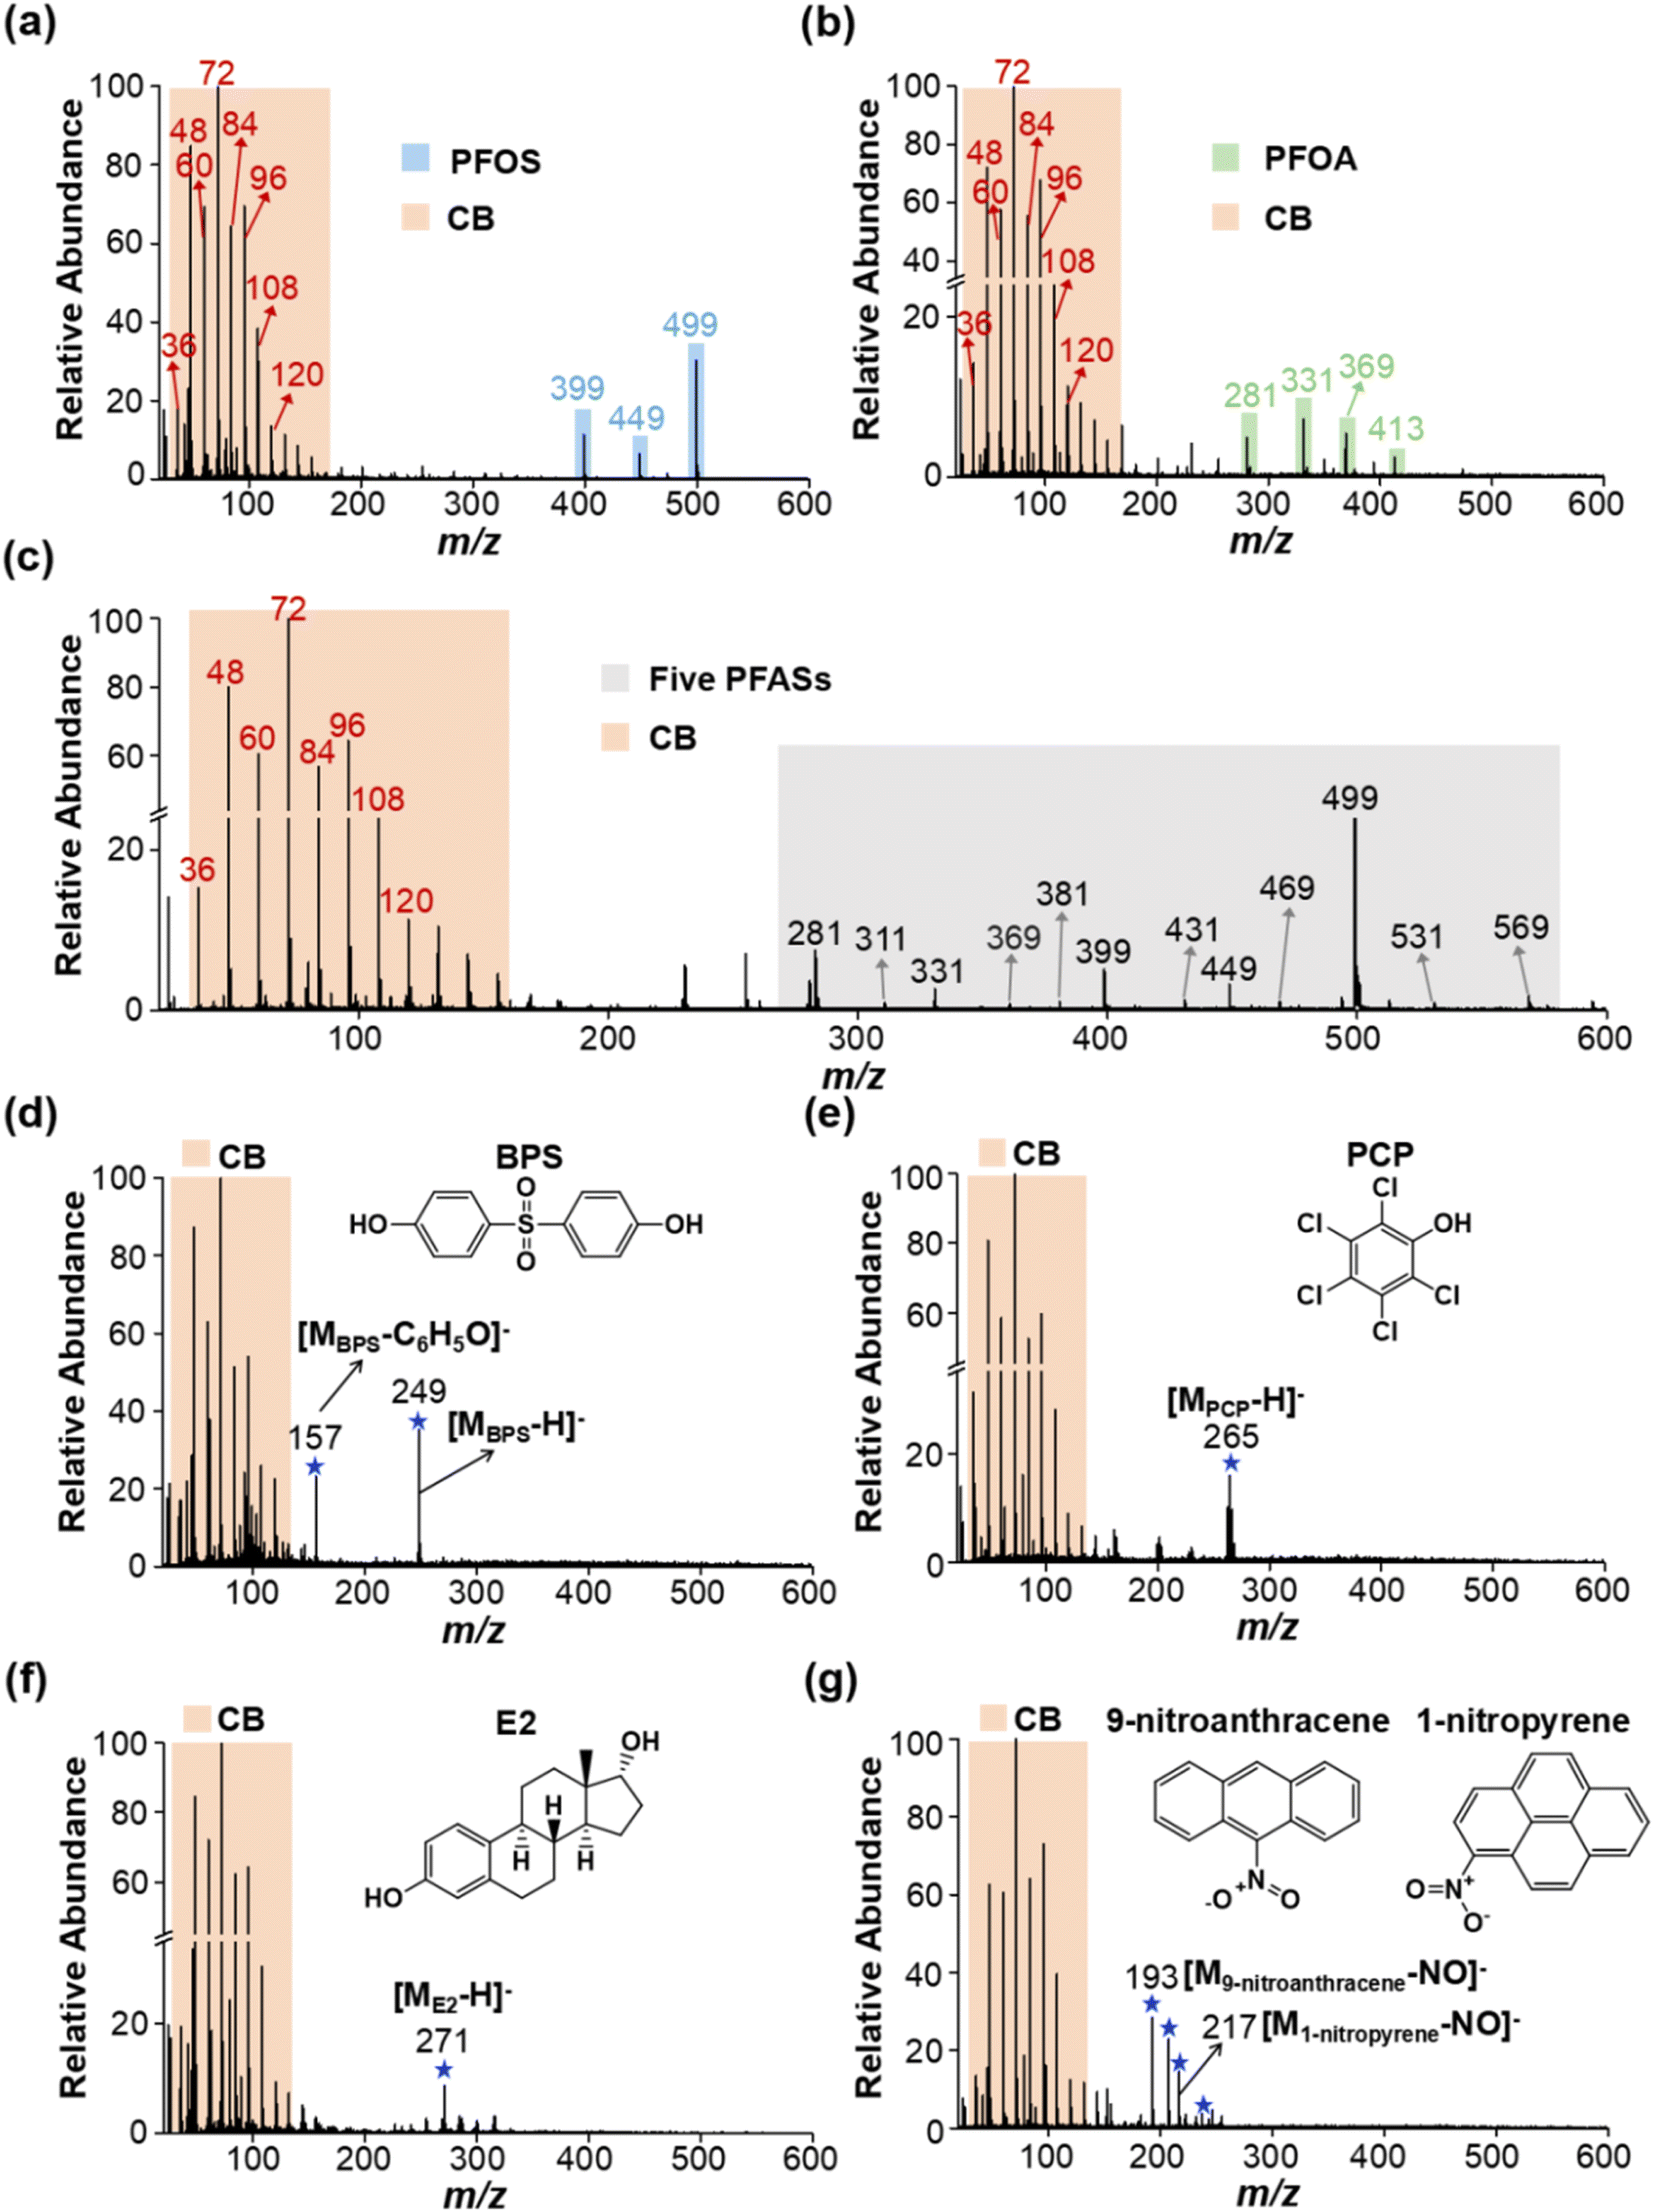 | ||
| Fig. 1 Simultaneous analysis of EC and multiple types of OCs by LDI-MS. The typical MS spectra of (a) PFOS, (b) PFOA, (c) five PFASs, (d) BPS, (e) PCP, (f) E2, and (g) 9-nitroanthracene and 1-nitropyrene mixed with CB standard. Note: CB was a model EC. PFASs (including PFOS, PFOA, PFNA, PFDA and PFDoA), BPS, PCP, E2, 9-nitroanthracene, and 1-nitropyrene were used as representative OCs. The detailed information about these characteristic peaks is listed in Table S1.† | ||
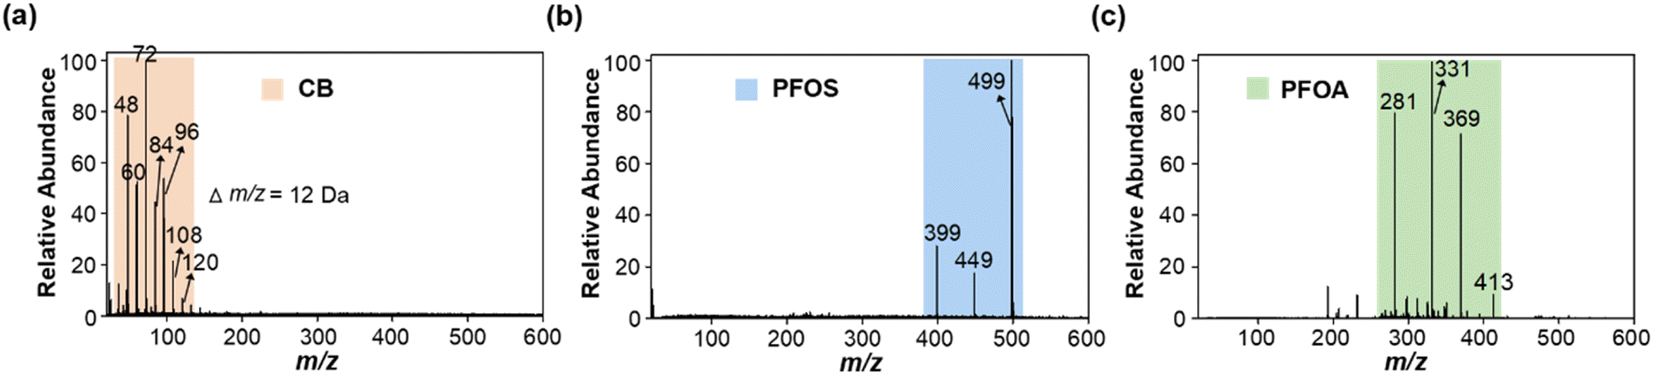 | ||
| Fig. 2 The mass spectra of individual standards of (a) CB (0.1 mg mL−1), (b) PFOS (100 ng mL−1), and (c) PFOA (100 ng mL−1) obtained by LDI-MS. | ||
In light of the numerous members of PFASs, we further extend the target compounds to the cocktail of PFOS, PFOA, PFNA, PFDA and PFDoA. As shown in Fig. 1c and Table S1,† MS fingerprinting of CB and the five PFASs could be simultaneously obtained by LDI-MS, again demonstrating the feasibility of our method. Furthermore, to further evaluate the potential of simultaneous analysis of EC and OC, we added CB to more types of OC, including an industrial adhesive (bisphenol S, BPS), an organochlorine pesticide (pentachlorophenol, PCP), an endocrine disruptor (estradiol, E2) and two nitropolycyclic aromatic hydrocarbons (1-nitropyrene and 9-nitroanthracene) (as described in the Experimental section in the ESI†). As shown in Fig. 1d–g and Table S1,† the MS signals of a variety of OCs and EC could be readily obtained, indicating that this method had a wide applicability. Importantly, EC itself not only can absorb the laser energy ionization, but also serves as a matrix to assist the ionization of OC in LDI-MS, which is the key basis of the LDI-MS method for simultaneous analysis of EC and OC. Overall, we have demonstrated that LDI-MS enables acquisition of the MS fingerprints of both EC and OC, which provides a new strategy for simultaneous quantification of EC and OC.
To validate the established LDI-MS method, we compared the quantification results of PFOS and PFOA by LDI-MS and Q-TOF-MS (as described in the Experimental section in the ESI†). As shown in Fig. S2 and S3, and Tables S2 and S3,† an excellent consistency was obtained between the concentrations of PFOS and PFOA determined by these two techniques (R > 0.98), demonstrating that the quantitative results with LDI-MS were highly accurate and reliable. Meanwhile, the Q-TOF-MS method requires a large amount of solvent consumption, and a 0.22 μm filter membrane is required before the determination of the sample solution. This makes large-scale and direct analysis of particles-containing real samples almost impossible for Q-TOF-MS. In addition, we have proved that the method is also suitable for the detection of EC and OC under positive ion modes (see Fig. S4†). Compared with Q-TOF-MS, LDI-MS offers some distinct advantages including solvent-free process, short analysis time, and the capability of simultaneous analysis of EC and OC, which makes it promising for investigating the environmental behaviors and ecological risks of pollutants in multiple media.
Monitoring the adsorption process of PFOS on CB in water by LDI-MS
The adsorption of PFASs by CB may significantly change their environmental behaviors and fate, and ecological and health risks. Therefore, with the benefits of LDI-MS, investigating the adsorption process of PFASs on CB in water is important for predicting and understanding their environmental risks. Herein, we investigated the behaviors of CB-mediated sorption PFASs in the water. As shown in Fig. 3a, with CB (0.2 mg mL−1) and PFOS (100 ng mL−1), we tried to use the MS signal of OC, EC, and the ratio of OC to EC (OC/EC) to intuitively reflect the adsorption process of each stage. To this end, two sampling methods were adapted prior to LDI-MS analysis for monitoring their adsorption process. In the first sampling method, the mixed solutions of CB and PFOS were sampled at regular adsorption time intervals (1, 5, 20, 40, 60, 120 and 180 min) without membrane filtration and directly dropped on the MALDI target plate. As shown in Fig. S5,† and 3b and c, under the condition without membrane filtration, the value of OC/EC first increased rapidly and then slowly tended to be stable after adsorption for 20 min. This indicated that more and more PFOS was absorbed onto the surface of CB. When an adsorption equilibrium was reached, the value of OC/EC kept constant. An alternative sampling method was that the sample solutions at the same adsorption time intervals were filtered through a filter membrane prior to being dropped on the MALDI target plate. We found that the MS signal of residual PFOS decreased with the adsorption time in the sample solution collected by membrane filtration, and no MS signals of PFOS were detected and the adsorption rate was close to 100% at 20 min (see Fig. S6,† and 3d and e). This indicated that CB along with the adsorbed PFOS could be effectively removed by the membrane filtration, and thus the MS signals of OC decreased with the increase of adsorption time, and a complete removal was obtained at the adsorption equilibrium endpoint (20 min). Within the two different sampling methods, the value of OC/EC tended to be stable in the first, and the MS signal of OC completely diminished in the second, which means that these two indicators (the value of OC/EC and OC signals) could be used to indicate each stage of the adsorption process and the adsorption equilibrium endpoint.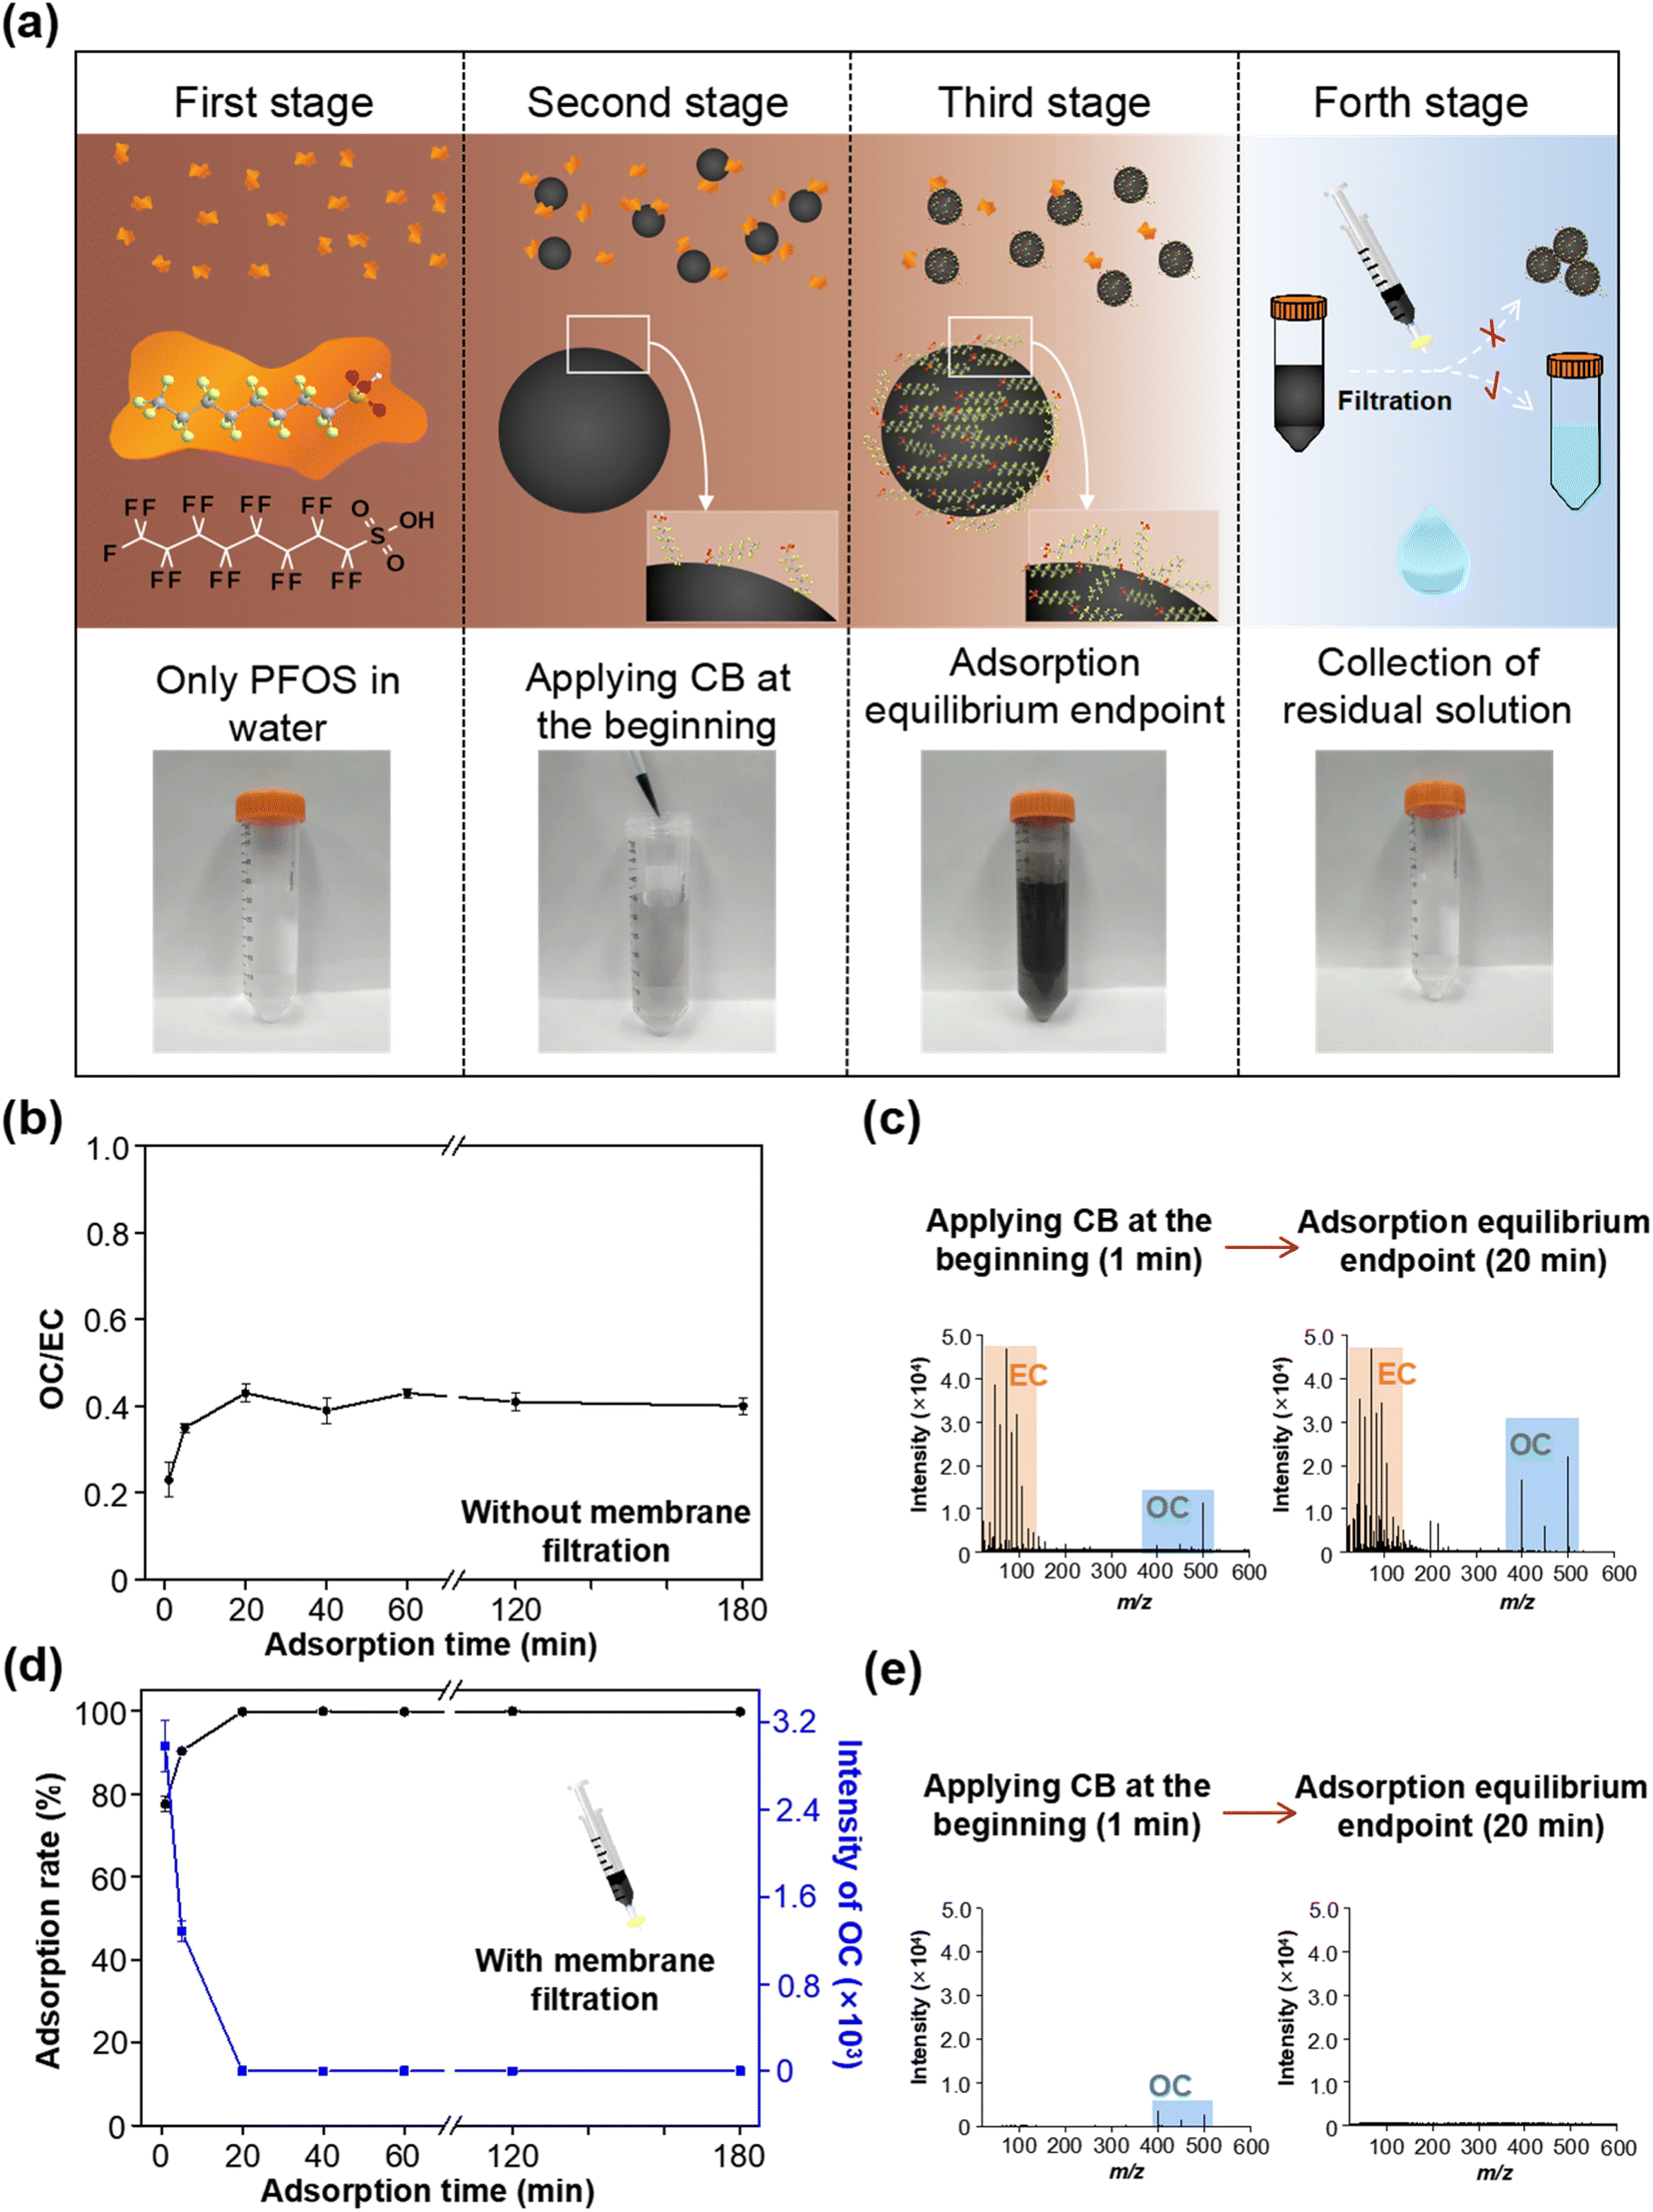 | ||
| Fig. 3 Monitoring the adsorption process of PFOS on CB by LDI-MS. (a) Schematic diagram for the monitoring of the adsorption process (including four stages) of PFOS on CB. (b) Temporal variations of the OC/EC value under the condition without membrane filtration. (c) Typical MS spectra of applying CB at the beginning and adsorption equilibrium endpoint in (b). (d) Temporal variations of MS signal intensity of OC and adsorption rate under the condition with membrane filtration. (e) Typical MS spectra of applying CB at the beginning and adsorption equilibrium endpoint in (d). Note: m/z 499 and m/z 72 were selected as characteristic ions for PFOS and CB, respectively. The value of OC/EC refers to the ratio of MS signal intensities of OC and EC, i.e., Im/z 499/Im/z 72. | ||
In addition, the EC adsorption enhances the sensitivity of OCs to a certain extent, which is because EC can serve as a matrix to assist the ionization of OC in LDI-MS. To this end, we have considered whether EC adsorption affects the accuracy of OC measurements in our study; on one hand, the content of CB in the solution as an adsorbent was fixed and did not change during the adsorption process. Therefore, the quantification of PFASs would not be affected by the amount of EC. On the other hand, as mentioned above, we have also used the sampling approach with filtration through 0.22 μm membranes (to remove EC) and quantified the PFASs in the remaining solution by Q-TOF-MS and LDI-MS simultaneously, which verified the accuracy of the results (see Fig. S2 and S3, and Tables S2 and S3†). With regard to the accuracy of simultaneously quantitating OC and EC in the situations of a field study or variable amounts of EC, we have proposed two strategies to solve this problem: (1) we have established a reliable EC quantification method by using LDI-MS, which enables identification and quantification of EC in diverse environmental and biological samples.29,30 Therefore, in real applications, we can first quantify the EC in samples, and then dilute the studied solution system to a consistent EC concentration. In this way, it is possible to eliminate the effect of EC amount. (2) Another strategy is to first investigate the rule governing the effect of the EC amount on OC signals, and then we can clarify the signal enhancement factors of OC signals at different EC concentrations. In real applications, we can choose different enhancement factors or calibration curves to achieve an accurate OC quantification. In this way, the OC can be accurately quantified in the presence of different concentrations of EC. Such strategies will be investigated in detail in our future studies. Anyway, this problem only affects the quantification results of OC but does not compromise the ability of adsorption process monitoring of this technique.
In addition, the efficiency of membrane filtration was also estimated. It can be seen from Fig. S7† that CB and the adsorbed PFOS were fully removed by membrane filtration (approximately 100%), while with only PFOS in the absence of CB, the membrane filtration could not affect the MS signal intensity of PFOS. Thus, CB was a high-efficiency adsorbent for PFOS in water. The presence of CB can change the free concentration of PFOS in environmental waters and further affect its environmental fate. Taken together, LDI-MS enables the tracing of the adsorption process of PFOS on CB, and reveals that PFOS can be strongly adsorbed by CB in water.
Insights into the adsorption mechanism of PFASs on CB
Owing to the large specific surface area and high surface hydrophobicity, soot has strong adsorption affinity for hydrophobic organic contaminants.22,23 We therefore assume that hydrophobic interaction plays a dominant role in the adsorption of PFASs to CB in water. Organic alcohol solution enables desorption of the hydrophobic C–F chain,39,40 so we use methanol (MeOH) to replace water as solvent for in-depth exploration of the adsorption mechanism. When methanol was used as a desorption solvent, CB had almost no adsorption for PFOS (see Fig. 4a), indicating that the presence of methanol greatly weakened the hydrophobic interaction between CB and PFOS. We also demonstrated that the adsorption of CB and PFOS is reversible. While the filter membrane was eluted again with an appropriate amount of MeOH, obvious MS signals of PFOS were observed in the MS spectra in the collected filtrate, indicating that PFOS could be detached from the filter membrane.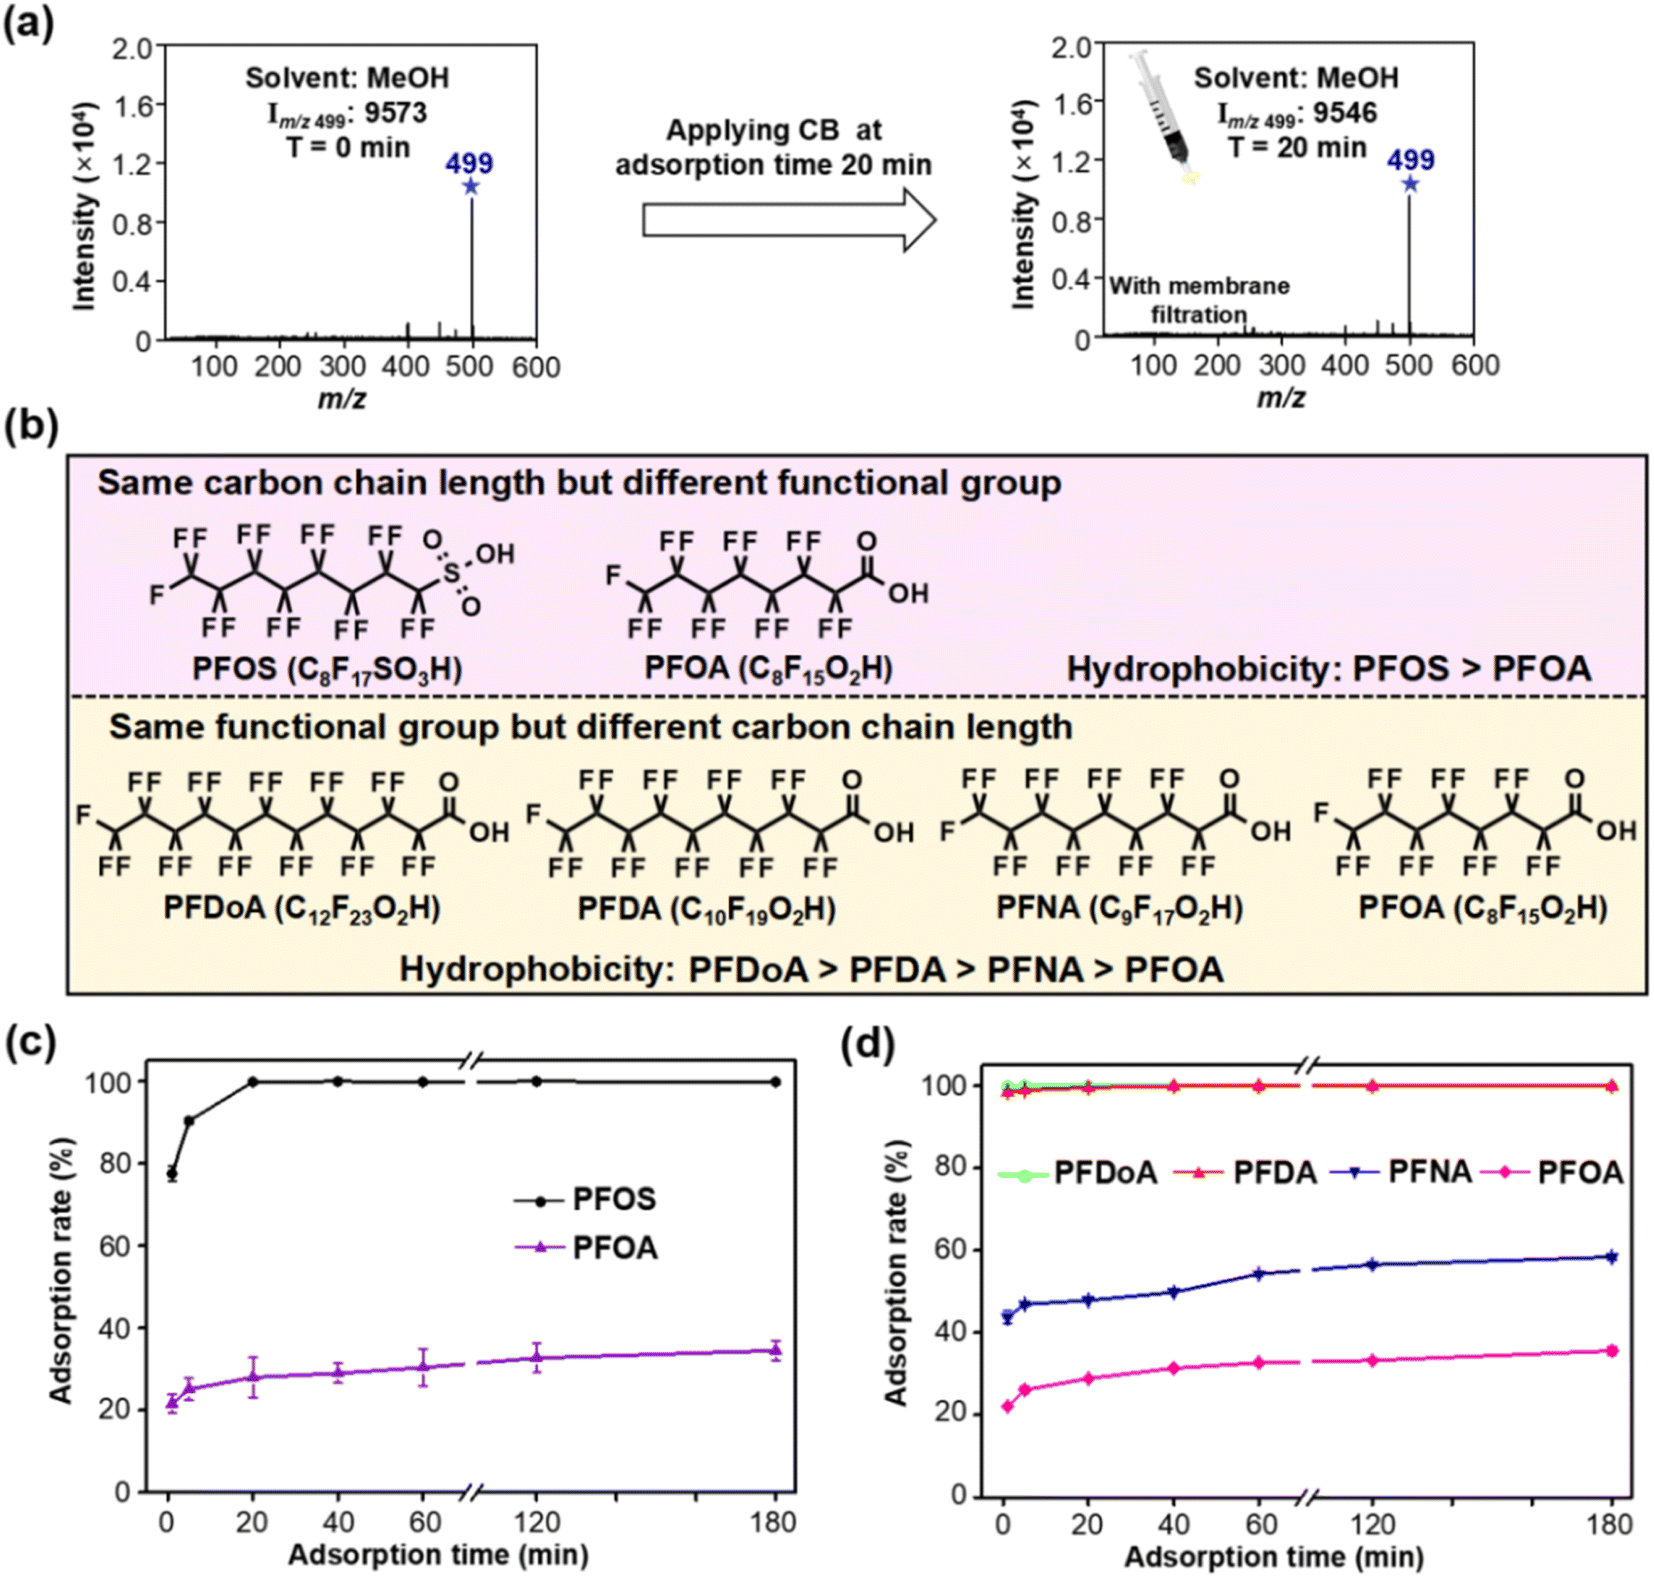 | ||
| Fig. 4 Investigation of the adsorption mechanism of PFASs on CB. (a) MS spectra of PFOS with MeOH as a solvent before and after performing CB adsorption. (b) Chemical structures and hydrophobicity orders of the five PFASs. (c) Adsorption time curves of the same carbon chain length but different functional groups, e.g., PFOS and PFOA. (d) Adsorption time curves of the same functional group but different carbon chain lengths, e.g., PFDoA, PFDA, PFNA and PFOA. | ||
To further elucidate the adsorption mechanism of PFASs on CB, the adsorption capacity of five different hydrophobic PFASs (i.e., PFOS, PFOA, PFNA, PFDA and PFDoA) was compared. PFOS and PFOA have the same carbon chain length but different functional groups, and PFDoA, PFDA, PFNA and PFOA have the same functional group but different carbon chain lengths (the order of hydrophobicity of the five PFASs is presented in Fig. 4b). Fig. 4c reveals a more efficient removal of PFOS than PFOA at the same adsorption time, probably because PFOS has stronger hydrophobicity than PFOA.40,41 Similarly, long-chain compounds with the same functional group can be more efficiently removed than short-chain ones due to stronger hydrophobicity (see Fig. 4d).42,43 Therefore, the adsorption rate of PFASs is closely dependent on their hydrophobicity, again indicating that hydrophobic interaction dominates the sorption of PFASs to CB in water, which was affected by the functional groups and carbon chain length of PFASs.
Investigation of the effect of co-existing environmental substances in water on the adsorption process
Investigating the effect of common environmental substances in waters, e.g., natural HA and surfactants, on the adsorption of PFASs on CB is important to predict their environmental fate in real environmental scenarios. To this end, we investigated the effects of the presence of HA and surfactants on the adsorption process of PFOS and PFOA on CB. When applying CB to adsorb PFOS and PFOA for 5 min, the solutions were filtered by a filter membrane prior to LDI-MS analysis. As shown in Fig. 5a, the presence of HA obviously reduced the adsorption of CB for PFOS and PFOA (P < 0.05), and the suppression effect of HA at high concentration was more significant than that at low concentration. As a typical dissolved organic matter (DOM), the presence of HA might change the aggregation state of CB and further change the availability of the surface adsorption sites for organic contaminants.44 The decreased adsorption could be explained by postulating that the occupation of adsorption sites of CB due to coating by DOM led to decreased availability of the CB surface for adsorption of PFOS and PFOA. This result was consistent with previous studies on organic pollutant adsorption by carbon nanoparticle (CNP) and carbon nanotube (CNT) surfaces.32,45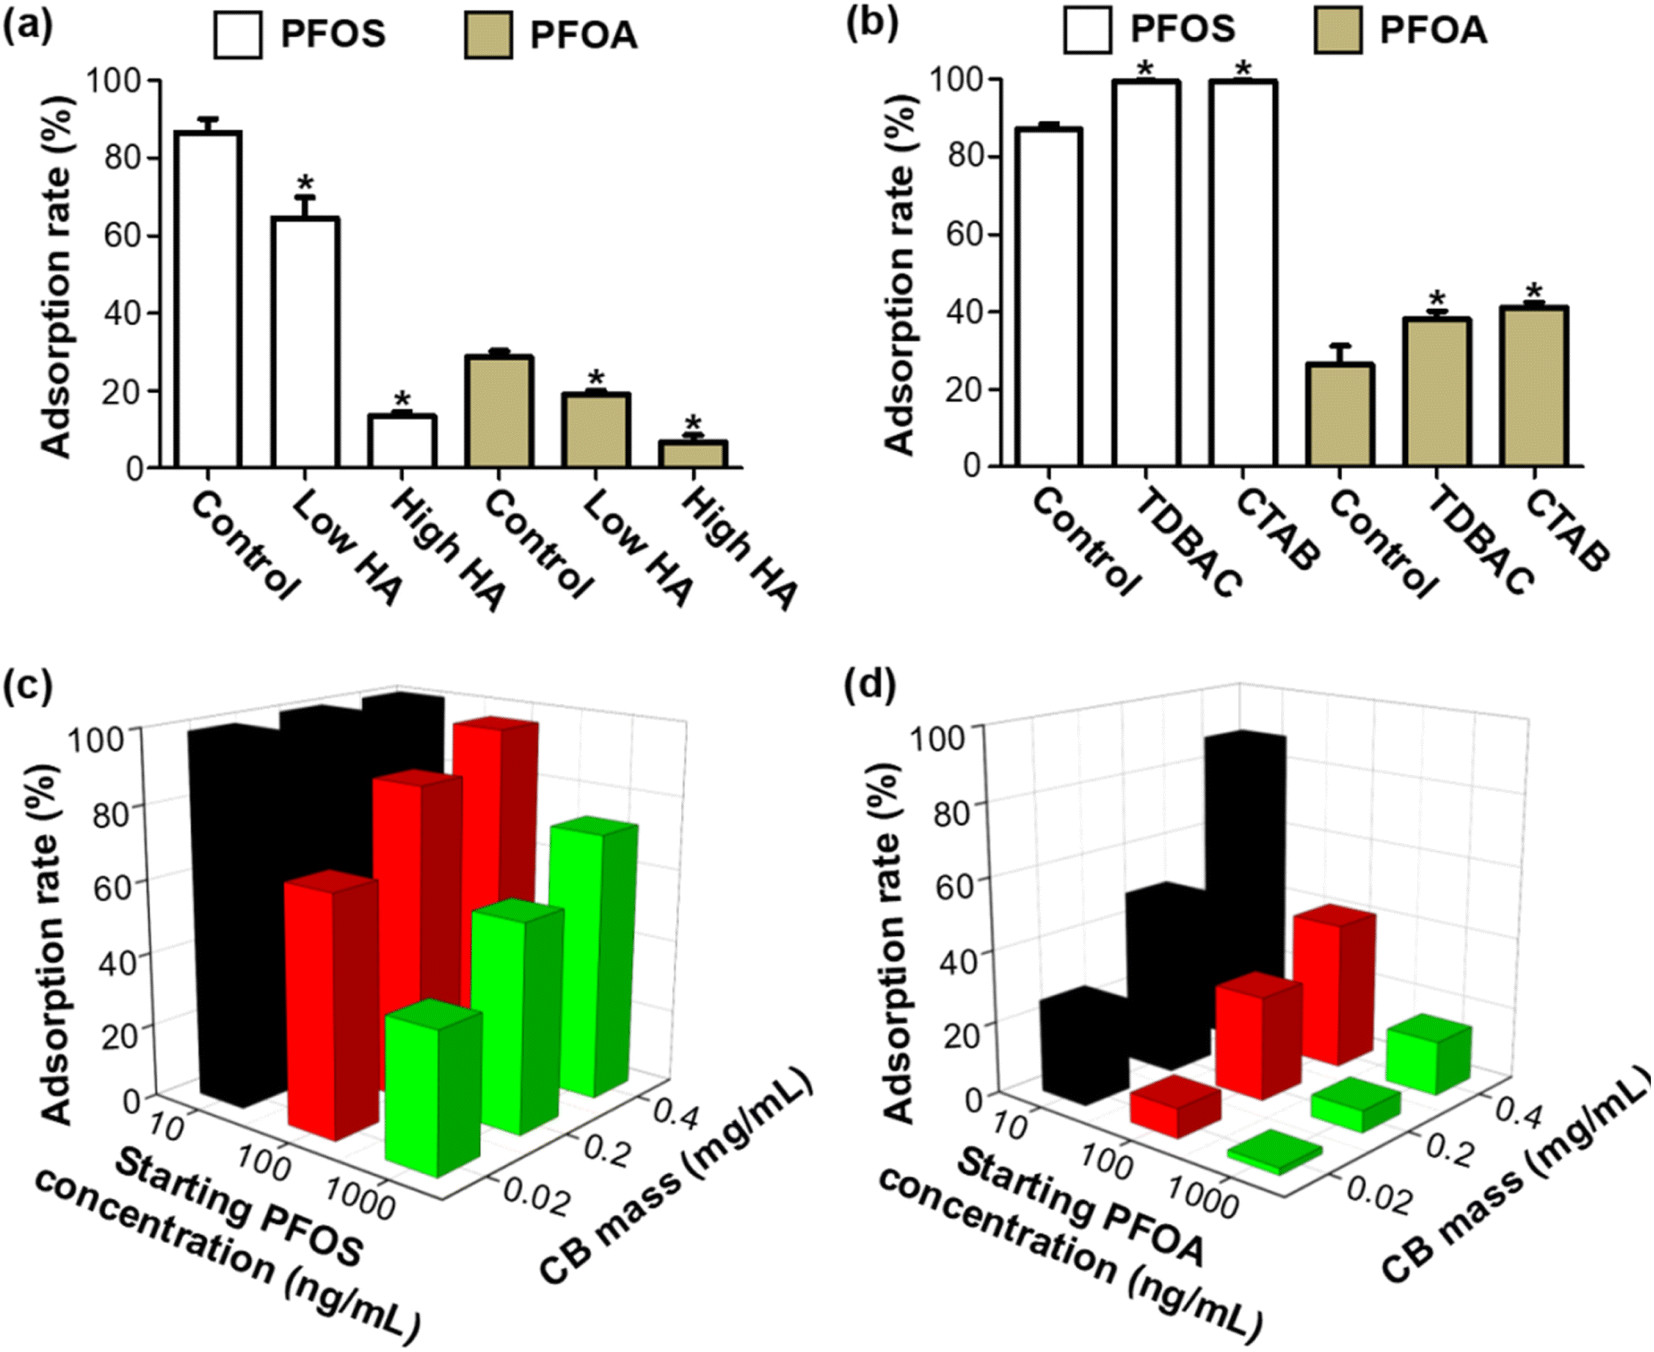 | ||
| Fig. 5 Effects of co-existing substances (HA and surfactants) in the aquatic environment on the adsorption of PFOS and PFOA on CB. The effects of (a) low concentration of HA (low HA, 100 ng mL−1) and high concentration of HA (high HA, 5000 ng mL−1), and (b) surfactants including TDBAC (100 ng mL−1) and CTAB (100 ng mL−1) on adsorption rate. Three-dimensional relationship diagrams between the CB dosage and the concentration of (c) PFOS and (d) PFOA. Note: In (a) and (b), PFOS (100 ng mL−1), PFOA (100 ng mL−1), and CB (0.2 mg mL−1) were selected, and the adsorption time was 5 min. The t test was used to estimate significant differences from the control group (e.g., absence of HA and surfactants), with * indicating P < 0.05. | ||
Then, we estimated the effects of the two representative surfactants, TDBAC and CTAB, on the adsorption process. As shown in Fig. 5b, when applying CB to adsorb PFOS and PFOA for 5 min, the presence of surfactants increased the adsorption of PFOS and PFOA to CB (P < 0.05). Notably, the PFOS signal disappeared within 1 min in the presence of surfactants (see Fig. S8,†e.g., the adsorption equilibrium endpoint was reduced from 20 min to 1 min), suggesting the adsorption rate was greatly improved by surfactants. We suggested that surfactants can effectively disperse CB by enhancing the hydrophilicity and steric repulsion of CB, consequently exposing more available adsorption sites and resulting in increasing adsorption of PFOS and PFOA on CB. This mechanism was also supported by some previous studies.46,47 In addition, the effect of the CB dosage and the concentration of the adsorbed target compounds (PFOS and PFOA) are shown in Fig. 5c and d. We found that the adsorption rate of PFOS and PFOA increased at higher adsorption dosage. Overall, the results mentioned above demonstrated that the interaction of co-existing environmental substances and CB and the adsorbent dosage can greatly affect the adsorption behaviors and environmental fate of organic contaminants.
Application to real environmental wastewater from a fluorochemical manufactory
Finally, we also employed this method to analyze the complex wastewater sample collected in a fluorochemical manufactory. As shown in Fig. 6a, the characteristic MS peaks of many OCs, including but not limited to PFOS and PFOA, can be clearly obtained in the untreated wastewater sample by LDI-MS. Furthermore, we found that OCs decreased significantly and EC was eliminated completely in the filtered solution after performing CB adsorption for 20 min (see Fig. 6b). The rate of adsorption of PFOA and PFOS by CB in the real water sample was estimated to be approximately 100% and 90%, respectively. In other words, these experiments above again demonstrated that this method is promising for simultaneous analysis of EC and OC in real complex samples.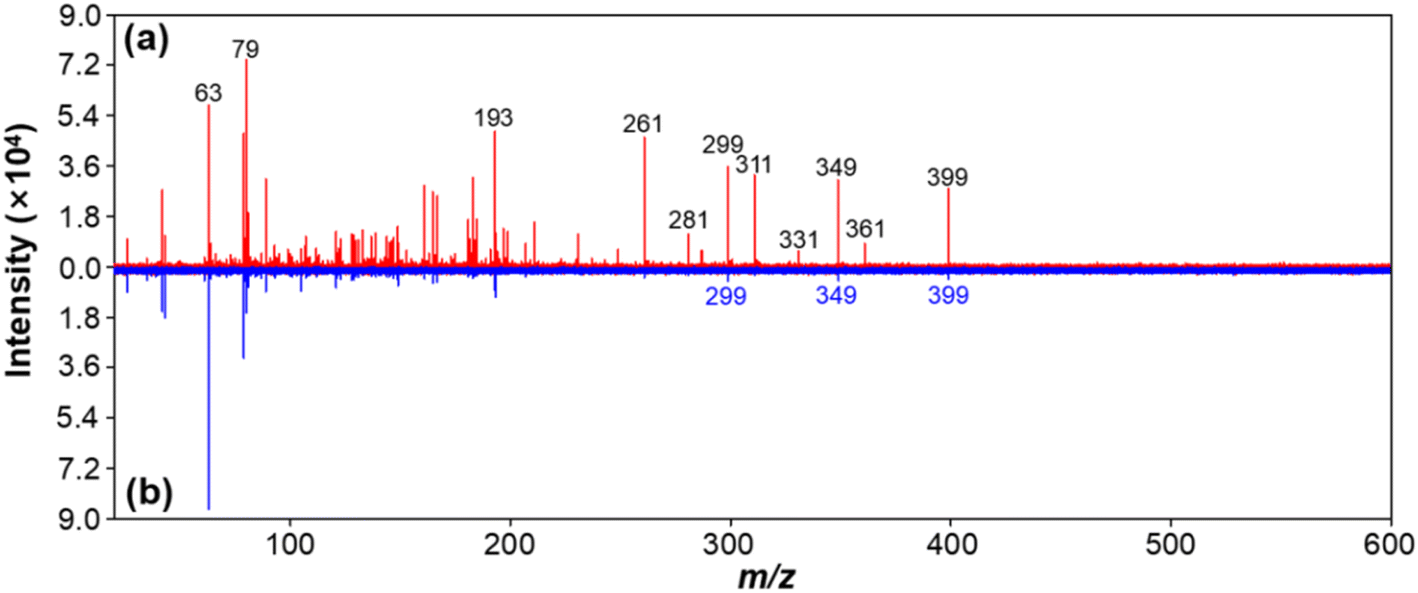 | ||
| Fig. 6 Matrix-free LDI-MS for direct analysis of (a) a wastewater sample without pretreatment and (b) a filtered sample solution after performing CB adsorption. Note: m/z 281 and 331 were assigned as the characteristic peaks of PFOA. m/z 299, 349 and 399 were assigned as the characteristic peaks of PFOS. | ||
Conclusions
In this work, we developed a label-free LDI-MS method for monitoring and tracing the adsorption process of PFASs on CB. The new method exhibited a unique capability of simultaneous quantitative analysis of EC and OC, which is difficult to implement by traditional methods including organic mass spectrometry and optical methods. Considering the significance and ubiquity of EC and OC in diverse environmental matrices, this methodology provides a versatile tool for assessment of the environmental risks of multiple pollutants, and thus it is expected to play an important role in exposome analysis and relevant risk assessments.Author contributions
Q. Liu and K. Min designed the research; G. Jiang supervised the project; K. Min performed most of the experiments; S. Deng, Z. Shu and Y. Li helped with the sample preparation; B. Chen and M. Ma commented on the manuscript; K. Min and Q. Liu analyzed the data; K. Min and Q. Liu wrote the paper.Conflicts of interest
The authors declare no competing financial interest.Acknowledgements
This work was financially supported by the National Natural Science Foundation of China (No. 92143301, 21976194, 22188102, 21825403, 22106027) and the K. C. Wong Education Foundation of China (GJTD-2020-03).References
- Y. Wang, F. Liu, C. He, L. Bi, T. Cheng, Z. Wang, H. Zhang, X. Zhang, Z. Shi and W. S. Li, Fractal Dimensions and Mixing Structures of Soot Particles during Atmospheric Processing, Environ. Sci. Technol. Lett., 2017, 4, 487–493 CrossRef CAS.
- T. Liu, S. Jia, T. Kowalewski, K. Matyjaszewski, R. Casado-Portilla and J. Belmont, Water-Dispersible Carbon Black Nanocomposites Prepared by Surface-Initiated Atom Transfer Radical Polymerization in Protic Media, Macromolecules, 2006, 39, 548–556 CrossRef CAS.
- J. Peng, M. Hu, S. Guo, Z. Du, J. Zheng, D. Shang, M. Levy Zamora, L. Zeng, M. Shao, Y. S. Wu, J. Zheng, Y. Wang, C. R. Glen, D. R. Collins, M. J. Molina and R. Zhang, Markedly enhanced absorption and direct radiative forcing of black carbon under polluted urban environments, Proc. Natl. Acad. Sci. U. S. A., 2016, 113, 4266–4271 CrossRef CAS PubMed.
- Y. Jiang, J. Sun, C. Xiong, H. Liu, Y. Li, X. Wang and Z. Nie, Mass Spectrometry Imaging Reveals In Situ Behaviors of Multiple Components in Aerosol Particles, Angew. Chem., Int. Ed., 2021, 60, 23225–23231 CrossRef CAS PubMed.
- J. L. Edmondson, I. Stott, J. Potter, E. Lopez-Capel, D. A. C. Manning, K. J. Gaston and J. R. Leake, Black Carbon Contribution to Organic Carbon Stocks in Urban Soil, Environ. Sci. Technol., 2015, 49, 8339–8346 CrossRef CAS PubMed.
- R. S. Jacobson, A. R. Korte, A. Vertes and J. H. Miller, The Molecular Composition of Soot, Angew. Chem., Int. Ed., 2020, 132, 4514–4520 CrossRef.
- J. J. Heo, J. W. Lee, S. K. Kim and J. E. Oh, Foodstuff analyses show that seafood and water are major perfluoroalkyl acids (PFAAs) sources to humans in Korea, J. Hazard. Mater., 2014, 279, 402–409 CrossRef CAS PubMed.
- D. K. Essumang, A. Eshun, J. N. Hogarh, J. K. Bentum, J. K. Adjei, J. Negishi, S. Nakamichi, M. Habibullah-Al-Mamun and S. Masunaga, Perfluoroalkyl acids (PFAAs) in the Pra and Kakum River basins and associated tap water in Ghana, Sci. Total Environ., 2017, 579, 729–735 CrossRef CAS PubMed.
- Y. Shiwaku, P. Lee, P. Thepaksorn, B. Zheng, A. Koizumi and K. H. Harada, Spatial and temporal trends in perfluorooctanoic and perfluorohexanoic acid in well, surface, and tap water around a fluoropolymer plant in Osaka, Japan, Chemosphere, 2006, 164, 603–610 CrossRef PubMed.
- R. Guo, Q. Zhou, Y. Cai and G. Jiang, Determination of perfluorooctanesulfonate and perfluo-rooctanoic acid in sewage sludge samples using liquid chromatography/quadrupole time-of-flight mass spectrometry, Talanta, 2008, 75, 1394–1399 CrossRef CAS PubMed.
- T. B. Onasch, A. Trimborn, E. C. Fortner, J. T. Jayne, G. L. Kok, L. R. Williams, P. Davidovits and D. R. Worsnop, Soot Particle Aerosol Mass Spectrometer: Development, Validation, and Initial Application, Aerosol Sci. Technol., 2012, 46, 804–817 CrossRef CAS.
- L. Xu, D. Zhang and W. Li, Microscopic comparison of aerosol particles collected at an urban site in North China and a coastal site in Japan, Sci. Total Environ., 2019, 669, 948–954 CrossRef CAS PubMed.
- E. C. Fortner, W. A. Brooks, T. B. Onasch, M. R. Canagaratna, P. Massoli, J. T. Jayne, J. P. Franklin, W. B. Knighton, J. Wormhoudt, D. R. Worsnop, C. E. Kolb and S. C. Herndon, Particulate Emissions Measured During the TCEQ Comprehensive Flare Emission Study, Ind. Eng. Chem. Res., 2012, 51, 12586–12592 CrossRef CAS.
- G. Zhi, Y. Chen, J. Sun, L. Chen, W. Tian, J. Duan, G. Zhang, F. Chai, G. Sheng and J. Fu, Harmonizing Aerosol Carbon Measurements between Two Conventional Thermal/Optical Analysis Methods, Environ. Sci. Technol., 2011, 45, 2902–2908 CrossRef CAS PubMed.
- Y. Cheng, M. Zheng, K. He, Y. Chen, B. Yan, A. G. Russell, W. Shi, Z. Jiao, G. Sheng, J. Fu and E. S. Edgerton, Comparison of two thermal-optical methods for the determination of organic carbon and elemental carbon: Results from the southeastern United States, Atmos. Environ., 2011, 45, 1913–1918 CrossRef CAS.
- A. G. Paul, K. C. Jones and A. J. Sweetman, A First Global Production, Emission, And Environmental Inventory For Perfluorooctane Sulfonate, Environ. Sci. Technol., 2009, 43, 386–392 CrossRef CAS PubMed.
- A. B. Lindstrom, M. J. Strynar and E. Laurence Libelo, Polyfluorinated Compounds: Past, Present, and Future, Environ. Sci. Technol., 2011, 45, 7954–7961 CrossRef CAS PubMed.
- M. E. Andersen, J. L. Butenhoff, S. C. Chang, D. G. Farrar, G. L. Kennedy Jr, C. Lau, G. W. Olsen, J. Seed and K. B. Wallace, Perfluoroalkyl Acids and Related Chemistries- Toxicokinetics and Modes of Action, Toxicol. Sci., 2008, 102, 3–14 CrossRef CAS PubMed.
- J. P. Benskin, L. W. Y. Yeung, N. Yamashita, S. Taniyasu, P. K. S. Lam and J. W. Martin, Perfluorinated Acid Isomer Profiling in Water and Quantitative Assessment of Manufacturing Source, Environ. Sci. Technol., 2010, 44, 9049–9054 CrossRef CAS PubMed.
- J. Jian, Y. Guo, L. Zeng, L. Ying, X. Lu, F. Wang and E. Y. Zeng, Global distribution of perfluorochemicals (PFCs) in potential human exposure source A review, Environ. Int., 2017, 108, 51–62 CrossRef CAS PubMed.
- A. Morikawa, N. Kamei, K. Harada, K. Inoue, T. Yoshinaga, N. Saito and A. Koizumi, The bioconcentration factor of perfluorooctane sulfonate is significantly larger than that of perfluorooctanoate in wild turtles (Trachemys scripta elegans and Chinemys reevesii): An Ai river ecological study in Japan, Ecotoxicol. Environ. Saf., 2006, 65, 14–21 CrossRef CAS PubMed.
- F. Lian and B. Xing, Black Carbon (Biochar) In Water/Soil Environments: Molecular Structure, Sorption, Stability, and Potential Risk, Environ. Sci. Technol., 2017, 51, 13157–13532 Search PubMed.
- L. Ji, Y. Wan, S. Zheng and D. Zhu, Adsorption of Tetracycline and Sulfamethoxazole on Crop Residue-Derived Ashes: Implication for the Relative Importance of Black Carbon to Soil Sorption, Environ. Sci. Technol., 2011, 45, 5580–5586 CrossRef CAS PubMed.
- R. Lohmann, J. K. Macfarlane and P. M. Gschwend, Importance of Black Carbon to Sorption of Native PAHs, PCBs, and PCDDs in Boston and New York Harbor Sediments, Environ. Sci. Technol., 2005, 39, 141–148 CrossRef CAS PubMed.
- G. Cornelissen, O. Gustafsson, T. D. Bucheli, M. T. O. Jonker, A. A. Koelmans and P. C. M. Van Noort, Extensive Sorption of Organic Compounds to Black Carbon, Coal, and Kerogen in Sediments and Soils: Mechanisms and Consequences for Distribution, Bioaccumulation, and Biodegradation, Environ. Sci. Technol., 2005, 39, 6881–6895 CrossRef CAS PubMed.
- X. Huang, H. Liu, D. Lu, Y. Lin, J. Liu, Q. Liu, Z. Nie and G. Jiang, Mass spectrometry for multi-dimensional characterization of natural and synthetic materials at the nanoscale, Chem. Soc. Rev., 2021, 50, 5243–5280 RSC.
- Y. Jiang, J. Sun, X. Cao, H. Liu, C. Xiong and Z. Nie, Laser desorption/ionization mass spectrometry imaging-A new tool to see through nanoscale particles in biological systems, Chem.–Eur. J., 2022, 28, e202103710 CAS.
- L. F. G. Falco, C. F. O. R. Melo, D. N. de Oliveira, T. M. Guerreiro and R. R. Catharino, An LDI-MSI approach for targeted and untargeted differentiation and assessment of pharmaceutical formulations, Talanta, 2019, 197, 92–97 CrossRef CAS PubMed.
- Y. Lin, X. Huang, Y. Liu, D. Cao, D. Lu, Z. Feng, Q. Liu, Z. Lin and G. Jiang, Identification, Quantification, and Imaging of the Biodistribution of Soot Particles by Mass Spectral Fingerprinting, Anal. Chem., 2021, 93, 6665–6672 CrossRef CAS PubMed.
- K. Min, Y. Li, Y. Lin, X. Yang, Z. Chen, B. Chen, M. Ma, Q. Liu and G. Jiang, Mass Spectrometry Imaging Strategy for In Situ Quantification of Soot in Size-Segregated Air Samples, Anal. Chem., 2022, 94, 15189–15197 CrossRef CAS PubMed.
- H. Peng, D. Zhang, H. Li, C. Wang and B. Pan, Organic contaminants and carbon nanoparticles: sorption mechanisms and impact parameters, J. Zhejiang Univ., Sci., A, 2014, 15, 606–617 CrossRef CAS.
- X. Zhang, M. Kah, M. T. O. Jonker and T. Hofmann, Dispersion State and Humic Acids Concentration-Dependent Sorption of Pyrene to Carbon Nanotubes, Environ. Sci. Technol., 2012, 46, 7166–7173 CrossRef CAS PubMed.
- H. Hyung, J. D. Fortner, J. B. Hughes and J. H. Kim, Natural Organic Matter Stabilizes Carbon Nanotubes in the Aqueous Phase, Environ. Sci. Technol., 2007, 41, 179–184 CrossRef CAS PubMed.
- J. Liang, K. Min, P. Long, X. Weng, Q. Huang, B. Chen and M. Ma, Selective adsorption of flavonoids on cerium-doped ferroferric oxide magnetic particles, J. Chromatogr. A, 2021, 1648, 462189 CrossRef CAS PubMed.
- Z. Qi, T. P. Joshi, R. Liu, H. Liu and J. Qu, Synthesis of Ce(III)-doped Fe3O4 magnetic particles for efficient removal of antimony from aqueous solution, J. Hazard. Mater., 2017, 329, 193–204 CrossRef CAS PubMed.
- A. He, Y. Liang, F. Li, Y. Lu, C. Liu, J. Li, Z. Zhou, N. Zhu, C. Liao, Y. Wang and G. Jiang, Vital Environmental Sources for Multitudinous Fluorinated Chemicals: New Evidence from Industrial Byproducts in Multienvironmental Matrices in a Fluorochemical Manufactory, Environ. Sci. Technol., 2022, 56, 16789–16800 CrossRef CAS PubMed.
- S. Chen, H. Zheng, J. Wang, J. Hou, Q. He, H. Liu, C. Xiong, X. Kong and Z. Nie, Carbon Nanodots As a Matrix for the Analysis of Low-Molecular Weight Molecules in Both Positive- and Negative-Ion Matrix-Assisted Laser Desorption/Ionization Time-of-Flight Mass Spectrometry and Quantification of Glucose and Uric Acid in Real Samples, Anal. Chem., 2013, 85, 6646–6652 CrossRef CAS PubMed.
- H. Bové, C. Steuwe, E. Fron, E. Slenders, J. D'Haen, Y. Fujita, H. Uji-i, M. Vandeven, M. Roeffaers and M. Ameloot, Biocompatible Label-Free Detection of Carbon Black Particles by Femtosecond Pulsed Laser Microscopy, Nano Lett., 2016, 16, 3173–3178 CrossRef PubMed.
- S. Woodard, J. Berry and B. Newman, Ion exchange resin for PFAS removal and pilot test comparison to GAC, Remediation, 2017, 27, 19–27 CrossRef.
- E. Gagliano, M. Sgroi, P. P. Falciglia, F. G. A. Vagliasindi and P. Roccaro, Removal of poly- and perfluoroalkyl substances (PFAS) from water by adsorption: Role of PFAS chain length, effect of organic matter and challenges in adsorbent regeneration, Water Res., 2020, 171, 115381 CrossRef CAS PubMed.
- T. Mu, M. Park and K. Y. Kim, Energy-efficient removal of PFOA and PFOS in water using electrocoagulation with an air-cathode, Chemosphere, 2021, 281, 130956 CrossRef CAS PubMed.
- G. Liu, B. A. Stewart, K. Yuan, S. Ling, M. Zhang, G. Wang and K. Lin, Comprehensive adsorption behavior and mechanism of PFOA and PFCs in various subsurface systems in China, Sci. Total Environ., 2021, 794, 148463 CrossRef CAS PubMed.
- Y. Jia, J. Qian and B. Pan, Dual-Functionalized MIL-101(Cr) for the Selective Enrichment and Ultrasensitive Analysis of Trace Per- and Poly-fluoroalkyl Substances, Anal. Chem., 2021, 93, 11116–11122 CrossRef CAS PubMed.
- D. Lin and B. Xing, Tannic Acid Adsorption and Its Role for Stabilizing Carbon Nanotube Suspensions, Environ. Sci. Technol., 2008, 42, 5917–5923 CrossRef CAS PubMed.
- G. Chen, X. Shan, Y. Wang, Z. Pei, X. Shen, B. Wen and G. Owens, Effects of Copper, Lead, and Cadmium on the Sorption and Desorption of Atrazine onto and from Carbon Nanotubes, Environ. Sci. Technol., 2008, 42, 8297–8302 CrossRef CAS PubMed.
- A. Schierz and H. Zanker, Aqueous suspensions of carbon nanotubes: Surface oxidation, colloidal stability and uranium sorption, Environ. Pollut., 2009, 157, 1088–1094 CrossRef CAS PubMed.
- P. Wang and A. A. Keller, Adsorption of hydrophobic organic compounds onto a hydrophobic carbonaceous geosorbent in the presence of surfactants, Environ. Toxicol. Chem., 2008, 27, 1237–1243 CrossRef CAS PubMed.
Footnote |
| † Electronic supplementary information (ESI) available: Additional data (Fig. S1–S8 and Tables S1–S3). See DOI: https://doi.org/10.1039/d3em00129f |
| This journal is © The Royal Society of Chemistry 2023 |