
 Open Access Article
 This Open Access Article is licensed under a Creative Commons Attribution-Non Commercial 3.0 Unported Licence
Electron exchange capacity of pyrogenic dissolved organic matter (pyDOM): complementarity of square-wave voltammetry in DMSO and mediated chronoamperometry in water†
Han
Cao
 a,
Ania S.
Pavitt
b,
Jeffrey M.
Hudson
b,
Paul G.
Tratnyek
*b and
Wenqing
Xu
*a
a,
Ania S.
Pavitt
b,
Jeffrey M.
Hudson
b,
Paul G.
Tratnyek
*b and
Wenqing
Xu
*a
aDepartment of Civil and Environmental Engineering, Villanova University, Villanova, Pennsylvania 19085, USA. E-mail: wenqing.xu@villanova.edu; Tel: +1 610-519-8549
bOHSU/PSU School of Public Health, Oregon Health & Science University, 3181 SW Sam Jackson Park Road, Portland, OR 97239, USA. E-mail: tratnyek@ohsu.edu; Tel: +1 503-346-3431
First published on 9th March 2023
Abstract
Pyrogenic dissolved organic matter (pyDOM) is derived from black carbon, which is important in the global carbon cycle and other biogeochemical redox processes. The electron-exchange capacity (EEC) of pyDOM has been characterized in water using mediated chronoamperometry (MCA), which gives precise results under specific operational conditions, but the broader significance of these EECs is less clear. In this study, we described a novel but complementary electrochemical approach to quantify EECs of pyDOM without mediation using square-wave voltammetry (SWV) in dimethyl sulfoxide (DMSO). Using both the SWV and MCA methods, we determined EECs for 10 pyDOMs, 6 natural organic matter (NOM) samples, and 2 model quinones. The two methods gave similar EECs for model quinones, but SWV gave larger EECs than MCA for NOM and pyDOM (by several-fold and 1–2 orders of magnitude, respectively). The differences in the EECs obtained by SWV and MCA likely are due to multiple factors, including the potential range of electrons sampled, kinetics of electron transfer from (macro)molecular structures, and coupling of electron and proton transfer steps. Comparison of the results obtained by these two methods should provide new insights into important environmental processes such as carbon-cycling, wildfire recovery, and contaminant mitigation using carbon-based amendments.
Environmental significancePyrogenic dissolved organic matter (pyDOM) is a critical component of natural organic matter (NOM) and plays an important role in environmental biotic and abiotic processes. Characterizing the redox properties of pyDOM is an emerging challenge due to the increasing frequency of wildfires and their impact on water and soil quality. Mediated chronoamperometry (MCA) has been widely applied to quantify the electron-exchange capacities (EECs) of NOM/pyDOM under specific operational conditions, but the broader significance of these values is less clear. The complementary SWV method presented in this study enables qualitative redox characterization of NOM/pyDOM and quantitation of more general EECs. Our study provides insight into how EECs are influenced by operational parameters. The method also is versatile and may eventually be applied to characterization of other complex materials (e.g., microplastics and biological membranes). |
Introduction
Natural organic matter (NOM) plays an essential role in the biogeochemistry of natural waters, including the global carbon cycle.1–3 Pyrogenic carbonaceous matter (PCM) is the solid residue produced by pyrolysis of biomass or fossil fuels under oxygen-limited conditions,4,5 and includes naturally existing black carbon and its engineering analogs, such as activated carbon and biochar. Recently, studies have found that dissolved organic matter (DOM) can be released from PCM and subsequently enter the aquatic environment.6,7 This type of organic matter is referred to as pyrogenic dissolved organic matter, or pyDOM, hereafter.For this and most prior work, pyDOM is operationally defined as the fraction of organic carbon derived from PCM that passes through 0.45 μm filters.8,9 It is a heterogeneous mixture of diverse (macro)molecules with more oxygen content and polar functional groups, but lower aromaticity than unfractionated bulk char.10 Several studies suggest that pyDOM is highly mobile,9,11 thereby contributing approximately 10% of dissolved organic carbon in the riverine flux on a global scale.12 Given the large amount of PCM in nature (up to 45% of the total organic carbon in soil or sediment),13–15 the increased frequency of wildfires,16–18 and growing application of PCM in groundwater remediation,19–21 the occurrence of pyDOM in the environment is likely to become more significant.
Like NOM, pyDOM is redox-active and can participate in environmentally-relevant redox reactions.8,22–27 Past studies have employed a diverse set of methods to characterize various redox properties of PCM, pyDOM, and other NOM, including their redox potentials,28–31 electron transfer kinetics,32–35 and electron-exchange or -storage capacity (EEC or ESC).33,36–38 Most recent studies have focused on the EECs for NOM, which usually are obtained by combining measured values of electron-donating and -accepting capacities (EDC and EAC).39–42 To measure EDC and EAC, the most commonly used method involves mediated chronoamperometry (MCA; elsewhere called mediated electrochemical analysis, MEA33,36,37,39,43,44), which employs electron transfer mediators (ETMs) to facilitate the reversible shuttling of electrons between relatively less accessible redox-active sites of NOM (macro)molecules and the working electrode, and quantifies the resulting current by amperometry.
Prior to popularization of the MCA method, the determination of EECs of PCM and NOM in most work involved chemical redox titration (CRT) using various oxidants (e.g., O2 and I2) or reductants (e.g., H2S and TiIIIcitrate), while assuming a balanced stoichiometry of the overall half-reaction to final products.37,45–48 A recent example is the study by Prévoteau et al.,49 which exposed biochar samples to ferricyanide and reduced neutral red (NR), respectively, and determined EDC and EAC from the extent of ferricyanide oxidation or NR reduction quantified by cyclic voltammetry with a rotating disk electrode. The method used in their study is classified here as mediated hydrodynamic voltammetry (MHV). A major conclusion from the results they obtained by MHV was that the EDC values from previous MCA studies may be underestimated because the typical contact time between ETMs and chars is insufficient for complete equilibrium.49 More recently, Xin et al.37 compared CRT and MCA methods and also concluded that redox equilibrium between mediators (or titrants) and PCM can be difficult to achieve, which they ascribed to mass transfer limitations caused by the small pore size and high surface charge of the material. However, less equilibrium time was used by Xin et al. (72 hours) than Prévoteau et al. (60 days) and yet the EECs obtained by the former were significantly greater than values obtained by others using MCA, which suggests additional sources of variation in EEC measurements obtained by different methods.
The above methods are essentially potentiostatic in that they quantify electron exchange to/from mediators with a discrete potential to accept or donate electrons. These methods may approach equilibrium with sufficiently long contact time to overcome kinetic limitations, but they do not directly characterize the potential dependence of the process. In contrast, potentiodynamic methods measure current while sweeping across a range of applied potentials, which provides potential-resolved characterization of electron exchange, with varying degrees of kinetic vs. thermodynamic control depending on the scan rate. Sun et al.50 used potentiodynamic methods to measure electron transfer kinetics as well as EECs of PCMs coated onto working electrodes by cyclic voltammetry over a substantial potential window (1.5 V). However, despite direct contact between the PCM and the electrode, EEC values obtained with this method were significantly lower (by several orders of magnitude) than typical values obtained by MCA, which Sun et al. attributed to limited contact between the redox-active moieties in PCM and the working electrode surface.50
A significantly different approach for characterizing the redox properties of complex organic materials involves voltammetry performed in dimethyl sulfoxide (DMSO), which has been shown to provide well-defined voltammograms of NOM without ETMs.28,29,31 The improved voltammetric results obtained using DMSO as the medium have been attributed to its unique solvency, which favors unfolding of the tertiary structure of NOM (macro)molecules, thereby allowing more direct contact between redox-active moieties within the primary structure of the (macro)molecule and the electrode. Additionally, the aprotic character of DMSO should help to resolve individual electron transfer steps by stabilizing radical intermediates, which usually are not discernible in protic solvents like water.28,31,51,52 The net result of these factors is that both staircase cyclic voltammetry (SCV)28,29,53 and square-wave voltammetry (SWV) can produce well-resolved peaks for NOM.29,53 To date, however, studies using this approach have focused only on peak identification and potential quantification, so little analysis has been performed on the current data and there has been no attempt to use it for analysis of EECs.
In this study, we developed a method of using the current data obtained by SWV in DMSO to quantify EECs of pyDOM and NOM samples without mediation. The EEC values obtained by SWV in DMSO are compared with values quantified by MCA in water on the same samples. We also compared our results with data obtained from previous work on pyDOM, NOM, and chars where MCA, CRT, or MHV were employed. We explored whether these approaches of measuring EECs can be complementary in ways that could provide a more complete understanding of the redox activity of all forms of NOM. For example, the SWV method provides current resolved over the time course of the potential scan, which is limited by the kinetics of interfacial electron transfer and therefore might favor relatively labile (or fast) electrons over much larger potential scan range.46,54 By contrast, the MCA method represents equilibrium redox conditions between the mediator and the working electrode,33 and may capture both the labile and slow electrons, albeit over a narrower potential range. While the scope of this study is focused mainly on the development and validation of the SWV method for EEC measurement to compare with the MCA method, we also discussed some broader implications of this work to natural biogeochemical processes such as carbon-cycling, anthropogenically impacted processes such as wildfire recovery, and engineering processes such as contaminant mitigation by carbon-based amendments.
Methods
Chemicals
Sigma Aldrich (Milwaukee, MI): 2,2′-azino-bis(3-ethylbenzothiazoline-6-sulfonic acid) diammonium salt (ABTS, 98%), diquat dibromide monohydrate (DQ, analytical standard), dimethyl sulfoxide (DMSO, 99.9%), tetrabutylammonium hexafluorophosphate (TBAFP, ACS reagent grade), potassium chloride (KCl, 99%), potassium phosphate monobasic (KH2PO4, 99%), potassium phosphate dibasic (K2HPO4, 99%), 5-hydroxy-1,4-naphthoquinone (juglone, 97%), 1,2-naphthoquinone-4-sulfonic acid (o-NQS, 97%). VWR chemicals (Radnor, PA): L-ascorbic acid (ACS grade). Tokyo Chemical Industry (TCI, Tokyo, Japan): disodium anthraquinone-2,6-disulfonate (AQDS, 98%). All NOM samples used in this study, including each sample's source, elemental composition, and class are provided in Table S1.† Deionized (DI) water was further purified using a Milli-Q Biocel pure water system (≥18.2 MΩ cm at 25 °C; Millipore Sigma, St. Louis, MO, USA). All reagents were used without additional purification.Char preparation and characterization
Ten chars from two feedstocks (i.e., oak wood—Quercus; and switchgrass—Panicum vigartum) were pyrolyzed from 300 to 700 °C under oxygen-limited condition in a muffle furnace (Model 550–58, Fisher Scientific, USA) for 2 h. The chars were subsequently cooled, ground, and passed through a sieve (mesh no. 70, ASTM Standard Test Sieve, E-11 Specification) to obtain the desired fineness. The resulting chars were labelled WX and GX, where W and G represents wood or grass feedstock, respectively, and X indicates the pyrolysis temperature. The elemental analysis of chars was carried out by Galbraith Laboratories (Knoxville, TN) using a Flash 2000 Elemental Analyzer. The surface area of chars was characterized by N2 sorption (Autosorb-3B, Quantachrome Instruments). The pH of chars was determined in a homogeneous suspension by equilibrating the respective char with DI water at a solid-to-liquid ratio of 100 gchar L−1 following the American Society for Testing and Materials (ASTM) D3838-05 (Standard Test Method for pH of Activated Carbon; 2017). Key properties of chars, including elemental composition, atomic ratios, surface areas, and pH values were provided in Table S2.†PyDOM and NOM sample preparation and characterization
PyDOM samples were prepared similarly as our previous study with minor adjustment for consistency with the extraction method used to obtain pyDOM.27 Briefly, bulk char was suspended in 10 mM phosphate buffer solution (PBS; pH 7) at a solid-to-liquid ratio of 20 gchar L−1 in amber glass vials, followed by sonication for 5 minutes and placed on a horizontal rotator at 30 rpm in the dark at 25 °C. After 24 h, samples were centrifuged at 3500 rpm for 10 min. The supernatant was filtered through 0.45 μm PTFE filters (VWR, Radnor, PA) and abbreviated as pyDOMWX or pyDOMGX, respectively. For high temperature chars (i.e., W700 and G700), pyDOM samples were prepared at a solid-to-liquid ratio of 160 gchar L−1 to obtain sufficient mass of pyDOM for MCA analyses.The NOM samples were prepared similarly by dissolving NOM solid powder into 10 mM PBS. The chosen quantity of NOM for dissolution was based on availability of our inventory. The NOMs are abbreviated as ESHA for Elliott Soil humic acid, LHA for Leonardite humic acid, PPHA for Pahokee Peat fulvic acid, PPFA for Pahokee Peat humic acid, SRFA for Suwannee River fulvic acid, and SRNOM for Suwannee River natural organic matter, respectively. The non-purgeable organic carbon (NPOC) of all samples were determined using a TOC analyzer (TOC-L, Shimadzu, Japan).
The specific UV absorbance at 254 nm (SUVA254) and the ratio of absorbances at 254 and 365 nm (E2·E3−1) were calculated with the UV-vis spectra obtained from a UV-vis spectrophotometer (Hach, DR6000, Germany). Manganese (Mn) and iron (Fe) were analyzed with an inductively coupled plasma mass spectrometer (ICP-MS, Agilent 7900, USA). The results of NPOC, SUVA254, and E2·E3−1, and of total concentrations of Mn and Fe for pyDOM and NOM are summarized in Tables S3 and S4.†
SCV and SWV methods and calculations
All SCV and SWV measurements were made using a three-electrode setup as previously described,29 which included an assembled non-aqueous Ag/Ag+ reference electrode and coiled platinum wire counter electrode (BASi).55 All potentials measured in DMSO are reported vs. Ag/Ag+, as we have done in our previous work on NOM in DMSO.29 When necessary for comparisons, these values are converted to SHE using the calibration method we have developed and validated in previous work.29 Before each set of electrochemical measurements, the working electrode was polished using 0.5, 0.3, and 0.05 μm MicroPolish Alumina (Buehler) for 1 min, rinsed with DI water in between the three polishing steps, sonicated for 5 min after each polishing steps, and rinsed again with DI water.The electrochemical cell was prepared by adding 5 mL of 0.1 M TBAFP in DMSO and purging for 15 min with ultra-pure N2. The cell headspace was continuously purging during the experiments. After deaeration, a background scan was performed, and then 0.5 mL of the analyte stock solution was added (so the water to DMSO ratio was constant for all experiments). This resulted in a medium that was 10% water in DMSO, which could affect our results due to availability of protons to couple with electron transfer, diffusion of the analyte through the medium to the electrode surface, or dielectric properties of the solvent; however, our previous work has shown that modest changes in the water/DMSO ratio has little to no effect on current response from electrochemical measurements.29 The final concentration of the sample in the cell was 1.5 mM for model quinones and 1.0 g L−1 for the pyDOM or NOM samples.
All staircase cyclic voltammograms and square-wave voltammograms were obtained with a Metrohm Autolab PGSTAT30. The final selections included an amplitude of 25 mV (SWV), a step size of 2 mV (SWV and SCV), and a scan rate of 25 mV s−1 (SWV and SCV). The potential window used (−1.75 to +0.75 V) was chosen to be within the potential limits that caused steep current inclines due to non-faradaic processes.
Raw data were transferred to Igor Pro (Wavemetrics, Lake Oswego, OR), where the background scan (just DMSO electrolyte, without analyte) was subtracted from the sample data. Igor Pro's Multipeak fit tools were used to identify and fit Gaussian peaks with a constant baseline of zero current, using default parameters when possible. In some cases, individual peaks were defined and fit manually. Fitted peaks that extended outside the scanned potential range (−1.75 to +0.75 V) were excluded from subsequent analyses. Most of the analysis presented below was performed using the areas of the 1–2 major peaks only. Alternatively, we considered using the sum of areas for all the peaks fully enclosed within the scan range, but found that this approach gave less consistent calibration curves.
The peak areas (PAs) from the anodic and cathodic peaks (PASWVa and PASWVc) were calibrated using AQDS as a redox standard to obtain the measured Q (QSWVa and QSWVc) in moles of e− L−1. Then, normalizing QSWVa and QSWVc to non-purgeable organic carbon (NPOC, g L−1) of the sample gave EDC and EAC of SWV (denoted as EDCSWV and EACSWV hereinafter). In earlier experiments, EECs of samples were obtained from the sums of integrated PAs and were divided by the scan rate and Faraday constant (F = 96![[thin space (1/6-em)]](https://www.rsc.org/images/entities/char_2009.gif) 485 s A mole−−1) to obtain Q, which we refer to as the “Faraday method” (Text S1†). However, because our disk electrode only reacts with a small fraction of the redox-active species in the bulk solution, EEC values initially obtained were greatly underestimated compared to previous results.27,39 Therefore, we selected AQDS as redox standard due to its common use in electrochemical studies,28,56 while we recognize that its redox potential is not representative of the full range of redox moieties in NOM. All values of PA, Q, and EECs obtained by SWV are tabulated in Tables S5 or S6,† while the calculation, calibration, and validation details are provided in the ESI† (Text S1, Fig. S1, and Text S3, respectively).
485 s A mole−−1) to obtain Q, which we refer to as the “Faraday method” (Text S1†). However, because our disk electrode only reacts with a small fraction of the redox-active species in the bulk solution, EEC values initially obtained were greatly underestimated compared to previous results.27,39 Therefore, we selected AQDS as redox standard due to its common use in electrochemical studies,28,56 while we recognize that its redox potential is not representative of the full range of redox moieties in NOM. All values of PA, Q, and EECs obtained by SWV are tabulated in Tables S5 or S6,† while the calculation, calibration, and validation details are provided in the ESI† (Text S1, Fig. S1, and Text S3, respectively).
MCA methods and calculations
All MCA measurements were conducted in a glovebox (Coy Labs.) under anaerobic condition (N2 atmosphere; O2 < 1 ppm). Experiments were carried out in a 50 mL glassy carbon working electrode cylinder (Sigradur G, HTW, Germany), with a Ag/AgCl reference electrode containing 3 M KCl (BASi) and a counter electrode of a coiled platinum wire (BASi) in a compartment separated by a porous glass frit. A magnetic stir bar was used to ensure proper mixing during mediated electrochemical oxidation and reduction (MEO and MER) measurements. Unless otherwise stated, all potentials measured in aqueous solution are reported vs. standard hydrogen electrode (SHE).A buffer (0.1 M KCl and 0.1 M phosphate at pH 7) sufficiently purged with N2 was used for the preparation of all solutions used in MCA measurements, including mediators and redox standards. A CH Instruments 630C potentiostat (Austin, TX) was used to measure currents I (A) and control potentials E (V). We adopted the previously established MCA method39 to quantify the EDC and EAC, respectively. Specifically, the cylinder was filled with 20 mL of buffer. The potentiostat was operated in chronoamperometry mode with fixed reduction potentials measured against Ag/AgCl reference electrode but were reported relative to the standard hydrogen electrode (EH) (i.e., EH = +0.61 V and −0.49 V for MEO and MER, respectively).39 Subsequently, 5 mL of mediator (1 mM ABTS or DQ) was added into the cylinder, resulting in oxidative or reductive current peaks that correspond to one-electron oxidation of ABTS to ABTS˙+, or one-electron reduction of DQ2+ to DQ˙+, respectively.39 After the current peak returned to background currents (∼10−6 A; presumably reached redox equilibrium for ABTS/ABTS˙+ or DQ2+/DQ˙+), 100 μL of pyDOM or NOM was added to the cylinder and current response was measured by chronoamperometry. All samples were measured with duplicate injections.
The PA of each sample was integrated along the baseline using the built-in peak integration tool of the electrochemical station (CHI601e, version 18.04), and abbreviated as PAMEO and PAMER. Calibration curves with redox standards (ascorbate or AQDS) were implemented to allow for cross comparisons between MCA and SWV methods. Typically, the electron collection efficiency in a glassy carbon cylinder is close to 100%, so calibration usually is not needed. One notable exception is when MCA is performed with a flow-through injection system, which gives much lower (15%) collection efficiency due to the hydrodynamics of the electrochemical cell. In this case, a series of redox standard was required to calibrate the electrochemical detection of the DOM.27,44 Quantification by dividing values of PA by the Faraday constant (F = 96485 s A mole−−1) to obtain electrons transferred Q (in mole−) was also performed to validate the calibration approach. Our results suggest that the directly calculated Q values agreed well (<5% difference) with the Q values obtained from the calibration curves (Table S8†). Finally, values of Q (QMEO and QMER) were normalized by the quantity of NPOC that was added to the cell, which were abbreviated as EDCMCA and EACMCA, respectively. The details for calculations, method validation, calibration curves, and the values of PA, Q, and EECs obtained by MCA are provided in the ESI† (Texts S2, S3, Fig. S2, and Table S7).
Results
Qualitative analysis of pyDOM by SCV and SWV in DMSO
The voltammetric method for measuring EECs developed in this study was an extension of our previous work for characterizing redox potentials of NOM.28,29 Herein, we applied similar initial medium conditions with minor adjustments to optimize the compatibility with extracted pyDOM from chars based on preliminary results. Performing SWV on cathodic and anodic scans resulted in a combined dataset that is analogous to, yet more informative than, cyclic voltammetry. Examples of the results are summarized in Fig. 1, with the SCV at the top, SWV anodic scan (SWVa) in the middle, and SWV cathodic scan (SWVc) at the bottom of each panel (raw data from all samples is shown in Fig. S3–S5†). Comparing the data across the three panels in Fig. 1 shows that the results are qualitatively similar among LHA, pyDOMW400, and pyDOMG400. | ||
| Fig. 1 SCV (top), SWVa (middle), SWVc (bottom) of (A) pyDOMW400, (B) pyDOMG400 and (C) ESHA. SCV (3 scans) color change denotes passage of time (lightest to darkest). SWV components include forward, reverse, and net current. All data is background subtracted. Experiments performed in 0.1 m TBAFP in DMSO (5 mL DMSO and 0.5 mL spike of analyte in phosphate buffer at pH 7). Pt working electrode, Ag/Ag+ reference electrode, and Pt wire counter electrode were used for analysis. PyDOM concecntrations varied and are normalized to NPOC. Scan rate was 25 mV s−1, step size was 2 mV, and amplitude was 25 mV (SWV). | ||
The new results in this study are also qualitatively similar compared to those reported previously for a much wider variety of NOM (but not including pyDOM).29 Both SCV and SWV peaks generated by NOM and lower-temperature pyDOM samples were similar in character (i.e., located at potentials and/or electrochemically reversible) to current responses generated by model quinone compounds in our study,29 suggesting these moieties are primarily responsible for EEC in our samples (see below). Applying the scoring rubric we developed in that study for classifying the overall “featurefullness” of SCVs of NOM (see Fig. 4 , S5 and Table S6† in ref. 29) to the SCV data in this study for pyDOM shows a consistent trend of high scores (∼15) for pyDOM from lower temperature chars to low scores (∼5) for pyDOM samples from higher temperature chars. This trend toward less well-defined voltammetry with greater carbonization (or diagenesis, in the case of NOMs) of the source material is consistent with the meta-analysis of data from multiple methods and sources,29,57,58 and also illustrates the fingerprinting of overall electrochemical response that is possible with data from direct scanning (potentiodynamic) methods, but not with mediated (potentiostat) methods.39
The SCV data contains one continuous current response, where the SCV anodic scan corresponds to the SWVa, and the SCV cathodic scan corresponds to the SWVc. SCV was scanned for multiple cycles (usually three) to verify the stability of the electrode response (in some control experiments, we varied the order of the scans). Deviations among the cycles in SCV would arise if there were irreversible or other side reactions,59 but the three scans were quite consistent with only slightly higher current response at the beginning of the first pass with a few samples. The SCV data usually showed two well-resolved anodic peaks and three cathodic peaks, which are labeled in the top portion of each panel. The peaks labeled Epa1 and Epc2 form a pair consistent with a reversible redox couple, but the other three peaks (Epa2, Epc1, Epc3) are not paired, which suggests electrochemically irreversible reactions.
As we noted in previous work characterizing NOM,29 the additional resolution obtained by SWV can reveal characteristics of the electrode response that are not evident from SCV data. For example, in Fig. 1A, the SWVc shows a peak at −0.883 V (Epc2) that has forward and reverse components with almost identical potentials and a ratio of currents close to 1, thus confirming the reversibility suggested by the pairing of SCV anodic and cathodic peaks around −1 V. In contrast to the SWVc, the SWVa usually gave forward and reverse components that are both oxidative currents, which are not balanced by corresponding reductive currents (middle, red curves in Fig. 1A). This indicates that the anodic electrode reaction is not reversible, which would be difficult to discern from SCV data alone.
Quantitative analysis of SCV and SWV in DMSO vs. MCA in water
The peak potentials obtained in this study using SCV and SWV (in DMSO) are similar between pyDOM and NOM samples, and the peak potentials for all NOM measured in this study agree fairly well with those reported in our previous work.29 More important in the context of this study, however, is the current corresponding to individual peaks. These peaks were better defined in the data from SWV, compared with SCV, largely because SWV minimizes the contribution of non-faradaic processes to the electrode response.60 Three types of current were obtained from the SWV data: forward, reverse, and net current. Using the net currents (inet,a, inet,c) from SWVa and SWVc measured with the pyDOM samples, the background current (obtained without sample present) was subtracted, which resulted in peaks with nearly flat baselines. Then, these data were fit to obtain peak areas (PAs)—details on the fitting are in the methods section and ESI†—and examples of the fitting results are in Fig. S6 and S7.† We considered only peaks that are fully enclosed in our potential window (the multipeak fitting algorithm sometimes assigned peaks that were truncated at these boundaries). In some cases, we chose to treat closely overlapping Gaussian fits as part of a single electrochemical response, so they were combined manually. The resulting values of PASWVa and PASWVc that were used in further analysis were summarized in Table S6 and Fig. S8A.†In contrast to the SWV method, the data obtained by MCA include only one peak per analyte injection, but multiple injections were added to the glassy carbon working electrode cylinder, resulting in a series of peaks. Examples of the unprocessed data by MEO and MER with redox standards (i.e., ascorbate or AQDS), pyDOMW300, and LHA are shown in Fig. S2A and S2B.† All peak shapes are well-defined although some peak tailing was observed, which was greater in pyDOM and NOM samples than redox standards. This could arise if redox mediators require more time to access the more structurally complex (macro)molecules such as pyDOM and NOM than ascorbate or AQDS. Each peak was integrated (details provided in the method section and ESI†), and the obtained PAMEO and PAMER values are summarized in Table S7 and Fig. S8B.†
Calculation of EECs from SWV and MCA peak areas
The PAs obtained by SWV and MCA are not directly comparable for multiple reasons, including that they are in different units (A·V vs. A·s). Therefore, the PAs were directly applied to calibration curves to obtain the charge transferred (Q) (Texts S1 and S2†) and normalized by their NPOC to obtain EDC and EAC. The resulting EEC values for SWV and MCA are recorded in Tables S6 and S7,† respectively. The NPOC values used in these calculations are based on those of raw samples—which are given in Table S3† (together with other sample properties such as SUVA254)—and are summarized in Fig. S9.† Inspection of Fig. S9† confirms that the NPOC of pyDOM shows consistent values and trends with prior work (e.g., decreasing NPOC with increasing pyrolysis temperature61–64).The final values of all EECs obtained from 16 samples with both SWV and MCA are summarized in Fig. 2, with SWV in panel A and MCA in panel B. In contrast to the PA data (cf. Fig. S8†), the units on the EECs obtained by the two methods are equivalent (mmole− gC−1). However, the EECs obtain by SWV (EECSWV) are consistently greater than those obtained by MCA (EECMCA), so much so that the EECSWV data are presented on a log scale—to accommodate the wide range (∼3 orders of magnitude) of these values—whereas the EECMCA data could be plotted on a linear scale.
 | ||
| Fig. 2 The electron-donating and -accepting capacity (EDC and EAC) measured by (A) square-wave voltammetry (SWV) method and (B) mediated chronoamperometry (MCA) method. The lines and symbols in blue represent EDC, while the ones in red represent EAC. the error bars of EACMCA and EDCMCA were derived from duplicate injections of each sample. The pyDOM were derived from wood (Quercus) and grass (Panicum vigartum) biomass at different temperatures (300 to 700 °C), which were denoted as pyDOMWX and pyDOMGX, respectively. The W and G represents wood or grass feedstock, respectively, whereas X corresponds to the pyrolysis temperature. All the abbreviations for NOM are ESHA: Elliott Soil Humic Acid; LHA: Leonardite Humic Acid; PPHA: Pahokee Peat Humic Acid; PPFA: Pahokee Peat Fulvic acid; SRFA: Suwannee River Fulvic Acid; SRNOM: Suwannee River Natural Organic Matter. | ||
Closer inspection of Fig. 2A shows that both EDCSWV and EACSWV are generally greater for pyDOM compared to NOM samples, with the possible exceptions of ESHA and LHA, which gave intermediate values. Among the SWV results, pyDOMW700 gave greater EDCSWV and EACSWV values than other pyDOM samples. The MCA results in Fig. 2B show that EACMCA is consistently greater than EDCMCA for pyDOM, with a tendency toward even greater differences for the materials derived from intermediate temperatures. For NOM, individual values of EDCMCA and EACMCA vary, but the relative values of EDCMCA to EACMCA are greater for fulvic acids (i.e., PPFA, SRFA) and SRNOM, while less for humic acids (i.e., ESHA, LHA, and PPHA). Overall, our results are in line with a previous study showing higher EDC than EAC values for aquatic DOM (which the authors attributed to the relative abundance of phenolic moieties in fulvic acids), while terrestrial DOM typically showed lower EDC than EAC values, perhaps due to enrichment of aromaticity and quinones.43
Comparison of EECs for pyDOM and NOM across multiple studies
To provide a broader perspective on the EECs measured in this study, we compiled previously reported values for relevant materials and conditions24,25,27,43 and compared them with our data in Fig. 3 (in a format that is analogous but complementary to Fig. 2). All of the prior MCA studies were done using similar experimental conditions with minor variations in the method,39 therefore, those results should be quantitatively comparable to our MCA results in terms of their EDCs (Fig. 3A) and EACs (Fig. 3B). As observed between studies, the difference in EDC and EAC values is more significant in pyDOM (2–3 orders of magnitude) than in NOM samples. The overall EECMCA values of pyDOM in our study are comparable to two previous studies, where reported EEC values range from 1.2 to 7.9 mmole− gC−1,24,27 but are much higher than another study with values only up to 0.45 mmole− gC−1.25 | ||
| Fig. 3 Comparison of (A) electron-donating capacity (EDC) and (B) electron-accepting capacity (EAC) of pyDOMW, pyDOMG, and NOM between this study and prior work. The sample source and abbreviations are explained in the caption of Fig. 2. Data was adopted from Xu et al.,27 Zhang et al.,25 Zheng et al.,24 and Aeschbacher et al.43 | ||
Generally consistent trends between EDC and EAC values and pyrolysis temperatures were observed between studies, where the maximum values appeared at mid temperatures (i.e. 400–600 °C) for both EDCs and EACs. One exception was the EDC obtained from a study using MCA with a flow-injection cell (rather than the batch cell used in this in most other studies), where the highest values appeared at 300 °C.27 In contrast to pyDOM, the values of NOM samples are relatively consistent between this and previous studies.24,43 The difference in values for pyDOM could be attributed to the difference in source materials, pyrolysis temperature, and extraction protocols,10,61,62,64 which may influence the redox-active oxygenated moieties (e.g. phenol and quinones) in pyDOM samples.25,27 In contrast, the relatively consistent NOM values are likely due to the use of standardized materials from the same vendor (i.e., International Humic Substance Society (IHSS)) across studies.
Compared with the EECs obtained by MCA in Fig. 3, the values by SWV are consistently larger, but the discrepancy is less for NOM samples than pyDOM samples. For pyDOM samples, EDCSWV and EACSWV are greater than EDCMCA and EACMCA, respectively, by a factor up to ∼103, while the NOM samples showed much smaller variation (up to ∼50×). Discussion of the effect of DMSO, and other factors, on the SWV results is presented below.
Correlation analysis of EECs and other sample characteristics
Trends in EEC values shown in Fig. 2 and 3 can be further interpreted by plotting the data as correlations between paired independent variables (e.g., EDC vs. EAC) or dependent variables vs. a putative descriptor variable (e.g., EEC vs. SUVA254 or metal content). Fig. 4 shows the former, with EECs by SWV in panel A and MCA in panel B. The SWV data appear to give a strong linear correlation (r2 = 0.87) with a 1:1 slope, whereas the MCA data do not correlate. The lack of correlation among EECs by MCA is unsurprising given the nature and method of MEO and MER measurement, with one notable exception where a strong correlation was reported after controlled electrochemical (pre)oxidation/reduction of a sample (Fig. 4C in Walpen et al.).65 We propose that the strong correlation in Fig. 4A might suggest a similar effect, presumably because the SWV method involved multiple anodic and cathodic scans over a range of 2.5 V, which could result in electrochemical (pre)conditioning of the sample that is analogous to what was performed by Walpen et al.65 Closer inspection of the correlation in the SWV data also suggests that it is largely driven by the data from NOM, which highlights that the NOM samples likely contain an abundance of redox moieties that are more reversible than those in pyDOM samples. This hypothesis is further supported by our results from the multiple SCV and SWV scans that show reversible characteristics from peaks within all NOM samples (Fig. S5†), whereas the pyDOM samples, particularly those from higher pyrolysis temperatures, exhibit less featureful voltammograms (i.e., fewer and flatter peaks), indicating less reversible characteristics (Fig. S3 and S4†). Correlation analysis of EECs vs. other dependent variables is included in the ESI† (Text S4, and Fig. S10).
 | ||
Fig. 4 Correlation analysis between (A) EDCSWV and EACSWV and (B) EDCMCA and EACMCA. The blue circles ( ), red squares ( ), red squares ( ), and purple triangles ( ), and purple triangles ( ) represent pyDOMW, pyDOMG, and NOM samples, respectively. The dashed line represents the ratio of 1:1. The error bars of EACMCA and EDCMCA were derived from duplicate injections of each sample. The sample source and abbreviations are explained in the caption of Fig. 2. ) represent pyDOMW, pyDOMG, and NOM samples, respectively. The dashed line represents the ratio of 1:1. The error bars of EACMCA and EDCMCA were derived from duplicate injections of each sample. The sample source and abbreviations are explained in the caption of Fig. 2. | ||
Comparison of EECs of pyDOM vs. NOM vs. char
The correlation analysis in Fig. 4 is further extended to include literature data for char in Fig. 5. All EECs for char in previous publications were reported with units of mmole− gchar−1, which were converted to mmole− gC−1 using the elemental analysis results of chars to account for the carbon percentage (details are provided in Text S5†). To categorize the values and facilitate discussion, five regions were defined based on a combination of methodological considerations (i.e., method of measurement and type of material) and visual identification of clusters. Overall, the range of EECs for pyDOM, NOM, and char is almost 9 orders of magnitude (10−5 to 104 mmole− gC−1), although most of this range is due to a cluster of data with low EECs (Region 1) from one source50 and a cluster with high EECs (Region 5) from our SWV method. The data in Region 1 were obtained by integration of baseline-corrected cathodic peaks obtained by SCV performed without mediators over a potential range of approximately −0.2 to 0.8 V vs. SHE in pH 7 aqueous phosphate buffer.50 With respect to the electrochemical methodology and data fitting, this method is similar to the SWV method developed in this study, but without the benefits of DMSO. The authors of that study attributed their low values of EEC to limited interaction between the redox-active groups on the char surfaces and the electrode.50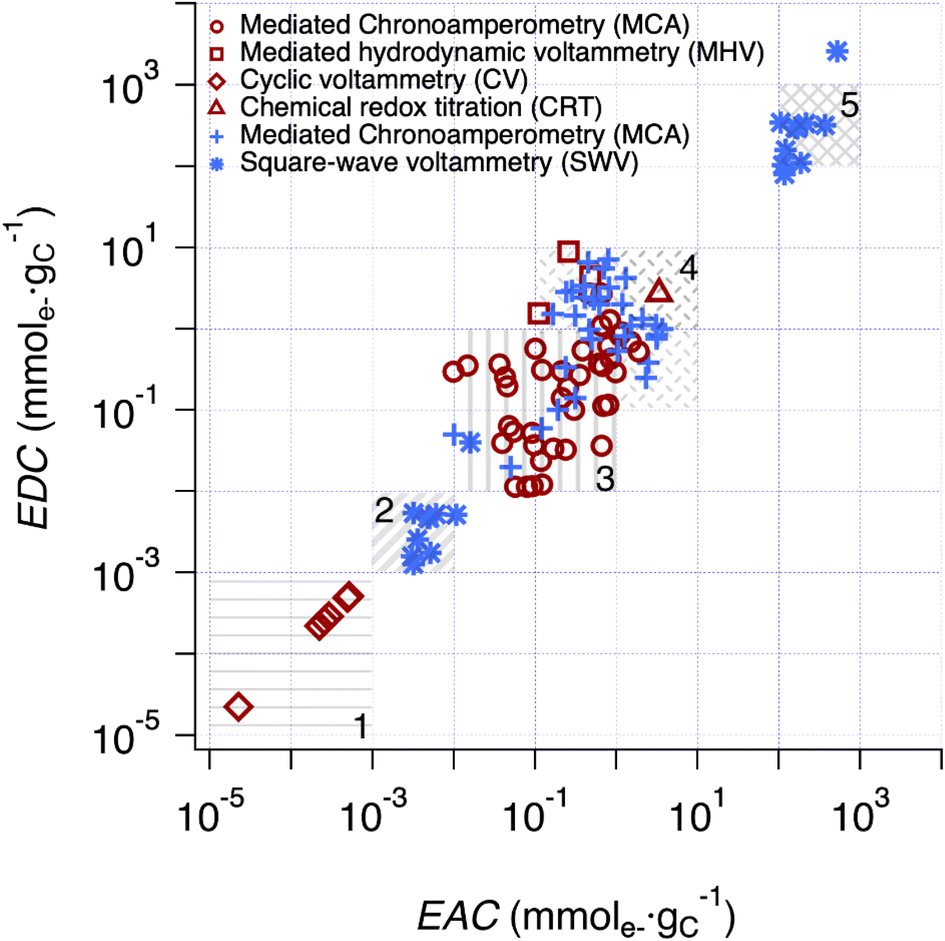 | ||
Fig. 5 Comparison of EDC and EAC values of chars and pyDOM samples between this study and prior work. The red enclosed symbols (i.e. , ,  , ,  and and  ) are the values derived from chars in previous studies,37,41,49,50,86–90 while the blue unenclosed symbols (i.e. ) are the values derived from chars in previous studies,37,41,49,50,86–90 while the blue unenclosed symbols (i.e. , ,  and and  ) are the values derived from pyDOM samples in previous studies24,25,27 and this study. Regions 2 and 5 are the SWV results from the same samples using faradaic and calibrated quantifications, respectively. Five regions were highlighted (i.e., Region 1 to 5) for categorization of the values. ) are the values derived from pyDOM samples in previous studies24,25,27 and this study. Regions 2 and 5 are the SWV results from the same samples using faradaic and calibrated quantifications, respectively. Five regions were highlighted (i.e., Region 1 to 5) for categorization of the values. | ||
Interestingly, preliminary results with our SWV method in DMSO without the use of a calibration curve (i.e., Faraday method, detailed in method section) also gave small EEC values for both pyDOM and NOM samples (Region 2) presumably also due to limited interaction between redox-active groups of these (macro)molecules and the electrode. The Faraday method showed mostly 1–3 orders of magnitude higher values (Table S5†) than those in Region 1, indicating that pyDOM might exhibit higher redox activity in DMSO than char in water. The EEC data obtained with methods utilizing ETMs (MCA) distribute in the middle of Fig. 5, with the data for chars (red markers) clustering at slightly lower EECs (Region 3) and the pyDOM data (blue markers) grouped at slightly higher values (Region 4). Despite the uniformity in the MCA method used for most of these measurements, the resulting EECs span about two orders of magnitude for each region, and about three orders of magnitude for Regions 3 and 4 combined. The data obtained with chars using MHV49 and CRT37 methods gave EECs that plot on the high end of Region 4, which is similar to values we obtained from pyDOM by MCA. The variations among results obtained from chars by MCA and those previously reported using MHV and CRT suggests that there is a different degree of access to redox-active sites across these methods.
Beyond the considerations given above, there still is considerable unexplained variability in the results shown in Fig. 5 (between and within the highlighted regions). Some of this is undoubtably due to method-independent factors, such as variation in sample composition (e.g., quinone content).43,65 However, other factors—such as the apparent effect of char source material,66 pyrolysis temperature,41 and particle size67—likely reflect a combination of sample and method factors that are difficult to resolve. In particular, the effectiveness of mediators will vary with physiochemical properties of sample (e.g., particle size, surface area, porosity, etc.), and these effects will further depend on mediator contact time, diffusivity, mixing rate, etc.67 For example, the relative high EDCs for chars obtained with MHV49 (red squares) and CRT37 (red triangles) compared with those by MCA (red circles) most likely reflects both the longer contact times used in the former studies (>24 h in CRT and >60 days in MHV) and the relatively slow kinetics of electron transfer with these relatively-complex materials. In the section below, a similar interpretation is given regarding the EECs by SWV, which occupy Region 5 in the upper-right corner of Fig. 5.
Discussion
Interpretation of the SWV method results
The SWV method described in this study differs from other methods in several ways that could give rise to fundamentally different EEC results.28,29 First, the higher solvency of DMSO (compared with water) should give better contact between the redox-active moieties of pyDOM (or NOM) and electrode surfaces by unfolding their tertiary structures. The magnitude of enhancement is expected to be greater for (macro)molecular samples (e.g., NOM) with more complex tertiary structures, while less significant with samples that are predominantly low-molecular weight materials and colloids that are not necessarily prone to “unfolding”. However, the ability of DMSO to solubilize materials such as char nano-particles (NPs) from bulk pyDOM could make them more electrode active in our SWV method. NPs make up 15% of bulk char mass,68 can be as small as 4 nm69 (resulting in high surface area and, therefore, reactivity70), and have been invoked to explain some aspects of EECs of pyDOM obtained by MCA in prior studies.71,72To investigate whether NPs associated with pyDOM contributed to the results we obtained with the SWV method, a set of experiments was performed using 0.02, 0.2, and 0.45 μm filters to obtain the pyDOMW700 fraction, followed by SWV analysis under the same conditions as prior experiments. No significant difference among the measured EECSWV values for different fractions of pyDOMW700 was observed; however, a possible role for NPs smaller than 20 nm cannot be ruled out from these experiments. We hypothesize that the smaller size of pyDOM compared to NOM—as evidenced by the higher E2·E3−1 values of pyDOM than NOM (Table S3†)—could facilitate more effective interaction between pyDOM and the working electrode, possibly contributing to the larger EECSWV values of pyDOM compared with NOM. Char NPs (presumably more abundant in pyDOM from high temperature chars such as pyDOMW700) could also deposit onto the working electrode and form a thin-layer of surface-complexes or surface coatings, which presumably would result in enhanced electrode response and thus contribute to the observed high EECSWV values of pyDOM than those of NOM and model quinones. Previously, we observed effects of spontaneously-deposited coatings of iron nanoparticles using chronopotentiometry.73
Another possible reason for the relatively large values of EECSWV involves stabilization of radical intermediates associated with the redox-active moieties of pyDOM in aprotic solvents like DMSO. It is known that pyDOM can contain persistent free radicals (PFRs), which can be detected over months.72,74 These radicals might be stabilized by DMSO,75 and then could be detected by the SWV method, which would result in higher EECSWV. While this effect is well known in organic electrochemistry for relatively-small and well-defined species,51,52,76 it is not yet clear what the overall effect of DMSO might be on EEC measurements by SWV for (macro)molecules like pyDOM and NOM. For example, a direct effect of DMSO stabilizing the radical intermediates might be to facilitate electron transfer processes that otherwise would be kinetically-controlled, which would result in higher EECSWV. If this effect is significant, it might contribute to the lower EECs obtained by methods that are less sensitive to PFRs (e.g., Boehm titration).66 Also, insofar as the EEC of NOMs involves proton-coupled electron transfer (PCET), this should be inhibited in aprotic solvents,77–79 although it is likely this effect is largely alleviated by 10% water present in this study. Furthermore, it is possible that the exceptionally high EECSWV of pyDOMW700 may arise from radicals associated with so-called “metal-mediated PFRs”,66 because that sample had a relatively high Mn content. However, this coupling between effects of PFRs and metal content on EECs is speculative and will require further study.
Environmental implications
The quantity and breadth of recent research on the redox properties of NOM reflects its importance in the transfer and storage of electrons in a variety of environmental processes,24–27,43,65 including natural biogeochemical processes such as the effects of wildfires—and (more generally) the effects of climate change on carbon cycling—as well as the fate or remediation of contaminants. With respect to the electron exchange and storage capacity of NOM, most analyses have been performed using MCA, but as the variety of MCA applications has grown, it has become increasingly clear that EECs are operationally defined properties that can vary with a wide range of factors, some of which are easily appreciated (e.g., variation in the chemical composition of NOM due it source and extraction method) while others are more subtle and more difficult to take into account (e.g., charge/discharge of the material's electron transfer capacity due to natural or artificial redox conditioning processes).In parallel with the growing use of MCA methods, there has been diversification in the range of alternative or complementary methods for characterization of EEC and related properties of environmental materials, including the MHV and CRT methods reviewed in this study, and the new SWV method reported here. Since EECs determined by all of these methods are operationally defined, a fundamental challenge facing this field is to reconcile the results obtained by the various methods, and to understand how the similarities and differences between them can be used to advance our understanding of biogeochemical processes involving redox active elements, NOM, and pyDOM. For example, the mediators used in methods of measuring EEC have specific redox potentials, which limits the spectrum of sensitivity to the full range of redox-active moieties in NOM (or NOM model compounds). To illustrate this, the redox ladder in Fig. S11† was constructed to show the potential ranges accessed by various methods against the formal potentials reported for various NOMs, model quinones (juglone, AQDS), metals (Fe, Mn), and mediators. Although the potentials covered by different mediator methods largely overlap, the sensitivities of the EEC measurement methods are likely to vary, and some environmentally-relevant redox-active moieties may be outside the range shown in Fig. S11† (e.g., the formal redox potentials for microbial respiration involving metals vary from −0.5 to +0.9 V,36 and redox potentials measured on similar soils can vary from −0.4 to +0.8 V depending on many factors.80,81).
Given that SWV measurements in DMSO are fast, sensitive, have high resolution, and cover a large potential range, the method can be a useful complement to other methods for characterizing EECs, such as MCA. The observation that both pyDOM and NOM exhibit significant EECs over the relatively wide range of potentials in SWV measurements is similar to conclusions from previous studies done with MCA36 and suggests that there is even more diversity in the redox chemistry of NOM than has been recognized to date. The strong correlation between EAC and EDC obtained with SWV (Fig. 4A) suggests that these values are “intrinsic” in that differences in the samples' initial conditions have been conditioned-out by the repeated potential scans. While neither method fully represents all of the relevant complexities of environmental conditions (e.g., micro- and macro-scopic redox gradients, oscillations in oxic–anoxic redox boundaries, heterogeneity in the composition and structure of aggregates, etc.), combinations of such methods should help provide a more complete understanding of the overall role of organic matter in environmental redox processes.
Finally, SWV in DMSO has some unique characteristics that might prove useful in characterization of EEC values in more diverse contexts. The method described in this work could be applied as a model system to understand the fundamental redox processes of pyDOM, NOM, and other complex organic materials such as natural products that are valued as antioxidants (e.g., green tea), microplastics, or their weathering products (which have very recently been shown to be redox-active with EEC).82 Also, for example, DMSO is widely used to mimic physiological lipophilic environments in biochemical and medical studies,83–85 so results from SWV measurements in DMSO could provide new insights into the role of EEC in biological systems or at interfaces between biological systems and the environment (e.g., biofilms).
Conflicts of interest
There are no conflicts to declare.Acknowledgements
This material is based on work supported by the Strategic Environmental Research and Development Program of the U.S. Department of Defense, award numbers ER19-1239 (Xu, PI) ER21-1235 (Tratnyek, PI). This manuscript has not been subject to review by SERDP and therefore does not necessarily reflect agency views and no official endorsements should be inferred.References
- H. Ogawa and E. Tanoue, Dissolved organic matter in oceanic waters, J. Oceanogr., 2003, 59, 129–147, DOI:10.1023/A:1025528919771.
- J. L. Tank, E. J. Rosi-Marshall, N. A. Griffiths, S. A. Entrekin and M. L. Stephen, A review of allochthonous organic matter dynamics and metabolism in streams, J. North Am. Benthol. Soc., 2010, 29, 118–146, DOI:10.1899/08-170.1.
- L. K. McDonough, M. S. Andersen, M. I. Behnke, H. Rutlidge, P. Oudone, K. Meredith, D. M. O'Carroll, I. R. Santos, C. E. Marjo, R. G. M. Spencer, A. M. McKenna and A. Baker, A new conceptual framework for the transformation of groundwater dissolved organic matter, Nat. Commun., 2022, 13, 2153, DOI:10.1038/s41467-022-29711-9.
- J. Pignatello, W. A. Mitch and W. Xu, Activity and reactivity of pyrogenic carbonaceous matter toward organic compounds, Environ. Sci. Technol., 2017, 51, 8893–8908, DOI:10.1021/acs.est.7b01088.
- W. Xu, M. L. Segall and Z. Li, Reactivity of Pyrogenic Carbonaceous Matter (PCM) in mediating environmental reactions: Current knowledge and future trends, Front. Environ. Sci. Eng., 2020, 14, 86, DOI:10.1007/s11783-020-1265-6.
- A. I. Coppola, M. Seidel, N. D. Ward, D. Viviroli, G. S. Nascimento, N. Haghipour, B. N. Revels, S. Abiven, M. W. Jones, J. E. Richey, T. I. Eglinton, T. Dittmar and M. W. I. Schmidt, Marked isotopic variability within and between the Amazon River and marine dissolved black carbon pools, Nat. Commun., 2019, 10, 4018, DOI:10.1038/s41467-019-11543-9.
- A. I. Coppola, D. B. Wiedemeier, V. Galy, N. Haghipour, U. M. Hanke, G. S. Nascimento, M. Usman, T. M. Blattmann, M. Reisser, C. V. Freymond, M. Zhao, B. Voss, L. Wacker, E. Schefuß, B. Peucker-Ehrenbrink, S. Abiven, M. W. I. Schmidt and T. I. Eglinton, Global-scale evidence for the refractory nature of riverine black carbon, Nat. Geosci., 2018, 11, 584–588, DOI:10.1038/s41561-018-0159-8.
- H. Fu, H. Liu, J. Mao, W. Chu, Q. Li, P. J. J. Alvarez, X. Qu and D. Zhu, Photochemistry of dissolved black carbon released from biochar: Reactive oxygen species generation and phototransformation, Environ. Sci. Technol., 2016, 50, 1218–1226, DOI:10.1021/acs.est.5b04314.
- H. Bao, J. Niggemann, L. Luo, T. Dittmar and S.-J. Kao, Aerosols as a source of dissolved black carbon to the ocean, Nat. Commun., 2017, 8, 510, DOI:10.1038/s41467-017-00437-3.
- X. Qu, H. Fu, J. Mao, Y. Ran, D. Zhang and D. Zhu, Chemical and structural properties of dissolved black carbon released from biochars, Carbon, 2016, 96, 759–767, DOI:10.1016/j.carbon.2015.09.106.
- J. Major, J. Lehmann, M. Rondon and C. Goodale, Fate of soil-applied black carbon: downward migration, leaching and soil respiration, Glob. Change Biol. Bioenergy, 2010, 16, 1366–1379, DOI:10.1111/j.1365-2486.2009.02044.x.
- R. Jaffé, Y. Ding, J. Niggemann, A. V. Vähätalo, A. Stubbins, R. G. M. Spencer, J. Campbell and T. Dittmar, Global charcoal mobilization from soils via dissolution and riverine transport to the oceans, Science, 2013, 340, 345–347, DOI:10.1126/science.1231476.
- J. J. Middelburg, J. Nieuwenhuize and P. van Breugel, Black carbon in marine sediments, Mar. Chem., 1999, 65, 245–252, DOI:10.1016/S0304-4203(99)00005-5.
- M. Uchimiya, S. Hiradate and M. J. Antal, Influence of carbonization methods on the aromaticity of pyrogenic dissolved organic carbon, Energy Fuels, 2015, 29, 2503–2513, DOI:10.1021/acs.energyfuels.5b00146.
- G. Cornelissen, Ö. Gustafsson, T. D. Bucheli, M. T. Jonker, A. A. Koelmans and P. C. van Noort, Extensive sorption of organic compounds to black carbon, coal, and kerogen in sediments and soils: mechanisms and consequences for distribution, bioaccumulation, and biodegradation, Environ. Sci. Technol., 2005, 39, 6881–6895, DOI:10.1021/es050191b.
- M. A. Moritz, E. Batllori, R. A. Bradstock, A. M. Gill, J. Handmer, P. F. Hessburg, J. Leonard, S. McCaffrey, D. C. Odion, T. Schoennagel and A. D. Syphard, Learning to coexist with wildfire, Nature, 2014, 515, 58–66, DOI:10.1038/nature13946.
- M. D. Hurteau, A. L. Westerling, C. Wiedinmyer and B. P. Bryant, Projected effects of climate and development on California wildfire emissions through 2100, Environ. Sci. Technol., 2014, 48, 2298–2304, DOI:10.1021/es4050133.
- A. I. Coppola, S. Wagner, S. T. Lennartz, M. Seidel, N. D. Ward, T. Dittmar, C. Santín and M. W. Jones, The black carbon cycle and its role in the Earth system, Nat. Rev. Earth Environ., 2022, 3, 516–532, DOI:10.1038/s43017-022-00316-6.
- D. Fan, E. J. Gilbert and T. Fox, Current state of in situ subsurface remediation by activated carbon-based amendments, J. Environ. Manage., 2017, 204, 793–803, DOI:10.1016/j.jenvman.2017.02.014.
- X. Zheng, W. Xu, J. Dong, T. Yang, Z. Shangguan, J. Qu, X. Li and X. Tan, The effects of biochar and its applications in the microbial remediation of contaminated soil: A review, J. Hazard. Mater., 2022, 438, 129557, DOI:10.1016/j.jhazmat.2022.129557.
- S. Yin, C. Wei and D. Zhu, Surface quinone-induced formation of aqueous reactive sulfur species controls pine wood biochar-mediated reductive dechlorination of hexachloroethane by sulfide, Environ. Sci.: Processes Impacts, 2020, 22, 1898–1907, 10.1039/D0EM00307G.
- H.-B. Kim, J.-G. Kim, J.-H. Choi, E. E. Kwon and K. Baek, Photo-induced redox coupling of dissolved organic matter and iron in biochars and soil system: Enhanced mobility of arsenic, Sci. Total Environ., 2019, 689, 1037–1043, DOI:10.1016/j.scitotenv.2019.06.478.
- X. Dong, L. Q. Ma, J. Gress, W. Harris and Y. Li, Enhanced Cr(VI) reduction and As(III) oxidation in ice phase: Important role of dissolved organic matter from biochar, J. Hazard. Mater., 2014, 267, 62–70, DOI:10.1016/j.jhazmat.2013.12.027.
- X. Zheng, Y. Liu, H. Fu, X. Qu, M. Yan, S. Zhang and D. Zhu, Comparing electron donating/accepting capacities (EDC/EAC) between crop residue-derived dissolved black carbon and standard humic substances, Sci. Total Environ., 2019, 673, 29–35, DOI:10.1016/j.scitotenv.2019.04.022.
- B. Zhang, S. Zhou, L. Zhou, J. Wen and Y. Yuan, Pyrolysis temperature-dependent electron transfer capacities of dissolved organic matters derived from wheat straw biochar, Sci. Total Environ., 2019, 696, 133895, DOI:10.1016/j.scitotenv.2019.133895.
- M. Wang, J. Liu, L. Peng, S. Tian, C. Yang, G. Xu, D. Wang and T. Jiang, Estimation of the biogeochemical reactivities of dissolved organic matter from modified biochars using color, Sci. Total Environ., 2021, 790, 147974, DOI:10.1016/j.scitotenv.2021.147974.
- W. Xu, N. Walpen, M. Keiluweit, M. Kleber and M. Sander, Redox Properties of Pyrogenic Dissolved Organic Matter (pyDOM) from Biomass-Derived Chars, Environ. Sci. Technol., 2021, 55, 11434–11444, DOI:10.1021/acs.est.1c02429.
- J. T. Nurmi and P. G. Tratnyek, Electrochemical properties of natural organic matter (NOM), fractions of NOM, and model biogeochemical electron shuttles, Environ. Sci. Technol., 2002, 36, 617–624, DOI:10.1021/es0110731.
- A. S. Pavitt and P. G. Tratnyek, Electrochemical characterization of natural organic matter by direct voltammetry in an aprotic solvent, Environ. Sci.: Processes Impacts, 2019, 21, 1664–1683, 10.1039/C9EM00313D.
- M. Aeschbacher, D. Vergari, R. P. Schwarzenbach and M. Sander, Electrochemical Analysis of Proton and Electron Transfer Equilibria of the Reducible Moieties in Humic Acids, Environ. Sci. Technol., 2011, 45, 8385–8394, DOI:10.1021/es201981g.
- J. T. Nurmi and P. G. Tratnyek, Electrochemistry of Natural Organic Matter, in Aquatic Redox Chemistry, eds P. G. Tratnyek, T. J. Grundl and S. B. Haderlein, American Chemical Society, Washington, DC, 2011, vol. 1071, ch. 7, pp. 129–151 Search PubMed.
- A. L. Hoving, M. Sander, C. Bruggeman and T. Behrends, Redox properties of clay-rich sediments as assessed by mediated electrochemical analysis: separating pyrite, siderite and structural Fe in clay minerals, Chem. Geol., 2017, 457, 149–161, DOI:10.1016/j.chemgeo.2017.03.022.
- M. Sander, T. B. Hofstetter and C. A. Gorski, Electrochemical analyses of redox-active iron minerals: a review of nonmediated and mediated approaches, Environ. Sci. Technol., 2015, 49, 5862–5878, DOI:10.1021/acs.est.5b00006.
- M. Aeppli, R. Kaegi, R. Kretzschmar, A. Voegelin, T. B. Hofstetter and M. Sander, Electrochemical Analysis of Changes in Iron Oxide Reducibility during Abiotic Ferrihydrite Transformation into Goethite and Magnetite, Environ. Sci. Technol., 2019, 53, 3568–3578, DOI:10.1021/acs.est.8b07190.
- M. Aeppli, A. Voegelin, C. A. Gorski, T. B. Hofstetter and M. Sander, Mediated Electrochemical Reduction of Iron (Oxyhydr-)Oxides under Defined Thermodynamic Boundary Conditions, Environ. Sci. Technol., 2018, 52, 560–570, DOI:10.1021/acs.est.7b04411.
- L. Klüpfel, A. Piepenbrock, A. Kappler and M. Sander, Humic substances as fully regenerable electron acceptors in recurrently anoxic environments, Nat. Geosci., 2014, 7, 195–200, DOI:10.1038/ngeo2084.
- D. Xin, M. Xian and P. C. Chiu, New methods for assessing electron storage capacity and redox reversibility of biochar, Chemosphere, 2019, 215, 827–834, DOI:10.1016/j.chemosphere.2018.10.080.
- J. M. Saquing, Y.-H. Yu and P. C. Chiu, Wood-derived black carbon (biochar) as a microbial electron donor and acceptor, Environ. Sci. Technol. Lett., 2016, 3, 62–66, DOI:10.1021/acs.estlett.5b00354.
- M. Aeschbacher, M. Sander and R. P. Schwarzenbach, Novel electrochemical approach to assess the redox properties of humic substances, Environ. Sci. Technol., 2010, 44, 87–93 CrossRef CAS PubMed.
- C. A. Gorski, M. Aeschbacher, D. Soltermann, A. Voegelin, B. Baeyens, M. Marques Fernandes, T. B. Hofstetter and M. Sander, Redox properties of structural Fe in clay minerals. 1. Electrochemical quantification of electron-donating and-accepting capacities of smectites, Environ. Sci. Technol., 2012, 46, 9360–9368, DOI:10.1021/es3020138.
- L. Klüpfel, M. Keiluweit, M. Kleber and M. Sander, Redox properties of plant biomass-derived black carbon (biochar), Environ. Sci. Technol., 2014, 48, 5601–5611, DOI:10.1021/es500906d.
- G. C. Wallace, M. Sander, Y.-P. Chin and W. A. Arnold, Quantifying the electron donating capacities of sulfide and dissolved organic matter in sediment pore waters of wetlands, Environ. Sci.: Processes Impacts, 2017, 19, 758–767, 10.1039/C7EM00060J.
- M. Aeschbacher, C. Graf, R. P. Schwarzenbach and M. Sander, Antioxidant properties of humic substances, Environ. Sci. Technol., 2012, 46, 4916–4925, DOI:10.1021/es300039h.
- N. Walpen, M. H. Schroth and M. Sander, Quantification of phenolic antioxidant moieties in dissolved organic matter by Flow-Injection Analysis with electrochemical detection, Environ. Sci. Technol., 2016, 50, 6423–6432, DOI:10.1021/acs.est.6b01120.
- Z. Struyk and G. Sposito, Redox properties of standard humic acids, Geoderma, 2001, 102, 329–346, DOI:10.1016/S0016-7061(01)00040-4.
- M. Bauer, T. Heitmann, D. L. Macalady and C. Blodau, Electron Transfer Capacities and Reaction Kinetics of Peat Dissolved Organic Matter, Environ. Sci. Technol., 2007, 41, 139–145, DOI:10.1021/es061323j.
- T. Heitmann, T. Goldhammer, J. Beer and C. Blodau, Electron transfer of dissolved organic matter and its potential significance for anaerobic respiration in a northern bog, Glob. Change Biol. Bioenergy, 2007, 13, 1771–1785, DOI:10.1111/j.1365-2486.2007.01382.x.
- Z.-G. Yu, S. Peiffer, J. Göttlicher and K.-H. Knorr, Electron transfer budgets and kinetics of abiotic oxidation and incorporation of aqueous sulfide by dissolved organic matter, Environ. Sci. Technol., 2015, 49, 5441–5449, DOI:10.1021/es505531u.
- A. Prévoteau, F. Ronsse, I. Cid, P. Boeckx and K. Rabaey, The electron donating capacity of biochar is dramatically underestimated, Sci. Rep., 2016, 6, 32870, DOI:10.1038/srep32870.
- T. Sun, B. D. A. Levin, J. J. L. Guzman, A. Enders, D. A. Muller, L. T. Angenent and J. Lehmann, Rapid electron transfer by the carbon matrix in natural pyrogenic carbon, Nat. Commun., 2017, 8, 14873, DOI:10.1038/ncomms14873.
- D. T. Sawyer and J. L. Roberts, Electrochemistry of oxygen and superoxide ion in dimethylsulfoxide at platinum, gold and mercury electrodes, J. Electroanal. Chem., 1966, 12(2), 90–101, DOI:10.1016/0022-0728(66)80021-9.
- A. Abou Dalle, L. Domergue, F. Fourcade, A. A. Assadi, H. Djelal, T. Lendormi, I. Soutrel, S. Taha and A. Amrane, Efficiency of DMSO as hydroxyl radical probe in an electrochemical advanced oxidation process − reactive oxygen species monitoring and impact of the current density, Electrochim. Acta, 2017, 246, 1–8, DOI:10.1016/j.electacta.2017.06.024.
- J. T. Nurmi and P. G. Tratnyek, Voltammetric investigations of natural organic matter, Proceedings of the 20th Anniversary Conference of the International Humic Substances Conference, IHSS, 2002, pp. 58–60 Search PubMed.
- T. Jiang, J. Kaal, J. Liu, J. Liang, Y. Zhang and D. Wang, Linking the electron donation capacity to the molecular composition of soil dissolved organic matter from the Three Gorges Reservoir areas, China, J. Environ. Sci., 2020, 90, 146–156, DOI:10.1016/j.jes.2019.11.007.
- J. N. Butler, Electrochemistry in dimethyl sulfoxide, J. Electroanal. Chem. Interfacial Electrochem., 1967, 14, 89–116, DOI:10.1016/0022-0728(67)80136-0.
- P. G. Tratnyek and D. L. Macalady, Abiotic reduction of nitro aromatic pesticides in anaerobic laboratory systems, J. Agric. Food Chem., 1989, 37, 248–254, DOI:10.1021/jf00085a058.
- S. Kim, R. W. Kramer and P. G. Hatcher, Graphical Method for Analysis of Ultrahigh-Resolution Broadband Mass Spectra of Natural Organic Matter, the Van Krevelen Diagram, Anal. Chem., 2003, 75, 5336–5344, DOI:10.1021/ac034415p.
- R. L. Sleighter and P. G. Hatcher, The application of electrospray ionization coupled to ultrahigh resolution mass spectrometry for the molecular characterization of natural organic matter, J. Mass Spectrom., 2007, 42, 559–574, DOI:10.1002/jms.1221.
- A. S. Pavitt, E. J. Bylaska and P. G. Tratnyek, Oxidation potentials of phenols and anilines: correlation analysis of electrochemical and theoretical values, Environ. Sci.: Processes Impacts, 2017, 19, 339–349, 10.1039/C6EM00694A.
- A. J. Bard and L. R. Faulkner, Electrochemical Methods: Fundamentals and Applications, John Wiley & Sons, 2nd edn, 2001, ISBN: 978-0-471-04372-0 Search PubMed.
- S. Wei, M. Zhu, X. Fan, J. Song, K. Li, W. Jia and H. Song, Influence of pyrolysis temperature and feedstock on carbon fractions of biochar produced from pyrolysis of rice straw, pine wood, pig manure and sewage sludge, Chemosphere, 2019, 218, 624–631, DOI:10.1016/j.chemosphere.2018.11.177.
- A. S. Wozniak, A. I. Goranov, S. Mitra, K. W. Bostick, A. R. Zimmerman, D. R. Schlesinger, S. Myneni and P. G. Hatcher, Molecular heterogeneity in pyrogenic dissolved organic matter from a thermal series of oak and grass chars, Org. Geochem., 2020, 148, 104065, DOI:10.1016/j.orggeochem.2020.104065.
- M. Uchimiya, T. Ohno and Z. He, Pyrolysis temperature-dependent release of dissolved organic carbon from plant, manure, and biorefinery wastes, J. Anal. Appl. Pyrolysis, 2013, 104, 84–94, DOI:10.1016/j.jaap.2013.09.003.
- C.-H. Liu, W. Chu, H. Li, S. A. Boyd, B. J. Teppen, J. Mao, J. Lehmann and W. Zhang, Quantification and characterization of dissolved organic carbon from biochars, Geoderma, 2019, 335, 161–169, DOI:10.1016/j.geoderma.2018.08.019.
- N. Walpen, G. J. Getzinger, M. H. Schroth and M. Sander, Electron-donating phenolic and electron-accepting quinone moieties in peat dissolved organic matter: quantities and redox transformations in the context of peat biogeochemistry, Environ. Sci. Technol., 2018, 52, 5236–5245, DOI:10.1021/acs.est.8b00594.
- J. Yuan, Y. Wen, D. D. Dionysiou, V. K. Sharma and X. Ma, Biochar as a novel carbon-negative electron source and mediator: electron exchange capacity (EEC) and environmentally persistent free radicals (EPFRs): a review, Chem. Eng. J., 2022, 429, 132313, DOI:10.1016/j.cej.2021.132313.
- D. Xin, N. Saha, M. T. Reza, J. Hudson and P. C. Chiu, Pyrolysis creates electron storage capacity of black carbon (biochar) from lignocellulosic biomass, ACS Sustainable Chem. Eng., 2021, 9, 6821–6831, DOI:10.1021/acssuschemeng.1c01251.
- B. Song, M. Chen, L. Zhao, H. Qiu and X. Cao, Physicochemical property and colloidal stability of micron- and nano-particle biochar derived from a variety of feedstock sources, Sci. Total Environ., 2019, 661, 685–695, DOI:10.1016/j.scitotenv.2019.01.193.
- F. Guo, L. Bao, H. Wang, S. L. Larson, J. H. Ballard, H. M. Knotek-Smith, Q. Zhang, Y. Su, X. Wang and F. Han, A simple method for the synthesis of biochar nanodots using hydrothermal reactor, MethodsX, 2020, 7, 101022, DOI:10.1016/j.mex.2020.101022.
- B. Song, X. Cao, W. Gao, S. Aziz, S. Gao, C.-H. Lam and R. Lin, Preparation of nano-biochar from conventional biorefineries for high-value applications, Renewable Sustainable Energy Rev., 2022, 157, 112057, DOI:10.1016/j.rser.2021.112057.
- G. Liu, H. Zheng, Z. Jiang, J. Zhao, Z. Wang, B. Pan and B. Xing, Formation and physicochemical characteristics of nano biochar: insight into chemical and colloidal stability, Environ. Sci. Technol., 2018, 52, 10369–10379, DOI:10.1021/acs.est.8b01481.
- F. Lian, W. Yu, Q. Zhou, S. Gu, Z. Wang and B. Xing, Size matters: nano-biochar triggers decomposition and transformation inhibition of antibiotic resistance genes in aqueous environments, Environ. Sci. Technol., 2020, 54, 8821–8829, DOI:10.1021/acs.est.0c02227.
- Z. Shi, J. T. Nurmi and P. G. Tratnyek, Effects of nano zero-valent iron on oxidation−reduction potential, Environ. Sci. Technol., 2011, 45, 1586–1592, DOI:10.1021/es103185t.
- H. Jia, S. Zhao, G. Nulaji, K. Tao, F. Wang, V. K. Sharma and C. Wang, Environmentally Persistent Free Radicals in Soils of Past Coking Sites: Distribution and Stabilization, Environ. Sci. Technol., 2017, 51, 6000–6008, DOI:10.1021/acs.est.7b00599.
- N.-Y. Yang, Z.-L. Li, L. Ye, B. Tan and X.-Y. Liu, Organic base-catalysed solvent-tuned chemoselective carbotrifluoromethylation and oxytrifluoromethylation of unactivated alkenes, Chem. Commun., 2016, 52, 9052–9055, 10.1039/C6CC00364H.
- W. Si, X. Zhang, N. Asao, Y. Yamamoto and T. Jin, Ni-Catalyzed direct 1,4-difunctionalization of [60]fullerene with benzyl bromides, Chem. Commun., 2015, 51, 6392–6394, 10.1039/C5CC01534K.
- S. L. J. Tan, M. L. Novianti and R. D. Webster, Effects of Low to Intermediate Water Concentrations on Proton-Coupled Electron Transfer (PCET) Reactions of Flavins in Aprotic Solvents and a Comparison with the PCET Reactions of Quinones, J. Phys. Chem. B, 2015, 119, 14053–14064, DOI:10.1021/acs.jpcb.5b07534.
- D. R. Weinberg, C. J. Gagliardi, J. F. Hull, C. F. Murphy, C. A. Kent, B. C. Westlake, A. Paul, D. H. Ess, D. G. McCafferty and T. J. Meyer, Proton-Coupled Electron Transfer, Chem. Rev., 2012, 112, 4016–4093, DOI:10.1021/cr200177j.
- C. Costentin, Electrochemical Approach to the Mechanistic Study of Proton-Coupled Electron Transfer, Chem. Rev., 2008, 108, 2145–2179, DOI:10.1021/cr068065t.
- J. Schüring, H. D. Schulz, W. R. Fischer, J. Böttcher and W. H. Duijnisveld, Redox: Fundamentals, Processes and Applications, Springer Science & Business Media, 2000, ISBN: 978-3-662-04080-5 Search PubMed.
- T. Sun, J. J. L. Guzman, J. D. Seward, A. Enders, J. B. Yavitt, J. Lehmann and L. T. Angenent, Suppressing peatland methane production by electron snorkeling through pyrogenic carbon in controlled laboratory incubations, Nat. Commun., 2021, 12, 4119, DOI:10.1038/s41467-021-24350-y.
- L. Chen, D. Wang, T. Sun, T. Fan, S. Wu, G. Fang, M. Yang and D. Zhou, Quantification of the redox properties of microplastics and their effect on arsenite oxidation, Fundam. Res., 2022 DOI:10.1016/j.fmre.2022.03.015.
- A. Doménech-Carbó, G. Cebrián-Torrejón, N. Montoya, N. Ueberschaar, M. T. Scotti, Z. Benfodda and C. Hertweck, Electrochemical monitoring of ROS generation by anticancer agents: the case of chartreusin, RSC Adv., 2017, 7, 45200–45210, 10.1039/C7RA08238J.
- X.-P. Zhang, W.-L. Jiang, S.-H. Cao, H.-J. Sun, X.-Q. You, S.-H. Cai, J.-L. Wang, C.-S. Zhao, X. Wang, Z. Chen and S.-G. Sun, NMR spectroelectrochemistry in studies of hydroquinone oxidation by polyaniline thin films, Electrochim. Acta, 2018, 273, 300–306, DOI:10.1016/j.electacta.2018.04.048.
- M. Hayyan, M. A. Hashim and I. M. AlNashef, Superoxide Ion: Generation and Chemical Implications, Chem. Rev., 2016, 116, 3029–3085, DOI:10.1021/acs.chemrev.5b00407.
- F. J. Chacón, M. A. Sánchez-Monedero, L. Lezama and M. L. Cayuela, Enhancing biochar redox properties through feedstock selection, metal preloading and post-pyrolysis treatments, Chem. Eng. J., 2020, 395, 125100, DOI:10.1016/j.cej.2020.125100.
- H. Wang, H.-P. Zhao and L. Zhu, Role of pyrogenic carbon in parallel microbial reduction of nitrobenzene in the liquid and sorbed phases, Environ. Sci. Technol., 2020, 54, 8760–8769, DOI:10.1021/acs.est.0c01061.
- S. Li, L. Shao, H. Zhang, P. He and F. Lü, Quantifying the contributions of surface area and redox-active moieties to electron exchange capacities of biochar, J. Hazard. Mater., 2020, 394, 122541, DOI:10.1016/j.jhazmat.2020.122541.
- Y. Zhang, X. Xu, L. Cao, Y. S. Ok and X. Cao, Characterization and quantification of electron donating capacity and its structure dependence in biochar derived from three waste biomasses, Chemosphere, 2018, 211, 1073–1081, DOI:10.1016/j.chemosphere.2018.08.033.
- Y. Zhang, X. Xu, P. Zhang, Z. Ling, H. Qiu and X. Cao, Pyrolysis-temperature depended quinone and carbonyl groups as the electron accepting sites in barley grass derived biochar, Chemosphere, 2019, 232, 273–280, DOI:10.1016/j.chemosphere.2019.05.225.
Footnote |
| † Electronic supplementary information (ESI) available. See DOI: https://doi.org/10.1039/d3em00009e |
| This journal is © The Royal Society of Chemistry 2023 |