Emerging investigator series: an instrument to measure and speciate the total reactive nitrogen budget indoors: description and field measurements†
Received
2nd November 2022
, Accepted 23rd January 2023
First published on 26th January 2023
Abstract
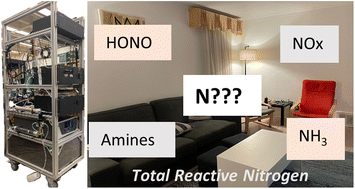
Reactive nitrogen species (Nr), defined here as all N-containing compounds except N2 and N2O, have been shown to be important drivers for indoor air quality. Key Nr species include NOx (NO + NO2), HONO and NH3, which are known to have detrimental health effects. In addition, other Nr species that are not traditionally measured may be important chemical actors for indoor transformations (e.g. amines). Cooking and cleaning are significant sources of Nr, whose emission will vary depending on the type of activity and materials used. Here we present a novel instrument that measures the total gas-phase reactive nitrogen (tNr) budget and key species NOx, HONO, and NH3 to demonstrate its suitability for indoor air quality applications. The tNr levels were measured using a custom-built heated platinum (Pt) catalytic furnace to convert all Nr species to NOx, called the tNr oven. The measurement approach was validated through a series of control experiments, such that quantitative measurement and speciation of the total Nr budget are demonstrated. The optimum operating conditions of the tNr oven were found to be 800 °C with a sampling flow rate of 630 cubic centimetres per minute (ccm). Oxidized nitrogen species are known to be quantitatively converted under these conditions. Here, the efficiency of the tNr oven to convert reduced Nr species to NOx was found to reach a maximum at 800 °C, with 103 ± 13% conversion for NH3 and 79–106% for selected relevant amines. The observed variability in the conversion efficiency of reduced Nr species demonstrates the importance of catalyst temperature characterization for the tNr oven. The instrument was deployed successfully in a commercial kitchen, a complex indoor environment with periods of rapidly changing levels, and shown to be able to reliably measure the tNr budget during periods of longer-lived oscillations (>20 min), typical of indoor spaces. The measured NOx, HONO and basic Nr (NH3 and amines) were unable to account for all the measured tNr, pointing to a substantial missing fraction (on average 18%) in the kitchen. Overall, the tNr instrument will allow for detailed survey(s) of the key gaseous Nr species across multiple locations and may also identify missing Nr fractions, making this platform capable of stimulating more in-depth analysis in indoor atmospheres.
Environmental significance
Indoor air is increasingly being recognized as being chemically complex, and our understanding of the chemical process driving poor indoor air quality is lacking. People and their activities emit a range of compounds that affect indoor air quality, and thus there is a need for new tools that can perform detailed chemical measurements yet remain unobtrusive for occupant exposure assessments. Here we describe a novel instrument to address an existing gap for reactive nitrogen species, a key driver of indoor air quality, that will allow for more detailed and widely conducted surveys of indoor environments. This approach may identify overlooked nitrogenous species of importance, leading to more rapidly improved indoor air quality outcomes.
|
1 Introduction
Reactive nitrogen species (Nr) are here defined as all atmospheric nitrogen compounds except for N2 and N2O. In the gas phase, this includes nitrogen oxides (NO + NO2, collectively referred to as NOx) as well as the reservoir species of NOx (NOz; NO3 + N2O5 + HONO + HNO3 + peroxy and alkyl nitrates (e.g. RONO2)). Collectively, the sum of NOx and NOz species is referred to as NOy. Note that while HCN, NH3 and amines (e.g. trimethyl amine) are generally not considered as NOy species as they are not NOx reservoirs, they are considered as Nr due to their chemical reactivity in the atmosphere.1–3 Nr can also be found in the particle phase and include organic and inorganic nitrogen species, such as ammonium nitrate (NH4NO3). Outdoors, Nr plays a significant role in atmospheric chemistry, radiative balance, air quality, and nitrogen deposition in both terrestrial and aquatic ecosystems.4–8
While ammonium (NH4+) and nitrate (NO3−) are important for aerosol chemistry outdoors, indoors the concentration of these species in the particle phase is typically very low, with the majority of airborne particles organic.9,10 For example, Omelekhina et al.10 in a residential home observed very low NH4+ and NO3− particle levels, at 0.3 and 0.2 μg m−3, or 2% of the total PM1 (15 μg m−3) mass loading, respectively. The levels of airborne particles indoors are typically lower compared to outdoors, due to physical losses such as deposition on surfaces and filtration in building ventilation systems.11,12 The emissions of particle-bound nitrogen containing organic compounds (e.g. heterocyclic aromatic amines) have been observed during meat cooking,13,14 and as such these could be important short-lived considerations for indoor air quality during such activities. The levels of particle-phase NH4+ and NO3−, in contrast, are further depleted relative to other aerosol components (e.g., SO42−) owing to their higher volatility and as such undergo thermodynamically driven partitioning to the gas phase or redistribution onto indoor surfaces.12,15 Overall, these results suggest that indoors the contribution of traditional particle bound Nr species to the total budget is likely transient, generally small, and in some cases may be negligible. In contrast, gas-phase Nr species have been shown to be important drivers for indoor air quality, with key species including NOx, HONO and NH3, which are all known to have detrimental health effects and are chemically reactive. Consequently, the focus in the current work is on the gas-phase fraction of all indoor Nr species.
Concentrations indoors of many key gas-phase Nr species – known to control outdoor chemistry and secondary pollutant levels – can exceed outdoor levels by several orders of magnitude, driven by direct sources and surface reservoirs.16 Surface reservoirs play a key role in controlling the levels of reactive species indoors. The surface area to volume ratio indoors is much higher than outdoors, making many species that would be considered volatile under typical outdoor conditions exhibit semi-volatile characteristics indoors.17 For example, gases like HONO and NH3 participate in dynamic surface-gas partitioning and multi-phase chemistry on surfaces, which are governed in part by room ventilation rates and also the chemistry of the surfaces.18,19
Direct indoor sources of Nr include combustion, such as gas stoves or candle burning, which emit significant quantities of NOx and HONO.18 There are several direct sources of NH3 indoors, including smoking, building materials, cooking and cleaning. Humans, from breath and dermal emissions, can be one of the more significant sources of indoor NH3 (ref. 20 and references therein). The emissions of nitrogen containing volatile organic compounds (VOCs) have been observed during protein cooking in oil,14 during cleaning21–23 and from building materials (carpet and drywall).24 Cleaning and cooking emissions are perhaps the most variable of direct sources indoors, as they depend on the type of activity and materials used. Emissions from cooking depend in part on the type of food, with meat cooking a known source of NH3 thought to be derived from the breakdown of amino acids,19 while fish cooking can emit amines.25,26 Emissions also vary by the cooking method, as demonstrated by the recent HOMEChem campaign.27 For example, combustion cooking methods (gas stove and oven) emitted elevated levels of HONO and NOx, compared to cooking on an electric hot plate.18 Cleaning emissions depend on the active ingredient in a given cleaning product, which can include NH3, vinegar (i.e. dilute HCOOH/HCOO−) or bleach (i.e. dilute HOCl/OCl−). Cleaning emissions can include direct volatilization of the active ingredient or can drive the partitioning of basic and acidic species (e.g. NH3 and HONO) from surfaces by changing the pH of surface reservoirs.17,18 Cleaning with HOCl can facilitate reactions with NH3 to form toxic chloramines in surprisingly significant quantities. The quantification of chloramines remains problematic, but it is likely that they are present in cleaning-impacted indoor air in the ppbv range.21,22,28 There may be other Nr species, such as amines in both the gas and particle phases that are not traditionally measured outdoors due to analytical challenges from very low concentrations,29,30 that may be important chemical actors for indoor transformations. Given the potential for stronger sources and novel chemistry, understanding the total budget of gas-phase Nr species indoors will further our understanding of chemistry in such spaces, which are as varied as the humans that use them.
An established and robust method for quantifying Nr species is by thermal and catalytic conversion at high temperatures. The Nr is converted to primarily NO along with small amounts of NO2, with subsequent measurement using a chemiluminescent NOx analyser (see e.g., ref. 31–33). This method can be applied for the quantitative conversion of both gas- and particle-phase Nr species, with near unity conversion efficiency demonstrated.31,33 Commercial instruments exist that utilise this approach, primarily for speciating NH3 and NOx (e.g., Thermo Scientific 17i). Examples of total Nr budget measurements previously in the literature include during controlled burn laboratory experiments,3 agricultural fluxes33,34 and near forests.35 Overall, the catalytic conversion of Nr species in both gas and condensed phases for measurement by using a NOx chemiluminescent analyser has been successfully applied for quantitatively determining the total Nr budget in ambient outdoor settings.
The current state of instrumentation to measure the Nr budget was developed for outdoor research, which is not always suitable for indoor measurements, due to instrumentation size, cost and/or containing hazardous components. To avoid these issues, passive samplers and denuders have been previously used for indoor measurements of many key Nr species.36–39 While allowing for large-scale deployment to conduct society-wide surveys, the time response of these offline methods is often lengthy (i.e. hours to days). Many key Nr species have lifetimes on the order of 100–1000 seconds and depending on air exchange rates (e.g. NH3 and HONO), meaning that an instrument with high time resolution is required to capture the temporal variability of such moderately lived species.40 New instrumentation is needed to bring the capabilities of outdoor instrumentation indoors to obtain an accurate determination of the emissions and transformations of Nr species. This is paramount as surveys require indoor environments to be used as they normally would be by occupants.41 The instrument deployed in indoor environments must also be unobtrusive for occupants with respect to noise (e.g. vacuum pumps), basic concerns around physical hazards (e.g. tripping and heat), and advanced safety considerations (e.g. no hazardous reagents/waste).
Here we describe a high time resolution instrument to measure and speciate the total gas-phase Nr budget and demonstrate its suitability for indoor air quality applications. The instrument is validated by a series of positive and negative control experiments designed to evaluate the time response of the instrument with respect to key indoor Nr gas-phase species, namely NO, NO2, HONO and basic Nr-species including NH3 and amines. The ability of the instrument to quantitatively convert reduced Nr species (e.g., NH3 and amines) to NOx allows their quantitative measurement by using a NOx analyser. Within this demonstration, key controlling factors are identified and optimized. To demonstrate the capability of the instruments in the field, proof-of-concept measurements in a commercial kitchen are presented. The highly dynamic nature of emissions and sinks in this environment provides a robust test of the instrument capabilities to measure the total Nr and the acidic and basic fractions of its constituent species at high time resolution, with the first indoor total Nr budget analysis presented.
2 Methods
2.1 Instrument description
This instrument was designed to measure the total Nr (henceforth denoted as tNr) budget and the contribution of key reactive nitrogen species, pooled by chemical classes of acids, bases, and neutral species through selective scrubbing. A schematic overview of the instrument is provided in Fig. 1, with the detailed description provided in the following sections. Briefly, Fig. 1 indicates the different measurement pathways for determining the different Nr species prior to detection using a chemiluminescent NOx analyser. The instrument has one sample inlet, which is then directed via one of two pathways. The first is for NOx and the second for the tNr measurement. The direction of the flow is controlled via 3-way solenoid valves, which are operated automatically with a microcontroller. The NOx pathway enables the measurement of NOx and acidic Nr species (e.g., HONO and HNO3) by difference, via selective scrubbing with a sodium carbonate (Na2CO3) coated annular denuder. For the tNr measurement, an air sample is directed to the furnace containing a pure platinum (Pt) mesh that facilitates the catalytic conversion of all Nr species to NOx. Selective scrubbing in this pathway uses a denuder coated with phosphorous acid (H3PO3) prior to the furnace to allow for the determination of the levels of basic Nr species (e.g., NH3 and amines). This fraction is calculated by difference compared to the tNr measurement. Flows of calibration gases (e.g., HONO and NH3) from their sources prior to entering the tNr instrument are also controlled at the main sampling inlet. All the components shown in Fig. 1 are housed in a standard 19′′ rack, with a complete description available in Section S1 (ESI†).
|
| Fig. 1 Schematic flow diagram of the measurement pathways in the tNr instrument. The different colours indicate the species or tNr fraction selection points, described in detail in Table 1. Briefly, air enters the instrument through a filter and is directed via the NOx (pink) or tNr (red) measurement pathway, to be measured by the NOx analyser. Acids (purple) or bases (orange) are scrubbed with annular denuders. Green arrows indicate the flow of calibrations gases from the in situ sources to the inlet. The flow of the gases can be directed by the three-way solenoid valves by entering either the normally open (NO) or the nominally closed (NC) ports and exit through the common (COM) port. | |
2.1.2 NOx measurement.
A commercially available chemiluminescent NOx analyser (Serinus 40, American Ecotech, Warren, RI) was employed to measure NO, NO2 and NOx. The manufacturer stated that the limit of detection for the NOx analyser is 0.4 ppbv with a response time of 15 seconds to reach 90% of the maximum signal with a total sample flow of 0.63 standard litres per minute (slpm),42 with the analyser precision during proof-of-concept measurements presented later. This NOx analyser has two channels: one where the air sample is passed over a Mo catalyst to convert NO2 to NO yielding a measure of NOx (=NO + NO2) and one that bypasses the catalyst to measure NO only. This NOx analyser uses a heated molybdenum (Mo) convertor (325 °C), known to convert other NOy species to NO (i.e. HNO3, HONO, N2O5, HO2NO2, peroxyacetyl nitrate (PAN), NO3 and organic nitrates43,44) in addition to NO2. The conversion of NOy species on the Mo catalyst will vary between analysers, with our previous work demonstrating that this analyser has unity conversion for HONO.45 The detection limit of HONO was determined experimentally by flushing the system with zero air and propagating the uncertainty in each of the NOx and NO channels, which were determined to be 0.53 and 0.5 ppbv, respectively. These are slightly higher than noted by the manufacturer and will result from the extensive use of the instrumentation. Since the difference between these two channels determines NO2, the calculated HONO detection limit that results is 0.73 ppbv at one minute time resolution. The NOx analyser was calibrated regularly. Prior to the proof-of-concept measurements a full calibration was performed using a gas-calibration unit (Gascal 1100TS, American Ecotech, Warren, RI), a standard gas cylinder of NO (Praxair, NI NO5MC-A3, 4.88 (±5%) ppmv, Toronto, ON), and gas-phase titration of NO to NO2 with ozone (O3).
2.1.3 Measurement of the total reactive nitrogen (tNr) budget.
To measure the tNr budget, we used a custom-built heated Pt catalyst to convert the total Nr species to NOx, as described in detail by Stockwell et al.31 Briefly, the Pt catalyst (99.9% Pt gauze mesh, 100 gauge, 1.7 g, 18 cm2, Sigma Aldrich) is packed within quartz tubing (0.5 inch OD) to maximise the surface area over a 10 cm length inside the tube, and heated to 800 °C. Stockwell et al.31 demonstrated that a similar heated Pt catalyst (750 °C) can convert both gas-phase and particle-bound Nr species quantitatively to NOx. Here, we focus only on gas-phase Nr species, as this is the primary focus for indoor measurements. To remove airborne particles a 47 mm polytetrafluoroethylene (PTFE) filter was installed at the inlet and was replaced regularly (weekly) during field measurements to limit off-gassing of semi-volatile particle-bound Nr (e.g., NH4NO3). Throughout the remainder of this work, we refer to this component of the instrument as the tNr oven.
2.1.4 Reactive nitrogen speciation by differential measurement.
The instrument utilises four alternating pathways to selectively measure different Nr species (Fig. 1). The NOx analyser measures NO and NO2 and total gas-phase Nr (Nr,gas) from the oven by their sum, while chemically selected Nr species are measured by difference through selective scrubbing with coated annular denuders (Fig. 1 and Table 1). Acidic Nr species (Nr,acid), which are primarily HONO and HNO3 in the gas-phase indoors, were scrubbed using a Na2CO3 coating.46 The Na2CO3 denuder was prepared according to the EPA Compendium Method IO-4.247 to remove atmospheric acids by reactive uptake to the basic coating. This scrubbing technique has been previously applied for indoor sampling and quantification of HONO.46 Quantitative conversion of HONO and HNO3 to NO occurs on the Mo catalyst of the NOx analyser. Consequently, the measured NO2 from an air sample passed through the Na2CO3 denuder will decrease proportionally to the amount of HONO and HNO3 present.
Table 1 Overview of calculations for the different Nr species
Species |
Species measured |
Calculation |
Fig. 1 pathway |
Eqn |
NO and |
NO & |
Ambient NOx, NO2 and NO |
Pink (NOx) |
|
NO2 |
NO2 |
Measured NO2 after the Na2CO3 denuder |
Purple (Na2CO3 denuder) |
|
Acidic Nr (Nr,acid) |
HONO & HNO3 |
|
Pink (NOx)–purple (Na2CO3 denuder) |
(1)
|
Gas-phase total Nr (tNr,gas) |
NOx, HONO, NH3, amines, N2O5, other NOz |
Measured NOx after the tNr oven |
Red (tNr oven) |
|
Basic Nr (Nr,base) |
NH3 and amines |
Measured NOx after the H3PO3 denuder and tNr oven |
Red (tNr oven)–orange (H3PO3 denuder) |
(2)
|
Therefore, the Nr,acid mixing ratio can be determined by difference according to eqn (1):
| | (1) |
where
is the sum of NO
2 and N
r,acid species, and NO
2 is the correctly measured mixing ratio. Since HNO
3 mixing ratios are expected to be small indoors (
e.g. low pptv range
48–50), we expect that the N
r,acid measurement can be equated to HONO with a high level of confidence. In addition, measured NO
2 through the denuder will be closer to the true level of NO
2, as NO
z species that pass through the denuder and are converted by the Mo catalyst (
e.g. alkyl nitrates) are also thought to be low indoors.
51,52
Gas-phase basic Nr species (Nr,base) were also selectively scrubbed, but using a denuder coated in H3PO339 (Fig. 1). On this instrument, these species can only be measured after conversion to NOx in the tNr oven. The mixing ratio of Nr,base was determined by difference between tNr,gas and tNr,scrubbed with the H3PO3 denuder according to eqn (2):
| Nr,base = tNr,gas − tNr,scrubbed | (2) |
In the indoor environment, NH3 is expected to be the dominant species in Nr,base based on prior reports, but will also include contributions from other basic Nr compounds such as amines. In the indoor environment, typical amines include monomethylamine (MMA), dimethylamine (DMA), trimethylamine (TMA), monoethylamine (MEA), diethylamine (DEA) and triethylamine (TEA).53,54 An example time series of raw NOx measurements for a single 20 minute duty cycle is shown in Fig. S2 (ESI†).
2.1.5
In situ calibration source for HONO and NH3.
A custom-built calibration source of HONO and NH3 was installed on the instrument to allow regular in situ tests of the denuder scrubbing efficacy and the conversion efficiencies of the two analytes on the catalyst to ensure that the Na2CO3 and H3PO3 denuders are working optimally. When the denuder scrubbing efficacy was found to be not optimal (<95%), it indicates that replacement with newly coated denuders is required, simultaneously flagging the portion of the dataset where acidic or basic measurements may be biased or compromised. The gaseous NH3 calibration source, generated using a permeation device (PD) and thermostated oven, was used to ensure that the conversion efficiency of the Pt catalyst in the tNr oven was quantitative and not degrading over time. High mixing ratios of NH3 were used to ensure that 100% conversion was observed, as quantitative conversion below this level could then be readily assumed. We set this upper limit at 200 ppbv for NH3 based on prior reports in the literature indicating that this mixing ratio is near the upper limit of the range typically found in indoor environments.19 Furthermore, NH3 can be used to check the tNr oven performance over time, as its conversion to NOx will be the first to reflect any degradation in catalytic efficacy.
The HONO calibration source has been described in detail by Lao et al.45 Briefly, the HONO calibration source generates HONO mixing ratios in the low ppbv range via an acid displacement reaction (R1). Gas-phase HONO is generated by passing dry zero air over a HCl PD to combine with an equal flow of air saturated with water vapour, which then enters NaNO2-coated reaction devices at a total flow of ∼110 ccm and 50% relative humidity (RH). In this work, HONO mixing ratios of up to 20 ppbv in a flow of 1 litre per minute (lpm) of zero air were generated by inserting a custom-made HCl PD (12 M HCl in 1/8-inch OD tubing of 8.5 cm in length) and two NaNO2 reaction devices connected in series. These were housed in an oven set to 40 °C. Impurities of NO were below detection limits (0.43 ± 0.49 ppbv) during the experiments.
| HCl(g) + NaNO2(s) → HONO(g) + NaCl(s) | (R1) |
Similarly, dry zero air was passed over a PD containing NH4OH (30% v/v in 1/8-inch OD tubing of 9 cm) to produce gas-phase NH3. The output and stability of this PD were confirmed by regular scrubbing in to 1 mM HCl followed by Ion Chromatography (IC) measurements by conductivity.55 The output mixing ratio was determined to be 3 ppmv in a flow of 90 ccm. Prior to addition to the instrument inlet, the NH3 PD output was diluted with zero air (4–5 lpm), to generate NH3 mixing ratios on the order of 30 ppbv.
2.1.6 Instrument control and data acquisition (DAQ).
Automated control of the solenoid valves and mass flow controllers (Fig. 1) was achieved using a DAQ device (T7 and PS12DC, LabJack, Lakewood, CO, USA) and a custom-built LabVIEW program (National Instruments). Full details and electronic schematic diagrams of the instrument control system are available in the ESI (Section S2 and Fig. S3†). The LabVIEW program VI can be found on the tNr instrument GitHub repository,56 with further information in Section S2.† Briefly, the LabView program allowed for the individual solenoid valves to be switched on separate time intervals as required, with input variables easily adjustable (e.g. valve timings and flow rates). The measurements of NOx from the Serinus 40 were recorded via the analog output channels (NO, NO2 and NOx) using the DAQ in a one second time interval. The LabVIEW program controlled and recorded the valve actuations, MFC flow rates, and NOx readings (converted to ppbv based on a determined analyser transfer function from the analog voltage output). These values were stored in one text file for post-processing, as described in the next section.
2.1.7 Data analysis.
The tNr instrument LabVIEW program generated a data file that was processed using a custom R script in R studio (v3.6.1) available on our Github repository56 (ESI Section S3†). Briefly, the data processing script first organized the tNr dataset by separating data collected in each sampling pathway and then averaging all the measurement data to a one minute time interval, matching the response time of the NOx analyser (see below). The first minute of each measurement cycle (e.g. NOx, Nr,acid, tNr or Nr,base) was removed to avoid any bias from transfer delays or pressure-induced measurement fluctuations related to valve changes. Each measurement cycle is continuous for 5 minutes and takes place every 20 minutes. Between these measurements, we applied a linear interpolation to estimate the intervening 15 minutes of data. The primary motivation for this was to facilitate continuous calculation of the acidic and basic Nr fractions. We acknowledge that using a linear interpolation assumes that the rate of change in analyte levels is either unchanged or slowly linear compared to the period between each measurement cycle. This is generally true for the majority of measurements of our target analytes made in indoor environments with low air change rates (e.g., ref. 27, 46 and 57) but may result in an overestimate or underestimate bias during periods of rapid changes in ventilation or emissions, respectively. Consequently, the final validation of any collected datasets requires detailed inspection of the interpolated data to identify periods when the tNr (or a particular species within it) is changing in concentration faster than the duty cycle time of 20 minutes. During such periods, all measured data were kept, but interpolated data were removed to prevent systematic bias.
2.2 Instrument validation experiments
2.2.1 Response time – positive and negative control experiments.
To build an accurate and real-time gas detection platform, we must understand the instrument response time to changes in the sampling pathways, concentration, and flow rate when handling a sample that is representative of the indoor atmospheric matrix. Therefore, a series of control experiments were designed to characterise the instrument response time to changes in the mixing ratios of key Nr for different instrument settings, e.g. between NOx and tNr,gas measurements. For these experiments, the instrument inlet was overflowed with dry zero air, followed by sampling a flow of an Nr species of interest at a known mixing ratio by switching a valve. Once a stable mixing ratio through the instrument was achieved, the Nr species was removed from the flow, and the decay in the mixing ratio was recorded until it reached the background levels observed when measuring zero air. The experiment was done for NOx and the tNr pathways using NO, NO2, and HONO. With respect to the tNr oven, NH3 and five selected alkyl amines that are commonly abundant in indoor air were also tested. The response time for the Na2CO3 and H3PO3 denuders to scrub HONO and NH3, MMA and DEA, respectively, was also tested using a similar experimental set up.
All measurements for the time response experiments used one second measurements from the analog voltage output from the NOx analyser, converted to a mixing ratio in ppbv, and averaged to a 12 s time resolution (equivalent to the sample cycle interval of the analyser). The time response was calculated according to Moravek et al.58 by single exponential fit of the decay to the background from a stable mixing ratio (eqn (4)) to calculate the time constant, τ, for all experiments.
| | (4) |
The time response was calculated to be 98% (i.e. 4τ). For more inert species where wall interactions are not important (e.g. NOx), eqn (4) should accurately represent the instrument time response. For more reactive or surface-interacting species, such as NH3, where wall interactions are expected to be significant, a double exponential fit of the decay to the background was calculated when beginning from a stable mixing ratio according to eqn (5).58
| | (5) |
where
y0 represents the measured instrument baseline level, and
A1 and
A2 are the proportionality coefficients for the physical processes of sample volume exchange in the inlet and reaction cells, and wall interactions, respectively. The values of
τ1 and
τ2 are the time response of the two respective processes. The start time for the removal of the analyte from the flow of zero air is denoted by
t0. The percentage contribution of the wall interaction process can be described by the term
D (
eqn (6))
59 | | (6) |
Along with τ1 and τ2, D can be used to evaluate the extent of surface processes in governing the time response of the tNr instrument with respect to different Nr species.
2.2.2 Conversion efficiency of the total Nr oven.
Quantitative measurement of the tNr budget requires near unity conversion of even the most challenging of Nr species to NOx in the instrument. Therefore, the conversion efficiency of the total Nr oven was determined by adding known amounts of select Nr species, which span a wide range of N bond energies, and ensure that the NOx conversion requirement was met. Mixtures of NO2 in zero air that spanned typical indoor levels (20–130 ppbv) were generated using a gas calibration system and corresponding standard cylinders. A standard mixture of HONO in zero air was generated using the integrated calibration source described above (Section 2.1.5). The output NO, NO2 and HONO mixing ratios were verified by measurement with the NOx analyser prior to addition to the oven.
Fully reduced Nr species are particularly challenging to convert to NOx, so NH3 and several amine standard mixtures were made using a custom-made PD installed in the integrated calibration source (Section 2.1.5). For the amines, PDs of MMA (40% w/w), DMA (40% w/w), DEA (≥99.5% w/w) and TMA (45% w/w) solutions were made similarly to NH3. During the experiments, each PD was heated to 40 °C under a constant flow of zero air (ca. 50 ccm), which was diluted further with zero air to achieve a desired mixing ratio. All flowrates in these experiments were verified with a bubble flowmeter (Gilibrator-2, Sensidyne®) when calculating dilution factors. The outputs of NH3 and each of the amine PDs were determined by quantitation using our established IC method55 prior to the experiments. We also varied the flow rate through the instrument inlet from 0.63 to 2.0 lpm using an additional MFC to change analyte residence times to quantify any effects on CE in the tNr oven for NO2, HONO and NH3.
3 Instrument characterization and validation
3.1 Instrument response time
The response times in the NOx and tNr pathways were determined experimentally, as detailed in Section 2.2.1 and the results are summarized in Tables 2 and 3. For NO, NO2, and HONO, the response times (4τ) were found to be similar at approximately 1 min when sampling with an instrument inlet flow of 630 ccm (Table 2). The response times calculated from these experiments used a single exponential fit (98–0%). A comparison of single and double exponential fits was also made (Table S1†), but this analysis found that both τ values were similar. This result indicates that the D values, representing wall interactions of NO, NO2, and HONO, were all similar. The response time experiments were repeated at different flow rates through the NOx sampling pathway for NO and NO2 and the response time was found to be independent of the instrument inlet flow rate from 630 to 2000 ccm (Fig. S5,† slopes of −2.99 × 10⁻⁴ and 4.67 × 10⁻⁵ min2 cm−3, respectively). For HONO, the response time was also independent of the instrument flow rate through the NOx and tNr sampling pathways (Fig. S5 and S6,† slopes of −3.79 × 10⁻⁴ ± 5.93 × 10⁻⁴ and −6.55 × 10⁻⁵ ± 2 × 10⁻⁴ min2 cm−3, respectively) and in the NOx sampling pathway (Fig. S4†). In each case, there are no linear trends as all calculated regression slopes were within a value of zero when considering the uncertainties (1σ).
Table 2 Average (n = 3) response time (98–0%) at a flow rate of 630 ccm through the two sampling pathways of the tNr instrument calculated by a single exponential fit. Variability shown is one standard deviation from the mean
Nr species |
NOx pathway |
tNr pathway |
Response time (4τ, min) |
Mixing ratio (ppbv) |
Response time (4τ, min) |
Mixing ratio (ppbv) |
NO |
1.1 ± 0.1 |
17.9 ± 0.8 |
0.9 ± 0.1 |
18.4 ± 0.6 |
NO2 |
0.5 ± 0.1 |
17.6 ± 1.1 |
0.7 ± 0.1 |
23.0 ± 0.5 |
HONO |
1.0 ± 0.1 |
20.2 ± 1.1 |
0.9 ± 0.1 |
13.1 ± 2.1 |
All three compounds demonstrated the same ≤1 min response times indicating that the instrument was only constrained by the sum of the rate of the inlet air exchange and that of the NOx analyser, inclusive of the instrument response time. Since the increased instrument inlet flow had no effect on NO, NO2, and HONO response times, it indicates that these species do not substantially adsorb onto the PFA inlet surfaces, as we have previously reported for other HONO sampling strategies.60 Similarly, the transfer of higher mixing ratios of HONO did not increase the response time, demonstrating that there was no adsorptive buildup of HONO on surfaces in the instrument inlet lines, making the response independent of the HONO mixing ratio.
The response time (4τ) for NH3 in the tNr pathway calculated using eqn (4) was 5.5 min, while for amines it ranged from 13 to 24 min, which are notably longer than those calculated for NOx and HONO. This likely reflects the fact that wall interactions led to an increased response time with respect to NH3 and amines (e.g., ref. 58 and references therein). We therefore applied eqn (5) and (6) to separate the role of the volume exchange and wall interaction processes to determine the overall instrument response time for this basic compound class (Table 3, with representative normalised decays shown in Fig. S7†). For NH3 and amines, τ1 was calculated to be 29–62 s (Table 3), higher than that calculated for NOx and HONO (Table 2; 4τ of 0.7–0.9 min, equivalent to τ of 11–14 s) and the calculated turn over time of 2.6 s based on the internal tubing volume of the instrument inlet (27.7 cm3). The calculated τ2, which is representative of the effect of wall interactions on NH3 and amine, varied considerably, but was about an order of magnitude larger ranging from 221 to 639 s. The longer response time for the instrument to NH3 and amines was expected as they undergo strong inter-molecule interactions with any interfacial water on tubing surfaces and may also partition into its polymeric matrix before the tNr oven. This behaviour is analogous to the gas–wall interactions for semi-volatile organic compounds, which are known to exhibit absorptive partitioning behaviour on PFA tubing, resulting in measurement delays.61,62 NH3 was found to have a lower τ2 compared to the tested amines (Table 3), indicating that it was less affected by wall interactions. From Fig. S7,† NH3 reached zero faster than amines (which all displayed similar normalised decay) and after 5 min was within 20–30% of the maximum level before delivering zero air.
Table 3 Calculated response time (98–0%) through the tNr sampling pathway for basic Nr species at a flowrate of 630 ccm fit by a double exponential. Variability shown for the input mixing ratio is one standard deviation of the mean, while for τ1 and τ2 it is the standard deviation of the fit
Basic Nr species |
Input mixing ratio (ppbv) |
τ
1 (s) |
τ
2 (s) |
D (%) |
NH3 |
24 ± 1 |
29 ± 6 |
220 ± 60 |
41% |
MMA |
23 ± 1 |
30 ± 4 |
640 ± 60 |
46% |
DMA |
26 ± 1 |
55 ± 5 |
610 ± 70 |
36% |
DEA |
25 ± 1 |
62 ± 9 |
380 ± 40 |
45% |
TMA |
6 ± 1 |
40 ± 30 |
450 ± 200 |
52% |
It should be kept in mind that during field measurements ambient NH3 levels are not likely to go to zero after sampling a source of high emissions. Therefore, the response times presented in Table 3 are not representative of performance under normal operation in nearly any indoor environment. A more realistic experiment for determining the instrument response time is to add a pulse of NH3 to ambient air and measure the decay back to ambient levels (i.e., a standard addition approach). This experiment was performed by adding pulses of NH3 at two mixing ratios, 30 ppbv (n = 3) and 200 ppbv (n = 2), to ambient laboratory air and monitoring the normalised decay back to background levels (3–6 ppbv) as shown in Fig. 2. Time for the instrument to reach the background levels of NH3 was found to be similar for both additions. The instrument response time in these experiments τ1 and τ2 was calculated to be on average (±1σ) 20 ± 8 and 270 ± 150 s, with a D of 24 ± 15%. The calculated time response to reach the background levels of NH3 (Fig. 2) resulted in a lower τ1 and D (Table 3) but a similar τ2 compared to the experiments performed with zero air. The lower D value indicates that wall interactions reduced in relative importance during the standard addition experiments (Fig. 2). This would contribute to the instrument τ1 improving from 29 ± 6 to 20 ± 8 s when using the more representative approach to indoor sampling.
|
| Fig. 2 Normalized decay of NH3 pulses to background ambient levels during standard additions to the inlet. Red traces denote duplicate experiments with 200 ppbv of NH3 added, while blue traces denote the triplicate experiments with 30 ppbv additions. | |
Overall, the results in Fig. 2 and Table 3 demonstrate that the instrument is able to capture temporal trends in NH3 and amines if ambient levels change at timescales on the order of a few minutes. This is likely to be the case in indoor air as it is typically well mixed. Perturbations in moderately lived species like NH3 are observed from direct sources (e.g. cooking and cleaning), modulations in ventilation system operation, or opening and closing windows and doors.19,40 When such conditions cause rapid sub-minute changes in these compounds, this instrument may not capture the true temporal variability, but instead exhibit a small time lag with lower peak mixing ratios measured.
3.2 Response time and scrubbing efficacy of denuders
In order to enable measurement by difference for the target species HONO and NH3 by the Na2CO3 and H3PO3 denuders, respectively, we must scrub these species fast with a high efficacy. The utilised denuders are designed for this task and were validated experimentally (Table 4). The response time to scrub HONO by the denuder was calculated to be 1 min. As with the instrument response time for NO, NO2, and HONO, the denuder response time is limited by the response of the inlet air exchange rate and NOx analyser detector. The scrubbing efficiencies of HONO were determined at two relevant mixing ratios for indoor air: 14 ppbv and 4 ppbv, with the fraction captured observed to be greater than 99.6% (Fig. S8†).
Table 4 Calculated response time (4τ) and scrubbing efficacy of carbonate (HONO) and H3PO3 (NH3) denuders at a flow rate of 630 ccm. Response time reported for NH3 and amines using τ1. Where N/A is indicated this means a particular test was not possible. Variability values provided are one standard deviation from the mean when replicates were conducted
|
Response time (4τ, min) |
Input mixing ratio (ppbv) |
After denuder (ppbv) |
Fraction captured (%) |
NOx–HONO (n = 3) |
1.0 ± 0.2 |
14 ± 1.0 |
0.1 ± 0.7 |
99.6 |
NOx–HONO (n = 4) |
1.0 ± 0.4 |
4 ± 1 |
−0.6 ± 0.6 |
115 |
NO (n = 3) |
N/A |
18 ± 1 |
18 ± 1 |
0.0 |
NO2 (n = 3) |
N/A |
17.3 ± −1.1 |
17.0 ± 1.2 |
2.0 |
tNr–NH3 (n = 3) |
0.9 ± 0.1 |
25 ± 1 |
−0.1 ± 0.4 |
100.4 |
tNr–MMA (n = 1) |
3.0 |
10 ± 1 |
−0.3 ± 0.3 |
103 |
tNr–DEA (n = 1) |
1.8 |
35 ± 1 |
0.1 ± 0.3 |
99.7 |
The H3PO3 denuder was also confirmed to be effective at scrubbing NH3 and selected amines (MMA and DEA) in the ppbv range with the fraction captured greater than 99% (Table 4). The response time using normalized decay for scrubbing NH3 and selected amines with the H3PO3 denuder was calculated by using eqn (5) (Fig. S9†). For NH3, τ1 and τ2 were 14 ± 2 s and 170 ± 110 s (1σ), respectively, with a D value of 12%. For DEA, τ1 and τ2 were 27 ± 3 s and 240 ± 370 s (1σ), respectively, with a D value of 6%. The low D value indicates that sample volume exchange was the dominant process for NH3 and DEA, which makes sense given the small remaining inlet volume between the exit of the annular denuder and the catalytic furnace in these experiments. From Fig. S9,† the measured levels were below 10% of the known input levels for both NH3 and DEA within 2 min. Overall, the results of these experiments demonstrate that denuders were effective at scrubbing the targeted atmospheric bases fast enough to enable measurement by difference on timescales of a few minutes.
A stable mixture of NO and NO2 (18 ± 1 ppbv and 17 ± 1 ppbv, respectively) was sent through the Na2CO3 denuder to ensure that no significant adsorption or chemical loss of NOx occurs on the surface of the denuder or its coating. There was no decrease in NO levels observed when it transited the denuder compared to bypassing the denuder (Fig. S10†). The same experiment was carried out with NO2 (Fig. S11†); however a small decrease of NO2 of 0.3 ± 1.6 ppbv lost to the denuder was observed. The measured levels of NO2 bypassing and transiting the denuder were compared using a two-tailed t-test and were found to not be statistically different at a 95% confidence interval (p = 0.13). This means that there was a measurable but insignificant loss of at most 2% of NO2 when passing through the denuder, possibly due to chemical loss on the coating and/or surface of the denuder. Previous studies have observed loss of NO2 to carbonate denuders.46,63 Zhou et al.46 reported an average decrease of 2.6% NO2 after flowing 13 to 270 ppbv into a denuder, which is similar to the upper limit of our findings. The 2% loss of NO2 to the denuder will be considered as a worst-case outcome when quantifying the mixing ratio of HONO, resulting in a conservative estimate. These experiments give confidence that the instrument measurements are capable of quantifying the indoor mixing ratios of NO, NO2, and HONO.
A very small positive bias due to HONO formation in the sampling line was found when it was experimentally exposed to a mixture of humid air representing indoor conditions (42–50% RH) and NO2 (24–305 ppbv), resulting in an average conversion of 0.8% (Fig. S12 and Table S2†). Mixing ratios of NO2 up to 300 ppbv were tested to be representative of the upper limit for the range typically observed indoors, originating from combustion processes like cooking with a gas stove.46,64–66 All of the components used in the tNr instrument inlet (i.e. valves, fittings, and tubing) were made of PFA as it is one of the most chemically inert materials in comparison to others available, such as glass inlets, that can result in a strong production of positive artifacts.67 The observed loss of NO2 to the Na2CO3 coating (2%) would have included heterogeneous HONO formation by NO2 hydrolysis on the sampling lines upstream. For example, if the levels of HONO and NO2 were 2 and 20 ppb, the additional 0.4 ppbv loss of NO2 on the denuder would propagate to a relative error for HONO of 0.85 ppbv. Overall, up to 2% of NO2 can potentially be lost within the sampling line by the surface reaction of NO2 under typical indoor RH conditions, and these observed losses were just as probable to have been driven by instrument drift and/or noise so the example estimate for relative error in HONO represents a conservative upper limit. These negative in NO2 and positive in HONO biases were not corrected in our proof-of-concept work presented in Section 4 as the potential artefact is typically within the precision of the instrument.
3.3 Conversion efficiency of reactive nitrogen species in the tNr oven
For the quantitative measurement of the total Nr budget, the tNr oven must efficiently convert Nr species to NOx. The conversion efficiency (CE) to NOx for key Nr species (HONO, NH3 and selected amines) found indoors was determined experimentally. Overall, the observed CE of these species was 100% within the measurement uncertainty (Table 5) at a flowrate of 630 ccm and tNr oven temperature of 800 °C. The CE of NH3 was consistently observed to be above 100% (103 ± 24%, Table 5), an observation also reported by Stockwell et al.31 MMA had the lowest CE (80 ± 21%), while those of the other tested amines ranged from 88 to 106%, which may indicate potential to underestimate the total amount of amines. Note that all were within 100% CE, when propagating the uncertainty determined by the IC quantitation and NOx analyser detection schemes. A small fraction of NOx generated by the catalytic oven when converting these analytes was observed as NO2 at 800 °C (<6%), indicating that the oven was efficient at converting each species to NO, and suggesting that limited back reactions occurred to form NO2.31,68 The CE for NO2 was determined to be independent of the flowrate between 630 and 1500 ccm (Fig. S13†). Meanwhile for NH3, CE decreased with increasing flowrate (Fig. S14†). This makes sense as fewer collisions with the hot Pt will occur due to decreased residence time over the catalytic surface in the oven. The observed CE in the current work is comparable to those in previous reports (Table 5). Overall, our assessment validates that efficient conversion of key nitrogen species was achieved, but some additional considerations regarding temperature characterization for these systems was realized.
Table 5 Experimentally determined conversion efficacy (CE) for key species through the tNr oven at 800 °C in nitrogen (0% RH) with a flow rate of 630 ccm. Also shown as a comparison is the reported CE to NOx under similar conditions by Stockwell et al.31 Variability presented for CE is a propagation of measurement uncertainty (1σ) while for input mixing ratios it is one standard deviation of the mean output
Species |
CE to NOx |
Input mixing ratios (ppbv) |
CE reported by Stockwell et al.31 |
NO2 |
98–100% |
20–130 |
99 ± 2% |
HONO (n = 3) |
99 ± 3% |
13 ± 1 |
Not reported |
NH3 (n = 3) |
103 ± 24% |
30 ± 1 |
105–110 ± 15% |
NH3 (n = 2) |
109 ± 24% |
194 ± 2 |
MMA (n = 1) |
80 ± 21% |
23 ± 1 |
95 ± 15%, triethyl amine (TEA) |
MEA (n = 1) |
101 ± 17% |
12 ± 1 |
DEA (n = 1) |
88 ± 32% |
25 ± 1 |
DMA (n = 1) |
106 ± 24% |
26 ± 1 |
TMA (n = 1) |
97 ± 16% |
6.2 ± 0.7 |
3.3.1 Effect of temperature on reduced nitrogen species conversion to NOx.
The most important factor that controlled the conversion efficiency of NH3 and tested amines was the tNr oven temperature. Previous work by Stockwell et al.31 observed quantitative conversion of NH3 on the Pt catalyst heated to 750 °C, similar to commercial instruments (e.g. Thermo 17i) but cooler than that used in the current work. Fig. 3 shows that CE for NH3 and selected amines underwent a rapid increase in the fraction converted between 600 and 700 °C. For NH3, the CE increased from 70% at 600 °C to 100% at 700 °C. A similar pattern in the CE of DMA and TMA was also observed (Fig. 3). The exception was MMA, with the CE only increasing minimally between 600 and 900 °C (<10%, Fig. 3). This sharp effect of temperature on catalyst performance has been shown previously for NH3 on a heated molybdenum oxide (MoOx) catalyst69 and is expected for any catalytic systems where the temperature determines whether the altered activation energy of the surface-mediated decomposition pathway is exceeded. Since a large and rapid decrease in CE can occur over a narrow temperature range (roughly 75 °C or 11–13% of the oven temperature), this indicates that accurate and regular characterization of conversion requires a stable oven temperature and precise temperature control to ensure optimal conversion of reduced nitrogen species.
|
| Fig. 3 Conversion efficiency for NH3 (25 ppbv), MMA (23 ppbv), DMA (26 ppbv) and TMA (6 ppbv) to NOx in the tNr oven as a function of temperature at a flow rate of 630 ccm. A sigmoid curve has been applied to the measurements for each species. The measurement variability for the conversion efficiency of each species is given in Table 5. | |
4 Proof-of-concept field measurements in a commercial kitchen
Proof-of-concept measurements with the tNr instrument were performed in a commercial kitchen on a university campus in Toronto. An in-depth analysis of measured tNr species and budget is outside the scope of this work. In the current work, we present a time series of the measured tNr budget from days with high and low levels of cooking activity to validate the capabilities of the tNr instrument when sampling a highly dynamic and complex gas mixture that was encountered in this indoor environment.
4.1 tNr instrument set-up and field quality control procedures
The tNr instrument was housed inside an air-conditioned room, with the inlet line sampling from the main cooking area (¼ inch OD PFA tubing, 6.6 m long, and total flow of 2.1 lpm). Equipment near the inlet included ovens, gas stoves, and dishwashers. The kitchen volume was approximately 620 m3 with a calculated geometric surface area of 1970 m2. A PTFE filter was installed at the inlet to remove airborne particles. For these measurements the tNr instrument was set to sample for 5 min per pathway (, NOx, tNr,gas and tNr,scrubbed, Table 1 and Fig. 1) for a total duty time of 20 min. The instrument flowrate was set to 630 ccm during the measurements, to yield the maximum conversion efficiency found from our characterization tests. The operating temperature of the tNr oven was set to 800 °C. The NOx analyser was calibrated with a gas-calibration instrument and a standard gas cylinder of NO (5 ppmv in N2) prior to the measurements as per manufacturers specifications. A second chemiluminescent NOx analyser (Ecotech EC9841) also sampled from the sampling line during the campaign to give independent measurements of NOx at one minute time resolution. This analyser was calibrated using the same procedure as the tNr instrument NOx analyser. The measured NO, and from the tNr instrument agreed well with the EC9841 over the campaign, with slopes of 1.0, 0.96 and 1.0, respectively (r2 = 0.96). The excellent agreement between the NOx measurements indicates that the tNr instrument inlet was not affecting the measured NOx.
During the measurements, regular quality control checks were performed using in situ zero air and calibration sources during periods when low activity was observed in the kitchen (see Table S3† for a typical order of operations). Field blank measurements for the NOx and tNr sampling pathways were performed by overflowing the instrument with zero air. No drift in the zero measurement was observed on the NOx sampling pathway, with a precision of 0.53 ppbv. This was not the case when zero air was passed through the tNr oven, where a high baseline (ca. 4 ppbv of NOx) was observed after 15 min of exposure to zero air. Extended flushing of the oven with zero air was found to reduce the NOx output of the tNr oven to less than 1 ppbv of NOx, consistent with observations when delivering dry compressed zero air from cylinders. We suspect that the contamination observed in the zero-air overflow of the oven was due to recalcitrant tNr fraction ‘poisoning’ the Pt catalyst, which is well known for Pt and reduced nitrogen in organic synthesis. In this commercial kitchen, ammonia and amine levels were unexpectedly high – on the order of tens of ppbv. As a result, we implemented a regular system check where the tNr oven was regularly cleaned (ca. every 2 days for 30–120 min, Table S3†) with zero air until the measured tNr reached was equivalent to that observed when zero air bypassed the oven and was delivered directly to the NOx analyser (i.e. <1 ppbv NOx). Permeation devices for HONO and NH3 were installed in the permeation oven to assess the scrubbing efficacy of the Na2CO3 and H3PO3 denuders, respectively. Both denuders were exchanged every two days with freshly coated replacements. Prior to exchanging, the installed denuders were tested for their scrubbing efficacy. During this pilot study, we always observed this property to be greater than 95%. Similarly, the freshly prepared and installed denuders had their scrubbing efficacy confirmed prior to use. Taken together, these quality control checks contribute to the assertion that the acidic and basic fraction measurements are quantitative.
To conclude that measurements were complete and quantitative, NH3 was also used to assess the conversion efficiency of the tNr oven in situ during the measurements. During the campaign, the CE was observed to range between 70 and 130%, with a mean of 110%, comparable to the values and range observed during laboratory testing (Table 5). The observed variance is driven by the known variability in the NH3 PD output70 (±30%) and, as a result, can only be used semi-quantitatively when assessing changes in Pt catalyst conversion efficiency over time. Consequently, we did not apply a correction factor for NH3 conversion in the oven due to this observed variability in the NH3 source, but this could be done in the future if a more stable source of NH3 is used, such as a calibrated cylinder.71,72 During the measurement period, Ogawa passive samplers with citric acid-coated reactive substrates were installed in the kitchen close to the sampling inlet for an intercomparison of measured gas-phase NH3 and amines levels. The passive samplers were deployed for two periods, 7–13 and 13–17 Sept., and were extracted with Milli-Q water followed by analysis by IC-CD, with full details available in Salehpoor et al.55 The measured levels of NH3 and amines with the passive sampler were used as a further quality check on the tNr performance and are presented in the following section.
4.2 Time series of measured tNr and species in a commercial kitchen
The tNr instrument measured for 12 days continuously in the kitchen without any instrument faults. Data capture across these days was high (86%). The time series of the measured tNr and NOx levels along with calculated HONO and basic Nr for selected days with high and low cooking activity demonstrate the high data capture (Fig. 4), with measurement gaps (<2 h) corresponding to calibration or other quality control checks (Table S3†). The levels of tNr were fairly consistent over these 2 days, with sharp peaks observed during reported cooking times (e.g. 10 am–12 pm on 15 Sept.). Outside these times, in the afternoon and at night, stable levels of tNr were observed (Fig. 4). The apparent varying readings in tNr and Nr,base during these periods reflect linear interpolation between measurements for these fractions, but are within the propagated error estimates of 20% in our CE estimates. Furthermore, the excellent agreement in the time trends between the measured NO2 for both instruments indicates that tNr is capturing the temporal trends. On 11 Sept. no substantial peaks in tNr were observed, as there was limited cooking in the kitchen on this day. The measured tNr reached over 100 ppbv during cooking periods and were typically driven by NOx. Previous work has observed levels of NOx, HONO and NH3 greater than 100 ppbv during cooking in domestic settings.18,19 The observed sharp peaks in tNr result from rapid intense cooking emissions coupled with very high ventilation rates in the kitchen (average daytime air exchange rates were 27 ± 7 h−1). Unfortunately, HONO or basic Nr fraction levels in the cooking plumes could not be calculated (Section 2.1.7) reliably during such times, as the Nr was changing faster than the instrument duty cycle (20 min). Consequently, the instrument was challenged to measure short peaks in HONO or basic Nr in the kitchen that were fully ventilated in 20 minutes or less. Such high ventilation rates driving very rapid changes in NOx is atypical for indoor environments57 and this instrument was designed to be capable of quantitatively capturing dynamics in these more limited ventilation environments. For example, the commercial kitchen measurements at night demonstrate that the tNr instrument can reliably measure the tNr budget, and longer-lived oscillations readily.
|
| Fig. 4 Selected days of one minute time resolution tNr measured and speciated with interpolation between measurement periods for (a) a low cooking day (11th September) and (b) a high cooking day (15th September). Gaps across all measurements are due to instrument quality control activities, while those isolated for HONO or Nr,base result from periods where emission peaks are shorter lived than the instrument duty cycle. Also included are measured NO2 levels with a co-located EC9841 NOx analyser for comparison, with the shaded areas indicating the measurement uncertainty. Note the different y axis scales. | |
The majority of the measured tNr was NO2 in the kitchen (43%, Fig. 4), followed by the Nr,base fraction (23%). The basic fraction is likely composed primarily of NH3, whose sources would include cooking, cleaning, and human emissions, all expected to be present with significant frequency in a kitchen.19,20 Amines would also be measured in this fraction, which have similar sources (e.g. cleaning and cooking21,25,26), so these are expected to contribute to the observation although they cannot be speciated by this measurement approach. The measured levels of NH3 from the passive samplers were found to be comparable to average Nr,base measured by the tNr instrument over the same time period (Fig. S15†). The agreement with the passive sampler results provides an orthogonal assessment that the measured levels of the Nr,base fraction by the tNr instrument are reliable and accurate. They also indicate that NH3 was the major contributor to Nr,base since detectable levels of alkyl amines were not identified in the passive sampler extracts. Overall, it was expected that the basic Nr fraction measured by the tNr should be equal or higher than the measured NH3 by the passive sampler, but a possible driver of the slight mismatch with passive quantities being higher is that the tNr instrument dataset would miss short, sharp peaks in NH3 during direct emission events. The extraction and analysis of the annular denuder on this flow pathway could provide its own time-integrated compositional view, provided it has not been exposed to NH3 for scrubbing calibration gas or conversion efficiency checks, which was the case here. The relatively high contribution from Nr,base likely reflects the prevalence of cooking and cleaning in a commercial kitchen. The proportion of other tNr species was also fairly consistent outside of cooking times, with the exception of NO. Higher levels of NO were observed during the early morning before the kitchen opened (5–8 am) and were likely due to the intrusion of polluted outdoor air. Overall, the tNr budget was not closed by measured NO, NO2, HONO and Nr,base species. The ‘missing’ fraction was stable throughout the day, at around 5 ppbv or 18% of the measured tNr. As acidic and basic Nr species would be measured by the tNr instrument (Table 1), neutral Nr species most likely comprised the missing fraction, and identifying the species in the missing fraction will be the focus of future work.
5 Instrument application for indoor air chemistry
Here we have described an instrument for measuring the tNr budget and key species NOx, HONO and basic Nr in indoor environments. The measurement approach was validated through a series of controlled experiments, and quantitative measurement and speciation of the tNr budget were demonstrated. The optimum operating conditions of the tNr oven were found to be 800 °C with a sampling flow rate of 630 ccm, which also yielded an acceptable time response for NOx, HONO, NH3 and relevant amines of importance indoors. The efficiency of the tNr oven to convert reduced Nr species to NOx reached a maximum at 800 °C, at 103 ± 13% for NH3 and 79–106% for the tested amines, demonstrating the importance of conversion temperature characterization for the tNr oven. The tNr instrument was successfully deployed in a commercial kitchen, a complex indoor environment with periods of rapidly changing levels, and shown to be able to reliably measure the tNr budget during the period of longer-lived oscillations (>20 min), more typical of most indoor spaces.
Recent work has shown how humans significantly affect the chemistry of indoor air,20,41,73 illustrating the importance of surveying occupied spaces to fully understand indoor air quality and occupant exposure to pollutants. Therefore, unobtrusive measurements, to avoid affecting occupants and influencing their activity during measurements, are paramount to understanding what people are exposed to indoors. Yet an instrument package with sufficiently high time resolution is required to fully probe chemistry involving a multitude of species in indoor air and the complex interplay between chemistry, ventilation and surfaces,53,74 perhaps best illustrated by the HOMEChem study.27 While this prior study allowed researchers to probe different indoor sources in a controlled and reproducible manner, leading to key insights into the contributions from sources/activities, the complex nature of the instrumentation deployed meant that the measurements of occupied space were limited to those with scientists in them. Such large, multi-instrumented field studies are not suited for measuring indoor air quality while people undertake their normal activities and require unobtrusive instruments that can measure a suite of compounds. Many previous studies surveying occupied indoor spaces have relied on passive samplers,75 as they are inexpensive, quantitative, unobtrusive, and safe to deploy in occupied spaces. The major disadvantage with passive samplers is their low time resolution, with sampling times of several days typically needed, which can make it difficult to fully capture the role and frequency of dynamic sources.
The tNr instrument presented in this work strives to occupy a fruitful middle ground with its small footprint, safe (no dangerous chemicals required), insulated oven, quiet and automated operation making it suitable for measurements in both occupied and unoccupied indoor spaces. The tNr instrument can be set up to measure without any operator input for several days and so can be used continuously in occupied indoor areas. Thus, it is ideal for surveying the indoor air quality contributions of a broad range of Nr species across different environments, such as domestic residences, offices, and public buildings, without the need for multiple instruments targeting individual Nr species. The assembled inlet around a standard NOx analyser also substantially reduces the cost to gain significant insight into the dynamics of many Nr species. Furthermore, the high time resolution of the tNr instrument means that it can capture dynamic variability on the order of 20 minutes in Nr species levels and quantify the contributions from different sources, unlike passive samplers. Future work could focus on improving the tNr instrument time resolution and could include the addition of a second chemiluminescence NOx analyser, to enable simultaneous measurements of two pathways (Table 1). This could result in the instrument duty cycle being halved, and allow for differential measurements (Nr,acid and Nr,base) during periods of dynamic variability. Improving the stability of the baseline through the tNr oven could also be the focus of future work, which could be achieved by automated cleaning with zero air when not in use (i.e. during NOx pathway measurements) to minimize baseline contributions originating from the Pt catalyst.
Indoors, Nr species concentrations are high and a key driver of indoor air quality. This new tNr instrument allows for a detailed survey of Nr species and can quickly visit several locations. Its mass-balance approach means that this instrument is also capable of identifying environments with unexpected distributions of Nr fractions that can stimulate more in-depth analysis in future fieldwork intensives like HOMEChem. This is well illustrated in the proof-of-concept measurements in the kitchen, where NOx, HONO and Nr,base were unable to account for all the measured tNr, pointing to a substantial missing fraction in the kitchen. Future work will identify the species contributing to this ‘missing’ tNr fraction, using co-located measurements. Overall, the tNr instrument can determine the emissions and sources of Nr species indoors and safely explore the unknown chemistry of indoor environments.
Author contributions
Conceptualization and funding: T. C. V; investigation: L. R. C., M. L., and L. S.; methodology, software, data curation, and formal analysis: L. R. C. and M. L.; writing – original draft: L. R. C. and M. L.; writing – editing: all authors.
Conflicts of interest
There are no conflicts of interest to declare.
Acknowledgements
We thank CJ Young for the loan of the EC9841 during the kitchen observations. We thank the building operators, facilities managers, and kitchen staff for access to the observation space, operations and sales logs, and ventilation data. ML acknowledges support through the Harold I. Schiff award in atmospheric chemistry. LS acknowledges support through an Ontario Graduate Scholarship, the Charles Hantho award in atmospheric chemistry, and an Enbridge Graduate Award. This work was funded by the Alfred P. Sloan Foundation CIE Program (G-2018-11062 and G-2018-11051), and NSERC Discovery Grants and Discovery Launch Supplement (RGPIN-2020-06166 and DGECR-2020-00186).
References
- J. A. Logan, Nitrogen oxides in the troposphere: global and regional budgets, J. Geophys. Res. Ocean, 1983, 88, 10785–10807 CrossRef CAS.
- N. Friedrich, I. Tadic, J. Schuladen, J. Brooks, E. Darbyshire, F. Drewnick, H. Fischer, J. Lelieveld and J. N. Crowley, Measurement of NOx and NOy with a thermal dissociation cavity ring-down spectrometer (TD-CRDS): instrument characterisation and first deployment, Atmos. Meas. Tech., 2020, 13, 5739–5761 CrossRef CAS.
- J. M. Roberts, C. E. Stockwell, R. J. Yokelson, J. de Gouw, Y. Liu, V. Selimovic, A. R. Koss, K. Sekimoto, M. M. Coggon, B. Yuan, K. J. Zarzana, S. S. Brown, C. Santin, S. H. Doerr and C. Warneke, The nitrogen budget of laboratory-simulated western US wildfires during the FIREX 2016 Fire Lab study, Atmos. Chem. Phys., 2020, 20, 8807–8826 CrossRef CAS.
- R. S. Park, S. Lee, S.-K. Shin and C. H. Song, Contribution of ammonium nitrate to aerosol optical depth and direct radiative forcing by aerosols over East Asia, Atmos. Chem. Phys., 2014, 14, 2185–2201 CrossRef.
- J. C. Neff, E. A. Holland, F. J. Dentener, W. H. McDowell and K. M. Russell, The origin, composition and rates of organic nitrogen deposition: a missing piece of the nitrogen cycle?, Biogeochemistry, 2002, 57, 99–136 CrossRef.
- S. E. Cornell, Atmospheric nitrogen deposition: revisiting the question of the importance of the organic component, Environ. Pollut., 2011, 159, 2214–2222 CrossRef CAS PubMed.
- A. Moravek, J. G. Murphy, A. Hrdina, J. C. Lin, C. Pennell, A. Franchin, A. M. Middlebrook, D. L. Fibiger, C. C. Womack, E. E. McDuffie, R. Martin, K. Moore, M. Baasandorj and S. S. Brown, Wintertime spatial distribution of ammonia and its emission sources in the Great Salt Lake region, Atmos. Chem. Phys., 2019, 19, 15691–15709 CrossRef CAS.
- S. Fuzzi, U. Baltensperger, K. Carslaw, S. Decesari, H. van der Gon, M. C. Facchini, D. Fowler, I. Koren, B. Langford, U. Lohmann, E. Nemitz, S. Pandis, I. Riipinen, Y. Rudich, M. Schaap, J. G. Slowik, D. V Spracklen, E. Vignati, M. Wild, M. Williams and S. Gilardoni, Particulate matter, air quality and climate: lessons learned and future needs, Atmos. Chem. Phys., 2015, 15, 8217–8299 CrossRef CAS.
- A. M. Avery, M. S. Waring and P. F. DeCarlo, Seasonal variation in aerosol composition and concentration upon transport from the outdoor to indoor environment, Environ. Sci. Process. Impacts, 2019, 21, 528–547 RSC.
- Y. Omelekhina, A. Eriksson, F. Canonaco, A. S. H. Prevot, P. Nilsson, C. Isaxon, J. Pagels and A. Wierzbicka, Cooking and electronic cigarettes leading to large differences between indoor and outdoor particle composition and concentration measured by aerosol mass spectrometry, Environ. Sci. Process. Impacts, 2020, 22, 1382–1396 RSC.
- I. Garbarienė, J. Pauraitė, D. Pashneva, A. Minderytė, K. Sarka, V. Dudoitis, L. Davulienė, M. Gaspariūnas, V. Kovalevskij, D. Lingis, L. Bučinskas, J. Šapolaitė, Ž. Ežerinskis, G. Mainelis, J. Ovadnevaitė, S. Kecorius, K. Plauškaitė-Šukienė and S. Byčenkienė, Indoor-outdoor relationship of submicron particulate matter in mechanically ventilated building: chemical composition, sources and infiltration factor, Build. Environ., 2022, 222, 109429 CrossRef.
- J. Li, W. Xu, Z. Li, M. Duan, B. Ouyang, S. Zhou, L. Lei, Y. He, J. Sun, Z. Wang, L. Du and Y. Sun, Real-time characterization of aerosol particle composition, sources and influences of increased ventilation and humidity in an office, Indoor Air, 2021, 31, 1364–1376 CrossRef CAS PubMed.
- N. Gysel, P. Dixit, D. A. Schmitz, G. Engling, A. K. Cho, D. R. Cocker and G. Karavalakis, Chemical speciation, including polycyclic aromatic hydrocarbons (PAHs), and toxicity of particles emitted from meat cooking operations, Sci. Total Environ., 2018, 633, 1429–1436 CrossRef CAS PubMed.
- J. C. Ditto, J. P. D. Abbatt and A. W. H. Chan, Gas- and particle-phase amide emissions from cooking: mechanisms and air quality impacts, Environ. Sci. Technol., 2022, 56, 7741–7750 CrossRef CAS PubMed.
- B. C. Berman, B. E. Cummings, A. M. Avery, P. F. DeCarlo, S. L. Capps and M. S. Waring, Simulating indoor inorganic aerosols of outdoor origin with the inorganic aerosol thermodynamic equilibrium model ISORROPIA, Indoor Air, 2022, 32, e13075 CrossRef CAS PubMed.
- J. P. D. Abbatt and C. Wang, Environ. Sci. Process. Impacts, 2020, 22, 25–48 RSC.
- C. Wang, D. B. Collins, C. Arata, A. H. Goldstein, J. M. Mattila, D. K. Farmer, L. Ampollini, P. F. DeCarlo, A. Novoselac, M. E. Vance, W. W. Nazaroff and J. P. D. Abbatt, Surface reservoirs dominate dynamic gas-surface partitioning of many indoor air constituents, Sci. Adv., 2020, 6, eaay8973 CrossRef CAS PubMed.
- C. Wang, B. Bottorff, E. Reidy, C. M. F. Rosales, D. B. Collins, A. Novoselac, D. K. Farmer, M. E. Vance, P. S. Stevens and J. P. D. Abbatt, Cooking, bleach cleaning, and air conditioning strongly impact levels of HONO in a house, Environ. Sci. Technol., 2020, 54, 13488–13497 CrossRef CAS PubMed.
- L. Ampollini, E. F. Katz, S. Bourne, Y. Tian, A. Novoselac, A. H. Goldstein, G. Lucic, M. S. Waring and P. F. DeCarlo, Observations and contributions of real-time indoor ammonia concentrations during HOMEChem, Environ. Sci. Technol., 2019, 53, 8591–8598 CrossRef CAS PubMed.
- M. Li, C. J. Weschler, G. Bekö, P. Wargocki, G. Lucic and J. Williams, Human ammonia emission rates under various indoor environmental conditions, Environ. Sci. Technol., 2020, 54, 5419–5428 CrossRef CAS PubMed.
- J. M. Mattila, P. S. J. Lakey, M. Shiraiwa, C. Wang, J. P. D. Abbatt, C. Arata, A. H. Goldstein, L. Ampollini, E. F. Katz, P. F. DeCarlo, S. Zhou, T. F. Kahan, F. J. Cardoso-Saldaña, L. H. Ruiz, A. Abeleira, E. K. Boedicker, M. E. Vance and D. K. Farmer, Multiphase chemistry controls inorganic chlorinated and nitrogenated compounds in indoor air during bleach cleaning, Environ. Sci. Technol., 2020, 54, 1730–1739 CrossRef CAS PubMed.
- A. A. Angelucci, L. R. Crilley, R. Richardson, T. S. E. Valkenburg, P. S. Monks, J. M. Roberts, R. Sommariva and T. C. VandenBoer, Elevated levels of chloramines and chlorine detected near an indoor sports complex, Environ. Sci. Process. Impacts, 2023 10.1039/D2EM00411A.
- J. P. S. Wong, N. Carslaw, R. Zhao, S. Zhou and J. P. D. Abbatt, Observations and impacts of bleach washing on indoor chlorine chemistry, Indoor Air, 2017, 27, 1082–1090 CrossRef CAS PubMed.
- E. C. Hall, S. R. Haines, K. Marciniak, A. H. Goldstein, R. I. Adams, K. C. Dannemiller and P.
K. Misztal, Varying humidity increases emission of volatile nitrogen-containing compounds from building materials, Build. Environ., 2021, 205, 108290 CrossRef.
- S. Robbana-Barnat, M. Rabache, E. Rialland and J. Fradin, Heterocyclic amines: occurrence and prevention in cooked food, Environ. Health Perspect., 1996, 104, 280–288 CrossRef CAS PubMed.
- K. Kikugawa, Formation of mutagens, 2-amino-3, 8-dimethylimidazo [4, 5-# f] quinoxaline (MeIQx) and 2-amino-3, 4, 8-trimethylimidazo [4, 5-# f] quinoxaline (4, 8-DiMeIQx), in heated fish meats, Mutat. Res. Mol. Mech. Mutagen., 1987, 179, 5–14 CrossRef CAS PubMed.
- D. K. Farmer, M. E. Vance, J. P. D. Abbatt, A. Abeleira, M. R. Alves, C. Arata, E. Boedicker, S. Bourne, F. Cardoso-Saldaña, R. Corsi, P. F. DeCarlo, A. H. Goldstein, V. H. Grassian, L. Hildebrandt Ruiz, J. L. Jimenez, T. F. Kahan, E. F. Katz, J. M. Mattila, W. W. Nazaroff, A. Novoselac, R. E. O'Brien, V. W. Or, S. Patel, S. Sankhyan, P. S. Stevens, Y. Tian, M. Wade, C. Wang, S. Zhou and Y. Zhou, Overview of HOMEChem: house observations of microbial and environmental chemistry, Environ. Sci. Process. Impacts, 2019, 21, 1280–1300 RSC.
- A. Moravek, T. C. VandenBoer, Z. Finewax, D. Pagonis, B. A. Nault, W. L. Brown, D. A. Day, A. V. Handschy, H. Stark, P. Ziemann, J. L. Jimenez, J. A. de Gouw and C. J. Young, Reactive chlorine emissions from cleaning and reactive nitrogen chemistry in an indoor athletic facility, Environ. Sci. Technol., 2022, 56, 15408–15416 CrossRef CAS PubMed.
- T. C. VandenBoer, M. Z. Markovic, A. Petroff, M. F. Czar, N. Borduas and J. G. Murphy, Ion chromatographic separation and quantitation of alkyl methylamines and ethylamines in atmospheric gas and particulate matter using preconcentration and suppressed conductivity detection, J. Chromatogr. A, 2012, 1252, 74–83 CrossRef CAS PubMed.
- B. K. Place, A. T. Quilty, R. A. Di Lorenzo, S. E. Ziegler and T. C. VandenBoer, Quantitation of 11 alkylamines in atmospheric samples: separating structural isomers by ion chromatography, Atmos. Meas. Tech., 2017, 10, 1061–1078 CrossRef CAS.
- C. E. Stockwell, A. Kupc, B. Witkowski, R. K. Talukdar, Y. Liu, V. Selimovic, K. J. Zarzana, K. Sekimoto, C. Warneke, R. A. Washenfelder, R. J. Yokelson, A. M. Middlebrook and J. M. Roberts, Characterization of a catalyst-based conversion technique to measure total particulate nitrogen and organic carbon and comparison to a particle mass measurement instrument, Atmos. Meas. Tech., 2018, 11, 2749–2768 CrossRef CAS.
- R. D. Saylor, E. S. Edgerton, B. E. Hartsell, K. Baumann and D. A. Hansen, Continuous gaseous and total ammonia measurements from the southeastern aerosol research and characterization (SEARCH) study, Atmos. Environ., 2010, 44, 4994–5004 CrossRef CAS.
- O. Marx, C. Brümmer, C. Ammann, V. Wolff and A. Freibauer, TRANC; a novel fast-response converter to measure total reactive atmospheric nitrogen, Atmos. Meas. Tech., 2012, 5, 1045–1057 CrossRef CAS.
- C. Ammann, V. Wolff, O. Marx, C. Brümmer and A. Neftel, Measuring the biosphere-atmosphere exchange of total reactive nitrogen by eddy covariance, Biogeosciences, 2012, 9, 4247–4261 CrossRef CAS.
- A. J. Prenni, E. J. T. Levin, K. B. Benedict, A. P. Sullivan, M. I. Schurman, K. A. Gebhart, D. E. Day, C. M. Carrico, W. C. Malm, B. A. Schichtel, J. L. Collett and S. M. Kreidenweis, Gas-phase reactive nitrogen near grand teton national park: impacts of transport, anthropogenic
emissions, and biomass burning, Atmos. Environ., 2014, 89, 749–756 CrossRef CAS.
- L. Thöni, E. Seitler, A. Blatter and A. Neftel, A passive sampling method to determine ammonia in ambient air, J. Environ. Monit., 2003, 5, 96–99 RSC.
- M. J. Roadman, J. R. Scudlark, J. J. Meisinger and W. J. Ullman, Validation of Ogawa passive samplers for the determination of gaseous ammonia concentrations in agricultural settings, Atmos. Environ., 2003, 37, 2317–2325 CrossRef CAS.
- M. A. Puchalski, M. E. Sather, J. T. Walker, C. M. B. Lehmann, D. A. Gay, J. Mathew and W. P. Robarge, Passive ammonia monitoring in the United States: comparing three different sampling devices, J. Environ. Monit., 2011, 13, 3156–3167 RSC.
- D. Key, J. Stihle, J.-E. Petit, C. Bonnet, L. Depernon, O. Liu, S. Kennedy, R. Latimer, M. Burgoyne, D. Wanger, A. Webster, S. Casunuran, S. Hidalgo, M. Thomas, J. A. Moss and M. M. Baum, Integrated method for the measurement of trace nitrogenous atmospheric bases, Atmos. Meas. Tech., 2011, 4, 2795–2807 CrossRef CAS.
- P. S. J. Lakey, Y. Won, D. Shaw, F. F. Østerstrøm, J. Mattila, E. Reidy, B. Bottorff, C. Rosales, C. Wang, L. Ampollini, S. Zhou, A. Novoselac, T. F. Kahan, P. F. DeCarlo, J. P. D. Abbatt, P. S. Stevens, D. K. Farmer, N. Carslaw, D. Rim and M. Shiraiwa, Spatial and temporal scales of variability for indoor air constituents, Commun. Chem., 2021, 4, 110 CrossRef CAS PubMed.
- N. Zannoni, P. S. J. Lakey, Y. Won, M. Shiraiwa, D. Rim, C. J. Weschler, N. Wang, L. Ernle, M. Li, G. Bekö, P. Wargocki and J. Williams, The human oxidation field, Science, 2022, 377, 1071–1077 CrossRef CAS PubMed.
-
Ecotech, Serinus 40 user manual, 2.2 Search PubMed.
- M. J. Navas, A. M. Jiménez and G. Galán, Air analysis: determination of nitrogen compounds by chemiluminescence, Atmos. Environ., 1997, 31, 3603–3608 CrossRef CAS.
- J. G. Murphy, D. A. Day, P. A. Cleary, P. J. Wooldridge, D. B. Millet, A. H. Goldstein and R. C. Cohen, The weekend effect within and downwind of Sacramento – Part 1: observations of ozone, nitrogen oxides, and VOC reactivity, Atmos. Chem. Phys., 2007, 7, 5327–5339 CrossRef CAS.
- M. Lao, L. R. Crilley, L. Salehpoor, T. C. Furlani, I. Bourgeois, J. A. Neuman, A. W. Rollins, P. R. Veres, R. A. Washenfelder, C. C. Womack, C. J. Young and T. C. VandenBoer, A portable, robust, stable, and tunable calibration source for gas-phase nitrous acid (HONO), Atmos. Meas. Tech., 2020, 13, 5873–5890 CrossRef CAS.
- S. Zhou, C. J. Young, T. C. VandenBoer, S. F. Kowal and T. F. Kahan, Time-resolved measurements of nitric oxide, nitrogen dioxide, and nitrous acid in an occupied New York home, Environ. Sci. Technol., 2018, 52, 8355–8364 CrossRef CAS PubMed.
-
W. Winberry Jr, T. Ellestad and R. Stevens, Compendium method for the determination of Inorganic Compounds in Ambient Air: Compendium Method IO-4.2: Determination of Reactive Acidic and Basic Gases and Strong Acidity of Atmospheric Fine Particles (<2.5 um), EPA/625/R-96/010a, US Environmental Protection Agency, Cincinnati, OH, 1999 Search PubMed.
- M. Brauer, P. B. Ryan, H. H. Suh, P. Koutrakis, J. D. Spengler, N. P. Leslie and I. H. Billick, Measurements of nitrous
acid inside two research houses, Environ. Sci. Technol., 1990, 24, 1521–1527 CrossRef CAS.
- M. L. Fischer, D. Littlejohn, M. M. Lunden and N. J. Brown, Automated measurements of ammonia and nitric acid in indoor and outdoor air, Environ. Sci. Technol., 2003, 37, 2114–2119 CrossRef CAS PubMed.
- F. Vichi, L. Mašková, M. Frattoni, A. Imperiali and J. Smolík, Simultaneous measurement of nitrous acid, nitric acid, and nitrogen dioxide by means of a novel multipollutant diffusive sampler in libraries and archives, Heritage Sci., 2016, 4, 4 CrossRef.
- N. Carslaw, A new detailed chemical model for indoor air pollution, Atmos. Environ., 2007, 41, 1164–1179 CrossRef CAS.
- S. R. Jackson, J. C. Harrison, J. E. Ham and J. R. Wells, A chamber study of alkyl nitrate production formed by terpene ozonolysis in the presence of NO and alkanes, Atmos. Environ., 2017, 171, 143–148 CrossRef CAS PubMed.
- W. W. Nazaroff and C. J. Weschler, Indoor acids and bases, Indoor Air, 2020, 30, 559–644 CrossRef CAS PubMed.
- X. Ge, A. S. Wexler and S. L. Clegg, Atmospheric amines – Part I. A review, Atmos. Environ., 2011, 45, 524–546 CrossRef CAS.
-
L. Salehpoor and T. C. VandenBoer, Limits of suppressors in an ion chromatographic method for quantitative analysis of alkylamines in atmospheric aerosol and gas samples, 2023, in prep.
-
M. Lao and L. Crilley, tNr Instrument Software, https://github.com/data-lao/tNrInstrument Search PubMed.
- S. Zhou, C. J. Young, T. C. VandenBoer and T. F. Kahan, Role of location, season, occupant activity, and chemistry in indoor ozone and nitrogen oxide mixing ratios, Environ. Sci. Process. Impacts, 2019, 21, 1374–1383 RSC.
- A. Moravek, S. Singh, E. Pattey, L. Pelletier and J. G. Murphy, Measurements and quality control of ammonia eddy covariance fluxes: a new strategy for high-frequency attenuation correction, Atmos. Meas. Tech., 2019, 12, 6059–6078 CrossRef.
- R. A. Ellis, J. G. Murphy, E. Pattey, R. van Haarlem, J. M. O'Brien and S. C. Herndon, Characterizing a quantum cascade tunable infrared laser differential absorption spectrometer (QC-TILDAS) for measurements of atmospheric ammonia, Atmos. Meas. Tech., 2010, 3, 397–406 CrossRef CAS.
- T. C. VandenBoer, S. S. Brown, J. G. Murphy, W. C. Keene, C. J. Young, A. A. P. Pszenny, S. Kim, C. Warneke, J. A. de Gouw and J. R. Maben, Understanding the role of the ground surface in HONO vertical structure: high resolution vertical profiles during NACHTT-11, J. Geophys. Res. Atmos., 2013, 118, 10–155 Search PubMed.
- D. Pagonis, J. E. Krechmer, J. de Gouw, J. L. Jimenez and P. J. Ziemann, Effects of gas–wall partitioning in Teflon tubing and instrumentation on time-resolved measurements of gas-phase organic compounds, Atmos. Meas. Tech., 2017, 10, 4687–4696 CrossRef CAS.
- X. Liu, B. Deming, D. Pagonis, D. A. Day, B. B. Palm, R. Talukdar, J. M. Roberts, P. R. Veres, J. E. Krechmer, J. A. Thornton, J. A. de Gouw, P. J. Ziemann and J. L. Jimenez, Effects of gas--wall interactions on measurements of semivolatile compounds and small polar molecules, Atmos. Meas. Tech., 2019, 12, 3137–3149 CrossRef CAS.
- M. E. Monge, B. D'Anna and C. George, Nitrogen dioxide removal and nitrous acid formation on titanium oxide surfaces-an air quality remediation process?, Phys. Chem. Chem. Phys., 2010, 12, 8991–8998 RSC.
- S. S. Park, J. H. Hong, J. H. Lee, Y. J. Kim, S. Y. Cho and S. J. Kim, Investigation of nitrous acid concentration in an indoor environment using an in-situ monitoring system, Atmos. Environ., 2008, 42, 6586–6596 CrossRef CAS.
- N. A. Mullen, J. Li, M. L. Russell, M. Spears, B. D. Less and B. C. Singer, Results of the California healthy homes indoor air quality study of 2011-2013: impact of natural gas appliances on air pollutant concentrations, Indoor Air, 2016, 26, 231–245 CrossRef CAS PubMed.
- B. C. Singer, R. Z. Pass, W. W. Delp, D. M. Lorenzetti and R. L. Maddalena, Pollutant concentrations and emission rates from natural gas cooking burners without and with range hood exhaust in nine California homes, Build. Environ., 2017, 122, 215–229 CrossRef.
- X. Zhou, Y. He, G. Huang, T. D. Thornberry, M. A. Carroll and S. B. Bertman, Photochemical production of nitrous acid on glass sample manifold surface, Geophys. Res. Lett., 2002, 29, 5–8 CrossRef.
- J. J. Schwab, Y. Li, M.-S. Bae, K. L. Demerjian, J. Hou, X. Zhou, B. Jensen and S. C. Pryor, A laboratory intercomparison of real-time gaseous ammonia measurement methods, Environ. Sci. Technol., 2007, 41, 8412–8419 CrossRef CAS PubMed.
-
P. Gregoire, Implications of Ambient Ammonia on Aerosol Acidity and Reactive Nitrogen Measurements, University of Toronto, 2013 Search PubMed.
- J. A. Neuman, T. B. Ryerson, L. G. Huey, R. Jakoubek, J. B. Nowak, C. Simons and F. C. Fehsenfeld, Calibration and evaluation of nitric acid and ammonia permeation tubes by UV optical absorption, Environ. Sci. Technol., 2003, 37, 2975–2981 CrossRef CAS PubMed.
- A. M. H. van der Veen, J. I. T. van Wijk, K. Harris, C. Goodman, J. Hodges, S. Uehara, J. H. Kang, Y. D. Kim, D. H. Kim, S. Lee, D. R. Worton, S. Bartlett, S. van Aswegen, P. J. Brewer, O. V Efremova, T. Zhang, D. Wang, Q. Han, Z. Zeyi, M. Iturrate-Garcia, C. Pascale and B. Niederhauser, International comparison CCQM-K117 ammonia, Metrologia, 2021, 58, 8017 CrossRef.
- T. Macé, M. Iturrate-Garcia, C. Pascale, B. Niederhauser, S. Vaslin-Reimann and C. Sutour, Air pollution monitoring: development of ammonia (NH$_{3}$) dynamic reference gas mixtures at nanomoles per mole levels to improve the lack of traceability of measurements, Atmos. Meas. Tech., 2022, 15, 2703–2718 CrossRef.
- N. Wang, L. Ernle, G. Bekö, P. Wargocki and J. Williams, Emission rates of volatile organic compounds from humans, Environ. Sci. Technol., 2022, 56, 4838–4848 CrossRef CAS PubMed.
- C. J. Weschler and N. Carslaw, Indoor chemistry, Environ. Sci. Technol., 2018, 52, 2419–2428 CrossRef CAS PubMed.
- F. Villanueva, M. Ródenas, A. Ruus, J. Saffell and M. F. Gabriel, Sampling and analysis techniques for inorganic air pollutants in indoor air, Appl. Spectrosc. Rev., 2022, 57, 531–579 CrossRef CAS.
|
This journal is © The Royal Society of Chemistry 2023 |