
 Open Access Article
 This Open Access Article is licensed under a
 Creative Commons Attribution 3.0 Unported Licence
Balancing dynamic evolution of active sites for urea oxidation in practical scenarios†
Jichao
Zhang‡
a,
Jiexin
Zhu‡
 ab,
Liqun
Kang‡
c,
Qing
Zhang‡
d,
Longxiang
Liu
a,
Fei
Guo
a,
Kaiqi
Li
a,
Jianrui
Feng
a,
Lixue
Xia
e,
Lei
Lv
b,
Wei
Zong
a,
Paul R.
Shearing
f,
Dan J. L.
Brett
f,
Ivan P.
Parkin
*a,
Xuedan
Song
*d,
Liqiang
Mai
*b and
Guanjie
He
*af
ab,
Liqun
Kang‡
c,
Qing
Zhang‡
d,
Longxiang
Liu
a,
Fei
Guo
a,
Kaiqi
Li
a,
Jianrui
Feng
a,
Lixue
Xia
e,
Lei
Lv
b,
Wei
Zong
a,
Paul R.
Shearing
f,
Dan J. L.
Brett
f,
Ivan P.
Parkin
*a,
Xuedan
Song
*d,
Liqiang
Mai
*b and
Guanjie
He
*af
aChristopher Ingold Laboratory, Department of Chemistry, University College London (UCL), 20 Gordon Street, London WC1H 0AJ, UK. E-mail: g.he@ucl.ac.uk; i.p.parkin@ucl.ac.uk
bState Key Laboratory of Advanced Technology for Materials Synthesis and Processing, Wuhan University of Technology, Wuhan Hubei 430070, China. E-mail: mlq518@whut.edu.cn
cDepartment of Inorganic Spectroscopy, Max-Planck-Institute for Chemical Energy Conversion, Stiftstr. 34-36, 45470 Mülheim an der Ruhr, Germany
dSchool of Chemistry, State Key Lab of Fine Chemicals, Liaoning Key Lab for Energy Materials and Chemical Engineering, Dalian University of Technology, Dalian, Liaoning 116024, China. E-mail: song@dlut.edu.cn
eState Key Laboratory of Silicate Materials for Architectures, International School of Materials Science and Engineering, Wuhan University of Technology, No. 122 Luoshi Road, Wuhan 430070, China
fElectrochemical Innovation Lab (EIL), Department of Chemical Engineering, University College London (UCL), London WC1E 7JE, UK
First published on 31st October 2023
Abstract
Electrochemical urea splitting provides a sustainable and environmentally benign route for facilitating energy conversion. Nonetheless, the sustained efficiency of urea splitting is impeded by a scarcity of active sites during extended operational periods. Herein, an atomic heterostructure engineering strategy is proposed to promote the generation of active species via synthesizing unique Ru–O4 coordinated single atom catalysts anchored on Ni hydroxide (Ru1–Ni(OH)2), with ultralow Ru loading mass of 40.6 μg cm−2 on the nickel foam for commercial feasibility. Leveraging in situ spectroscopic characterizations, the structure-performance relationship in low and high urea concentrations was investigated and exhibited extensive universality. The boosted generation of dynamic Ni3+ active sites ensures outstanding activity and prominent long-term durability tests in various practical scenarios, including 100 h Zn–urea–air battery operation, 100 h alkaline urine electrolysis, and over 400 h stable hydrogen production in membrane electrode assembly (MEA) system under industrial-level current density.
Broader contextAn efficient and durable electrocatalyst for urea oxidation reaction with an intelligible mechanistic investigation based on the dynamic evolution of active sites is urgently required. Here, a single atomic Ru anchor strategy is proposed to boost the generation of active sites. Through elaborated electrochemical experiments, in situ spectroscopic observation and computational calculations, the rate-determining step in low and high concentration is revealed, respectively. In addition, the boosted dynamic Ni3+ active sites enable the decent electrochemical performance and exhibit extensive applicability in various practical scenarios to replace oxygen evolution reaction for energy-saving. |
Introduction
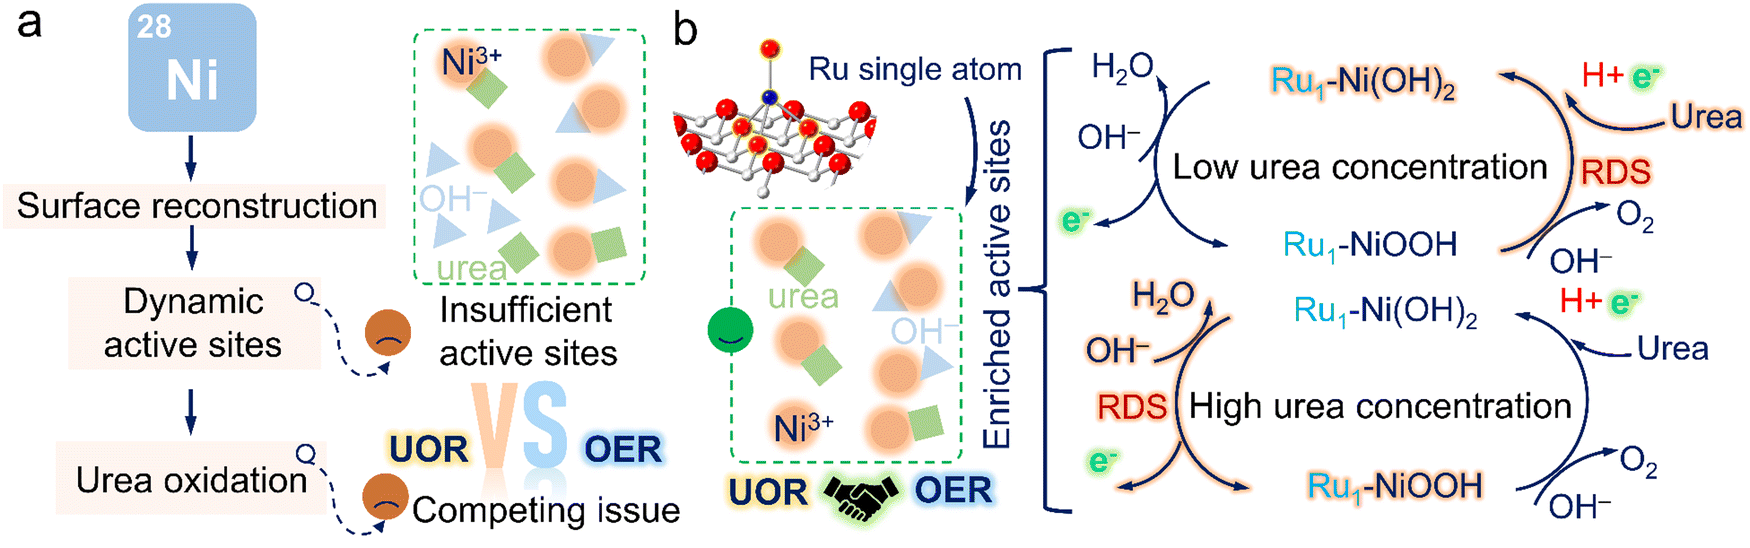
The electrochemical oxidation reactions of small molecules have extensive application for future energy scenarios.1–3 An ultralow thermodynamic potential route to replace the sluggish oxygen evolution reaction (OER), is required for high-value chemical generation or pollutant degradation.4–6 The urea oxidation reaction (UOR), with low theoretical potential and abundant resources, has recently gained enormous attention.7 More importantly, a large amount of industrial and domestic wastewater bearing urea is annually discharged into the environment without any treatment, thereby seriously damaging water resources.8,9 Provided that we utilize wastewater containing urea and couple the UOR with high-value product generation reactions, this attractive technique can pave the way for large-scale and cost-effective industrial applications for integrated energy storage and conversion systems, such as urea fuel cells and hydrogen production from wastewater media, realizing the water treatment simultaneously.10To realize this appealing vision, nickel-based materials featuring easy preparation and tunable electronic structures were primarily chosen due to their transformation to form active Ni oxyhydroxide species by further modification.11,12 The conventional UOR pathway involves urea oxidation occurring after the electro-generation of dynamic active NiOOH sites.13,14 Urea molecules can react with NiOOH and regenerate active sites. Most recently, Qiao's group reported a Ni2Fe(CN)6 catalysts with a novel UOR pathway that the UOR process would occur before the self-oxidation reaction of Ni species (NSOR).15 The Ru–Co/NiO catalyst was also reported by Wang's group with an onset potential prior to the NSOR.16 Despite the emergence of those attractive high-performance electrocatalysts, it is worth noting that their catalysts can still convert into Ni hydroxides or their derivatives at a high potential and possess undesirable stability over long-term operation. Additionally, almost all investigations of UOR mechanisms focus on the condition of low urea concentration (Curea < CKOH = 1 M) due to the similar concentration of human urine (∼0.33 M),17 ignoring the structure-performance relationship in high urea concentrations (Curea > CKOH = 1 M), mostly consisting in the industrial wastewater.
Another pressing issue is the passivation phenomenon brought by the competing effect with the OER. Based on the study reported by Wang's group,18,19 Ni oxide/hydroxide undergoes the dehydrogenation process to form Ni(OH)O intermediates and simultaneously accept protons and electrons from urea to Ni(OH)O. However, the potential-dependent oxidation process of Ni species inevitably causes the accumulation of relatively low-activity NiOOH species as the applied potential increases. Meanwhile, the limited mass transfer at high potentials would probably cause the Ni(OH)O intermediates not to be promptly reduced by urea, thus resulting in the formation of NiOOH species. Due to shared active sites with the OER at high potentials,20,21 the supply of active NiOOH species plays a crucial role in resolving the passivation phenomenon (Fig. 1a). Particularly, this undesirable current depletion issue was also dissected by our previous studies and could be effectively surmounted by supplying sufficient active NiOOH species through pre-activation.22 Additionally, the accumulation of active NiOOH species could be significantly suppressed in high urea concentrations due to rapid reduction by urea, posing challenges in sustaining high UOR activity. Despite many pioneering works devoted to modulating the dynamic active NiOOH sites, there are still issues with unclear UOR mechanisms, applicable in various practical scenarios, which motivates us to develop a viable engineering strategy focusing on boosting the generation of dynamic active sites and obtain an unequivocal and in-depth understanding of the structure-performance relationship for the guidance of subsequent catalyst design.
 | ||
| Fig. 1 Schematic illustration of current issues and our solutions. (a) Competing issue caused by insufficient active sites. (b) The highlight of Ru1–Ni(OH)2 catalysts and its reaction mechanism in low and high urea concentrations. | ||
Atomic heterostructure engineering strategies have recently gained attention to fix issues over the electrocatalytic process. Atomically dispersed metal catalysts (SACs) featuring an identifiable structure, easily regulable electronic structures, and high atom utilization efficiency are promising candidates as compared to metal particles to catalyze the UOR.23–25 However, achieving desirable SACs still poses great challenges,26–28 involving the controllable synthesis, clarifying the origin of activity, and obtaining high durability without dissolution. Herein, we proposed a unique single-atomic catalyst with Ru–O4 moiety anchored on nickel hydroxide (Ru1–Ni(OH)2). The as-proposed catalyst possessed outstanding activity and prominent durability in energy conversion systems, superior to recently reported catalysts for small molecule oxidation. The in situ spectroscopic observations and DFT calculations confirmed that introducing atomic Ru sites could remarkably actuate the formation of active NiOOH species to mitigate passivation issues and effectively regulate the electronic structures. Moreover, it was discovered that the capture of protons and electrons in urea molecules was evidenced as the rate-determining steps in low urea concentrations; the electrochemical process of proton deintercalation from the lattice to form active Ni oxyhydroxides mainly determined the reaction rate in high urea concentrations (Fig. 1b). Ru1–Ni(OH)2 catalysts with abundant dynamic Ni3+ active sites exhibit superior UOR activity in both low and high urea concentrations as compared to Ni(OH)2. As-prepared catalysts hold great promise to advance the lab-to-fabrication translation of the electrochemical technologies for energy conversion.
Results
Synthesis and characterization
A series of Ru1–Ni(OH)2 catalysts with diverse feed amounts of Ru precursors were synthesized on the surface of nickel foam (NF) by a modified hydrothermal method. The X-ray diffraction (XRD) patterns of as-prepared catalysts were well-identified as a single bulk phase of α-Ni(OH)2 (Fig. S1a, ESI†). By using microwave plasma atomic emission spectrometers (MP-AES), the loading mass of Ru was identified to be 31.6, 40.6, and 65.8 μg cm−2 when utilizing 5 mg, 10 mg, and 15 mg Ru precursor, respectively (Fig. S1b, ESI†). Scanning electron microscope (SEM) images (Fig. S2, ESI†) show that nanosheets were densely and uniformly formed, covering the surface of NF. The nanosheet-like Ni(OH)2 structure was further confirmed by high-resolution TEM (HRTEM) characterization and selected area electron diffraction (SAED) pattern (Fig. 2a). The corresponding energy dispersive spectroscopy (EDS) mapping images demonstrate the uniform distribution of Ru, Ni, and O elements in Ru1–Ni(OH)2 catalysts (Fig. S3, ESI†). High-angle annular dark-field scanning transmission electron microscopy (HAADF-STEM) images further verify lattice spacing distance of 0.259 nm of Ni(OH)2 (Fig. 2b). Thereafter, the Ru species at the atomic level were visualized by the local intensity profiles of HAADF-STEM images. The atomically dispersed Ru with higher Z-contrast exhibits a stronger scattering ability to incident electrons than Ni atoms, thus exhibiting brighter spots.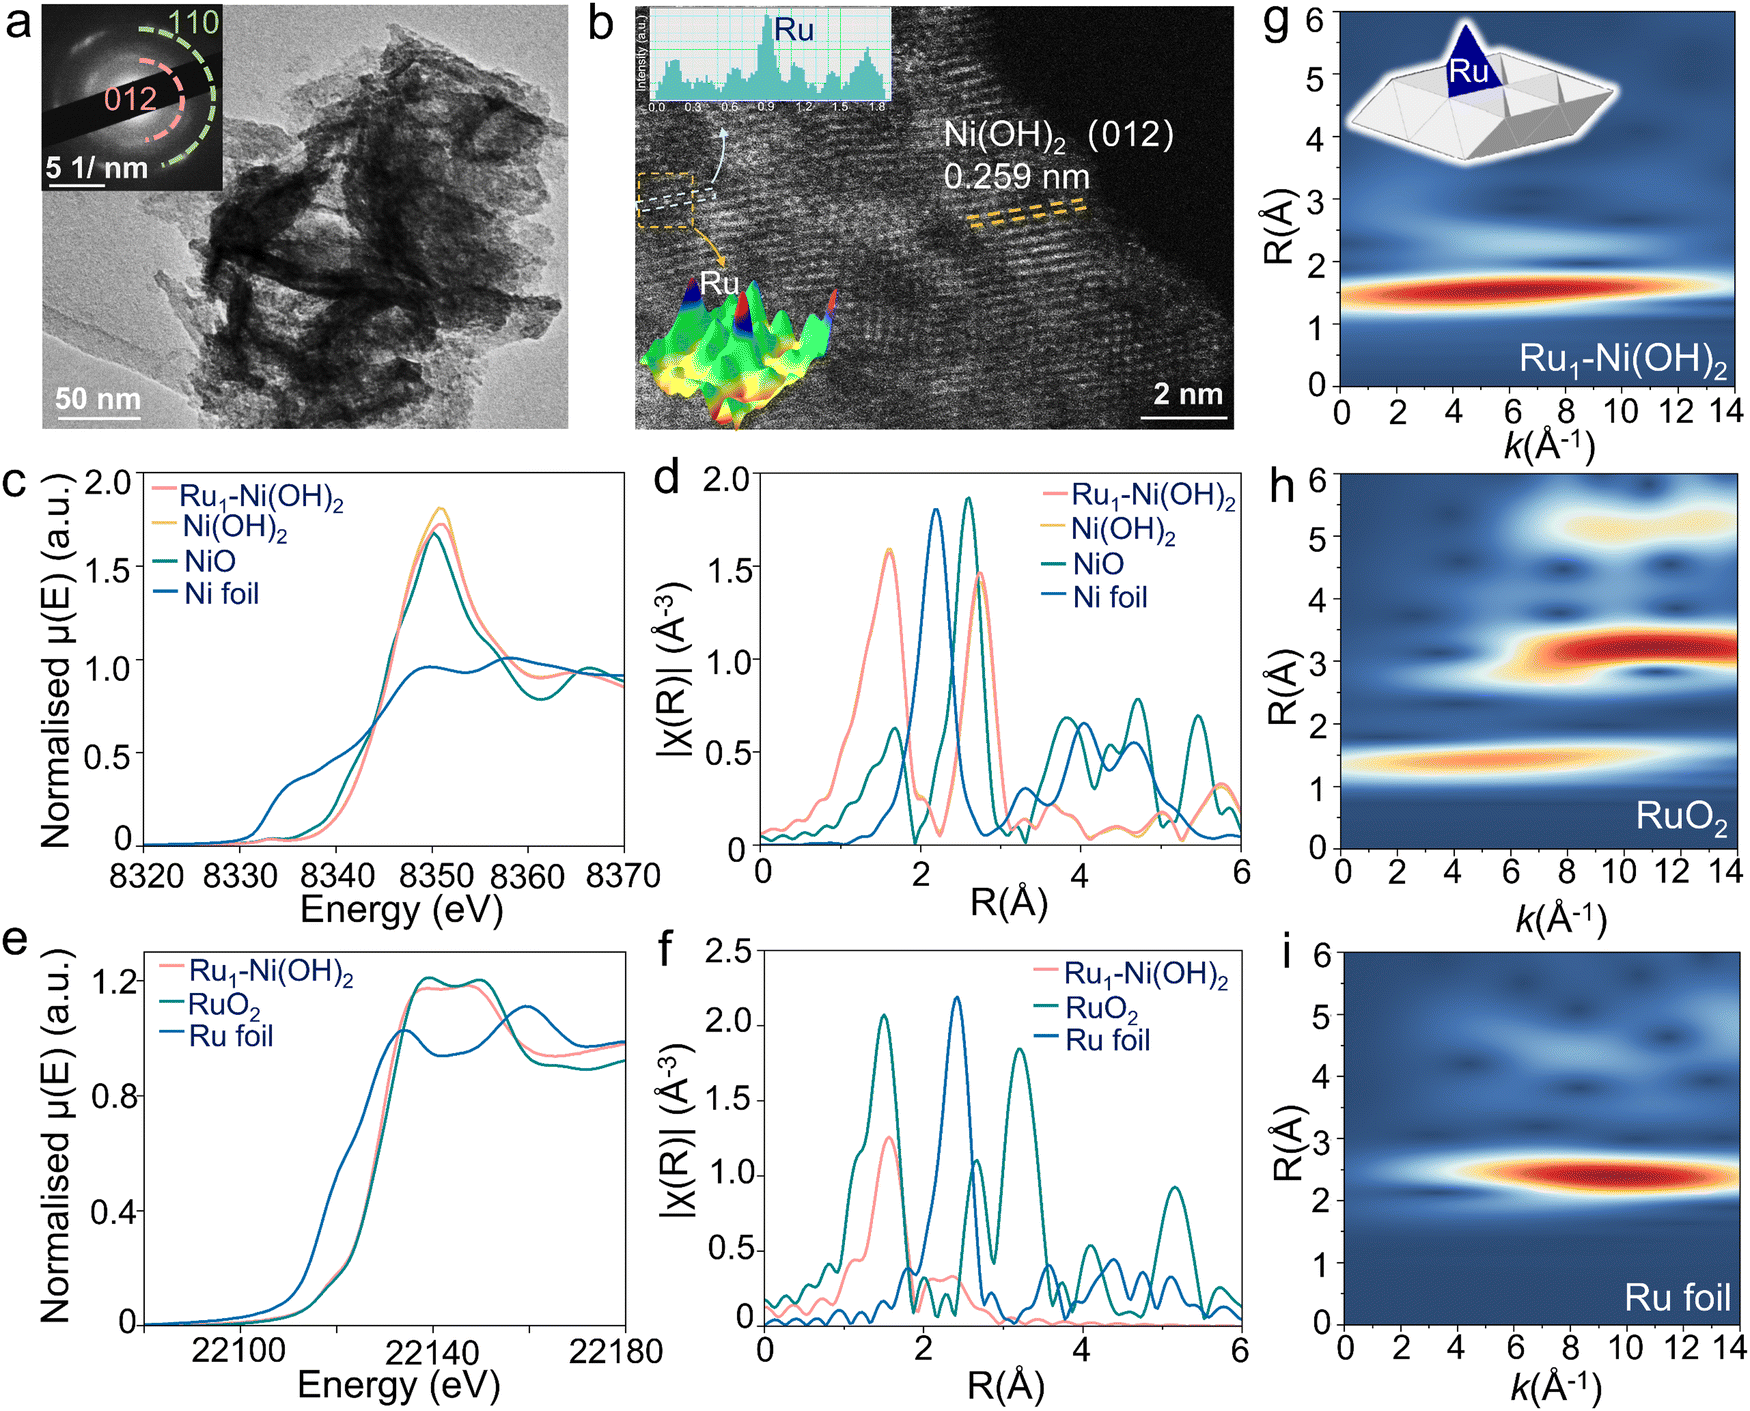 | ||
| Fig. 2 Structural analysis. (a) HRTEM image and corresponding SAED pattern of Ru1–Ni(OH)2. (b) The HAADF-STEM image of Ru1–Ni(OH)2. (c) Normalized Ni K-edge XANES for Ru1–Ni(OH)2, Ni(OH)2, NiO and Ni foil. (d) Ni K-edge k2-weighted R-space EXAFS for Ru1–Ni(OH)2, Ni(OH)2, NiO (plotted as 1/3 intensity) and Ni foil (plotted as 1/3 intensity). (e) Normalized Ru K-edge XANES for Ru1–Ni(OH)2, RuO2 and Ru foil. (f) Ru K-edge k2-weighted R-space EXAFS for Ru1–Ni(OH)2, RuO2 and Ru foil (plotted as 1/2 intensity). (g)–(i) k2-weighted WT-EXAFS for Ru1–Ni(OH)2, RuO2 and Ru foil, respectively. | ||
X-ray absorption fine structure spectroscopy was subsequently adopted for chemical state and electronic structure analysis, including X-ray absorption near edge structure (XANES) and extended X-ray absorption fine structures (EXAFS). The Ni K-edge XANES of Ru1–Ni(OH)2 (Fig. 2c) displays nearly identical absorption edge position and edge features compared to Ni(OH)2 reference material, as well as the EXAFS spectrum (Fig. 2d), suggesting that the bulk phase of Ni species are Ni (2+) in the form of Ni(OH)2. The Ru K-edge XANES indicates that Ru species are dominated by Ru (4+), as the edge peak positions are in line with that of RuO2 (Fig. 2e).
Interestingly, based on the EXAFS fitting results (Fig. 2f and Fig. S4, Table S1, ESI†), the Ru–O scattering distance in the first coordination shell for Ru1–Ni(OH)2 is 2.05 ± 0.01 Å, which is noticeably longer than those in the RuO2 with 2 Ru–O bonds at 1.94 Å and 4 of elongated Ru–O at 1.99 Å. Meanwhile, the coordination number for this Ru–O scattering path is only 4.1 ± 0.3, indicating that the Ru species are not in the typical 6-coordinated octahedral coordination geometry. Moving to the second coordination shell, the peak position in the Wavelet-transformed EXAFS (WT-EXAFS) for Ru1–Ni(OH)2 is located around k = 7.5 Å−1, while typical Ru–Ru coordination dominates the k range between 9–12 Å−1, suggesting that the backscatter in this coordination shell should be a lighter atom than Ru. Fitting the second shell using Ru–Ni scattering instead of Ru–Ru in the model could give a much better fitting result. In addition, the obtained Ru–Ni distance from the fitting model is 2.70 ± 0.02 Å, which is much shorter than the shortest Ru–Ru distances in ruthenium oxides (>3.1 Å).
The coordination number of Ru–Ni based on the fitting results (3.0 ± 0.5) also implies that these Ru species are not randomly distributed on the surface of Ni(OH)2, as their coordination environment in the second shell is strongly confined by the lattice structure of Ni(OH)2. By comparing the coordination number and the bond distances obtained from both Ru K-edge and Ni K-edge EXAFS, the possibility that the Ru species are the substitution of Ni sites in the Ni(OH)2 structure could also be excluded. Impressively, this result is in good agreement with the HAADF-STEM observation, substantiating the well-dispersion nature of the atomic Ru species. Therefore, based on the EXAFS fitting model and the crystal structure of Ni(OH)2, it is deduced that the Ru atoms are anchored on top of the tetrahedral void, with 4 of Ru–O coordination and 3 of Ru–Ni coordination in the first and second shells, respectively.
Electrochemical performance analysis
In light of this unique structural feature, the UOR performance of Ru1–Ni(OH)2 catalysts on carbon paper (Ru1–Ni(OH)2-CP) was determined in 1 M KOH with 0.33 M urea. The Ru1–Ni(OH)2 catalyst manifests relatively higher activity with lower onset potential to drive the UOR according to the linear scanning voltammetry (LSV) curve (Fig. 3a). It is worth noting that the passivation phenomenon with current collapse appears in LSV curves was observed for both Ru1–Ni(OH)2 and Ni(OH)2 catalysts with the increase of potentials. To uncover this potential-dependent interfacial electron charge transfer behavior in different phases, the in situ electrochemical impedance spectroscopy (EIS) observation during the OER and UOR was carried out respectively (Fig. S5, ESI†). The paired peaks in the Bode plot (Fig. 3b) can be observed in 1 M KOH at 1.45 V vs. RHE and the phase angle corresponding to the high-frequency interface remarkably decreases when the potential reaching 1.5 V vs. RHE, signifying the increase of the reaction rate.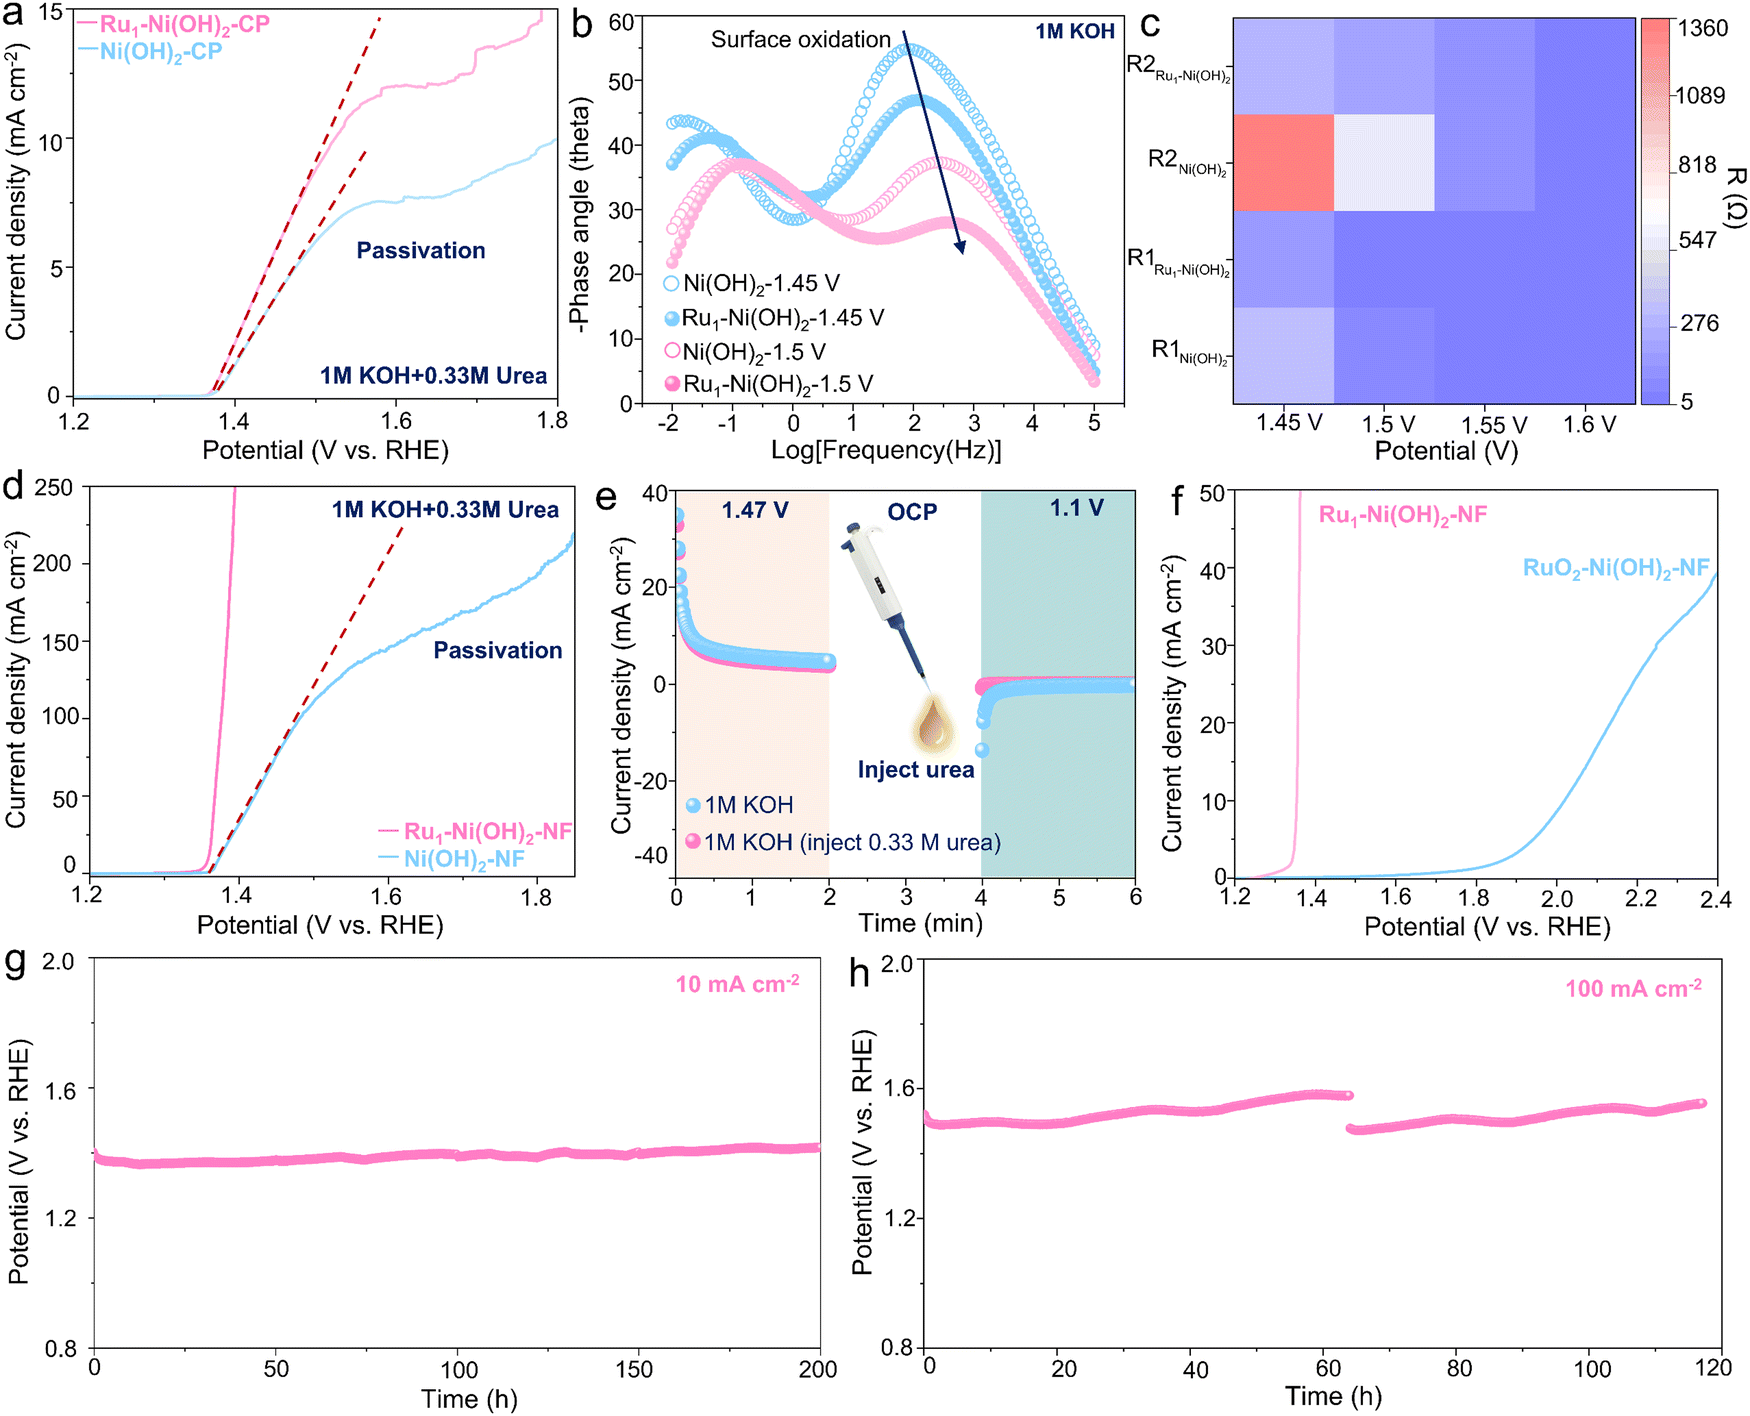 | ||
| Fig. 3 Electrochemical performance of UOR. (a) LSV curves of ink catalysts on carbon paper. (b) In situ EIS results. (c) Equivalent resistance. (d) LSV curve of free-standing catalysts on nickel foam. (e) Intermittent UOR test. (f) LSV curves of Ru1–Ni(OH)2–NF and RuO2–Ni(OH)2–NF catalysts during UOR. (g)–(h) Stability test at 10 and 100 mA cm−2 over 200 and 100 h. | ||
While the Ru1–Ni(OH)2 catalyst exhibits a smaller phase angle than that of Ni(OH)2. Meanwhile, the diameter of the semicircle in the Nyquist plot is smaller. According to the previous studies by Wang's group,18 the Ni(OH)2 would be electrochemically oxidized to NiOOH species at high frequency in the OER system (Fig. S6a, ESI†). The equivalent resistance of high-frequency-interface reaction (R1) and low-frequency-interface reaction (R2) exhibits smaller values when incorporating atomic Ru sites (Fig. 3c), corroborating that Ru1–Ni(OH)2 could effortlessly undergo the Ni species oxidation reaction (NSOR) to form NiOOH species with higher charge transfer rate. In the UOR system, only one response appears in the Nyquist plot before 1.5 V vs. RHE. However, when the potential rises to 1.55 V vs. RHE, the phase angle starts to increase in low frequency, which agrees well with previous studies by Wang's group (Fig. S6b, ESI†) that the passivation phenomenon occurs with a conspicuous depletion in current density as discovered in the LSV curve (Fig. 3a). Interestingly, Ru1–Ni(OH)2 possesses smaller phase angle and semicircle in the low frequency than that of Ni(OH)2 at high potentials (Fig. S5g and h, ESI†). Additionally, the interfacial adsorption of OH− species was responsible for the formation of NiOOH species.29,30 It was recognized that the adsorption energy of OH− on Ru1–Ni(OH)2 (−0.98 eV) is relatively higher than that of Ni(OH)2 (−0.56 eV), probably indicating a strong OH− adsorption to boost the NSOR process (Fig. S7, ESI†).
As compared to the powder catalysts on carbon paper, the self-standing catalysts on nickel foam can significantly facilitate exposure of active sites. It is noted that the passivation phenomenon cannot be recognized from the LSV curve of Ru1–Ni(OH)2 on the nickel foam (Ru1–Ni(OH)2–NF) (Fig. 3d), substantiating that the passivation issues of Ni(OH)2 could effectively be suppressed. The Ru1–Ni(OH)2–NF with more active sites required 1.37 V vs. RHE to drive the current densities of 100 mA cm−2 and yielded a much smaller Tafel slope (12.6 mV dec−1), suggesting rapid UOR kinetics (Fig. S8a, ESI†). Furthermore, the potential under the current density of 100 mA cm−2 was negatively shifted by 282 mV as compared to the OER (Fig. S8b, ESI†). The feed amounts of Ru precursor (10 mg) was confirmed with the promising ratio between current and loading mass, which is 6 A mg−1 at 1.39 V vs. RHE (Fig. S8c and d, ESI†), demonstrating good commercial feasibility.
To evaluate the role of atomic Ru sites on dynamic Ni3+ active species generation ability, the faradaic charge transfer for Ni2+ to Ni3+ was measured in 1 M KOH (Fig. S9a and b, ESI†). Incorporating atomic Ru sites can impressively lower the potential of the Ni3+ active species formation and exhibit higher Ni3+ concentration as compared to Ni(OH)2–NF. Additionally, when measured in 1 M KOH and 0.33 M urea, this oxidation peak overlapped with the UOR region. The reduction peak of cyclic voltammetry (CV) curves related to Ni3+ to Ni2+ for Ru1–Ni(OH)2 showcases a stronger and more negative trend than Ni(OH)2, further demonstrating enriched Ni3+ species when introducing atomic Ru sites (Fig. S9c, ESI†). Moreover, the electrochemically active surface area (ECSA) is proportional to the electrochemical double-layer capacitance (Cdl). The Cdl of Ru1–Ni(OH)2–NF is 4.23 mF cm−2, nearly two times higher than Ni(OH)2–NF (Fig. S9d–f, ESI†), substantiating superior ECSA via incorporating atomic Ru sites.
To identify the electrochemical process of the UOR, the intermittent UOR test was subsequently performed by separating the process of proton deintercalation from the catalyst lattice and the urea dehydrogenation (Fig. 3e). An oxidation current related to the deintercalation of protons to form NiOOH species was first observed in 1 M KOH at 1.47 V vs. RHE for 2 min. The urea was then injected during the open circuit potential (OCP) and a cathodic potential of 1.1 V vs. RHE was subsequently applied. Interestingly, no reduction current was observed. However, the notable reduction current emerged when no urea was added. This result implies that the electrogenerated oxyhydroxide species could accept protons from urea at OCP and transform to hydroxide spontaneously, and thus no reduction current could be found. RuO2 was further adopted as the control sample with typical Ru–O6 coordination configuration and drop-casted on Ni(OH)2–NF. It can be perceived that the onset potential of Ru–O6/Ni(OH)2–NF is around 1.8 V vs. RHE, signifying undesirable activity compared to Ru1–Ni(OH)2-NF (Fig. 3f). Furthermore, the Ru1–Ni(OH)2–NF catalyst also possessed high activity and stability for other small molecules, including methanol and ethanol (Fig. S10, ESI†). Potentials to drive current density of 100 mA cm−2 for oxidation of urea, methanol and ethanol were the lowest among most recently reported electrocatalysts (Table S2, ESI†). The chronopotentiometry response at 10 and 100 mA cm−2 over 200 and 100 h (Fig. 3g and h) further demonstrates high durability without notable performance degradation.
Determination of the role of atomic Ru sites
To further unearth the origin of high UOR performance brought by atomic Ru sites, in situ spectroscopic identification and DFT calculations were conducted. In situ attenuated total reflection surface-enhanced IR absorption spectroscopy (ATR-SEIRAS) measurement was first carried out to evaluate the electrochemical process at the molecular level (Fig. S11a, ESI†). The peak located at 1650 and 1700 cm−1 can be found, corresponding to the vibration of N–H and C![[double bond, length as m-dash]](https://www.rsc.org/images/entities/char_e001.gif) O of urea molecules in the electrolyte.15 The FTIR bands at 3730, 3700, 3630, and 3600 cm−1 are attributed to the adsorption vibration of the OH− species.31 The bands at 1460 and 2349 cm−1 are ascribed to CO32− and the asymmetric stretch of CO2.32 Intriguingly, as the potential increases, the consumption of OH− species and adsorption of urea molecules are notably rapid on the surface of Ru1–Ni(OH)2 catalysts compared to Ni(OH)2, concomitant with the emerging CO2 and CO32− species (Fig. 4a and b). The FTIR spectra during one-hour urea electrolysis at 1.37 V vs. RHE further substantiate that OH− species consumption and urea molecule adsorption gradually enhance, generating the products of CO2 and CO32− species (Fig. S11b, ESI†). The above findings validate that introducing atomic Ru sites can remarkably boost the OH− adsorption to generate active NiOOH species and thus expedite the UOR (Fig. 4c).
O of urea molecules in the electrolyte.15 The FTIR bands at 3730, 3700, 3630, and 3600 cm−1 are attributed to the adsorption vibration of the OH− species.31 The bands at 1460 and 2349 cm−1 are ascribed to CO32− and the asymmetric stretch of CO2.32 Intriguingly, as the potential increases, the consumption of OH− species and adsorption of urea molecules are notably rapid on the surface of Ru1–Ni(OH)2 catalysts compared to Ni(OH)2, concomitant with the emerging CO2 and CO32− species (Fig. 4a and b). The FTIR spectra during one-hour urea electrolysis at 1.37 V vs. RHE further substantiate that OH− species consumption and urea molecule adsorption gradually enhance, generating the products of CO2 and CO32− species (Fig. S11b, ESI†). The above findings validate that introducing atomic Ru sites can remarkably boost the OH− adsorption to generate active NiOOH species and thus expedite the UOR (Fig. 4c).
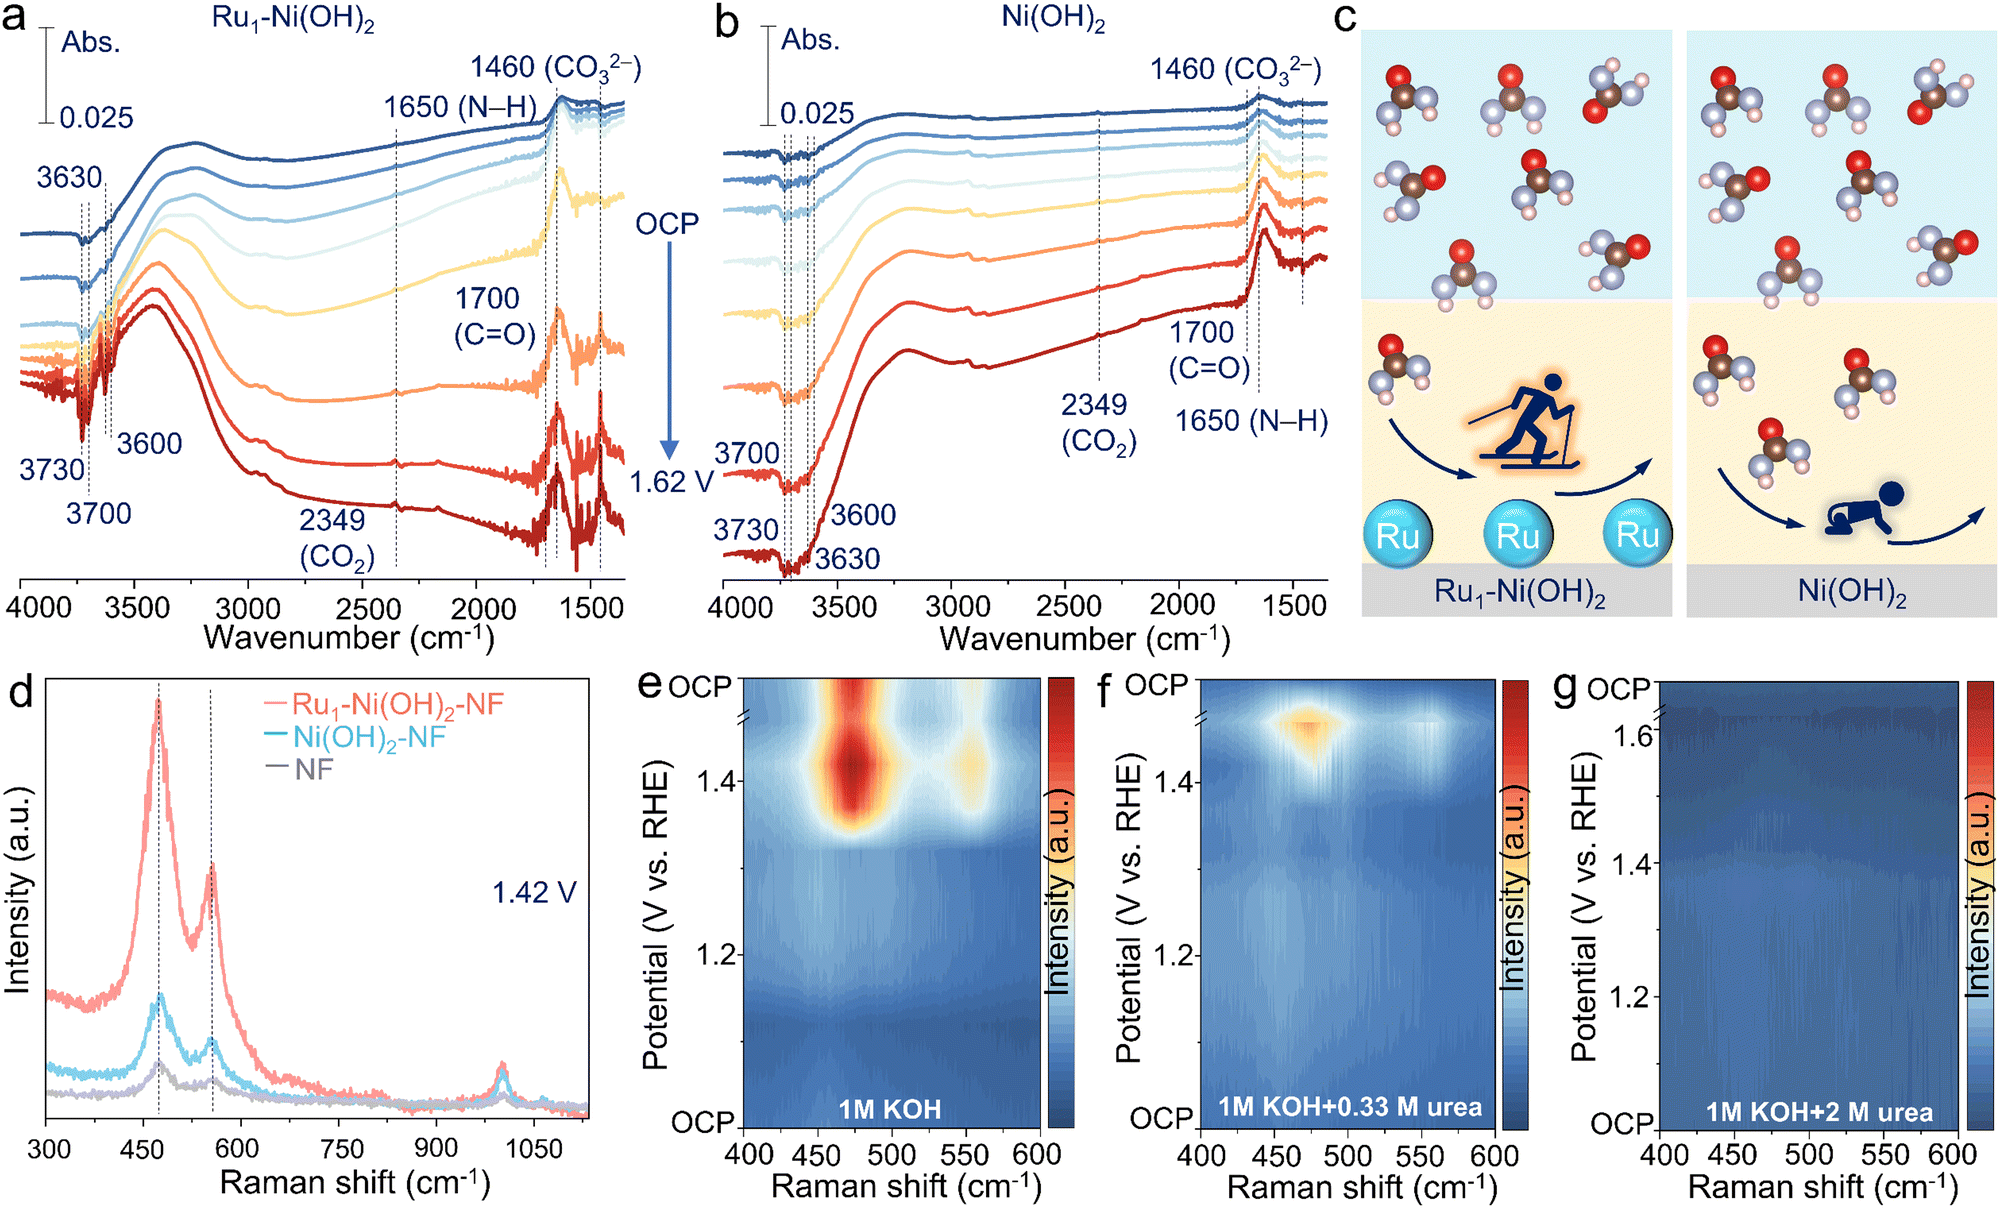 | ||
| Fig. 4 In situ observation of electrochemical processes. (a)–(c) ATR-SEIRAS results for Ru1–Ni(OH)2 and Ni(OH)2. (d) Raman spectra results for Ru1–Ni(OH)2, Ni(OH)2, and nickel foam. (e)–(g) Raman spectra results under different urea concentrations. | ||
The evolution of active oxyhydroxide species can be further deciphered by in situ Raman observations (Fig. S12a, ESI†). Two peaks at 474 and 553 cm−1, emerging from 1.42 V vs. RHE for Ru1–Ni(OH)2, Ni(OH)2 and pristine nickel foam (NF), correspond to the bending and stretching vibration mode of Ni3+–O in NiOOH active species33 (Fig. S12b–d, ESI†). Impressively, Ru1–Ni(OH)2 possesses remarkably abundant NiOOH active species with strong signal compared to the control samples under identical conditions during the UOR (Fig. 4d). When the applied potential is back to OCP, the initial peaks assigned to NiOOH species are no longer discernible, implying that the electrogenerated oxyhydroxide species could transform to hydroxide via accepting protons from urea at OCP, which is consistent with above results of intermittent UOR test (Fig. 3e). As for the Raman spectra during the OER (Fig. 4e and Fig. S13a, ESI†), two peaks of NiOOH species emerge when the applied potential reached 1.37 V vs. RHE. However, the Ni3+–O peaks were not generated until the applied potential reached 1.42 V vs. RHE in the electrolyte of 1 M KOH + 0.33 M urea (Fig. 4f), indicating that protons generated from the urea dehydrogenation reaction would intercalate into the oxyhydroxide site and suppress the accumulation of Ni(OH)O intermediates to further form NiOOH species. When the applied potential gradually increased to 1.42 V vs. RHE, the accumulated NiOOH species could not be promptly reduced by urea to Ni(OH)2, thus resulting in the accumulation of NiOOH. Correspondingly, accumulated NiOOH species were discerned as time evolved due to the rapid urea consumption and limited mass transfer (Fig. S13b, ESI†). Therefore, the UOR rate in low urea concentration is limited by urea dehydrogenation.
Furthermore, it was detected that the high concentration of urea (2 M) can inhibit the phase transition of the Ni species without the conspicuous peaks of NiOOH emerging throughout the electrochemical potential window (Fig. 4g and Fig. S14a, ESI†). Electrogenerated NiOOH species during OER would be reduced after changing the electrolyte with 2 M urea at OCP (Fig. S14b, ESI†), signifying that the accumulation of NiOOH species was suppressed and the UOR was limited by the active Ni oxyhydroxide formation. This trend was also demonstrated in methanol and ethanol oxidation reactions (Fig. S15, ESI†). Additionally, despite the increase of the potential to drive the current density over 100 mA cm−2 in high urea concentration, Ru1–Ni(OH)2 still exhibits lower overpotential and higher reduction current density related to NiOOH species than Ni(OH)2–NF (Fig. S16a and b, ESI†). Although the rate-determining step (RDS) is the active Ni oxyhydroxide formation in high urea concentrations, atomic Ru sites could efficiently sustain high UOR activity in high urea concentrations.
To confirm the Ru sites after reactions, the samples after 20 cycles of CV during OER and UOR were collected (Fig. S17a, ESI†). As confirmed by XPS spectra of Ru 3p3/2, the peak of pristine samples at 463.2 eV can be ascribed to Ru (4+), which is in line with the result of Ru K-edge XANES. Most importantly, the intensity of Ru 2p3/2 after OER is significantly weaker compared with pristine samples. However, the post-UOR samples still possess a strong intensity of Ru (4+) peak without notable shift (Fig. S17b, ESI†). The morphologies of post-OER samples present flower-liked spheres with agglomeration of the nanosheets. This open and porous structure can aggravate the OH− attack on the atomic Ru sites, resulting in undesirable dissolution. However, negligible variations in morphologies after UOR can be found (Fig. S18, ESI†). These results can be attributed to the urea dehydrogenation process to inhibit the continuous NiOOH accumulation and further structural reconstruction. Therefore, long-term operational stability with high activity could be realized by properly balancing dynamic active sites formation and urea dehydrogenation process.
Based on the above discussion, DFT calculations were performed based on the NiOOH model as the dynamic active species to further unravel the role of single atomic Ru. Bader charge discrepancy between the NiOOH and Ru1–NiOOH demonstrates that Ni atoms would be harder to lose electrons when anchoring single atomic Ru, thus featuring an electron-enriched state (Fig. S19, ESI†). Differential charge density further substantiates an electron depletion region (green region) around the Ru atom. It has been reported that ‘electron-donating’ groups (–NH2) in the reactant would be preferentially adsorbed on the positive region and the negative region would attract ‘electron-withdrawing’ groups (CO).17 Therefore, the redistributed charge density of metal sites regulates electron transfer after introducing single atomic Ru and favors the urea splitting process.
Applications in the energy conversion systems
To evaluate the universality of as-prepared catalysts to substitute OER with UOR in the energy conversion systems, the cycling measurement of zinc–air battery and zinc–urea–air battery was first conducted. The charging process in Zn–air battery usually involves the OER and the reduction of Zn2+ in the positive and negative electrode, respectively. While the OER in the Zn–urea–air battery is replaced by the UOR during the charging process. The charging polarization curve of the battery demonstrates that adding urea to the electrolyte can remarkably lessen the charging voltage (Fig. S20, ESI†). The cycling stability test during 100 h further exhibits about 200 mV reduction in the charging voltage than that of the Zn–air battery (Fig. 5a).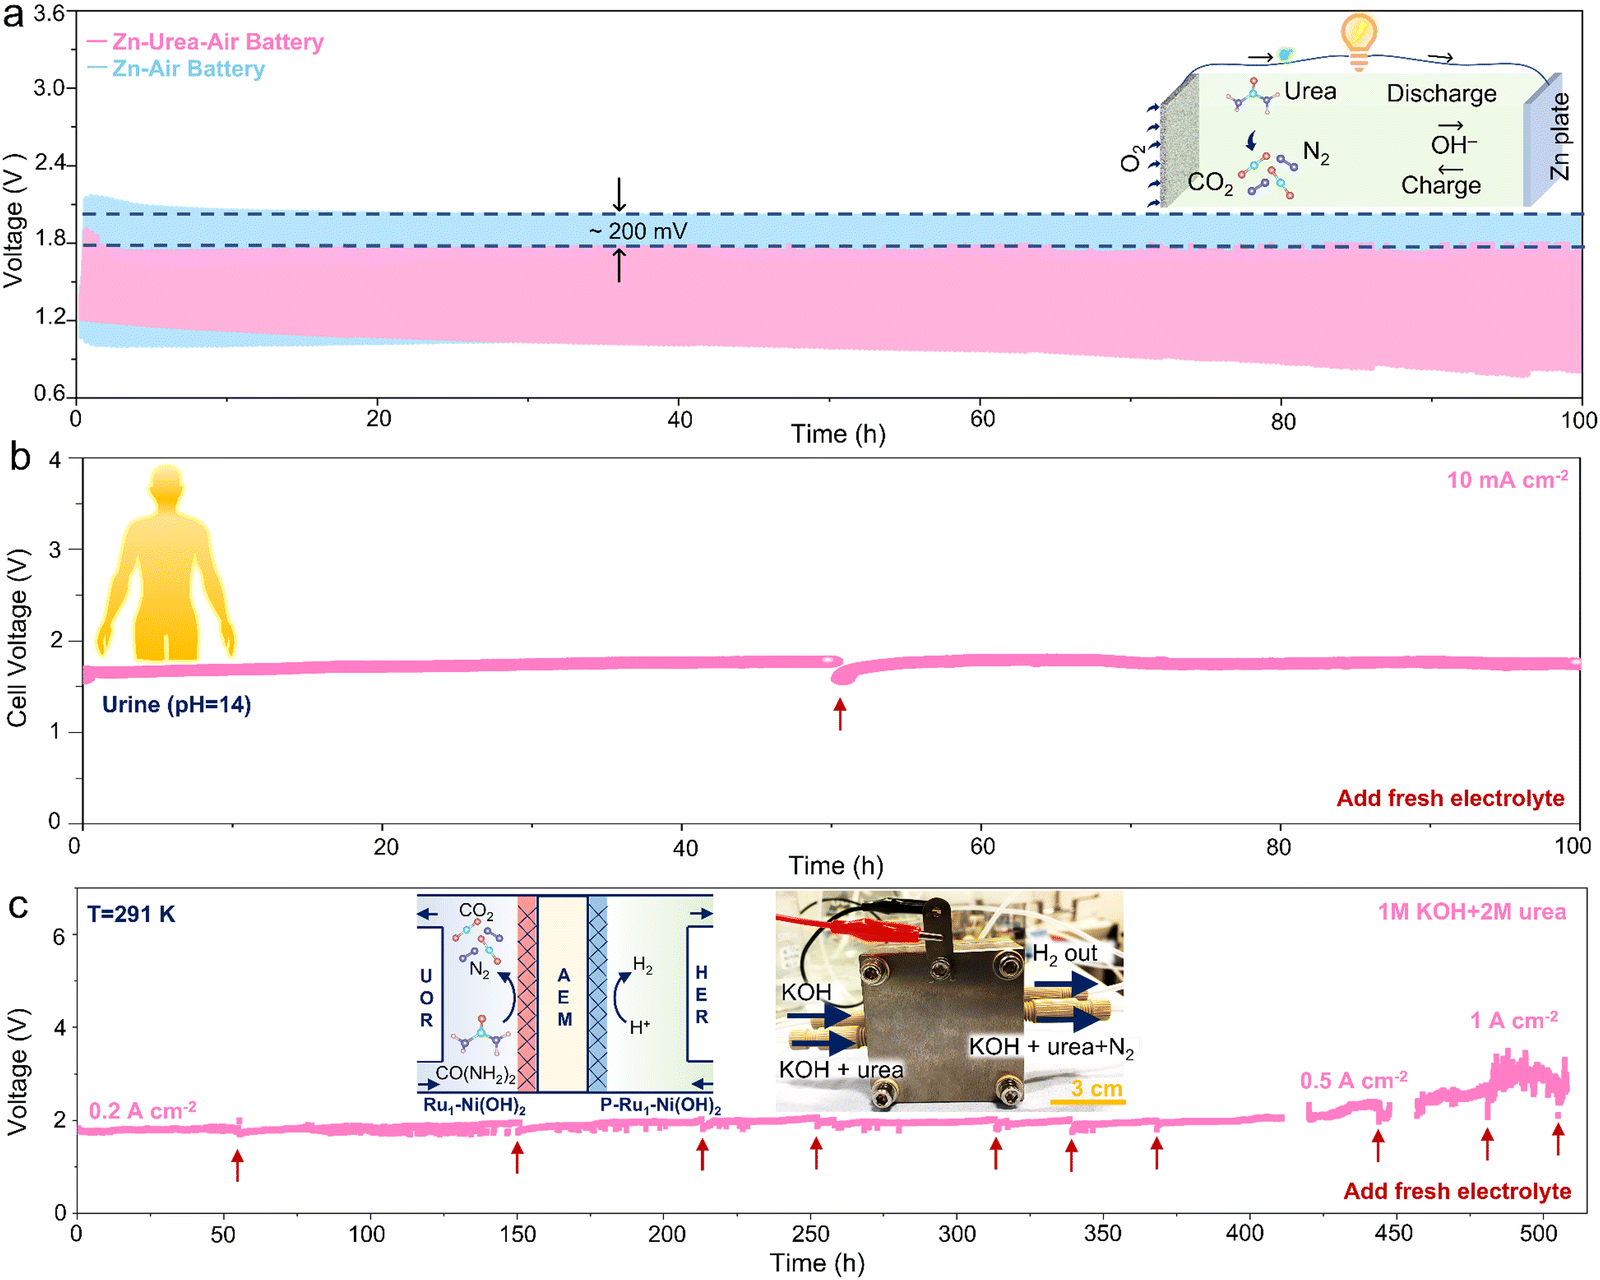 | ||
| Fig. 5 Applicability in energy storage and conversion system. (a) Cycling measurement (current density of 5 mA cm−2) for Zn–air battery and Zn–urea–air battery; (b) alkaline urine electrolysis at 10 mA cm−2; (c) urea-assisted hydrogen production under industrial-level current densities in MEA system. | ||
Furthermore, urea-assisted hydrogen production has a promising vision for large-scale application and clean energy generation by directly utilizing urea-bearing wastewater. To improve the electrical conductivity and obtain highly active hydrogen evolution electrocatalysts, the as-prepared samples were further phosphorized to form heterogeneous Ni phosphides (Fig. S21, ESI†). The heterogeneous Ni phosphides catalysts manifest superior HER performance with high activity and stability compared to the commercial Pt/C benchmark catalyst (Fig. S22, ESI†). The two-electrode test equipped with the anode (Ru1–Ni(OH)2) and cathode (P-Ru1–Ni(OH)2) displays that urea-assisted strategy can effectively reduce the cell voltage and the as-prepared catalysts possess higher activity and stability than Pt/C and RuO2 benchmarks (Fig. S23, ESI†). Due to the abundant and easily accessible urea source, alkaline urine was then selected as the electrolyte to estimate the applicability for practical scenarios.
The as-prepared electrodes also show higher activity than the benchmark catalyst (Fig. S24, ESI†). More importantly, negligible performance attenuation during the chronopotentiometry test at 10 mA cm−2 over 100 h was achieved (Fig. 5b). Impressively, the membrane electrode assembly (MEA) was prepared to evaluate the superiority of urea-assisted hydrogen production under industrial-level current densities (Fig. S25, ESI†). The chronopotentiometry measurement was conducted at 0.2, 0.5, and 1 A cm−2 for over 400 h. It is noted that little performance depletion can be observed, indicating promising candidates for extensive practical applications.
Conclusions
In conclusion, a single atomic Ru catalyst anchored on Ni hydroxides was proposed to mitigate the passivation issues and exhibit wide applicability in various practical scenarios. The as-prepared catalyst exhibits preeminent activity with an ultralow Ru loading mass of 40.6 μg cm−2. Moreover, remarkable long-term durability tests of 100 h Zn–urea–air battery operation, 100 h alkaline urine electrolysis, and over 400 h hydrogen production in MEA system under industrial-level current density. Combined with in situ spectroscopic observations and DFT calculations, the anchored atomic Ru sites can effectively boost the generation of dynamic active NiOOH sites and regulate the charge distribution to facilitate urea splitting. In the condition of low urea concentration, the proton deintercalation from the Ni hydroxide lattice occurred more rapidly than the urea dehydrogenation reaction during UOR, and thus the rate-determining step was the capture of protons and electrons in the urea; while in high urea concentration, the accumulation of NiOOH species is suppressed, and the electrochemical process of proton deintercalation from the lattice to form active Ni oxyhydroxides was the rate-determining step. Despite the suppression of dynamic active NiOOH sites in high urea concentrations, the high UOR activity can still be sustained as compared to Ni(OH)2. It is believed that our findings offer an innovative research paradigm for future directions of the field and open new horizons for the community to design optimal catalysts in energy storage and conversion systems.Methods
Synthesis of catalysts
The Ru1–Ni(OH)2 catalyst was prepared by a facile hydrothermal method. Briefly, 365 mg Ni(NO3)2·6H2O, 10 mg RuCl3·xH2O, and 240 mg urea were dissolved in 30 mL distilled water. The as-prepared solution and the cleaned nickel foam (4 cm × 2 cm, thickness of 1 mm) were placed in a Teflon-lined stainless-steel autoclave (100 mL) and then underwent hydrothermal reaction at 120 °C for 12 h. When back to room temperature, the as-obtained samples were washed in distilled (DI) water and ethanol to remove loosely attached powder and then dried in the vacuum oven at 60 °C for 10 h. The precipitates were further collected and dried in the vacuum oven at 60 °C to gain the powder samples. The Ni(OH)2 catalyst was fabricated without adding the Ru source according to our previous work.34The P-Ru1–Ni(OH)2 catalyst was synthesized by further phosphorization. Specifically, the Ru1–Ni(OH)2 on the nickel foam was placed in the tube furnace and 1 g NaH2PO2 was placed on the upstream side. The whole setup was flushed with N2 for 10 min, which was followed by heating to 300 °C with a ramping rate of 10 °C min−1 and maintained at 300 °C for 1 h. When back to room temperature, the as-obtained samples were washed in distilled water and ethanol and then dried in the vacuum oven at 60 °C for 10 h.
Benchmark electrodes were prepared by drop-casting the ink containing 1 mg commercial Pt/C, 300 μL ethanol, and 20 μL Nafion on carbon paper and dried in air. The RuO2 electrode was prepared with a similar operation.
Characterization
The morphology was characterized by the scanning electron microscope (SEM, JEOL LSM 7600) and transmission electron microscope (JEOL, JEM-2100). STOE SEIFERT diffractometer (Mo source radiation) was used to record XRD patterns. XPS (Thermo scientific K-alpha photoelectron spectrometer) analysis was used with the calibration of 284.8 eV for C 1s. An Agilent 4210 MP-AES was used to analyze the Ru loading mass.High-resolution aberration-corrected scanning transmission electron microscopy (STEM) images were acquired using a probe-corrected (CEOS) JEOL ARM300CF electron microscope (JEOL, Japan) at the electron Physical Science Imaging Centre (ePSIC) E02 beamline of Diamond Light Source (UK). An electron probe with a beam current of 46.5 pA and a 31 mrad convergence semi-angle was used at 80 kV acceleration voltage. ABF (annual bright field) and ADF (annual dark field) signals were acquired with collection semi-angles of 12–26 mrad and 74–155 mrad, respectively. For each sample, the powder was dispersed on a 400-mesh Cu grid with lacey carbon film using ethanol and then backed inside a vacuum chamber at 60 °C for 15 minutes. Each sample was exposed to an intense electron beam for 10–15 minutes (‘beam shower’) to eliminate the accumulation of carbon contamination during the STEM imaging. Gatan Microscopy Suite software was used for image data acquisition.
The Ru K-edge and Ni K-edge XAFS characterizations were performed at P65 beamline of PETRA III (Germany).35 For Ru K-edge measurements, the X-ray beam was sourced from the 5th harmonic radiation from the 11-periods undulator and then monochromatized by a Si (311) double crystal monochromator. For Ni K-edge measurements, the 3rd harmonic radiation from the undulator and a Si (111) monochromator was used. The XAFS spectra at both Ru K-edge and Ni K-edge were collected in transmission mode, and the intensity of the incident beam (I0) and the transmitted beam (It) was monitored by ionization chambers. The XAFS of each sample was measured 3 times and merged to improve the signal-noise ratio. Ru foil or Ni foil was measured simultaneously for each sample as the reference for energy calibration. The energy of the incident beam was calibrated by assigning the energy of the first inflection in the first derivative XANES of Ru foil to 22![[thin space (1/6-em)]](https://www.rsc.org/images/entities/char_2009.gif) 117 eV or the first derivative XANES of Ni foil to 8333 eV for Ru K-edge and Ni K-edge measurements, respectively. The XAFS spectra were analyzed using the Demeter software package (including Athena and Artemis programs, version 0.9.26).36 The WT-EXAFS spectra are processed using the Cauchy wavelet function in the Larch python library (version 0.9.72).37,38 Pre-edge background subtraction and post-edge normalization of the XAFS data were performed using the Athena program. A linear regression background was determined, and a quadratic polynomial regression for post-edge normalization was applied. The fitting of EXAFS spectra was performed using the Artemis program based on scattering paths generated from FEFF6. The amplitude reduction factor S02 is determined to be 0.67 for Ru K-edge and 0.83 for Ni K-edge by fitting of k2-weighted R-space EXAFS of Ru foil and Ni foil respectively and was used as fixed parameters for the EXAFS fitting of other samples.
117 eV or the first derivative XANES of Ni foil to 8333 eV for Ru K-edge and Ni K-edge measurements, respectively. The XAFS spectra were analyzed using the Demeter software package (including Athena and Artemis programs, version 0.9.26).36 The WT-EXAFS spectra are processed using the Cauchy wavelet function in the Larch python library (version 0.9.72).37,38 Pre-edge background subtraction and post-edge normalization of the XAFS data were performed using the Athena program. A linear regression background was determined, and a quadratic polynomial regression for post-edge normalization was applied. The fitting of EXAFS spectra was performed using the Artemis program based on scattering paths generated from FEFF6. The amplitude reduction factor S02 is determined to be 0.67 for Ru K-edge and 0.83 for Ni K-edge by fitting of k2-weighted R-space EXAFS of Ru foil and Ni foil respectively and was used as fixed parameters for the EXAFS fitting of other samples.
Electrocatalytic measurement
The three-electrode setup with 1 M KOH solution and 0.33 M urea was used for electrochemical measurements. The Ag/Ag Cl (sat. KCl) was adopted as the reference electrode and the graphite rod was utilized as the counter electrode. The as-prepared samples were used as the working electrode. Specifically, to rule out the effect of nickel foam substrate, the ink containing 4 mg powder catalysts, 20 μL Nafion, and 300 μL ethanol was drop-cast on the carbon paper and dried in air. Cyclic voltammetry (CV) and linear sweep voltammetry (LSV) tests were performed with Gamry Interface 1000 potentiostat. Polarization curves were collected at a scan rate of 5 mV s−1 with IR compensation. All the potentials were converted versus the reversible hydrogen electrode (RHE) according to ERHE = EAg/AgCl + 0.197 + 0.059 pH. Tafel slopes were determined by fitting the linear regions of the Tafel plots according to the Tafel equation (η = b logj + a) by replotting the polarization curves. Chronopotentiometry measurement was used to evaluate the stability with the agitation of electrolytes (400 rpm). The in situ electrochemical impedance spectroscopy (EIS) measurements were performed at the frequency range from 10−2 to 105 Hz under variable potentials. All electrochemical tests were conducted at room temperature. The electrolyte of 1 M KOH without urea was used for OER evaluation.
Rechargeable Zn–air and Zn–urea–air batteries were equipped with a polished Zn plate (negative electrode) and mixed catalysts ink (1 mg Ru1–Ni(OH)2 and 1 mg Pt/C, 20 μL Nafion, and 300 μL ethanol) drop-casted on the carbon paper (positive electrode). The fresh electrolyte containing urea was added every 10 h to rule out the effect of rapid urea consumption.
MEA measurements were conducted with a setup including two stainless steel plates that have circular serpentine channels (1 cm−2). The Ru1–Ni(OH)2 and P-Ru1–Ni(OH)2 were employed as the anode and cathode electrodes. The anion exchange membrane (Sustainion X37-50 Grade 60) was selected as the membrane. The high concentration of 1 M KOH and 2 M urea was adopted as the electrolyte.
In situ ATR-SEIRAS measurement
The spectra were collected by using the FT-IR spectrometer (Thermo Scientific Nicolet iS50) equipped with an MCT-A detector in an electrochemical cell. The gold (Au) film was first prepared on a silicon (Si) prism by a similar method.39 Specifically, the Si prism was polished with Al2O3 and washed with DI water, which was followed by immersing the Si prism in 40 wt% NH4F for 5 min and washed with DI water again. Subsequently, the Si prism was transferred to a hot plate (60 °C). After 10 min, 0.5 mL 0.03 M NaAuCl4, 0.5 mL solution A (containing 0.3 M Na2SO3, 0.1 M Na2S2O3, and 0.1 M NH4Cl) and 0.5 mL solution B (containing 0.5 mL 8 wt% NaF and 30 μL 98 wt% H2SO4) were mixed and dropped 1 mL mixed solution on the heated Si prism and left for ∼60 s. Accordingly, the Au film-deposited Si prism was washed with DI water. The catalyst inks, containing a 4 mg sample in 0.3 mL ethanol and 20 μL of Nafion, were drop-casted on the Au film-deposited Si prism surface (constrained by an O ring with 8 mm) as the working electrode. Pt foil and Ag/AgCl electrodes were utilized as counter and reference electrodes, respectively. 1 M KOH with and without 0.33 M urea were chosen as the electrolyte, respectively. The resolution of 4 cm−1 and scan number of 128 were used to collect the spectra.In situ Raman measurement
The spectra were obtained by the Bruker Senterra Raman spectrometer with wavelengths of 532 nm and power of 12.5 mW. The integration time, co-addition number, and resolution were set at 6000 ms, 3, and 1.5 cm−1, respectively. The self-standing catalyst on Nickel foam was used as the working electrode, the Ag/AgCl electrode as the reference electrode, and the Pt wire was used as the counter electrode. 1 M KOH with and without 0.33 M urea and 1 M KOH with 2 M urea were chosen as the electrolyte, respectively.DFT calculation
Density functional theory (DFT) calculations were performed in the Vienna ab initio simulation package (VASP) with the projector augmented wave (PAW) pseudopotential.40 Generalized gradient approximation (GGA) of Perdew–Burke–Ernzerhof (PBE) functional41 was employed to describe the exchange and correlation interactions. The van der Waals interaction is considered by the empirical correction of Grimme's scheme (DFT-D3)42 and the cut-off energy for plane waves was set to 500 eV. The Brillouin zone is sampled with a 3 × 3 × 1 k-point grid for all calculations. The implicit solvent model was employed to consider the effect of the solvent environment using VASP sol code.43Author contributions
J. Z., I. P. P., and G. H. conceived the project and devised experiments; J. Z. prepared the materials and conducted all experimental studies; L. K. and L. L. performed the X-ray spectroscopy and electron microscopy characterizations; X. S. and Q. Z. performed theoretical calculations; G. H. and I. P. P. directed this project. I. P. P., G. H., D. B., and P. S. supervised the project. J. Z. wrote the manuscript. J. Z., W. Z., J. F., F. G., K. L., and L. M. provided suggestions and guidance for this project.Conflicts of interest
There are no conflicts to declare.Acknowledgements
The authors would like to thank the Engineering and Physical Sciences Research Council (EPSRC, EP/V027433/3), UK Research and Innovation (UKRI) under the UK government's Horizon Europe funding guarantee (101077226; EP/Y008707/1) and the Royal Society (RGS\R1\211080; IEC\NSFC\201261; IES\R2\212115). The authors acknowledge electron Physical Science Imaging Centre instrument E02 (Proposal No. MG32058 and MG33118) at Diamond Light Source for the allocated experiment session. The authors acknowledge the P65 beamline at PETRA III for the allocated XAFS experiment session (proposal No. I-20220137). J. C. Z thanks the funding support from China Scholarship Council/University College London for the joint PhD scholarships.References
- X. Wu, Y. Wang and Z.-S. Wu, Chem, 2022, 8, 2594–2629 CAS.
- J. Li, H. Li, K. Fan, J. Y. Lee, W. Xie and M. Shao, Chem. Catal., 2023, 3, 100638 CrossRef CAS.
- B. Zhu, B. Dong, F. Wang, Q. Yang, Y. He, C. Zhang, P. Jin and L. Feng, Nat. Commun., 2023, 14, 1686 CrossRef CAS PubMed.
- T. Wang, X. Cao and L. Jiao, Angew. Chem., Int. Ed., 2022, 61, e202213328 CrossRef CAS PubMed.
- L. Zhu, J. Huang, G. Meng, T. Wu, C. Chen, H. Tian, Y. Chen, F. Kong, Z. Chang, X. Cui and J. Shi, Nat. Commun., 2023, 14, 1997 CrossRef CAS PubMed.
- J. Wang, B. Zhang, W. Guo, L. Wang, J. Chen, H. Pan and W. Sun, Adv. Mater., 2023, e2211099 CrossRef PubMed.
- X. Xu, Q. Deng, H.-C. Chen, M. Humayun, D. Duan, X. Zhang, H. Sun, X. Ao, X. Xue, A. Nikiforov, K. Huo, C. Wang and Y. Xiong, Research, 2022, 2022, 9837109 CAS.
- Y. Zhu, C. Liu, S. Cui, Z. Lu, J. Ye, Y. Wen, W. Shi, X. Huang, L. Xue, J. Bian, Y. Li, Y. Xu and B. Zhang, Adv. Mater., 2023, e2301549 CrossRef PubMed.
- M. Cai, Q. Zhu, X. Wang, Z. Shao, L. Yao, H. Zeng, X. Wu, J. Chen, K. Huang and S. Feng, Adv. Mater., 2023, 35, e2209338 CrossRef PubMed.
- C. J. Huang, H. M. Xu, T. Y. Shuai, Q. N. Zhan, Z. J. Zhang and G. R. Li, Small, 2023, e2301130 CrossRef PubMed.
- P. Wang, X. Bai, H. Jin, X. Gao, K. Davey, Y. Zheng, Y. Jiao and S. Z. Qiao, Adv. Funct. Mater., 2023, 33, 2300687 CrossRef CAS.
- C. F. Li, L. J. Xie, J. W. Zhao, L. F. Gu, H. B. Tang, L. Zheng and G. R. Li, Angew. Chem., Int. Ed., 2022, 61, e202116934 CrossRef CAS PubMed.
- W. K. Han, J. X. Wei, K. Xiao, T. Ouyang, X. Peng, S. Zhao and Z. Q. Liu, Angew. Chem., Int. Ed., 2022, 61, e202206050 CrossRef CAS PubMed.
- L. Zhang, L. Wang, H. Lin, Y. Liu, J. Ye, Y. Wen, A. Chen, L. Wang, F. Ni, Z. Zhou, S. Sun, Y. Li, B. Zhang and H. Peng, Angew. Chem., Int. Ed., 2019, 58, 16820–16825 CrossRef CAS PubMed.
- S.-K. Geng, Y. Zheng, S.-Q. Li, H. Su, X. Zhao, J. Hu, H.-B. Shu, M. Jaroniec, P. Chen, Q.-H. Liu and S.-Z. Qiao, Nat. Energy, 2021, 6, 904–912 CrossRef CAS.
- X. Zheng, J. Yang, P. Li, Z. Jiang, P. Zhu, Q. Wang, J. Wu, E. Zhang, W. Sun, S. Dou, D. Wang and Y. Li, Angew. Chem., Int. Ed., 2023, 62, e202217449 CrossRef CAS PubMed.
- L. Wang, Y. Zhu, Y. Wen, S. Li, C. Cui, F. Ni, Y. Liu, H. Lin, Y. Li, H. Peng and B. Zhang, Angew. Chem., Int. Ed., 2021, 60, 10577–10582 CrossRef CAS PubMed.
- W. Chen, C. Xie, Y. Wang, Y. Zou, C.-L. Dong, Y.-C. Huang, Z. Xiao, Z. Wei, S. Du, C. Chen, B. Zhou, J. Ma and S. Wang, Chem, 2020, 6, 2974–2993 CAS.
- W. Chen, L. Xu, X. Zhu, Y. C. Huang, W. Zhou, D. Wang, Y. Zhou, S. Du, Q. Li, C. Xie, L. Tao, C. L. Dong, J. Liu, Y. Wang, R. Chen, H. Su, C. Chen, Y. Zou, Y. Li, Q. Liu and S. Wang, Angew. Chem., Int. Ed., 2021, 60, 7297–7307 CrossRef CAS PubMed.
- J. W. Zhao, C. F. Li, Z. X. Shi, J. L. Guan and G. R. Li, Research, 2020, 2020, 6961578 CAS.
- J.-W. Zhao, H. Zhang, C.-F. Li, X. Zhou, J.-Q. Wu, F. Zeng, J. Zhang and G.-R. Li, Energy Environ. Sci., 2022, 15, 3912–3922 RSC.
- R. Lin, L. Kang, T. Zhao, J. Feng, V. Celorrio, G. Zhang, G. Cibin, A. Kucernak, D. J. L. Brett, F. Corà, I. P. Parkin and G. He, Energy Environ. Sci., 2022, 15, 2386–2396 RSC.
- Y. Wang, X. Zheng and D. Wang, Nano Res., 2021, 15, 1730–1752 CrossRef.
- Y. Gao, B. Liu and D. Wang, Adv. Mater., 2023, e2209654 CrossRef PubMed.
- C.-F. Li, T.-Y. Shuai, L.-R. Zheng, H.-B. Tang, J.-W. Zhao and G.-R. Li, Chem. Eng. J., 2023, 451, 138618 CrossRef CAS.
- T. Sun, W. Zang, J. Sun, C. Li, J. Fan, E. Liu and J. Wang, Adv. Funct. Mater., 2023, 33, 2301526 CrossRef CAS.
- Y. Liu, C. Li, C. Tan, Z. Pei, T. Yang, S. Zhang, Q. Huang, Y. Wang, Z. Zhou, X. Liao, J. Dong, H. Tan, W. Yan, H. Yin, Z. Q. Liu, J. Huang and S. Zhao, Nat. Commun., 2023, 14, 2475 CrossRef CAS PubMed.
- X. Mu, X. Gu, S. Dai, J. Chen, Y. Cui, Q. Chen, M. Yu, C. Chen, S. Liu and S. Mu, Energy Environ. Sci., 2022, 15, 4048–4057 RSC.
- Q. Qian, X. He, Z. Li, Y. Chen, Y. Feng, M. Cheng, H. Zhang, W. Wang, C. Xiao, G. Zhang and Y. Xie, Adv. Mater., 2023, e2300935 CrossRef PubMed.
- S. Sun, X. Zhou, B. Cong, W. Hong and G. Chen, ACS Catal., 2020, 10, 9086–9097 CrossRef CAS.
- Y.-X. Pan, D. Mei, C.-J. Liu and Q. Ge, J. Phys. Chem. C, 2011, 115, 10140–10146 CrossRef CAS.
- K. L. Kauffman, J. T. Culp, A. Goodman and C. Matranga, J. Phys. Chem. C, 2011, 115, 1857–1866 CrossRef CAS.
- Y. Qi, Y. Zhang, L. Yang, Y. Zhao, Y. Zhu, H. Jiang and C. Li, Nat. Commun., 2022, 13, 4602 CrossRef CAS PubMed.
- J. Zhang, X. Song, L. Kang, J. Zhu, L. Liu, Q. Zhang, D. J. L. Brett, P. R. Shearing, L. Mai, I. P. Parkin and G. He, Chem. Catal., 2022, 2, 3254–3270 CrossRef CAS.
- E. Welter, R. Chernikov, M. Herrmann and R. Nemausat, 2019.
- B. Ravel and M. Newville, J. Synchrotron Radiat., 2005, 12, 537–541 CrossRef CAS PubMed.
- M. Newville, J. Phys. Conf. Ser., 2013, 430, 012007 CrossRef CAS.
- M. Munoz, P. Argoul and F. O. Farges, Am. Mineral, 2003, 88, 694–700 CrossRef CAS.
- G. Liu, Q. T. Trinh, H. Wang, S. Wu, J. M. Arce-Ramos, M. B. Sullivan, M. Kraft, J. W. Ager, J. Zhang and R. Xu, Small, 2023, e2301379 CrossRef PubMed.
- P. E. Blochl, Phys. Rev. B: Condens. Matter Mater. Phys., 1994, 50, 17953–17979 CrossRef PubMed.
- J. P. Perdew, K. Burke and M. Ernzerhof, Phys. Rev. Lett., 1996, 77, 3865–3868 CrossRef CAS PubMed.
- H. Schroder, A. Creon and T. Schwabe, J. Chem. Theory Comput., 2015, 11, 3163–3170 CrossRef PubMed.
- K. Mathew, R. Sundararaman, K. Letchworth-Weaver, T. A. Arias and R. G. Hennig, J. Chem. Phys., 2014, 140, 084106 CrossRef PubMed.
Footnotes |
| † Electronic supplementary information (ESI) available. See DOI: https://doi.org/10.1039/d3ee03258b |
| ‡ J. C. Z, J. X. Z, L. Q. K, and Q. Z contributed equally to this work. |
| This journal is © The Royal Society of Chemistry 2023 |