The critical role of electricity storage for a clean and renewable European economy†
Received
21st August 2023
, Accepted 22nd September 2023
First published on 29th September 2023
Abstract
A fully renewable Europe is a major climate goal and an assumed priority by the European Union. However, intermittent renewables require hefty backup power sources to compensate for sudden generation shortfalls, ensuring grid stability and balance across time and geography. In this study, we employ a simulation-based algorithm to demonstrate the critical role of short- and long-term electricity storage in augmenting European renewable penetration (+65pp), while avoiding massive investments in generation overcapacity (from 157% in Sweden up to 800% in Denmark). We evaluate various battery and power-to-gas solutions, elucidating the differences among competing technology options that are deemed promising for utility-scale energy storage. The transition to renewable-based generation and storage necessitates a substantial scale-up of short-term storage, equivalent to 0.1% of the annual electricity demand in Europe (0.05% in interconnected grids), and approximately 6.5% of the annual electricity demand for long-term storage (3.5% in interconnected grids). The cost of electricity storage accounts for 30% of the overall global Levelized Cost of Electricity (LCOE), with an average LCOE of 165 EUR per MWh when countries are isolated and 135 EUR per MWh for an interconnected Europe. Such a transformative shift holds the promising prospect of achieving an average reduction of 90% in grid carbon intensity across all European nations, with reductions ranging from 29% for Belgium to an impressive 95% for Poland.
Broader context
The establishment of resilient and economically viable energy systems grounded in renewable power generation depends upon the capacity to store electricity. This work outlines a comprehensive framework for developing large-scale national and interconnected power grids in Europe. It emphasizes the importance of both short- and long-term energy storage solutions while accounting for the unique energy needs of individual European countries. In this context, the electrification of future European households, services, and transportation sectors is taken into account, aligning with the long-term transition trajectories defined by the European Commission. We derive the costs of electricity generation in each European country, ranging from 74 EUR per MWh in Sweden to 282 EUR per MWh in Belgium, whereas electricity emissions span from 28 gCO2-eq per kWh in Slovakia to 152 gCO2-eq per kWh in Belgium. Moreover, our findings show that in the future energy mix, wind-based technologies emerge as the predominant source of electricity generation in Europe, contributing to 73% of the total output. Confronting the variability of renewable energy sources presents two fundamental strategies: either augmenting electricity generation capacity or prioritizing storage solutions. Our results underscore that strategies predicated solely on over-provisioning solar and wind power may not be universally tenable at the country level.
|
1 Introduction
In OECD countries, approximately 55.3% of electricity generation is derived from fossil fuels (49.5% in EU-28), while renewable and nuclear sources account for 23.8% (28.4% in EU-28) and 17.7% (25.5% in EU-28) respectively.1,2 The use of renewable sources for electrical power generation is growing considerably, registering an increase of 8.3% in wind-derived production and 19.6% in solar between 2021 and 2022.3 In the same period, the carbon-equivalent intensity of the European grid decreased by 4.9% reaching 293.3 gCO2-eq per kWhel consumed. This is attributed to a 2.2 percentage point increase of the renewable share in the mix, which grew from 29.7% to 31.9%.4 Achieving carbon neutrality by 2050 imposes a scaleback of fossil fuels and increased electrification across major economic sectors. To handle an increasing electricity demand, many countries are already implementing policies promoting renewable energy (RE) use, prompting the decarbonization of the electricity grid.
Transitioning toward a fully renewable energy system calls for a holistic and integrated approaches,5 motivated by the uncertain nature of RE power generation. Indeed, the largest share of RE is weather-dependent with hourly, daily, and seasonal variations. Trondle et al.6 highlighted the complexity in assessing RE potential; depending on assumptions, European on-shore wind potential ranges from 4400 TWh per year to 45![[thin space (1/6-em)]](https://www.rsc.org/images/entities/char_2009.gif) 000 TWh per year; a similar uncertainty affects photovoltaic (PV) potential. The differences are due to the use of distinct exclusion areas, directly affecting potential. Nevertheless, there seems to be an increasing awareness that both technologies can satisfy future European electricity demand. A fully renewable and self-sufficient Europe has proved achievable at country level,6,7 based on substantial investment in renewable technologies and the allocation of considerable fractions of non-built-up land. Numerous reviews8–10 emphasize the feasibility – both technical and economic – of a renewable European energy system, with a growing number of publications addressing the increasing electrification of society sectors. Cross-sector flexibility11–13 and different storage strategies are pivotal to closing the supply-and-demand gap. Robust and affordable future energy systems based on RE rely on the capacity to store substantial amounts of electricity on both short (hours and days) and long (weeks and months) timescales, but ultimately rely on the ability to adopt and preserve self-sustaining (i.e. economically viable) system designs.14
000 TWh per year; a similar uncertainty affects photovoltaic (PV) potential. The differences are due to the use of distinct exclusion areas, directly affecting potential. Nevertheless, there seems to be an increasing awareness that both technologies can satisfy future European electricity demand. A fully renewable and self-sufficient Europe has proved achievable at country level,6,7 based on substantial investment in renewable technologies and the allocation of considerable fractions of non-built-up land. Numerous reviews8–10 emphasize the feasibility – both technical and economic – of a renewable European energy system, with a growing number of publications addressing the increasing electrification of society sectors. Cross-sector flexibility11–13 and different storage strategies are pivotal to closing the supply-and-demand gap. Robust and affordable future energy systems based on RE rely on the capacity to store substantial amounts of electricity on both short (hours and days) and long (weeks and months) timescales, but ultimately rely on the ability to adopt and preserve self-sustaining (i.e. economically viable) system designs.14
Onshore and offshore wind power15,16 and photovoltaics17 are the resources offering the highest renewable potential in Europe.6 Grid parity is achievable through proper generation site selection alongside optimised generation capacity, storage size and cost. Jacobson et al.18 showed a fully renewable energy system with an LCOE between 61 EUR per MWh (for Norway) and 159 EUR per MWh (for Luxembourg) and an average value of 83 EUR per MWh for Europe. This value reviews the 100 USD per MWh previously achieved for Europe proposed by the same author.19 Similarly, a recent study conducted by the Fraunhofer Institute for Solar Energy Systems,20 examined the LCOE for various renewable technologies. The study highlighted the significant uncertainty surrounding the future costs of these technologies in Germany. Projections indicated that hybrid PV and battery systems could fall below 120 EUR per MWh, while offshore wind power costs can reach 121 EUR per MWh. European projections pointed for onshore wind power plants between 31 and 49 EUR per MWh and 54 and 80 EUR per MWh for offshore power plants, without specifying exact locations.
A transition to a fully renewable regime will allow Europe and its country members to decarbonize the energy system while eliminating dependency on primary energy import, currently accounting for one-third of bloc electricity needs.21 In its perspectives for 2050,22 the European Union (EU) considers a 50% increase in electricity demand, including heating (using heat pumps) and mobility. Electrifying new demand is not only an opportunity to move from fossil fuels to renewable-based systems, but also to promote different storage options that balance the latter's intermittency. Conceiving and adequately evaluating a large-scale renewable system is only possible using a model that accurately reflects hourly variations.9,23–25
Energy storage devices prompt and support the integration of RE,6,26 not only by smoothing seasonal fluctuations of intermittent generation, absorbing peaks of electricity production and offering network transmission services, but also by avoiding the need for generation over-sizing. In daily and hourly time scales, short-term storage devices – such as batteries – can accommodate peak fluctuations of RE, by leveraging swift response rates and large power-to-energy ratios.26 In the same vein, Jacobson et al.27,28 recently demonstrated the feasibility of concatenating 4 hour batteries to provide long-term storage options. Sepulveda et al.29 remarked, however, that relying entirely on batteries to boost RE capacity is not a profitable strategy to promote decarbonisation. In the quest for continuous carbon intensity reduction of the electrical grid, and with CO2 emissions approaching zero, storage oversize promotes a steep increase in levelized cost of electricity (LCOE), due to the relatively high cost of batteries – still reaching hundreds of US dollars per kWh (between 175 and 200 USD per kWh as of 202230). Therefore, shifting supply and demand in the monthly or seasonal time frame should not be handled exclusively by batteries.29 The same reasoning is supported by Dowling et al.31 who assessed the feasibility of fully renewable energy systems using historical US weather data. Different technologies are used depending on time scale: batteries are more adequate for hourly and daily storage whereas long-term options, such as power-to-gas (P2G), are used for weekly and monthly storage. Indeed, the combination of short- and long-term storage options is particularly advantageous: batteries have a relatively low power-to-capacity ratio, while long-term storage options have lower energy-related costs, making them suitable to handle large amounts of energy but not to be used as grid regulators or on-demand technologies. Moreover, long-term storage renders full RE systems more affordable by reducing the need for the oversizing tendencies associated with exclusive short-term systems.31 Andrade et al.,32 Luderer et al.33 and Fambri et al.,34 have shown the complementary roles of batteries and P2G in decarbonizing full regions, focusing on the synergies that can be exploited in a multi-energy system, particularly the enhanced flexibility offered as grid ancillary services. Furthermore, a more diversified system is by definition more robust and able to cope with the disruption of material supply and different economic and macro-economic realities.
The future energy system is a medium- to long-term commitment, in which storage technologies ensure fully dispatchable RE, a crucial feature for ubiquitous adoption. The synergy of different storage options is a way to design flexible and robust solutions, mitigating technology risk and thus increasing reliability. Curiously however, short-term storage technologies are those receiving the bulk of scientific attention, development and government investment.26,31,35 The increasing penetration of renewable resources requires systems with greater (i.e. weeks to months) discharge time26,36 making them more competitive and able to harvest the increasing economic reward of grid arbitrage and reliability of supply.
There seems to be a lack of awareness of the impacts associated with storage options, particularly concerning the energy system configuration (i.e. the best combination of short- and long-term technologies), but also its operation and economics.26 For instance, Arbabzadeh et al.37 determined the most profitable storage technology combination for successful renewable penetration. While technologies with lower capital costs such as pumped-hydroelectric and compressed air storage were preferred, the time dimension of storage was disregarded and therefore the associated flexibility; Li-ion batteries, for example, were never deployed, even with ambitious renewable penetration goals and high emission taxes.
Whereas many studies address the design of the future energy system,12,14,25,26 few tackle the required seasonal storage size and operation, or use the adequate scale and level of granularity to propose feasible and robust designs at national and continental levels. Besides capital costs, frequently neglected parameters such as the lifetime of storage units as well as maintenance and operating costs ought not to be disregarded or arbitrarily selected. For instance, Sepulveda et al.38 have recently demonstrated that discharge efficiency and storage capacity costs are the most relevant performance parameters affecting the design of storage solutions when minimizing the total cost of the system.
1.1 Contribution and limitations
This work proposes a framework to model large-scale grid systems considering electrification of the energy end-use in European households, services and mobility sectors through the large-scale deployment of heat pumping and electric vehicles. Heating and mobility demand profiles are constructed using hourly traffic data and external temperature measurements for more than 150 weather stations in Europe. All system constraints, such as availability of resources, currently installed capacities and locally-dependent capacity factors are considered to ensure feasible and realistic designs of the grid. Both isolated and interconnected options of the energy system are proposed and compared using economic and environmental metrics. Different types of batteries (lead-acid, lithium-ion, vanadium and zinc flow) and power-to-gas (SNG and Hydrogen) are included to highlight differences among competing technology options deemed promising for utility-size energy storage. Different combinations of storage technologies and generation shares are explored using a trial-and-error simulation-based algorithm. Overall, the presented work takes into account a large number of variables (i.e. generation shares, storage technology choices) and metrics, including frequently overlooked environmental indicators (GWP100a, GWP20a, RE share, ecological footprint, ecological scarcity), to develop a single consistent framework for the design and operation of the European power grids. Our goal is to demonstrate how storage and large-scale networks would make the European economy more sustainable. This work builds upon the set of existing literature by considering a high level of detail and numerous features that are often disregarded, such as storage losses.
Concerning limitations and major assumptions: (i) nuclear energy was not considered, given that it relies on a finite fuel supply and thus cannot be considered renewable; (ii) decommissioning costs were disregarded given their low (below 2%) contribution to total cost;27 (iii) 2022 was chosen as the typical year, which might emphasize specific weather phenomena; (iv) grid reinforcement investments required to handle and increase in renewable penetration were disregarded; (v) the scaling of generation profiles followed a historically fixed shape and uncertainty was neglected at the level of renewable energy availability; (vi) although the latest costs were used, renewable technologies have experienced an accelerated cost reduction in recent years, considerably greater than previously predicted.39 Thus, the costs and storage requirements were fitted to distribution functions, which could potentially result in an overestimation of LCOE; (vii) the improvement in capacity factors for various technologies was not factored in, possibly leading to overestimated electricity production capacities.
2 Methodology
2.1 Electricity generation and demand
A fully renewable electricity mix is considered, which is composed of hydro power technologies, such as run-of-river and water reservoirs, offshore and onshore wind generation, and solar photovoltaics. Hourly generation profiles are constructed for each resource using 2022 as a reference year. The hourly data are fetched from the ENTSO-E public API4 for each European country and validated (or if needed adjusted), using the annual cumulative generation provided by Eurostat40 and the Swiss Federal Office of Energy (SFOE)41–43 for the same year (Table A1, ESI†).
The currently installed capacities per production type are mostly obtained from the aggregated values of the ENTSO-E database.44 Alternative data sources43,45–65 are used whenever the installed capacities are either inaccurate or not available from ENTSO-E. Moreover, generation shares40 are used to exclude pumped hydro storage from the aggregated capacities, and in the case of Italy66 and France67 to estimate the total installed generation of run-of-river facilities. The current capacities of each hydro power resource in Switzerland are calculated using the data published by the SFOE41 (Table A2, ESI†).
The generation profiles are further validated by comparing the calculated capacity factors to the average values observed in the reviewed literature.68,69 Whenever the annual average capacity factor of a technology falls outside the validity range, a correction factor is applied to the generation profile to ensure consistency with the literature (Table A3, ESI†).
Renewable energy potentials.
Renewable energy potentials at national level were retrieved from the open ENSPRESO database70 for solar (rooftops and facades with 100% artificial and 3% non-artificial land) and wind resources. For hydro, Bodis et al.71 together with studies carried out by the European Commission72,73 were used. The former considers GIS-based land restriction, geo-spatial wind speed and irradiation data, and the maximum electricity production from renewable sources was derived considering EU-wide low restrictions, such as low setback distance for wind turbines (Table A4, ESI†).
Although the potential of photovoltaic and offshore wind are non-zero in some countries, their penetration in the current mix may be zero due to a lack of adoption. Hourly generation data are not available in such cases, therefore average solar and wind offshore profiles are used to account for future installations of these two technologies. Such profiles are constructed aggregating all normalised generations of the European countries where solar and offshore wind are currently installed.
Residential and services sectors.
The hourly electricity demand profile is constructed assuming full electrification of the residential, service and mobility sectors (Table A5, ESI†). The current hourly electricity consumption is retrieved from the ENTSO-E database and heating demand is satisfied by mechanical heat pumping. Space heating and domestic hot water preparation are included in the heating demand using the final energy consumption data of the residential and service sectors from Eurostat.74,75 The heating degree index76 is used to describe the need for space heating depending on the severity of the cold on an hourly basis, which is calculated assuming a base temperature of 15 °C and a cut-off temperature of 18 °C as described by domain-specific standards.76 Hourly values of the external air temperature are fetched from a weather API77 for more than 150 weather stations located in the most populated areas of Europe (Table A6, ESI†). A single average temperature profile is built for each country weighting the profiles by the population78 of the corresponding cities. The hourly thermal profile for space heating is estimated using the heat transfer equations of domestic hydronic systems,79 assuming supply and return temperatures of 55 °C and 45 °C, respectively. Finally, the air temperature-variant coefficient of performance is calculated and used to estimate the total electricity demand associated with heat pumping. The same procedure is followed to calculate the energy requirement for domestic hot water, with a requirement of 65 °C that ensures appropriate sanitary conditions. Changes in heating degree days or additional cooling requirements, such as those due to global warming or other climate events, were disregarded.
Mobility.
The total energy demand of mobility is retrieved from EU statistics,80 considering road and freight transport, and excluding aviation, which is negligible energy-wise. The hourly demand profiles are obtained assuming full electrification of private and public transportation (electric cars, buses and trains). They may not necessarily represent the power demand profiles of battery electric vehicles, as charging and discharging profiles differ from each other. However, as the profiles are significantly affected by the driver's behaviour and type of (re)charging station, the reverse of traffic measurement data81,82 were used for simplification. In other words, the charging demand profile is inversely correlated with the traffic.
Cost data of generation technologies.
The capital and the maintenance costs of the generation technologies are obtained from the literature. Different research studies and technical reports are reviewed to construct cost distributions, with precedence given to more recent work. Costs associated with commissioning new PV facilities are mostly taken from Lazard's levelized cost of energy analysis,83 the technical report provided by the IRENA3 and the most recent EIA's energy outlook.84 The same reports are used to obtain the cost of wind-based technologies, with the addition of the NREL study on the future of renewable energies85 as well as other sources.58,86–89
Unlike solar and wind, the cost of hydro power is affected by high variability. Adding capacity to existing dams is significantly less expensive than commissioning new projects in remote sites with poor infrastructure. Although advancements in civil engineering will most likely drive expenses lower, the cost reduction of hydro generation has been far less significant than solar and wind technologies in the last decade. As reported by IRENA,3 hydro projects have occasionally witnessed more expensive developments compared to earlier projects due to more challenging site conditions. For this reason, the costs of run-of-river and hydro reservoirs are derived from recent work90 as well as earlier studies69,91–94 to increase the number of data points in the distributions.
The baseline results are built for each country by assuming deterministic cost parameters. Such deterministic values are assumed equal to the medians of the empirical distributions, rather than the means, to limit the impact of outliers and distribution tails on the reference conditions. Cost values are summarized in Table D1 (ESI†). Although the future cost of technologies is likely to be lower than current costs, it is essential to recognize the large uncertainties introduced by future cost projections, as well as the dynamic nature of monetary valuation. In light of our proposal for a promptly implementable system based on contemporary technologies, it is prudent to anchor our cost estimations in the current technological landscape.
2.2 Storage models
Storage models are categorised based on their time-scale operation: short-term (hours, days) refers herein to batteries, whilst long-term (weeks, months) storage refers to power-to-X technologies. Batteries are generally used over short time horizons because of their high self-discharge losses compared to other storage types, such as mechanical (e.g. PHS) or chemical (P2G) storage, and their possibly lower discharge time. Solving the design and operating management of batteries over one year can become computationally expensive; the charging/discharging strategy of batteries is therefore based on the sizing and operation strategy of the P2G plant. Four battery types are considered in this work, namely: lead-acid, lithium-ion, vanadium and zinc flow batteries. The two former types are widely used for electricity storage in the power and transportation sectors, whereas the two latter are deemed promising since they are easier to scale for utility-size energy storage and are characterised by a low-power density. The cost of each battery type is taken from Lazard's report on the levelized cost of storage95 and the NREL.96,97
Batteries' lifetime is calculated following the capacity degradation model proposed by Ranaweera et al.98 The model uses the average depth of discharge and the number of cycles to failure, namely the number of equivalent full discharges available from experimental results,99,100 to estimate the total throughput of the battery during its lifetime. A conservative replacement criterion of 80% remaining capacity101 is assumed to ensure good battery health during the entire operating period. Finally, the calculated throughput and the annual battery usage resulting from the simulations allow us to estimate the expected lifetime in years.
Regarding long-term storage, the focus is on P2G with hydrogen (H2) or synthetic natural gas (SNG). Besides being a necessary step in all power-to-X schemes, H2 generation has been gaining interest as a possible vector for energy storage. SNG production, although requiring an additional reaction step and thus implying lower efficiency, benefits from a widely developed infrastructure (storage, transport and power generation). Power-to-liquid options are discarded, as the production of liquid fuels such as methanol or ammonia is seen as a suitable option only in specific sectors, and large-scale liquid-to-power facilities are uncommon. The charging/discharging strategy of P2G plants was set considering a cyclic behaviour over a one-year horizon. The cost associated with the installation of power-to-hydrogen facilities is obtained from well-known literature,102,103 while the works of Denft et al.104 and Gorre et al.105 are used for modeling SNG processes. Storage technology cost values are summarized in Table D2 (ESI†).
2.3 Simulation algorithm
The modelling is conducted for an entire year with hourly resolution. The electricity supply and demand are matched on an hourly basis, charging or discharging storage units to remove excess electricity from the grid or inject it when demand exceeds generation. Moreover, the model follows an overnight approach that assumes electricity is entirely generated from renewable resources in all countries – therefore disregarding the transition from the current state. Strategic pathways to achieve such an energy system are not the focus of this work.
Multiple scenarios are generated by means of a simulation algorithm that uses a predefined set of parameters as input. Such parameters allow the selection of the long- and short-term storage types and the choice of the generation multipliers (mg in eqn (1)), which represent the initial level of penetration of each generation technology in the production mix. Each generated scenario corresponds to a possible future evolution of events that would lead to a certain design of the energy system. The approach is deterministic, meaning that each scenario can be reproduced for a given set of input parameters.
Electricity generation profiles.
The simulation algorithm iteratively scales the generation profiles of the electricity production technologies by means of the scaling factor si. Eqn (1) shows how the generation mix, represented by the set GT, is updated at each iteration i. The electricity output Gig(h) from technology g (g ∈ GT) at time h is obtained by multiplying the current generation G0g(h) by the scaling factor and the multiplier mg. Not all technologies are scaled, but only those for which enough potential is available. This constraint is formulated through the definition of the scalable generation technology (SGT) set. SGT can either be a proper (SGT ⊂ GT) or improper (SGT ⊆ GT) subset of GT. The membership of a given technology g in set SGT can be written as in eqn (2), meaning that g is part of SGT only if its potential capacity PCg is considerably greater than its current capacity CCg. The use of SGT is fundamental to avoid unfeasible solutions in which the output from a certain resource exceeds the technical potential.| |  | (1) |
| | SGT = {g![[thin space (1/6-em)]](https://www.rsc.org/images/entities/char_2009.gif) | |![[thin space (1/6-em)]](https://www.rsc.org/images/entities/char_2009.gif) PCg ≫ CCg, PCg ≫ CCg,![[thin space (1/6-em)]](https://www.rsc.org/images/entities/char_2009.gif) ∀g ∈ GT} ∀g ∈ GT} | (2) |
At each iteration i + 1, the scaling factor s is either reduced or increased by the residual of the previous iteration ri (eqn (3)). This dimensionless residual represents the deficit (ri > 0) or excess (ri < 0) annual electrical energy that is estimated for a certain design.| | | si+1 = si + ri with s1 = 1 | (3) |
Electricity balance and convergence criterion.
The residual ri is calculated by summing the hourly contributions ri(h) (eqn (4)), which are obtained from the electricity balance expressed in eqn (5). The electricity balance is solved on an hourly basis and accounts for the electricity loss due to storage. The terms Silong(h) and Sishort(h) represent the charged (Si(h) > 0) or net discharged (Si(h) < 0) electrical energy flow associated with long- and short-term storage, respectively, and the term Ci(h) is the electricity consumption (i.e. demand from non-storage loads).| |  | (4) |
| |  | (5) |
Convergence is achieved at the closure of the electricity balance. The stopping criterion adopted in the simulations ensures a good accuracy of the result. When the total residual ri reaches 10−5% of the annual demand the algorithm halts its execution and the last available iteration is considered as converged.
Operating profile and size of the long-term storage.
At each iteration, the sizes of the long- and short-term storage are calculated according to the available power at different time scales. The two systems are designed sequentially, starting with the long-term one. The seasonal and daily excess of electricity is stored using the power-to-gas system and released in periods of high consumption. Conversely, the battery system is designed using the hourly power imbalances, hence ensuring grid stability over the short term. The algorithm starts with the calculation of the hourly power imbalances pihourly(h), as defined in eqn (6).| |  | (6) |
The daily electricity excess or deficit pidaily(d), namely the daily difference between the produced and consumed electric energy, is calculated at each iteration i by averaging the corresponding hourly values pihourly(h) (eqn (7)). This daily profile is subsequently used to calculate the power profile of the long-term storage pilong(d) as shown in eqn (10).| |  | (7) |
where pihourly(h) and pidaily(d) are two discrete functions, with h and d in the positive integer domains [0,8759] and [0,364] ⊂ ![[Doublestruck N]](https://www.rsc.org/images/entities/char_e171.gif) 0, respectively.
0, respectively.| |  | (8) |
| |  | (9) |
| | 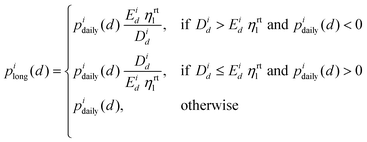 | (10) |
where ηrtl is the round-trip efficiency of the long-term storage, and Eid (eqn (8)) and Did (eqn (9)) are the total annual excess and deficit energy at daily time scale at iteration i. The profile pilong(d) delineates the power load attributed to the long-term storage as perceived by the electricity grid. This operational pattern is assembled anew in each iteration through the utilization of the equation set (10), which aligns the storage power load with pidaily(d). The significance of eqn (10) lies in its integration of the round-trip efficiency, effectively accounting for energy losses during both the charging and discharging stages of the storage process. Moreover, these equations play a pivotal role in mitigating the potential of overestimating or underestimating the long-term storage capacity. This approach averts the possibility of undue energy dissipation and accumulation within the power-to-gas system across successive years. Consequently, the framework guarantees the persistence of the long-term storage's state of charge, ensuring alignment between the initial and final days of each year (as illustrated in Appendix H, figures c). Subsequently, pilong(d) is employed to compute the storages's hourly electrical intake or output, as outlined in eqn (11).| | Silong(h) = pilong(d) × 1![[thin space (1/6-em)]](https://www.rsc.org/images/entities/char_2009.gif) [hour] [hour] | (11) |
Operating profile and size of the short-term storage.
After sizing the long-term storage, the hourly available power piavail(h) is calculated as the difference between the hourly and the daily average excess or deficit power (eqn (12)). The obtained profile corresponds to the operating load that the battery system could ideally follow to either store or discharge electricity. For this reason, piavail(h) can be considered as the battery-equivalent of pidaily(d), and it can therefore be used to identify the true power profile of the short-term storage (eqn (15)).| | | piavail(h) = pihourly(h) − pidaily(d)|d=h÷24 | (12) |
| |  | (13) |
| |  | (14) |
| | 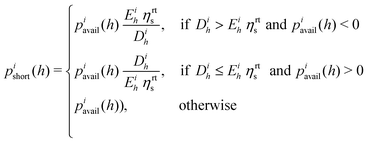 | (15) |
where pishort(h) is the battery-equivalent of pilong(d), ηrts is the round-trip efficiency of the short-term storage, and Eih (eqn (13)) and Dih (eqn (14)) are the total annual excess and deficit energy at hourly time scale, respectively. As in the case of the long-term storage, the battery power profile pishort(h) can be used to calculate the hourly charged or discharged electricity as indicated by eqn (16).| | Sishort(h) = pishort(h) × 1![[thin space (1/6-em)]](https://www.rsc.org/images/entities/char_2009.gif) [hour] [hour] | (16) |
It should be noted that eqn (12) enables the exchange of electricity between the two storage systems. The batteries indeed discharge energy whenever the generated electricity is insufficient for the demand and long-term charging load at the same time. Conversely, batteries can absorb the excess energy that is discharged by the long-term storage during hours of low demand. As a result, any sudden power imbalance is buffered by the batteries, ensuring smooth operating conditions of the power-to-gas system. Notably, scenarios necessitating extensive energy exchange between the two storage systems would entail significant efficiency penalties. Such outcomes would manifest in elevated system costs and emissions – attributable to the required storage oversizing. These solutions, lying considerably beyond the Pareto front, are excluded from our analysis focusing on the identification of the optimal scenarios.
Accuracy error of the algorithm.
Due to the storage inefficiency a residual power profile pires(h) can be calculated from the difference between the storage load and the hourly excess and deficit profile (eqn (17)). A negative value of pires(h) means that the excess power is greater than the combined storage and demand loads, hence the electricity generation is likely oversized. In such a case, the link imposed by eqn (18), (4) and (3) triggers a decrease of generation in the next iteration. Conversely, a positive value of pires(h) indicates a deficit of electricity, leading to an increase of the generation scaling factor s at iteration i + 1.| | | pires(h) = pishort(h) − pihourly(h) + pilong(d)|d=h÷24 | (17) |
The algorithm closes the electricity balance with an hourly residual energy term pires(h). Although small, such an error is inevitable due to a problem formulation that accounts for storage inefficiencies and constrains the shape of the electricity generation profile. The scaling factor s uniformly applies to each resource technology, limiting the freedom of the simulation algorithm in exploring alternative configurations which could lead to lower residuals. However, if instead technology-specific scaling factors were used, the problem would be shifted toward optimisation, leading to undesired complexity while still not ensuring full convergence of the hourly electricity balance.
The distributions of the hourly residuals (errors) generated by the implemented algorithm are shown in Fig. 1. The hourly error (median) varies between a minimum of 0.4% (Sweden) and a maximum of 4.8% (Belgium) of the demand, with the all-country weighted median equal to 1.3%. As expected, the errors are directly correlated with the variability of the electricity output, meaning that achieving convergence becomes more difficult with fluctuating generation. Overall, a similar average error can be considered sufficiently small, and certainly less significant than the uncertainty introduced by the demand projections and ENTSO-E generation data. Specifically, the latter is characterised by an average energy imbalance relative to demand of 3.9% (Table C1, ESI†). This error in background data alters the real shape of the generation capacity factors, affecting the solutions more than the inaccuracy caused by the simulation algorithm.
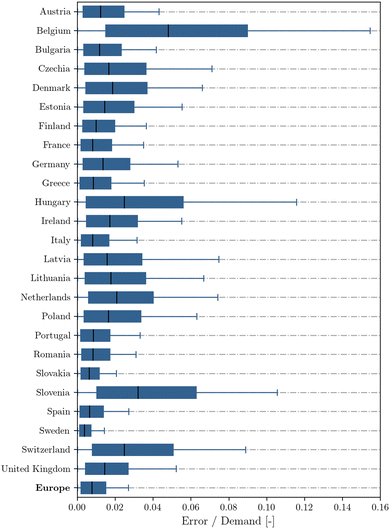 |
| | Fig. 1 Error distributions of the simulation algorithm, assessed by country. The residual of the hourly electricity balance is calculated as the relative error [−] with respect to the hourly electricity demand. Detailed results can be found in Table C2 (ESI†). | |
Comparison with alternative approaches.
Zero residuals could be achieved by allowing for energy accumulation or variable electricity curtailments. Energy accumulation in storage, cyclically asymmetric State of Charge (SOC), could be modelled by changing the set of eqn (10) and (15) with a formulation that ensures full cover of the energy deficit with discharges from storage. As a consequence, the power residual term pires(h) would more likely assume positive values, pushing the convergence towards solutions with higher storage and generation capacity. Alternatively, variable curtailments could be implemented to avoid accumulation by increasing the share of direct electricity supply while losing potentially useful energy.
Despite closing the hourly balance with absolute precision, the two approaches lead to overbuilt generation and storage. This issue is prevented in this model. The proposed algorithm finds the storage operating profile by fitting its shape to the hourly excess and deficit power. The fitting is achieved by minimising the total annual error while taking into account the signs of the hourly energy residuals. As a result, the algorithm is not biased towards the under-sizing or over-sizing of the generation and storage capacities, a conclusion that is further supported by errors that are symmetrically distributed around zero (Fig. C1, ESI†).
Summary of the algorithm procedure.
The equations presented above are solved in the order specified in Algorithm 1. The algorithm takes the current generation and demand profiles, the resource multipliers and the tolerance as inputs to iteratively design the energy system.
| Algorithm 1. Simulation algorithm |
|
procedure BUILD SCENARIO (G0g(h), C(h), mg, tol) |
▷ specify tolerance (e.g. 1e–5%) |
| i,r ← 0,1 |
▷ initialise iteration counter and residual |
| while true do |
|
| i ← i + 1 |
|
| ifi > 1 then |
|
| s ← s + r |
▷ update scale factor |
| end if |
|
| Gg(h) ← solve eqn (1) |
▷ solve equations in the following order |
| phourly(h) ← solve eqn (6) |
|
| pdaily(d) ← solve eqn (7) |
|
| plong(d) ← solve system (10) with (8) and (9) |
|
| pavail(h) ← solve eqn (12) |
|
| pshort(d) ← solve system (15) with (13) and (14) |
|
| pres(h) ← solve eqn (17) |
|
| r ← solve eqn (18) and (4) |
▷ update residual |
| end while |
|
| save simulation |
|
|
end procedure
|
|
2.4 Sobol simulations
A Sobol sequence is used for drawing pseudo-random samples and simulate the process with a Monte Carlo approach that ensures low discrepancy of the explored space. Different combinations of technologies for the long- (Hydrogen and SNG) and short-term (Lead-acid, Lithium-ion, Vanadium and Zinc flow) storage, and generation shares are investigated (Fig. 2). After the drawing of each Sobol set of variables, the simulation algorithm is run until it reaches convergence, which is defined as the closure of the electricity balance.
 |
| | Fig. 2 Simulated solutions obtained for an interconnected grid across Europe. The solutions are scattered in relation to the Levelized Cost of Electricity (LCOE) [EUR per MWh] and Global Warming Potential (GWP100a) [gCO2-eq per kWh]. (a) illustrates various power-to-gas technologies: Synthetic Natural Gas (SNG) and hydrogen. (b) showcases different types of batteries: lithium-ion, lead-acid, vanadium and zinc flow. | |
The bounds of the Sobol parameters must be accurately pre-defined to avoid convergence to infeasible solutions. This happens when at least one of the installed generation capacities exceeds its available potential. For this reason, the minimum and maximum bounds of the Sobol variables are defined using the current and potential generation capacities (eqn (24)). This ensures that, at the initial state of the simulation, each resource capacity is at least equal to the current installation and lower than the available potential. While the algorithm begins with an initial feasible scenario, it iteratively adjusts the generation and storage profiles, which may introduce potential infeasibilities. A total of 55![[thin space (1/6-em)]](https://www.rsc.org/images/entities/char_2009.gif) 000 simulations were conducted. Following each run, the converged scenario is cross-checked against the potential capacities, flagging any infeasible solutions as invalid.
000 simulations were conducted. Following each run, the converged scenario is cross-checked against the potential capacities, flagging any infeasible solutions as invalid.
| |  | (24) |
2.5 Pareto-efficient solutions
At the end of the simulation the set of Pareto-efficient solutions can be extracted by applying Algorithm 2 to the ensemble of scenarios. The algorithm returns the set of non-dominated solutions from which the knee point is identified by selecting the solution that minimises the element-wise multiplication between the normalised LCOE and GWP100a. The knee point is considered as one of the possible best solutions; the rest of the Pareto-efficient points are also taken into account by analysing different designs.
| Algorithm 2. Pareto-efficient solutions selection. |
|
procedure PARETO-EFFICIENT |
|
| LCOE, GWP100a ← get values |
▷ read data from Sobol simulations |
| costs ← column stack (LCOE, GWP100a) |
▷ build N × 2 array |
| is_eff ← ones-filled array with shape[0] of costs |
▷ N × 1 boolean array |
| forc ∈ costs do |
|
i ← get index of ![[thin space (1/6-em)]](https://www.rsc.org/images/entities/char_2009.gif) c c |
|
| if is_eff[i] then |
|
| is_eff[is_eff] ← any costs[is_eff] < c |
▷ check if dominated |
| is_eff[i] ← True |
▷ save index of non-dominated solution |
| end if |
|
| end for |
|
| pareto_eff ← (LCOE[is_eff[i]], GWP100a[is_eff[i]]) |
|
| return pareto_eff |
|
|
end procedure
|
|
2.6 Key performance indicators
Levelized cost of electricity.
The Levelized Cost of Electricity (LCOE) is used to compare the economic competitiveness of the simulated scenarios and determine the minimum market price for which the investments become profitable. This metric is calculated by equalising the net present value (NPV) of all cash inflows from electricity sales to the NPV of all costs over the system lifetime (eqn (25)). Capital and maintenance costs are taken into account and the LCOE is measured in Euro per MWh of consumed electricity,| | | NPV of cash inflows over lifetime = NPV of total costs over lifetime | (25) |
| |  | (26) |
where GT and ST are the set of generation and storage technologies, respectively. T is the ordered sequence of years 〈0,…,tn〉 and tn the assumed project lifetime (20 years). The sequence of years starts from t = 0, meaning that the initial investment is not discounted. The social discount rate i is taken from the cost guide provided by the European Commission106 and Florio,107 the expected facility life in years of the generation technologies from the Lazard estimates83 and the cost analysis is provided by the IRENA.69Eqn (26) can be rearranged leading to the final formulation of the LCOE, as shown in eqn (27).| | 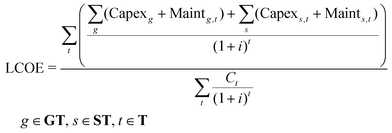 | (27) |
It should be noted that the LCOE is discounted over the system lifetime, in such a way that cash inflows are preferred in earlier years. A reduction factor of 1.73 should be used whenever comparing the presented LCOE estimates to those of studies in which such discounting is not considered. Moreover, the LCOE obtained from eqn (27) is dependant on the selected interest rate (i), whose value is strictly connected with the available financing instruments. High discount rates favour production technologies with long installation times and costs that are more evenly spread over the lifetime. On the contrary, they hinder the competitiveness of renewable installation projects, which usually require high initial investment, but almost negligible costs in later years.108 For this reason, particular care should be taken whenever comparing the LCOE from this study to those obtained in other research works. Contextualisation of methods and analysis of assumptions should always be performed to avoid misleading conclusions.
Equivalent annual cost.
The Equivalent Annual Cost (EAC) is used to quantify the cost of owning, operating, and maintaining the energy system over its lifetime. This financial metric can be calculated by annualising the NPV of all costs using the annuity factor (eqn (28) and (29)).| | | EAC = Annuity factor × NPV of total costs over lifetime | (28) |
| | 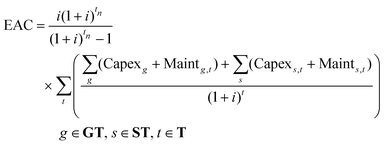 | (29) |
Environmental impact assessment.
The environmental impact assessment of the scenarios is performed using a life-cycle approach with locally differentiated impact factors of the generation resources. Different indicators such as renewable energy (RE) share (method 1 and method 2), climate change (GWP100a and GWP20a),109 ecological scarcity110 and ecological footprint are calculated using local data-sets downloaded from Ecoinvent111 (see Tables B1–B5, ESI†). While the first method of the RE share indicator associates 100% clean energy use with renewable sources, method 2 accounts for the actual cumulative energy demand over the entire technology life-cycle. Given its more descriptive nature, the second method is selected to quantify the renewable penetration. Moreover, the impact associated with battery112–119 and power-to-gas120,121 storage is considered by collecting data from different peer-reviewed studies. The GWP100a and GWP20a of storage is obtained using the GHG protocol of the IPCC Fifth Assessment Report and the medians of the data distributions are used as deterministic impacts (Table E1, ESI†).
Impact of the current system.
The environmental performance of the simulated solutions is compared to the indicators associated with the current energy system to assess the improvements of the generated results. A database of historical grid impacts is constructed using the dynamic LCA tool presented elsewhere.122 Such a tool uses data provided by the ENTSO-E database4 to quantify the impact of electricity consumption in each European country. It considers hourly electricity production mixes, electrical power exchanges across borders and local impact factors of the energy resources to calculate environmental indicators for each country with a data granularity of one hour (Table E2, ESI†). The impact of households and service heating and transportation sectors are included using the GHG emissions and final energy consumption measures provided by Eurostat45 (Table E3, ESI†).
Moreover, it should be pointed out that showing how the impact factors of the generation technologies will decrease after achieving a 100% renewable grid is beyond the scope of this study. The focus is on quantifying the environmental impact generated by such a system in an overnight building approach. Since the transition from current to renewable generation is disregarded, impact factors are assumed equal to those associated with the present-day energy technologies. While different strategies are available, this approach is based on proven and current data rather than including additional speculative predictions which could unfairly bias the results. It is also consistent with the data and methods that are commonly adopted in impact assessment studies.
3 Results and discussion
The findings show that the projected generation mix is significantly influenced by both local capacity factors (Fig. 4) and climate change potentials associated with each technology. Starting with hydro power, the potential of run-of-river is largely exhausted in Europe – about 75% of the potential is already installed (Table A4, ESI†). Conversely, investments in hydro reservoirs are still required. The simulations show that Sweden and Austria rely heavily on dams, with generation shares of 64% and 49%, respectively. Other countries such as France (12%), Italy (12%) and Switzerland (20%) increase the share of hydro power from reservoirs given the particularly favourable capacity factor (0.24–0.63) and low global warming potential (6.17 gCO2-eq per kWh) associated with such technology (Tables A3 and B2, ESI†). Solar-based generation is mostly present in countries with limited or no access to offshore resources. Belgium, Slovenia and Switzerland power their future grids with electricity from solar, which accounts for 76%, 65% and 45% of their total generation, respectively. Southern countries with high solar capacity factor (0.14–0.18), such as Bulgaria, Greece, Portugal and Spain, cover more than 10% of their demand using PV.
Increased deployment of wind onshore (+939 GW) and offshore (+431 GW) leads wind-based technologies to become the predominant source of renewable electricity in Europe with 73% of the total electric power (Tables F1 and F3, ESI†). Czechia, Hungary and Slovakia mostly exploit their onshore wind potential, resulting in land-based wind power reaching a market share greater than 85%. Ireland (80%), Lithuania (72%) and Poland (81%), despite their access to offshore wind, favour cheaper onshore generation (Table F4, ESI†). Alongside onshore wind, the deployment of wind farms situated offshore is paramount in reaching the 100% clean electricity target. Although offshore wind is costlier than other renewable installations – 100%, 29%, 58% more expensive than combined hydro, PV and wind onshore, respectively (Table F5, ESI†) – it becomes a significant part of the European power generation sector (about 25% of total energy output). Germany installs almost the totality of its potential (98%), adding more than 95 GW to its current capacity. Similarly, France fully replaces nuclear power plants with offshore turbines that account for 55% of the total generation. Finally, the Netherlands supply 91% of the annual electricity demand using cost-competitive generators located in coastal and deep-water areas.
3.1 Electricity demand and wind availability
Along with the growing use of renewable energy, electricity demand is set to increase (+51%) as a result of electrification of transport and heating in the household and service sectors (Table A5, ESI†). The large-scale deployment of heat pumping for space heating and hot water causes an imbalance of seasonal consumption, introducing changes to long-term variability of electricity demand (Fig. 3b). This increasing weather dependency, together with the negative correlation between wind and solar output at seasonal timescale, partially explains the selection of wind-based generation as the primary source of electricity. The capacity factors of onshore and offshore wind increase by 76% (from 0.186 to 0.331) and 33% (from 0.369 to 0.490) from summer to winter, respectively. In contrast, PV output experiences a 48% decrease (from 0.116 to 0.060) due to prolonged periods of low-sun conditions in the colder months. As a result, making supplementary investments in wind generation enhances the alignment of consumption and production, thereby reducing the need for long-term storage (Fig. 5).
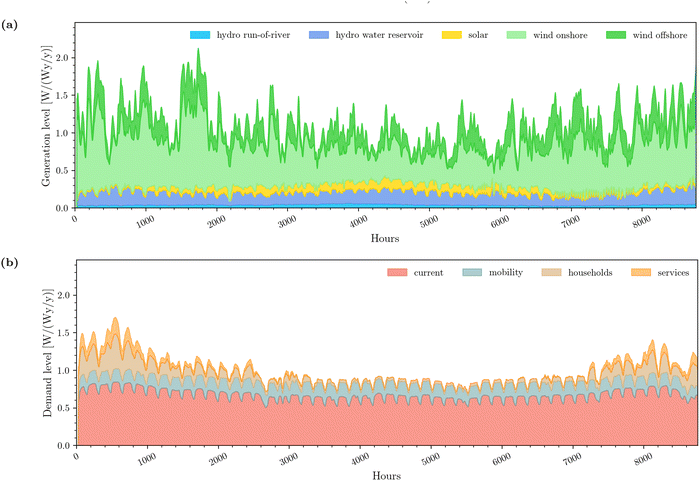 |
| | Fig. 3 Hourly profiles of electricity production (a) and demand (b) for all Europe assuming interconnected grids between countries. Results are based on the best observed solution. The hourly values are presented as a fraction of the yearly average consumed power [W/(Wy/y)]. A 24-hour rolling mean is applied to smooth out fluctuations in the electricity profiles for improved visualisation. (a) Electricity production by generation technology is categorised as follows: 3.8% hydro run-of-river, 14.2% hydro reservoir, 6.8% solar photovoltaic, 52.6% wind onshore and 22.7% wind offshore (Table F1, ESI†). The total corresponding produced electricity amounts to 4996 TWh (Table F2, ESI†). (b) Electricity consumption by sector with shares: 67.0% current, 17.4% mobility, 11.6% households and 4.0% services. The associated annual electricity demand is 4406 TWh (Table A5, ESI†). | |
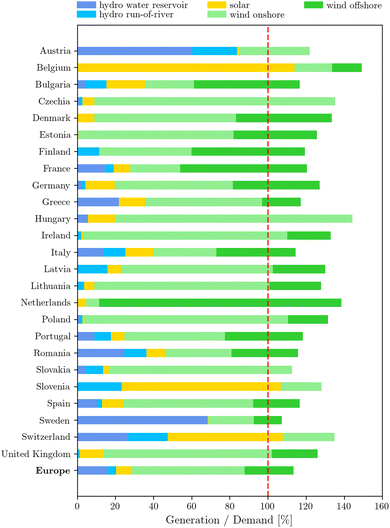 |
| | Fig. 4 Electricity generation from installed technologies. The figure illustrates how countries overbuild capacity to compensate for storage losses – annual generation as share [%] of the consumption (Table F2, ESI†). | |
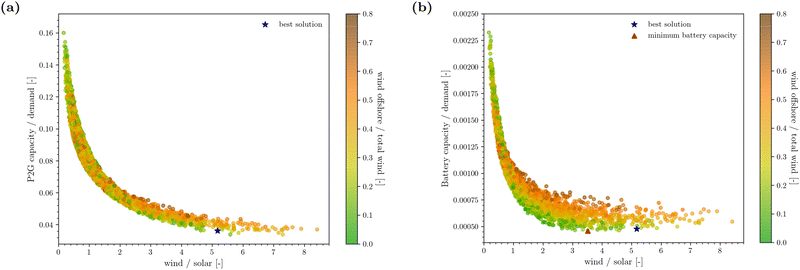 |
| | Fig. 5 (a), P2G capacity (as a fraction of demand [−]) plotted against the wind-to-solar ratio [−]. The blue star marker indicates the optimal solution, representing the best trade-off between LCOE and GWP100a. (b) Battery capacity (as a fraction of demand [−]) plotted against the wind-to-solar ratio [−]. The red triangle marker identifies the wind-to-solar ratio at which the battery exhibits its lowest capacity requirement. | |
3.2 Electricity storage profile and requirements
With European renewable generation capacity reaching record levels, storage technologies are crucial to displace electricity from excess to deficit period without resorting to fossil fuels. Grid-scale battery facilities can be used to compensate for power shortfalls and over-production peaks of intra-day periods (Fig. 6b). Such power fluctuations, which are typically due to sudden changes in weather conditions, are crucial for the correct design of the battery system. Conversely, longer trends in weather require the storage of larger electricity amounts, which must be released afterwards to maintain the grid balance during multi-day and seasonal periods of deficit (Fig. 6a).
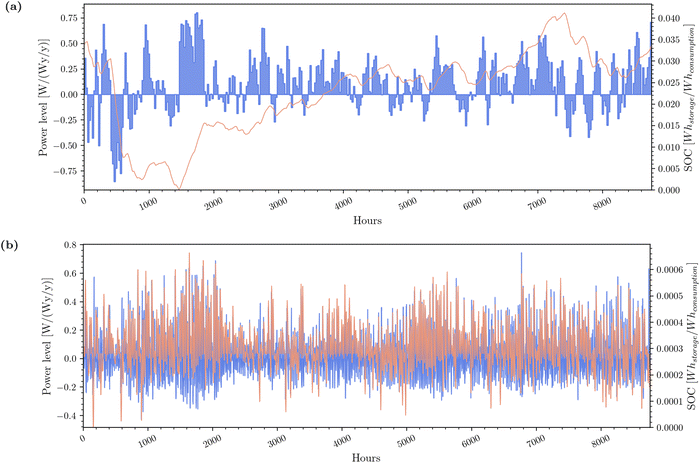 |
| | Fig. 6 Hourly profiles of long- (a) and short-term (b) storage profiles for all Europe assuming interconnected grids between countries. These results correspond to the generation and demand profiles shown in Fig. 3. (a) depicts power levels (in blue) and State of Charge (in red) of the SNG storage system, with a total capacity of 160 TWh. (b) shows the vanadium flow battery with a total capacity of 2 TWh. The power level and the SOC are presented as a fraction of the yearly average consumed power [W/(Wy/y)] and annual electricity consumption [Wh/Wh], respectively (Table G1, ESI†). Additional details on storage charging time, calculated as percentage [%] of the annual operating time, and the annual electrical energy sent to storage, expressed as share [−] of the electricity demand, can be found in Tables G2 and G3 (ESI†). | |
The results show that countries relying on solar generation always require larger installations of long-term storage facilities because of the strong seasonal cycle in irradiance. This is the case for Belgium (Fig. H2a, ESI†) and Switzerland (Fig. H24a, ESI†), both requiring a record capacity of power-to-gas greater than 20% of the annual electricity demand (Table G1, ESI†). Unlike solar, the seasonal wind variability is significantly weaker at 35% lower on average (Table F6, ESI†). As a result, the need for P2G decreases in countries with high wind penetration, as in the case of Slovakia, where the installed capacity equals 4.3% of the electricity demand. Fig. 7 displays the breakdown of storage losses incurred by each country for both long- and short-term storage.
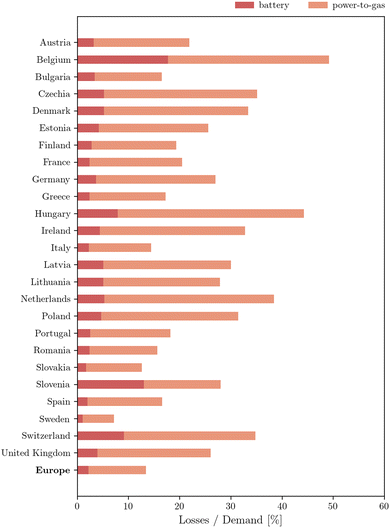 |
| | Fig. 7 Electricity losses resulting from storage. The figure illustrates the electricity lost during the charge and discharge phases of the long- and short-term storage as share of the demand [%] (Table K4, ESI†). Excess generation losses range from 7% of the annual demand in Sweden to 49% in Belgium, with a 14% loss observed in the case of an interconnected Europe. Power-to-gas accounts on average for more than 84% of the total electricity losses. | |
3.3 Wind and solar complementary patterns
The hourly variability of solar power across all countries is nearly double that of the combined onshore-offshore wind generation (Table F6, ESI†). This high variability, stemming from extensive PV installations, leads to significant intra-hour ramps in power load that must be absorbed by fast-response batteries. Notably, Belgium showcases the highest relative capacity of short-term storage among European nations, accounting for 0.26% of demand (Table G1, ESI†). At the same time, an increase in the proportion of solar installations relative to wind reduces the hourly variability of the total power, especially for wind-to-solar capacity ratios above a certain threshold (Fig. 5b). In most countries, wind and solar have complementary diurnal and seasonal production profiles, which can mitigate the overall need for storage. Such use of PV panels to compensate for shortages in wind power throughout the year has to be carefully balanced against the risk of increasing seasonality.
3.4 Self-sufficiency potential of renewable electricity
This work estimates that European renewable potential exceeds the projected demand by more than six times (Fig. 8). Solar PV and onshore wind are sufficient to cover the entire consumption alone, with each technology able to supply more than 10![[thin space (1/6-em)]](https://www.rsc.org/images/entities/char_2009.gif) 000 TWh of electricity per year. Although the technical potential is higher than demand in every country, it is unequally distributed in Europe (Fig. I1–I5, ESI†). Italy accounts for over 30% of the hydro potential from rivers, France alone has more than 20% of the potential capacity for both solar and onshore wind, while offshore wind availability is significantly higher (>30%) in the United Kingdom. When normalising by national demand, solar and wind potentials reach particularly high levels in the Baltic countries, Ireland and Romania, with annual generation potentials comprised between 10 and 25 MWh of electrical energy per MWh of consumption (Table I2, ESI†). Overall, the aggregated potential of all renewable resources in Latvia exceeds the country demand 44 times, whereas it is only 10%, 44% and 60% higher than the annual consumption in Belgium, Slovenia and Switzerland, respectively (Table I4, ESI†).
000 TWh of electricity per year. Although the technical potential is higher than demand in every country, it is unequally distributed in Europe (Fig. I1–I5, ESI†). Italy accounts for over 30% of the hydro potential from rivers, France alone has more than 20% of the potential capacity for both solar and onshore wind, while offshore wind availability is significantly higher (>30%) in the United Kingdom. When normalising by national demand, solar and wind potentials reach particularly high levels in the Baltic countries, Ireland and Romania, with annual generation potentials comprised between 10 and 25 MWh of electrical energy per MWh of consumption (Table I2, ESI†). Overall, the aggregated potential of all renewable resources in Latvia exceeds the country demand 44 times, whereas it is only 10%, 44% and 60% higher than the annual consumption in Belgium, Slovenia and Switzerland, respectively (Table I4, ESI†).
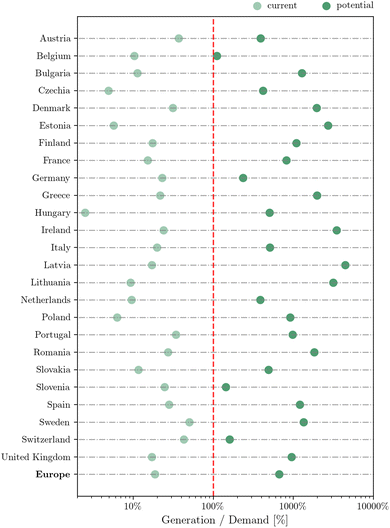 |
| | Fig. 8 Current (Table A2, ESI†) and potential generation (Table A4, ESI†) expressed as a percentage [%] of the electricity demand for each country and Europe as a whole. The red dashed line indicates the threshold for electricity self-sufficiency. The figure illustrates scenarios without storage, where demand equals annual electricity consumption. Countries with a potential generation share below 100% cannot achieve a fully renewable mix – point on the left side of the self-sufficiency line. Detailed results can be found in Table I4 (ESI†). | |
3.5 Self-sufficiency with storage
While renewable resources are abundant in Europe, the potential-to-demand ratio decreases by 12% if considering storage (Fig. 9). Losses due to charging and discharging of power-to-gas and batteries reduce the self-sufficiency capability of all countries, leaving only Belgium unable to achieve power autonomy; here, the considerable requirement for storage leads to a potential generation able to cover only 74% of the national demand. Further installation of solar panels exceeding the potential by 50% (Table I5, ESI†) would allow Belgium to be as self-sufficient as the rest of Europe. This would be possible if the country installed an additional capacity of 50 GW of open field PV, which is not considered in this work.
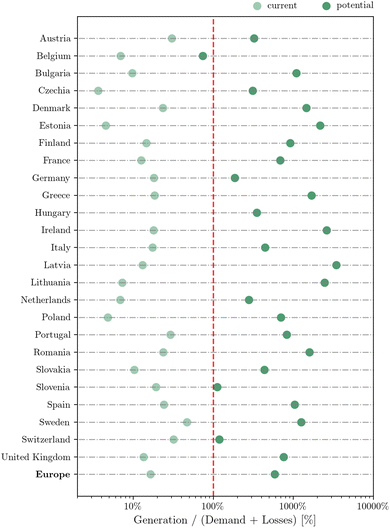 |
| | Fig. 9 Current (Table A2, ESI†) and potential generation (Table A4, ESI†) expressed as a percentage [%] of the electricity demand for each country and Europe as a whole. The red dashed line represents electricity self-sufficiency. It is important to note that the results consider losses incurred by the battery and power-to-gas systems. Therefore, the demand is adjusted to account for the electricity lost during the charging and discharging of the storage. | |
3.6 The relevance of storage
Oversizing capacity requires massive investments in generation infrastructure and frequent curtailment to ensure constant balancing between consumption and production. As demonstrated, electricity storage significantly reduces the need for over-provisioning solar and wind, albeit not always attainable at the country scale. Fig. 10 shows that strategies solely based on overbuilt capacity are unfeasible in eight European countries (Austria, Belgium, Czechia, Germany, Hungary, Netherlands, Slovenia, Switzerland). The uncertain supply of electricity from renewable resources leads to generation that exceeds the renewable potential forty times in Belgium and more than ten times in the Netherlands, Slovenia and Switzerland.
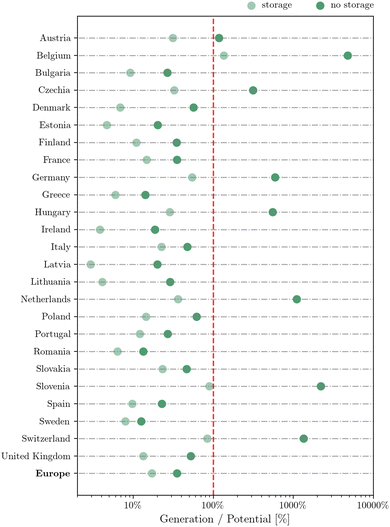 |
| | Fig. 10 Requirement for overbuilt capacity in Europe (Table J1, ESI†). The electricity generation is presented as a fraction [−] of the technical potential for solutions both with (light points) and without storage (dark points). The results for Europe assume interconnected grids between countries, allowing for cross-border imports and exports of electricity as an alternative to storage (dark green). The red dashed line delimits the feasibility domain: points on the right side of the line are technically unattainable. | |
While being technically unattainable at national level, resource requirements for overcapacity are less significant at the continental scale. An interconnected Europe could potentially reduce the need for storage through the adoption of a grid operating strategy based on curtailments of excess generation. However, such an approach would entail higher environmental impact compared to solutions based on combined storage and power exchanges. The inclusion of electricity storage in the European power grid reduces overcapacity by a factor of two: 17% of continental generation potential would be needed instead of 35%. Moreover, decarbonization strategies based on long- and short-term storage with cooperating grids are associated with 33% lower emissions compared to overbuilt solutions with exchanges (Fig. 11). Such an environmental benefit increases even further at country scale, with Denmark, Latvia and Lithuania able to decrease their carbon emissions by 75% if choosing storage – a six-fold decrease in the required generation capacity (Table J1, ESI†).
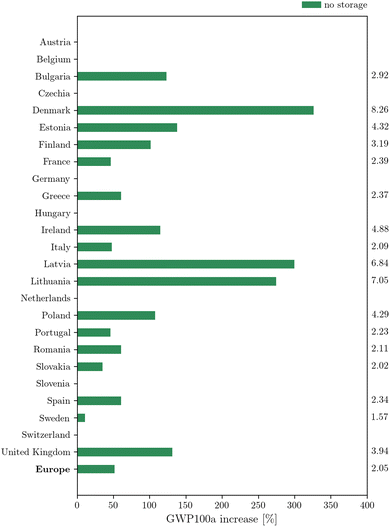 |
| | Fig. 11 Environmental benefit of electricity storage versus overbuilt capacity in Europe (Table J1, ESI†). This graph illustrates the effect of over-capacity investments on climate change, represented as a percentage increase in the Global Warming Potential (GWP100a) from the optimal scenario with storage (Table K1, ESI†). Only solutions within the feasible domain are displayed; countries exceeding their potential are excluded. The generation oversizing factors are provided on the right side of the figure. | |
3.7 LCOE of generation technologies
The LCOE of each production technology is evaluated based on hourly capacity factors, obtained from the actual generation profiles in a country-dependent approach. As a result, the LCOE of solar, wind and hydro power markedly changes by country (Fig. 12), motivated by geographical differences (e.g., resource availability). Hydro power generation cost from water reservoirs (average: 57 EUR per MWh) has the highest variability, with values ranging between 28 (Italy) and 165 EUR per MWh (Slovakia). Run-of-river supplies electricity at a more stable price with 40% decrease in LCOE variance compared to reservoirs, an economically advantageous power source in Switzerland (44 EUR per MWh) and the least attractive one in Spain (143 EUR per MWh). Overall, power generation from hydro resources remains very competitive, producing electricity at lower cost than solar and wind in two-thirds of Europe.
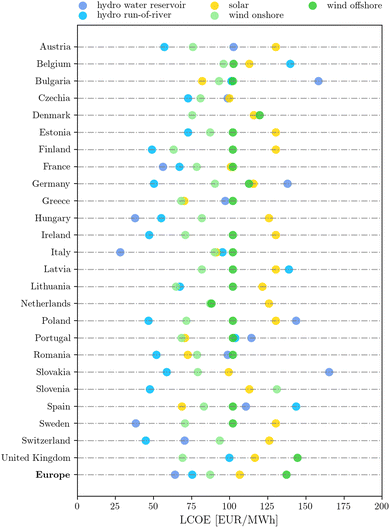 |
| | Fig. 12 Levelized Cost of Electricity (LCOE) [EUR per MWh] of generation technologies for each country and Europe as a whole (Table F5, ESI†). The price is calculated at the generation side, hence the amount in EUR is provided per MWh of produced electricity. The results refer to the best observed simulations. | |
The cost of solar photovoltaic is considerably lower in southern countries due to favourable climatic conditions. Solar panels can be installed in Spain for as little as 68 EUR per MWh – slightly more than 70 EUR per MWh in Greece and Portugal. Northern countries such as Ireland, Poland, Finland and Sweden require higher electricity prices for newly commissioned solar installations, reaching 130 EUR per MWh. Onshore wind generation is the least expensive in Lithuania, where in-land turbines can provide low-cost power at 65 EUR per MWh, whereas the most expensive can be found in Switzerland, Belgium and Slovenia (93, 96 and 131 EUR per MWh, respectively) (Table F5, ESI†).
3.8 System LCOE and costs breakdown
In the calculation of the system LCOE, both battery and P2G technologies are factored in. The economic viability of battery storage is notably contingent on the simulated operating strategy, which reflects typical usage for energy arbitrage, with an hourly capacity factor ranging between 1% and 2.5% (Table K5, ESI†). In a scenario of a disconnected Europe, the cost of electricity storage accounts for 30% of the overall global LCOE (Fig. 13), of which batteries contribute to two-thirds of this share. Additionally, over 50% of total cost is attributed to the combined onshore and offshore wind generation, while the remaining 20% arises from expansions in solar and hydro capacity (Table K2, ESI†). Exceptions must be pointed out on a country basis, such that the presence of a predominant technology in the generation mix can significantly influence the required price of electricity. More specifically, the share of solar PV on the system cost exceeds 38% in Belgium, Slovenia and Switzerland, while wind-based generation is particularly high in Slovakia and the Netherlands, where onshore and offshore turbines account for more than 60% and 50% of the total LCOE, respectively. Capital expenditures are the largest contributor to the system lifetime costs, accounting on average for more than 80% of the system LCOE (Table K3, ESI†).
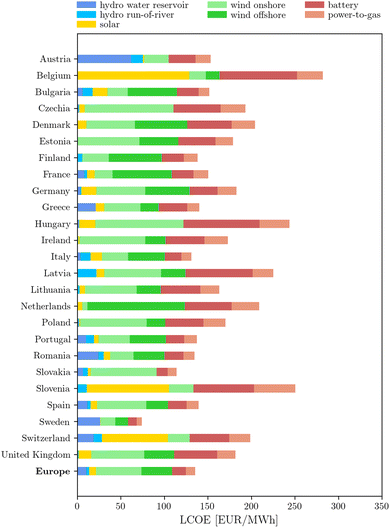 |
| | Fig. 13 Levelized Cost of Electricity (LCOE) [EUR per MWh] for individual countries and Europe as a whole. This graphic provides a breakdown of contributions from each electricity production resource and storage to the overall LCOE of the entire energy system (Table K2, ESI†). All calculations include storage losses, ensuring that each contribution reflects the cost in EUR per MWh of consumed electricity. These results refer to the best observed simulations (Table K1, ESI†). | |
The analysis of the overall results reveals that the best trade-off designs install significantly lower PV capacity compared to other studies.6,123 This is due to the approach used for the selection of the best designs, defined as solutions that minimise the element-wise multiplication between normalised LCOE and GWP100a. Scenarios with large solar installations are usually associated with a considerably higher environmental impact compared to those predominantly based on hydro and wind resources. As a consequence, PV panels turn out to be less attractive than wind and their use is limited to offsetting shortages in wind, whose production pattern is complementary to solar in most countries.
The cost associated with each scenario is calculated using a formulation of the LCOE based on the discount of all cash inflows and outflows over the system lifetime. However, it should be noted that costs are highly dependent on the assumptions made (i.e. cost sources, interest rate, lifetime, LCOE formulation). For this reason, the LCOE estimated here can significantly differ from those provided in other studies,18–20,124–126 particularly when discounting cash inflows is not considered. It is crucial to frame results and assumptions in a way that prevents erroneous conclusions when comparing the LCOE findings of this study with existing literature.
4 Conclusion
The global climatic emergency, political treaties and international commitments of the various countries require bold system designs for renewable energy generation and storage. As technology prices continue to drop, new storage technologies are emerging, offering cost-effective alternatives to traditional pump hydro storage. The establishment of robust and affordable future energy systems based on renewable generation relies on the capacity to store substantial electricity both on short and long timescales.
This work establishes a framework for both large-scale isolated and interconnected power grids, enabling deep electrification of energy end-use in Europe. It emphasizes the critical role of short- and long-term storage solutions, tailored to meet the requirements of individual European nations. The exploration of potential solutions is systematically conducted through a trial-and-error simulation-based algorithm, enhanced by a drawing mechanism derived from a Sobol sequence, emplyoing a Monte Carlo approach. All constructed scenarios are rigorously assessed based on their economic and environmental viability, using LCOE and GWP100a as primary metrics.
Electrification of future European households, services and mobility sectors is considered to construct energy scenarios that are coherent with the long-term transition pathways identified by the European Commission. As demonstrated, electrification introduces changes to the long-term variability of demand, increasing weather dependency and consequently driving technology choices. Different levelized costs of the generation resources are obtained for each country. LCOE results span from 74 EUR per MWh in Sweden to 282 EUR per MWh in Belgium, whereas the associated electricity emissions vary from 28 gCO2-eq per kWh in Slovakia to 152 gCO2-eq per kWh in Belgium. The findings also show that the future generation mix is significantly influenced by local capacity factors, with wind-based technologies becoming the predominant source of renewable electricity in Europe, accounting for 73% of the total output. Moreover, wind and solar exhibit complementary diurnal and seasonal profiles, leading to a reduced need for storage. However, such use of photovoltaic to compensate for deficits in wind output must be conscientiously balanced against the risk of introducing seasonal cycles.
Overcoming the challenge posed by the inherent variability of renewables can be accomplished by either overbuilding generation resources or prioritizing electricity storage. Our results demonstrate that strategies based solely on solar and wind over-provisioning are not always attainable at the country scale. However, when considering system expansion at the continental scale, the resource demands for overcapacity becomes far less significant. An interconnected Europe has the potential to replace storage with a grid design based on excess curtailable generation. Nonetheless, this approach would result in an augmented carbon footprint of electricity (+50%) compared to scenarios reliant on storage.
Author contributions
Alessio Santecchia: conceptualization, methodology, model development, formal analysis, writing – original draft, editing. Rafael Castro-Amoedo: conceptualization, methodology, formal analysis, writing – original draft, review, editing. Tuong-Van Nguyen: conceptualization, writing – original draft. Ivan Kantor: conceptualization, methodology, supervision, writing – review. Paul Stadler: data validation and model development. François Maréchal: conceptualization, supervision, writing – review.
Conflicts of interest
The authors declare that they have no known competing financial interests or personal relationships that could have appeared to influence the work reported in this paper.
Acknowledgements
This work was supported by the European Union's Horizon 2020 research and innovation program under grant agreement No. 723575 (Project CoPro) in the framework of the SPIRE PPP, the Marie Sklodowska-Curie grant agreement No 754354, and the Swiss Competence Center for Energy Research SCCER-EIP.
References
- U.S. Department of Energy, E. I. A. Electricity Information: Overview, 2022.
- Eurostat, Electricity generation statistics – first results – Statistics Explained, 2019.
- IRENA, Renewable capacity statistics 2023, Tech. Rep., 2023.
- ENTSO-E, Transparency Platform restful API – Central collection and publication of electricity generation, transportation and consumption data and information for the pan-European market, https://transparency.entsoe.eu. (last accessed: 24.11.2020).
- R. Castro-Amoedo, J. Granacher, M. A. Daher and F. Maréchal, On the role of system integration of carbon capture and mineralization in achieving net-negative emissions in industrial sectors, Energy Environ. Sci., 2023 10.1039/D3EE01803B.
- T. Tröndle, S. Pfenninger and J. Lilliestam, Home-made or imported: On the possibility for renewable electricity autarky on all scales in Europe, Energy Strategy Rev., 2019, 26, 100388 CrossRef.
- K. Hansen, B. V. Mathiesen and I. R. Skov, Full energy system transition towards 100% renewable energy in Germany in 2050, Renewable Sustainable Energy Rev., 2019, 102, 1–13 CrossRef.
- D. Connolly, H. Lund and B. V. Mathiesen, Smart Energy Europe: The technical and economic impact of one potential 100% renewable energy scenario for the European Union, Renewable Sustainable Energy Rev., 2016, 60, 1634–1653 CrossRef.
- K. Hansen, C. Breyer and H. Lund, Status and perspectives on 100% renewable energy systems, Energy, 2019, 175, 471–480 CrossRef.
- C. Breyer,
et al., On the History and Future of 100% Renewable Energy Systems Research, IEEE Access, 2022, 10, 78176–78218 Search PubMed.
- B. V. Mathiesen,
et al., Smart Energy Systems for coherent 100% renewable energy and transport solutions, Appl. Energy, 2015, 145, 139–154 CrossRef.
- J. A. de Chalendar, P. W. Glynn and S. M. Benson, City-scale decarbonization experiments with integrated energy systems, Energy Environ. Sci., 2019, 12, 1695–1707 RSC.
- A. Santecchia, I. Kantor, R. Castro-Amoedo and F. Maréchal, Industrial Flexibility as Demand Side Response for Electrical Grid Stability, Front. Energy Res., 2022, 10, 831462 CrossRef.
- W. A. Braff, J. M. Mueller and J. E. Trancik, Value of storage technologies for wind and solar energy, Nat. Clim. Change, 2016, 6, 964–969 CrossRef.
- Agency, E. E., Europe's onshore and offshore wind energy potential—European Environment Agency, Publication, European Environment Agency, Luxembourg, 2009.
- R. McKenna, S. Hollnaicher, P. Ostman v. d. Leye and W. Fichtner, Cost-potentials for large onshore wind turbines in Europe, Energy, 2015, 83, 217–229 CrossRef.
- P. R. Defaix, W. G. J. H. M. van Sark, E. Worrell and E. de Visser, Technical potential for photovoltaics on buildings in the EU-27, Sol. Energy, 2012, 86, 2644–2653 CrossRef.
- M. Z. Jacobson, The cost of grid stability with 100% clean, renewable energy for all purposes when countries are isolated versus interconnected, Renewable Energy, 2021, 179, 1065–1075 CrossRef.
- M. Z. Jacobson, M. A. Delucchi, M. A. Cameron and B. V. Mathiesen, Matching demand with supply at low cost in 139 countries among 20 world regions with 100% intermittent wind, water, and sunlight (WWS) for all purposes, Renewable Energy, 2018, 123, 236–248 CrossRef.
-
C. Kost, et al., Study: Levelized Cost of Electricity – Renewable Energy Technologies – Fraunhofer ISE, Tech. Rep., Fraunhofer ISE, 2021.
- Directorate-General for Energy (European Commission), EU Energy in Figures: Statistical Pocketbook 2017, Publications Office of the European Union, LU, 2017.
- Comission, E. EUR-Lex – 52018DC0773 – EN – EUR-Lex, https://eur-lex.europa.eu/legal-content/EN/TXT/?uri=CELEX%3A52018DC0773, 2018.
- W. D. Grossmann, I. Grossmann and K. W. Steininger, Distributed solar electricity generation across large geographic areas, Part I: A method to optimize site selection, generation and storage, Renewable Sustainable Energy Rev., 2013, 25, 831–843 CrossRef.
- L. d S. N. S. Barbosa, D. Bogdanov, P. Vainikka and C. Breyer, Hydro, wind and solar power as a base for a 100% renewable energy supply for South and Central America, PLoS One, 2017, 12, e0173820 CrossRef PubMed , https://journals.plos.org/plosone/article?id=10.1371/journal.pone.0173820. Publisher: Public Library of Science.
- A. Clerjon and F. Perdu, Matching intermittency and electricity storage characteristics through time scale analysis: An energy return on investment comparison, Energy Environ. Sci., 2019, 12, 693–705 RSC.
- O. J. Guerra,
et al., The value of seasonal energy storage technologies for the integration of wind and solar power, Energy Environ. Sci., 2020, 13, 1909–1922 RSC.
- M. Z. Jacobson,
et al., Low-cost solutions to global warming, air pollution, and energy insecurity for 145 countries, Energy Environ. Sci., 2022, 15, 3343–3359 RSC.
- M. Z. Jacobson, A.-K. von Krauland, S. J. Coughlin, F. C. Palmer and M. M. Smith, Zero air pollution and zero carbon from all energy at low cost and without blackouts in variable weather throughout the U.S. with 100% wind-water-solar and storage, Renewable Energy, 2022, 184, 430–442 CrossRef CAS.
- N. A. Sepulveda, J. D. Jenkins, F. J. de Sisternes and R. K. Lester, The Role of Firm Low-Carbon Electricity Resources in Deep Decarbonization of Power Generation, Joule, 2018, 2, 2403–2420 CrossRef.
- M. Jafari, A. Botterud and A. Sakti, Decarbonizing power systems: A critical review of the role of energy storage, Renewable Sustainable Energy Rev., 2022, 158, 112077 CrossRef CAS.
- J. A. Dowling,
et al., Role of Long-Duration Energy Storage in Variable Renewable Electricity Systems, Joule, 2020, 4, 1907–1928 CrossRef.
- C. Andrade, S. Selosse and N. Maïzi, The role of power-to-gas in the integration of variable renewables, Appl. Energy, 2022, 313, 118730 CrossRef CAS.
- G. Luderer,
et al., Impact of declining renewable energy costs on electrification in low-emission scenarios, Nat. Energy, 2022, 7, 32–42 CrossRef.
- G. Fambri,
et al., Techno-economic analysis of Power-to-Gas plants in a gas and electricity distribution network system with high renewable energy penetration, Appl. Energy, 2022, 312, 118743 CrossRef.
- N. Kittner, F. Lill and D. M. Kammen, Energy storage deployment and innovation for the clean energy transition, Nat. Energy, 2017, 2, 1–6 Search PubMed.
- A. O. Converse, Seasonal Energy Storage in a Renewable Energy System, Proc. IEEE, 2012, 100, 401–409 Search PubMed.
- M. Arbabzadeh, R. Sioshansi, J. X. Johnson and G. A. Keoleian, The role of energy storage in deep decarbonization of electricity production, Nat. Commun., 2019, 10, 3413 CrossRef PubMed.
- N. A. Sepulveda, J. D. Jenkins, A. Edington, D. S. Mallapragada and R. K. Lester, The design space for long-duration energy storage in decarbonized power systems, Nat. Energy, 2021, 1–11 Search PubMed.
- R. Wiser,
et al., Expert elicitation survey predicts 37% to 49% declines in wind energy costs by 2050, Nat. Energy, 2021, 6, 555–565 CrossRef.
- Eurostat, Electricity statistics – 2022, https://ec.europa.eu/eurostat/statistics-explained/index.php. (last accessed: 01.12.2022).
- SFOE, Swiss Federal Office of Energy, Wasserkraftanlagen der Schweiz Entwicklung der Leistung und der mittleren Produktionserwartung, https://www.bfe.admin.ch/bfe/en/home/supply/renewable-energy/hydropower.html. (last accessed: 07.01.2021).
- SFOE, Swiss Federal Office of Energy, Windenergiestrategie: Winterstrom & Klimashutz, Analyse und Aktualisierung des Potenzials der Windenergie in der Schweiz, https://www.bfe.admin.ch/bfe/en/home/supply/renewable-energy/wind-energy.html. (last accessed: 07.01.2021).
- SWI, Swissinfo.ch, Why is solar power struggling to take off in Switzerland? https://www.swissinfo.ch/eng/bright-future-_why-is-solar-power-struggling-to-take-off-in-switzerland-/45350090. (last accessed: 07.01.2021).
- ENTSO-E, Installed Capacity per Production Type – Installed Generation Capacity Aggregated [14.1.A], https://transparency.entsoe.eu/generation/r2/installedGenerationCapacityAggregation/show. (last accessed: 03.01.2021).
- Eurostat, EU energy statistical pocketbook and country datasheets (last accessed 02.01.2021), https://ec.europa.eu/energy/data-analysis/energy-statistical-pocketbook/.
- SFOE, Swiss Federal Office of Energy, Large-scale hydropower, https://www.bfe.admin.ch/bfe/en/home/supply/renewable-energy/hydropower/large-scale-hydropower.html.
- REE, Red Eléctrica de España, Series estadísticas del sistema eléctrico español, https://www.ree.es/es/datos/publicaciones/series-estadisticas-nacionales.
- IHA, International Hydropower Association, Country profile, Germany, https://www.hydropower.org/country-profiles/germany.
- Statista, Romania: Pure pumped storage capacity from 2008 to 2020, https://www.statista.com/statistics/867886/pure-pumped-storage-capacity-in-romania/.
- IHA, International Hydropower Association, Country profile, United Kingdom, https://www.hydropower.org/country-profiles/united-kingdom.
- Statista, Total wind energy production capacity in France between 2008 and 2020, https://www.statista.com/statistics/1074682/capacity-production-energy-wind-france/.
- Clean Energy Wire, German offshore wind power – output, business and perspectives, https://www.cleanenergywire.org/factsheets/german-offshore-wind-power-output-business-and-perspectives.
- Wind Energy Ireland, About wind, Facts & Stats, https://windenergyireland.com/about-wind/facts-stats.
- Statista, Total wind power capacity in Italy from 2012 to 2020, https://www.statista.com/statistics/421815/wind-power-capacity-in-italy/.
- Statista, Onshore wind energy capacity in Switzerland from 2008 to 2020, https://www.statista.com/statistics/870790/onshore-wind-energy-capacity-in-switzerland/.
- Renewable UK, Wind Energy Statistics, https://www.renewableuk.com/page/UKWEDhome.
- AEE, Spanish Wind Energy Association, Wind energy in Spain, https://www.aeeolica.org/en/about-wind-energy/wind-energy-in-spain/.
- IRENA, Renewable capacity statistics 2019, International Renewable Energy Agency (IRENA), Abu Dhabi, 2019.
-
J. Ahola, National Survey Report of PV Power Applications in Finland. https://iea-pvps.org/wp-content/uploads/2020/01/NSR_Finland_2018.pdf. PVPS, Photovoltaic Power Systems.
- Bundesministerium für Wirtshaft und Energie, Entwicklung der Bruttostromerzeugung und der installierten Leistug von Photovoltaikanlagen in Deutschland, https://www.erneuerbare-energien.de/EE/Redaktion/DE/Textbausteine/Banner/banner_photovoltaik.html.
- StatLine, Zonnestroom; vermogen bedrijven en woningen, regio(indeling 2018), 2012-2018, https://opendata.cbs.nl/statline/#/CBS/nl/dataset/84518NED/table?ts=1581491112239.
- APREN, Portuguese Renewable Energy Association, Evolution of the Installed Capacity of the Different Sources of Electricity Generation in Portugal between 2000 and 2020, https://www.apren.pt/en/renewable-energies/power/.
- Emiliano Bellini, Sweden installs record 180 MW of solar in 2018, https://www.pv-magazine.com/2019/04/03/sweden-installs-record-180-mw-of-solar-in-2018/, PV Magazine International.
- Energetski portal, Solar Energy in Serbia (last accessed 03.01.2021), https://www.energetskiportal.rs/en/renewable-energy/solar-energy/.
- IHA, International Hydropower Association, Hydropwer Installed Capacity (Serbia) (last accessed 03.01.2021), https://www.hydropower.org/country-profiles/western-balkans-serbia.
- Terna Group, Produzione di energia idroelettrica in italia, https://download.terna.it/terna/5-PRODUZIONE_8d833bdb946e47d.pdf.
- RTE, Réseau de Transport d'Électricité, Production d'électricité d'origin hydraulique: Bilan électrique 2019, https://bilan-electrique-2019.rte-france.com/hydraulique/.
- IEA, International Energy Agency, Average annual capacity factors by technology, 2018 – Charts – Data & Statistics, https://www.iea.org/data-and-statistics/charts/average-annual-capacity-factors-by-technology-2018. Last updated 6 Mar 2020.
- IRENA, International Renewable Energy Agency, Renewable energy technologies: cost analysis series – hydropower, Volume 1: Power Sector Issue 3/5, 2012.
- P. Ruiz,
et al., Enspreso-an open, eu-28 wide, transparent and coherent database of wind, solar and biomass energy potentials, Energy Strategy Rev., 2019, 26, 100379 CrossRef.
- K. Bódis, F. Monforti and S. Szabó, Could Europe have more mini hydro sites? A suitability analysis based on continentally harmonized geographical and hydrological data, Renewable Sustainable Energy Rev., 2014, 37, 794–808 CrossRef.
- European Commission, Joint Research Centre, Institute for Energy and Transport, Assessment of the European potential for pumped hydropower energy storage: a GIS based assessment of pumped hydropower storage potential, (Publications Office, LU, 2013), https://data.europa.eu/doi/10.2790/86815.
- Eurelectric, VGB Powertech, Facts of Hydropower in the EU (2018), https://www.vgb.org/hydropower_fact_sheets_2018-dfid-91827.html. Generation for a Sustainable Europe.
- Eurostat, Final Energy Consumption in households – EU28 – 2017 reference year (TJ), https://ec.europa.eu/eurostat/statistics-explained/index.php?title=Energy_consumption_in_householdsoldid=488255.
- Eurostat, Final energy consumption in services by type of fuel, https://appsso.eurostat.ec.europa.eu/nui/show.do?dataset=ten00128lang=en. (last update: 15.04.2021).
- Eurostat, the Statistical Office of the European Union, Energy statistics – cooling and heating degree days, https://ec.europa.eu/eurostat/cache/metadata/en/nrg_chdd_esms.htm.
- Visual Crossing Corporation (2022), Visual Crossing Weather (2022) [data service], https://www.visualcrossing.com/weather-data.
- opendatasoft, Leading solution for data sharing, https://www.opendatasoft.com/.
- L. Girardin, F. Marechal, M. Dubuis, N. Calame-Darbellay and D. Favrat, EnerGis: A geographical information based system for the evaluation of integrated energy conversion systems in urban areas, Energy, 2010, 35, 830–840 CrossRef.
- Directorate-General
for Mobility and Transport (European Commission), EU transport in figures – Statistical pocketbook 2020, https://op.europa.eu/en/publication-detail/-/publication/da0cd68e-1fdd-11eb-b57e-01aa75ed71a1.
- bast 2017 – automatische straßenverkehrszählung: Aktuelle werte.
- opendataparis, Comptage routier – données trafic issues des capteurs permanents, https://opendata.paris.fr/explore/dataset/comptages-routiers-permanents/.
- Lazard, Lazard's levelized cost of energy analysis (2019), https://www.lazard.com/media/451086/lazards-levelized-cost-of-energy-version-130-vf.pdf. Version 13.0.
- EIA, U.S. Energy Information Administration, Annual Energy Outlook 2021, https://www.eia.gov/outlooks/aeo/.
- NREL, National Renewable Energy Laboratory, Renewable Electricity Futures Study, Volume 1: Exploration of High-Penetration Renewable Electricity Futures (2012).
-
R. Wiser, et al., Land-Based Wind Market Report: 2021 Edition, Tech. Rep., prepared by Lawrence Berkeley National Laboratory for the Wind Energy Technologies Office of the U.S. Department of Energys Office of Energy Efficiency and Renewable Energy, 2021.
- IEA, International Energy Agency, Energy Technology Perspectives 2020, 2020.
- T. Mai, D. Mulcahy, M. M. Hand and S. F. Baldwin, Envisioning a renewable electricity future for the United States, Energy, 2014, 65, 374–386 CrossRef.
-
N. Blair, K. Cory, M. Hand, L. Parkhill, B. Speer, T. Stehly, D. Feldman, E. Lantz, C. Augustine, C. Turchi and P. O'Connor, Annual Technology Baseline, Tech. Rep., NREL, National Renewable Energy Laboratory (2015), https://www.nrel.gov/docs/fy15osti/64077.pdf.
- IRENA, Renewable power generation costs in 2019, Tech. Rep., International Renewable Energy Agency, Abu Dhabi (2020).
-
J. Neubarth, Social and economic drivers for hydropower develop- ment in Danube countries, Tech. Rep., e3 consult GmbH, 2020.
- DOE, U.S. Department of Energy, Role of Alternative Energy Sources: Hydropower Technology Assessment, https://netl.doe.gov/projects/files/FY12_RoleofAlternativeEnergySourcesHydropowerTechnologyAssessment_090112.pdf.
-
O. Edenhofer, R. Pichs-Madruga, Y. Sokona, K. Seyboth, P. Matschoss, S. Kadner, T. Zwickel, P. Eickemeier, G. Hansen, S. Schlömer and C. von Stechow, IPCC Special Report on Renewable Energy Sources and Climate Change Mitigation, Prepared by Working Group III of the Intergovernmental Panel on Climate Change, Tech. Rep., Cambridge University Press, Cambridge, United Kingdom and New York, NY, USA, 2011 Search PubMed.
- Black and Veatch, Cost and Performance data for Power Generation Technologies, Tech. Rep., National Renewable Energy Laboratory (NREL), 2012, https://refman.energytransitionmodel.com/publications/1921.
- Lazard, Lazard's levelized cost of storage analysis, 2019, https://www.lazard.com/media/451087/lazards-levelized-cost-of-storage-version-50-vf.pdf. Version 13.0 Search PubMed.
- Cole, Wesley J and Frazier, Allister, Cost Projections for Utility-Scale Battery Storage, 2019, https://www.osti.gov/servlets/purl/1529218/.
-
R. Fu, T. Remo and R. Margolis, U.S. Utility-Scale Photovoltaics Plus-Energy Storage System Costs Benchmark, 2018, https://www.nrel.gov/docs/fy19osti/71714.pdf.
- I. Ranaweera and O.-M. MidtgÅrd, Optimization of operational cost for a grid-supporting PV system with battery storage, Renewable Energy, 2016, 88, 262–272 CrossRef.
- X. Fan,
et al., Battery Technologies for Grid-Level Large-Scale Electrical Energy Storage, Trans. Tianjin Univ., 2020, 26, 92–103 CrossRef.
- T. Chen,
et al., Applications of Lithium-Ion Batteries in Grid-Scale Energy Storage Systems, Trans. Tianjin Univ., 2020, 26, 208–217, DOI:10.1007/s12209-020-00236-w.
- H. C. Hesse, M. Schimpe, D. Kucevic and A. Jossen, Lithium-Ion Battery Storage for the Grid – A Review of Stationary Battery Storage System Design Tailored for Applications in Modern Power Grids, Energies, 2017, 10, 2107 CrossRef.
-
F. Calise, M. D. DAccadia, M. Santarelli, A. Lanzini and D. Ferrero, Index, Solar Hydrogen Production, Academic Press, 2019, pp. 559–567, https://www.sciencedirect.com/science/article/pii/B9780128148532099902 Search PubMed.
-
I. Dincer, Index, Comprehensive Energy Systems, Elsevier, 2018, https://www.sciencedirect.com/referencework/9780128149256/comprehensive-energy-systems Search PubMed.
- S. Fendt, A. Buttler, M. Gaderer and S. Hartmut, Comparison of synthetic natural gas production pathways for the storage of renewable energy, Wiley Interdiscip. Rev.: Energy Environ., 2015, 5, 327–350 Search PubMed.
- J. Gorre, F. Ortloff and C. van Leeuwen, Production costs for synthetic methane in 2030 and 2050 of an optimized Power-to-Gas plant with intermediate hydrogen storage, Appl. Energy, 2019, 253, 113594 CrossRef CAS.
- Evaluation Unit DG Regional Policy European Commission, Guide to Cost Benefit Analysis of Major Projects, https://ec.europa.eu/regional_policy/sources/docgener/guides/cost/guide02_en.pdf. Structural Fund-ERDF, Cohesion Fund and ISPA.
-
M. Florio, Applied Welfare Economics: Cost-Benefit Analysis of Projects and Policies, Routledge, 2014 Search PubMed.
- K. Branker, M. J. M. Pathak and J. M. Pearce, A review of solar photovoltaic levelized cost of electricity, Renewable Sustainable Energy Rev., 2011, 15, 4470–4482 CrossRef.
- Change, I. P. o. C., Climate Change 2013: The Physical Science Basis: Working Group I Contribution to the Fifth Assessment Report of the Intergovernmental Panel on Climate Change, Cambridge University Press, 2014.
- R. Frischknecht and S. Büsser Knöpfel, Ecological scarcity 2013 – new features and its application in industry and administration – 54th LCA forum, Ittigen/Berne, Switzerland, December 5, 2013, Int. J. Life Cycle Assess., 2014, 19, 1361–1366, DOI:10.1007/s11367-014-0744-z.
- G. Wernet, C. Bauer, B. Steubing, J. Reinhard, E. Moreno-Ruiz and B. Weidema, The ecoinvent database version 3 (part I): overview and methodology, Int. J. Life Cycle Assess., 2016, 21(9), 1218–1230, DOI:10.1007/s11367-016-1087-8.
- C. Spanos, D. E. Turney and V. Fthenakis, Life-cycle analysis of flow-assisted nickel zinc-, manganese dioxide-, and valve-regulated lead-acid batteries designed for demand-charge reduction, Renewable Sustainable Energy Rev., 2015, 43, 478–494 CrossRef CAS.
- M. Hiremath, K. Derendorf and T. Vogt, Comparative Life Cycle Assessment of Battery Storage Systems for Stationary Applications, Environ. Sci. Technol., 2015, 49, 4825–4833, DOI:10.1021/es504572q.
- M. Baumann, J. F. Peters, M. Weil and A. Grunwald, CO2 Footprint and Life-Cycle Costs of Electrochemical Energy Storage for Stationary Grid Applications, Energy Technol., 2017, 5, 1071–1083 CrossRef CAS eprint: https://onlinelibrary.wiley.com/doi/pdf/10.1002/ente.201600622.
- S. Weber, J. F. Peters, M. Baumann and M. Weil, Life Cycle Assessment of a Vanadium Redox Flow Battery, Environ. Sci. Technol., 2018, 52, 10864–10873 CrossRef CAS PubMed.
- P. Denholm and G. L. Kulcinski, Life cycle energy requirements and greenhouse gas emissions from large scale energy storage systems, Energy Convers. Manage., 2004, 45, 2153–2172 CrossRef CAS.
- C. M. Fernandez-Marchante, M. Millán, J. I. Medina-Santos and J. Lobato, Environmental and Preliminary Cost Assessments of Redox Flow Batteries for Renewable Energy Storage, Energy Technol., 2020, 8, 1900914 CrossRef CAS _eprint: https://onlinelibrary.wiley.com/doi/pdf/10.1002/ente.201900914.
- H. He,
et al., Flow battery production: Materials selection and environmental impact, J. Cleaner Prod., 2020, 269, 121740 CrossRef CAS.
- C. J. Rydh, Environmental assessment of vanadium redox and lead-acid batteries for stationary energy storage, J. Power Sources, 1999, 80, 21–29 CrossRef CAS.
- H. Blanco,
et al., Life cycle assessment integration into energy system models: An application for Power-to-Methane in the EU, Appl. Energy, 2020, 259, 114160 CrossRef CAS.
- G. Reiter and J. Lindorfer, Global warming potential of hydrogen and methane production from renewable electricity via power-to-gas technology, Int. J. Life Cycle Assess., 2015, 20, 477–489, DOI:10.1007/s11367-015-0848-0.
-
A. Santecchia, Enabling Renewable Europe through Optimal Design and Operation, PhD thesis, EPFL, Lausanne, 2022 Search PubMed.
- C. Bussar,
et al., Large-scale integration of renewable energies and impact on storage demand in a European renewable power system of 2050—Sensitivity study, J. Energy Storage, 2016, 6, 1–10 CrossRef.
- A. Galán-Martín,
et al., Time for global action: an optimised cooperative approach towards effective climate change mitigation, Energy Environ. Sci., 2018, 11, 572–581 RSC , https://pubs.rsc.org/en/content/articlelanding/2018/ee/c7ee02278f. Publisher: Royal Society of Chemistry.
- C. Bussar,
et al., Optimal Allocation and Capacity of Energy Storage Systems in a Future European Power System with 100% Renewable Energy Generation, Energy Proc., 2014, 46, 40–47 CrossRef.
- M. Pierro,
et al., Italian protocol for massive solar integration: From solar imbalance regulation to firm 24/365 solar generation, Renewable Energy, 2021, 169, 425–436 CrossRef.
|
| This journal is © The Royal Society of Chemistry 2023 |
Click here to see how this site uses Cookies. View our privacy policy here.  Open Access Article
![[thin space (1/6-em)]](https://www.rsc.org/images/entities/char_2009.gif) 000 TWh per year; a similar uncertainty affects photovoltaic (PV) potential. The differences are due to the use of distinct exclusion areas, directly affecting potential. Nevertheless, there seems to be an increasing awareness that both technologies can satisfy future European electricity demand. A fully renewable and self-sufficient Europe has proved achievable at country level,6,7 based on substantial investment in renewable technologies and the allocation of considerable fractions of non-built-up land. Numerous reviews8–10 emphasize the feasibility – both technical and economic – of a renewable European energy system, with a growing number of publications addressing the increasing electrification of society sectors. Cross-sector flexibility11–13 and different storage strategies are pivotal to closing the supply-and-demand gap. Robust and affordable future energy systems based on RE rely on the capacity to store substantial amounts of electricity on both short (hours and days) and long (weeks and months) timescales, but ultimately rely on the ability to adopt and preserve self-sustaining (i.e. economically viable) system designs.14
000 TWh per year; a similar uncertainty affects photovoltaic (PV) potential. The differences are due to the use of distinct exclusion areas, directly affecting potential. Nevertheless, there seems to be an increasing awareness that both technologies can satisfy future European electricity demand. A fully renewable and self-sufficient Europe has proved achievable at country level,6,7 based on substantial investment in renewable technologies and the allocation of considerable fractions of non-built-up land. Numerous reviews8–10 emphasize the feasibility – both technical and economic – of a renewable European energy system, with a growing number of publications addressing the increasing electrification of society sectors. Cross-sector flexibility11–13 and different storage strategies are pivotal to closing the supply-and-demand gap. Robust and affordable future energy systems based on RE rely on the capacity to store substantial amounts of electricity on both short (hours and days) and long (weeks and months) timescales, but ultimately rely on the ability to adopt and preserve self-sustaining (i.e. economically viable) system designs.14
![[thin space (1/6-em)]](https://www.rsc.org/images/entities/char_2009.gif) |
|![[thin space (1/6-em)]](https://www.rsc.org/images/entities/char_2009.gif) PCg ≫ CCg,
PCg ≫ CCg,![[thin space (1/6-em)]](https://www.rsc.org/images/entities/char_2009.gif) ∀g ∈ GT}
∀g ∈ GT}


![[Doublestruck N]](https://www.rsc.org/images/entities/char_e171.gif) 0, respectively.
0, respectively.


![[thin space (1/6-em)]](https://www.rsc.org/images/entities/char_2009.gif) [hour]
[hour]


![[thin space (1/6-em)]](https://www.rsc.org/images/entities/char_2009.gif) [hour]
[hour]


![[h with combining tilde]](https://www.rsc.org/images/entities/i_char_0068_0303.gif) )) SClong = max(SOClong(
)) SClong = max(SOClong(![[h with combining tilde]](https://www.rsc.org/images/entities/i_char_0068_0303.gif) ))
))

![[thin space (1/6-em)]](https://www.rsc.org/images/entities/char_2009.gif) 000 simulations were conducted. Following each run, the converged scenario is cross-checked against the potential capacities, flagging any infeasible solutions as invalid.
000 simulations were conducted. Following each run, the converged scenario is cross-checked against the potential capacities, flagging any infeasible solutions as invalid.
![[thin space (1/6-em)]](https://www.rsc.org/images/entities/char_2009.gif) c
c


![[thin space (1/6-em)]](https://www.rsc.org/images/entities/char_2009.gif) 000 TWh of electricity per year. Although the technical potential is higher than demand in every country, it is unequally distributed in Europe (Fig. I1–I5, ESI†). Italy accounts for over 30% of the hydro potential from rivers, France alone has more than 20% of the potential capacity for both solar and onshore wind, while offshore wind availability is significantly higher (>30%) in the United Kingdom. When normalising by national demand, solar and wind potentials reach particularly high levels in the Baltic countries, Ireland and Romania, with annual generation potentials comprised between 10 and 25 MWh of electrical energy per MWh of consumption (Table I2, ESI†). Overall, the aggregated potential of all renewable resources in Latvia exceeds the country demand 44 times, whereas it is only 10%, 44% and 60% higher than the annual consumption in Belgium, Slovenia and Switzerland, respectively (Table I4, ESI†).
000 TWh of electricity per year. Although the technical potential is higher than demand in every country, it is unequally distributed in Europe (Fig. I1–I5, ESI†). Italy accounts for over 30% of the hydro potential from rivers, France alone has more than 20% of the potential capacity for both solar and onshore wind, while offshore wind availability is significantly higher (>30%) in the United Kingdom. When normalising by national demand, solar and wind potentials reach particularly high levels in the Baltic countries, Ireland and Romania, with annual generation potentials comprised between 10 and 25 MWh of electrical energy per MWh of consumption (Table I2, ESI†). Overall, the aggregated potential of all renewable resources in Latvia exceeds the country demand 44 times, whereas it is only 10%, 44% and 60% higher than the annual consumption in Belgium, Slovenia and Switzerland, respectively (Table I4, ESI†).


