 Open Access Article
Creative Commons Attribution 3.0 Unported Licence
On the role of system integration of carbon capture and mineralization in achieving net-negative emissions in industrial sectors†
Rafael
Castro-Amoedo
*,
Julia
Granacher
,
Mouhannad Abou
Daher
and
François
Maréchal
Industrial Process and Energy Systems Engineering (IPESE), Ecole Polytechnique Fédérale de Lausanne, Sion, Switzerland. E-mail: rafael.amoedo@epfl.ch
First published on 4th July 2023
Abstract
Carbon capture and storage (CCS) is commonly acknowledged as a valuable technology for reducing industrial emissions. However, limited installation capacity raises questions about its ability to scale up effectively and promptly. This issue can, in part, be attributed to expensive and energy-intensive processes, as well as the poorly-understood role of heat- and material integration. Here, we show that net-zero and net-negative industrial sectors are possible by integrating capture and mineralization in cement production, steel manufacture, and waste incineration. These sectors feature large amounts of waste heat, alkaline solid residues, and process emissions. We estimate that the three sectors combined could reduce European emissions by 27% (c.a. 860 Mton), with marginal abatement costs between 62 and 85 EUR per ton of CO2. These values compare favorably with deploying capture and storage separately, with economic benefits of up to 50%. Moreover, CCS needs to be considered within an industrial cluster to justify its economic and environmental deployment, with system integration being crucial when taking investment decisions.
Broader contextCarbon capture and storage (CCS) plays a significant role in reducing industrial emissions. System integration (i.e. heat- and material integration) is crucial to achieving net-zero and net-negative industrial sectors when deploying mineralization. The authors modelled and explored the cement, steel and waste incineration sectors. Emission savings of up to 860 Mton of CO2 and economic benefits of up to 50% were achieved, compared to stand-alone capture and mineralization processes. The authors have shown that system integration features are crucial to the economic and environmental deployment of CCS solutions, and should not be overlooked. |
1. Introduction and motivation
With almost two-thirds of world emissions traced to energy-related activities – from industry, but also mobility and the building sector – the electrification of demand, coupled with renewable and low-carbon technologies, has received most of the research and investment efforts for a clean transition.1 However, there are industrial processes for which electrification is not foreseen, notably waste incineration, cement, and steel manufacture. These are among the sectors for which carbon capture and storage (CCS) was primarily designed.2When applied to industrial facilities, this technique consists of capturing CO2 from stationary sources, such as flue gases, and sequestrating it either in geological cavities or as carbonates. As recently highlighted by Grim et al.,3 post-combustion carbon capture is a mature and commercially available technology, with thousands of potential CO2 point sources worldwide. However, as of 2020, only 23 large-scale projects were operating or undergoing construction, mainly due to the low economic value associated with CO2 and the high costs of capture.
Nevertheless, depending on the CO2 origin (totally or partially biogenic), but also on the energy required for the capture and sequestration steps, CCS might become a negative emissions technology (NET), effectively decreasing atmospheric CO2.4,5 The entire life-cycle needs to be accounted for, evaluating whether the total removal of greenhouse gas (GHG) emissions is larger than the total GHGs emitted throughout the removal process – including energy requirements and logistic considerations. Tanzer and Ramirez6 highlighted this dimension, debating and clarifying the misuse of the term ‘negative emissions’. Terlouw et al.7 reviewed numerous CO2 removal techniques, pointing out the recurring misinterpretation of LCA results, often leading to negative emission results.
The two main storage approaches currently discussed are deep-geological storage and mineralization.8 In recent years, the former has gained traction, and aims to inject compressed CO2 into partially depleted oil and gas fields. However, projects still need to demonstrate its feasibility, scalability, and safety as well as its potential to effectively mitigate GHG emissions.9 Mineralization, on the other hand, has seen an exponential growth in publications and related patents;10–12 this approach consists of producing carbonates, by reacting a metal oxide material – present in alkaline solid residues and mineral ores such as serpentine, olivine, and wollastonite – with CO2. Some of the most pertinent features of ex situ‡ mineral carbonation can be highlighted:
• Safe and ‘leakage-free’ long-term CO2 storage options, requiring virtually no monitoring;13 this contrasts with deep-geological storage, which although leveraging enhanced oil recovery field experience, requires monitoring over extended periods of time (years to decades);14
• Abundant and geographically widespread mineral resources,15 making mineralization feedstock available and cheap; this contrasts with partially depleted gas and oil fields used for geological storage, which are geographically dispersed, raising uncertainty concerning a potential disruption16 and/or societal risks;17
• Sole CCS technology currently available for small and medium-scale (below 1 Mton CO2/year) emitters;18
• Potential for recovering and integrating the heat released during carbonation into a suitable industrial sector; although in the deep-geological case, there are some studies that point out the possibility of carbonation,19 the exothermic character of such reaction is totally lost;
• Value-added carbonates and by-products (SiO2), that can be used as construction aggregates, blended cement, asphalt, or even for land reclamation.4,20,21
• Reduced transport distances in the overall supply chain, and reduced system complexity compared to deep-geological storage.21
1.1 Mineralization
Carbonation happens spontaneously in nature, with approximately 100 million tons of carbon bounded per year by such process.22 Known as natural weathering, it is the process by which CO2 reacts with a metal (such as Ca, Mg, Fe), forming stable carbonates. The concept of industrial mineral carbonation, also known as CO2 mineralization or simply mineralization, dates from the 90s22 and was primarily developed in the USA using Ca-based feedstocks, motivated by the residues of the cement industry and its calcium looping technique. Progressively, different feedstocks and configurations were tested and reported.13Mineralization is defined as the uptake of CO2 to form new products through the cleavage of bonds within mineral silicates, promoting and mimicking natural rock weathering. The exothermic reaction of carbon dioxide with minerals/metal oxides forms stable carbonated compounds (eqn (1)), in which M is an alkaline metal of the 1st or 2nd group of the periodic table. A source of CO2 is required, which can be pure CO2 (after capture); in some cases, flue gases can be used directly.
| M+O + CO2 → M+CO3 + Heat | (1) |
1.2 Mineralization feedstocks
There are two main types of metal sources for mineralization: alkaline solid waste or mineral ores. Prominent among the former are industrial solid residues such as bottom ash and steel slag, whereas for the latter, serpentine, olivine, and wollastonite are the most common ores. From a mineralization perspective, alkaline-earth metals such as magnesium and calcium are preferred to alkali metals (e.g. sodium, potassium), which have the disadvantage of being extremely soluble in water (1100 g K2CO3/L vs. 15 mg CaCO3/L at 25 °C). Apart from magnesium and calcium, other alkaline-earth metals also form stable carbonates but are rare in applications and more expensive,15 or are only marginally stable, such as iron carbonates.15Alkaline solid wastes, although available in limited quantities, offer a number of advantages compared to mineral ores. Besides avoiding mining and long-distance transportation, alkaline wastes are chemically less stable from a thermodynamic viewpoint than mineral ores,30 thus often not requiring reactive ion extraction and extensive pre-treatments. Furthermore, throughout their life-cycle in chemical operations, the large majority of alkaline wastes have already been subjected to high-temperature treatments. Unfortunately, quantities of alkaline wastes are not enough to either directly or indirectly (via substitution policies) eliminate industrial emissions. The complementary use of mineral ores is necessary. According to several studies15,20,31–33 the amount of natural mineral ores available is enough to mineralize 5 × 10⁷ Gt of CO2, a value far superior to all anthropogenic emissions. In spite of that, mining and pre-treatment still pose obstacles to large-scale mineralization deployment.20,27,34
From a mechanistic viewpoint, magnesium and calcium oxides and hydroxides are ideal substrates. However, due to their reactivity, these elements are usually found in silicate forms: CaSiO3 for wollastonite, Mg2SiO4 in Olivine and Mg3Si2O5 (OH)4 in serpentine, thus requiring pre-treatment. Common mineral ores containing magnesium have a considerably higher MgO content (up to 57 wt% for olivine14) compared to those containing calcium silicates, such as basalt (10 wt%). The exception is wollastonite, the richest ore in calcium, with values close to 50 wt%.35 In addition, calcium-based feedstocks can produce high-purity carbonates, which can supply a growing market. Calcium carbonate, for example, can be used in the pulp and paper industry as a whitening agent. Magnesium carbonate, on the other hand, has a smaller demand and any medium-to-large industrial deployment would quickly saturate the current market.36 Therefore, alternative uses would be required such as construction aggregates, mine reclamation, or road-filling materials.30,34
1.3 Energy needs and industrial coupling
The steps required to activate and prepare ores for mineralization are energy-intensive, part of which is at high pressure and high temperature.37 Such needs must be supplied by external sources, despite the exothermic character of mineralization reactions. In this regard, industrial sectors with heat surplus (i.e. waste heat) and an adequate thermal profile are suitable for symbiosis.The coupling of CCS in industrial clusters is an opportunity to recover part of industrial waste heat. Despite growing awareness and increasing industrial efficiency, approximately 20% of European industrial energy consumption is still lost as waste heat,38 which comprises all the heat flows discharged to the environment that could still be used (e.g. heat lost in cooling towers, aerocondensers, flue gases, but also in energy conversion units, such as boilers and engines). As suggested and reviewed by Bütün et al.,39 waste heat can be valued through direct heat recovery within or between processes, or by ‘upgrading’ its value, using heat pumps or organic Rankine cycles. An example, illustrated in Bütün et al.,39 is the steel industry, which contains a large ‘theoretical’ potential (i.e. considerable heat losses at high temperatures), that is technically challenging to harvest, as heat recovery from solids is not mature. These technical constraints affect the economics of heat recovery and need to be taken into account.
2. State-of-the-art
Research on mineralization has been primarily focused on assessing and optimizing operating conditions, such as reaction temperature, pressure, and chemical additives, motivated by the need to overcome intrinsic kinetic limitations.29,40,41 Despite being an important dimension, mineralization needs to be integrated into an industrial context, where it profits not only from waste heat but also from concentrated CO2 streams and suitable infrastructure.Several lines of evidence suggest that aqueous mineral carbonation is the most promising design among carbonation options,23,27,42,43 which would profit from a valuable end-product, such as high-purity CaCO3 or MgCO3. This would allow for larger investments and operating expenditures, which could unleash a rapid expansion and scaling, as seen for several renewable technologies – a standard example being the evolution of photovoltaic panels price in recent years.44 As early as 2005, Katsuyama et al.42 designed a procedure for ultra-high purity CaCO3 production via mineralization. A break-even price of 320 $ per m3 of CaCO3 was estimated, which was considerably higher than spot market values.
Pan et al.4 assessed the potential of using alkaline solid wastes for CO2 storage via mineralization. Based on their calculations, 4 Gt of CO2 could be avoided per year, corresponding to 12.5% of anthropogenic CO2 emissions. However, this effectively sets an upper bound, since it disregarded any transportation and potential energy integration. In addition, the large majority (3.7 Gt) came from environmental credits for using carbonated products, based on an LCA substitution framework. Coincidentally, the industrial coupling is one of the key points the authors have suggested to maximize net CO2 reduction, which has also been endorsed by the review article of Olajire.13 In the same vein, Habert et al.45 reviewed decarbonization strategies in the cement and concrete industry, emphasizing the value of integration along the value chain, while categorically excluding carbon-neutral cement without CCS.
2.1 System integration
The International Energy Agency (IEA) has issued a technical report46 on potential commercial uses of CO2, placing mineralization as a promising technology in an industrial environment, although in need of comprehensive and holistic studies. Ostovari et al.34 were among the few that tackled the integration of mineralization at an industrial scale. However, a rather simplified input-output model was used and the instrumental heat integration dimension was neglected. In another study, Ostovari et al.5 integrated CO2 capture and mineralization in the cement sector. They were able to demonstrate that by combining CO2 from DAC – in addition to cement off-gas – and the use of carbonation by-products (SiO2) to replace clinker, a carbon-negative cement (up to −0.53 ton CO2/ton cement) could be produced. However, heat recovery was a secondary concern, with assumptions made concerning its extent on the overall system. Moreover, inefficiencies either at the reaction level or solvent recovery were disregarded.More recently, Ostovari et al.20 designed a climate-optimal solution for mineralization deployment in Europe, showing that exploring serpentine, olivine, and steel slag in Europe is able to harvest 24% of the 538 Mt of industrial European emissions (i.e. cement, steel, paper, and chemical industries), emphasizing that bearing the consequences of the full supply chain is of crucial importance when assessing the emission reduction potential of mineralization systems. This is particularly relevant when transporting minerals for long distances (such as inter-continental trips) or considering harsh pre-treatments. As claimed by Ostovari et al.,20 in Europe, the supply chain dimension reduced the potential CO2 offset by 27%. Out of these, 72% was allocated to the energy dimension (heat and electricity supply for thermal treatment, grinding, and other pre-treatments), 13% for solid feedstock transport, and 2% for CO2 transport. It seems clear that the two latter pale in comparison to the energy dimension, which is the main focus of this work.
2.2 Gaps and contribution
A frequently overlooked feature of mineralization is the exothermic nature of the process, which allows for heat and material integration in existing industrial clusters, thus potentially decreasing resource consumption and associated costs. At present, there is a lack of understanding of the mineralization potential for effective CO2 mitigation, as well as the symbiosis prompted by its integration with different industrial sectors. This work contributes to the state-of-the-art by proposing a platform for competitive mineralization integration with economic, environmental, and thermodynamic assessment in industrial sectors, contributing to its deployment at a large scale, and emphasizing the role of system integration.A new approach in this work is to consider both the ‘technical’ and ‘economic’ potential of waste heat, as classified by the IEA,47 which is particularly important in industrial sectors. The feasibility of recovery is assessed, and only ‘technically’ feasible streams are included in the analysis. This level of detail is rarely seen in the literature. Moreover, we bridge the gap between modeling and optimization; we expand and leverage the contribution of Ostovari et al.,34 by not only including different alkaline waste sources as described in Pan et al.4 but also by quantifying the synergies obtained when mineralization is integrated into different industrial sectors. Furthermore, process inefficiencies are accounted for, in addition to practical limitations such as solvent recycling.
Lastly, we update the view on the seminal IPCC special report on mineralization,14 in which natural-based ores, such as serpentine and olivine, had inherently low rates of carbonation, leading to particularly large reactors and thus expensive procedures. Although natural ores still need to undergo energetically demanding activation steps, industrial sector coupling is instrumental in the efforts to minimize environmental impact and economic burden, further facilitated by industrial clustering and large quantities of waste heat.
3. Modeling and optimization
This work focuses on integrating and promoting mineralization reactions in industrial sectors, and is divided into two macro-blocks:1. Modeling and simulation of carbon capture and mineralization reactions using both alkaline solid residues and mineral ores as feedstock, covering the required preparation steps and operating conditions.
2. System-level optimization, integrating mineralization within industrial sectors, showing the benefits of mass and heat integration. An economic and environmental analysis is included, and break-even points are assessed.
Economic assessment and macro-level analyses are key elements of this study and are insightful for deploying mineralization technologies. By adopting a macro perspective, the potential for carbon capture and mineralization is demonstrated in representative European industrial sectors. Each sector is first analyzed without CCS, which defines the reference scenario. Subsequently, CO2 capture and mineralization are integrated. Only hard-to-eliminate industrial CO2 emissions are addressed, which represent intrinsic industrial process emissions. Moreover, minerals are transported to industrial sites which contain both waste heat and alkali residues.
Simulation models are developed using Aspen Plus and included in a mixed-integer linear programming (MILP) superstructure optimization approach, which accounts for economic and environmental performance as well as heat integration features. Each industrial sector is compared based on the mineralization of 1 ton of CO2, captured from the flue gas streams of the corresponding industrial process: cement production, waste incineration, and steel manufacturing. The dilute CO2 is initially separated and concentrated using chemical absorption with amines, and subsequently used to form carbonates.
3.1 Modeling and simulation
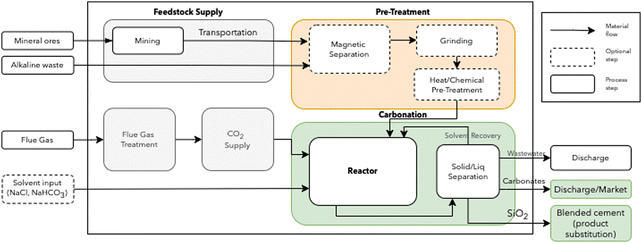
In an industrial environment, an ex situ mineral carbonation takes place, in which alkaline wastes together with mineral ores are used as feedstock. Serpentine, olivine, and wollastonite are often tested in carbonation studies,41 with large quantities of data available, justifying their choice in this work. Two aqueous carbonation configurations were explored: direct carbonation (DC) in which the extraction of magnesium or calcium and the carbonation takes place in one step; indirect carbonation (IC) which consists of leaching the metals from the solid matrix prior to the carbonation reaction.Carbonated products (CaCO3 and MgCO3) can be sold or discharged, whereas the by-product (SiO2) can be employed to partially replace clinker in the manufacture of cement,48 in a formulation known as blended cement. The same assumption and suggestion of Ostovari et al.34 is here considered, notably a 95% cement substitution credit. This substitution policy is likely to be a point of intense debate and therefore merits thorough clarification. Underlying the assumption of Ostovari et al.34 is the work by Benhelal et al.48 that showed pozzolanic activity of SiO2. Such behavior enables SiO2 to substitute clinker and be mixed with Ordinary Portland cement to create a blended formulation. According to the standards for the blended formulation,49 up to 40% of Portland cement is available for substitution, which equates to roughly 1.8 Gton per year. Nevertheless, as discussed in Ostovari et al.5 fractions of SiO2 above 35% jeopardize the required pozzolanic reaction.
The schematic representation of the DC option is shown in Fig. 1. A detailed description of each step is provided in A similar scheme describing the IC route is available in ESI.†
3.2 System-level optimization
Economic and environmental models are integrated into a process integration (PI) model, adapted from Butun et al.50 and Castro-Amoedo et al.51 The objective is to minimize Total Annualized Cost (TC). The economic model links the PI stage with monetary flows and is used to compute the total cost of the system (eqn (2)), composed of investment (Capex) and operating expenses (Opex). A description of the equations used, the constraints applied to the model, and the details of the method are explored in ESI.†| TC = Opex + Capex | (2) |
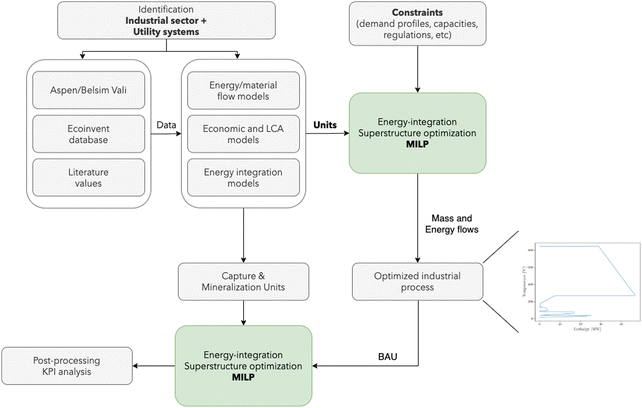 | ||
| Fig. 2 Simulation and optimization procedure for integrating mineralization in industrial sectors. BAU: business as usual. | ||
Solutions are compared based on economic and environmental considerations. Besides the total cost and carbon footprint (eqn (S36), ESI†) partition, three other key performance indicators (KPIs) are defined. Carbonates break-even (eqn (3)) is the required selling price of carbonates to bring each solution to the same level as BAU. CO2 offset (eqn (4)) suggests the monetary value of GHG emissions that would promote mineralization. The marginal abatement cost (MAC), computed according to eqn (5), shows the effective specific cost to mitigate CO2.
 | (3) |
 | (4) |
 | (5) |
4. Applications
Each of the assessed industrial sectors – cement production, waste incineration, and steel manufacturing – were modeled according to the best available techniques (BAT) and represent the state-of-the-art of European industry. Considering that these sectors are now embracing carbon neutrality in their agendas, retrofitting strategies such as carbon capture coupled with mineralization are among the potential technologies to achieve it.2,25 Each sector co-produces alkaline solid wastes that are currently discharged, and have the potential to be used as mineralization feedstock, although their uptake potential is a small part – approximately 5% – of the emitted CO2.Transport assumptions were the same across sectors. Based on the work of Ostovari et al.20 and Cheilletz et al.,53 a distance of 350 km was assumed between the extraction site of mineral ores and each industrial sector. A 50/50 partition between road and freight train was assumed. The environmental impact of mining was also considered. A detailed description of the heat profiles, cost assumptions, and environmental considerations is provided in ESI.†
Cement production
Cement is an energy-intensive material, with energy representing up to 25% of cement production cost.54 At an annual global production rate of 4200 Mton (of which, 200 Mton are produced in Europe), it contributes to around 7% of global CO2 emissions. By 2050, the sector is expected to grow between 12 and 25% the current production.54 Although four conventional routes exist to produce cement, the sector was modeled according to the dry process, as 90% of European cement is manufactured in such a fashion.54 Emissions are close to 0.81 tCO2/tcement, with the calcination process accounting for 65%, and fuel combustion emissions making up the balance.2,54,55 Individual flows were modeled according to two EU reports: EPOS56 and AIDRES.57Cement manufacture includes three main steps: calcination, clinkering, and milling. During calcination, limestone is decomposed into calcium oxide (CaO) and CO2 at 900 °C. Clinkering is the reaction of CaO with aluminum oxide (Al2O3), silicon oxide (SiO2) and ferric oxide (Fe2O3) at 1400–1500 °C to form clinker. Finally, this clinker is mixed with gypsum and other additives to be milled and produce cement. A simplified operation diagram is shown in Fig. 3.
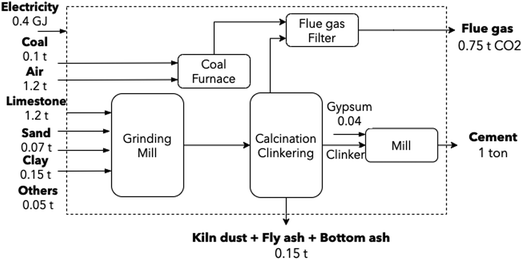 | ||
| Fig. 3 Conventional cement production route. Dust, bottom and fly ash flows from the kiln and coal furnace were retrieved from Lena et al.58 and Plaza et al.54 | ||
Carbon capture technologies have been studied and deployed in the cement industry, with prices ranging from 38 EUR per ton CO2 (for solid sorbent technology), up to 84 EUR per ton (for membrane systems).54 Gardarsdottir et al.59 priced the cost of capture in retrofitted cement plants at 80 EUR per ton of CO2. However, the base cost of a cement plant product (clinker) increased between 49 and 92%, only accounting for the capture stage.
Waste incineration
Waste incineration with energy recovery, or waste-to-energy, is an efficient method to dispose of municipal solid waste (MSW), with volume and mass reduction up to 90% and 85%, respectively.60 Solid residues, i.e. bottom ash (BA) and fly ash (FA), compose the remaining 15% mass, with a ratio of 9![[thin space (1/6-em)]](https://www.rsc.org/images/entities/char_2009.gif) :
:![[thin space (1/6-em)]](https://www.rsc.org/images/entities/char_2009.gif) 1. Waste generation in Europe exceeded 2000 Mton in 2020, out of which 138 Mton are directed towards incineration with energy recovery.61 Waste treatment equates to 3.2% of Europe's GHG emissions.62 In this context, Rosa et al.63 have recently studied the use of bioenergy with carbon capture and storage, emphasizing the potential of waste to promote biogenic carbon dioxide removal of 36 Mton of CO2 and a fossil contribution of 28 Mton of CO2 on a yearly basis.
1. Waste generation in Europe exceeded 2000 Mton in 2020, out of which 138 Mton are directed towards incineration with energy recovery.61 Waste treatment equates to 3.2% of Europe's GHG emissions.62 In this context, Rosa et al.63 have recently studied the use of bioenergy with carbon capture and storage, emphasizing the potential of waste to promote biogenic carbon dioxide removal of 36 Mton of CO2 and a fossil contribution of 28 Mton of CO2 on a yearly basis.
By separating its biogenic and fossil fractions and focusing on its sustainability, MSW can be perceived as a low-carbon content fuel.64 Moreover, waste-to-energy is an inevitable technology of the future energy system, present even in the most optimistic and ambitious scenarios for the energy transition.65 Emission abatement strategies are thus necessary, with large plants retrofitting to accommodate CCUS.65,66 This sector was modeled using data from an incinerator operating in Switzerland, serving a population of 300![[thin space (1/6-em)]](https://www.rsc.org/images/entities/char_2009.gif) 000 inhabitants-equivalent, considered to be state-of-the-art and representative of the average European incinerator. Fig. 4 shows a schematic representation, highlighting major mass and energy flows.
000 inhabitants-equivalent, considered to be state-of-the-art and representative of the average European incinerator. Fig. 4 shows a schematic representation, highlighting major mass and energy flows.
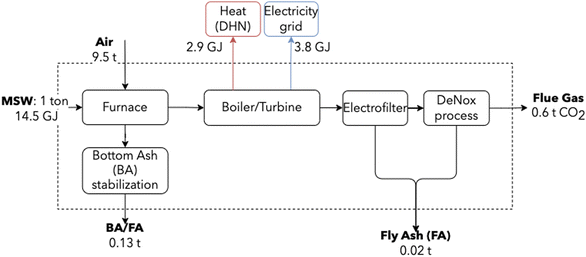 | ||
| Fig. 4 Simplified MSW incineration block diagram. Energy is recovered using a steam cycle for the co-generation of heat and electricity. Values are based on information from an industrial partner. | ||
Steel manufacture
The iron and steel sectors are responsible for approximately 22% of the total industrial energy demand, corresponding to 8% of global total energy and contributing 7% of global GHG emissions.67 A total of 157 Mton of crude steel are produced every year in Europe, which accounts for 4% of European GHG emissions, with approximately 60% originating from the integrated blast furnace and basic oxygen furnace route (BF/BOF), and 40% from the electric arc furnace (EAF) route. Total (direct and indirect) CO2 emissions are close to 2.0 tCO2/tsteel.2 According to Tian et al.,68 direct emissions (combustion and process) account for 1.5 tCO2/tsteel (77%). Specific stream values are retrieved from Uribe-Soto et al.,69 EPOS56 and AIDRES.57 The production line can be summarized as a two-stage process. In the first, a reducing agent eliminates oxygen from the iron ore – a high-temperature and energy-intensive procedure – often with large CO2 emissions. In the second step, liquid steel is produced by melting and adjusting the steel chemistry for the required properties. The schematic representation (Fig. 5) highlights major flows; in particular, for the production of 1 ton of steel, 60 kg of slag are co-produced.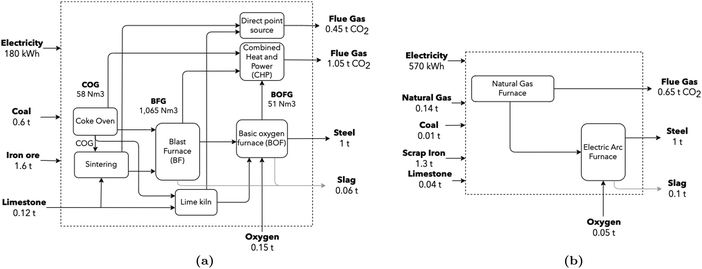 | ||
| Fig. 5 (a) Conventional BF/BOF steel production route, adapted from ref. 70. CO2 stream composition leaving the CHP unit was computed assuming complete combustion. (b) Electric arc furnace production route. Values for both routes are retrieved from Uribe-Soto et al.,69 Tian et al.,68 EPOS56 and AIDRES.57 | ||
5. Results and discussion
The integration of mineralization using different alkaline waste and mineral ores is studied in three industrial sectors, individually discussed: cement, waste incineration, and steel production. Each of them contains a detailed analysis of the integration effect and the consequences from both economic and environmental perspectives, including a break-even analysis. Solutions are then compared with state-of-the-art results, which provide a macro-scale perspective on the road to net-negative emissions.5.1 Cement production
According to a few studies, carbon-neutral cement would be possible by combining bio-energy, deep-geological storage of CO2 and low-carbon electricity.71,72 In this work, carbon-negative cement is achieved via the synergies introduced by heat integration and by the substitution credits that can be claimed.From an environmental perspective, the recommendation of the IEA is to reduce the cement sector carbon bill to 0.8 Gton CO2 per year by 2050, from the current 2.4 Gton per year. This translates to an average environmental load of 0.2 ton CO2 per ton cement. Such a result is attainable regardless of the mineral ore used (Fig. 6a). However, the use of wollastonite promotes the largest offset potential, due to a more simplified reaction procedure, translated by a simplified pre-treatment operation, compared to other naturally-occurring silicates. In addition, two strategies are compared with mineralization (Fig. 6b), according to the data provided in Terlouw et al.:73 carbon capture in the cement sector coupled with deep-geological storage in (i) Switzerland (CCS CH local) and (ii) transported 2000 km by pipeline (CCS CH + 2000 km). Mineralization outperforms both strategies but relies on the environmental substitution policy – a determinant assumption for reducing emissions, and instrumental in reaching a carbon footprint below −1 ton CO2-eq per ton of CO2 stored. Switzerland was chosen as the representative of the average EU country in terms of industrial clusters and distances between facilities, together with a rather low electricity carbon content (172 g CO2 per kW h).
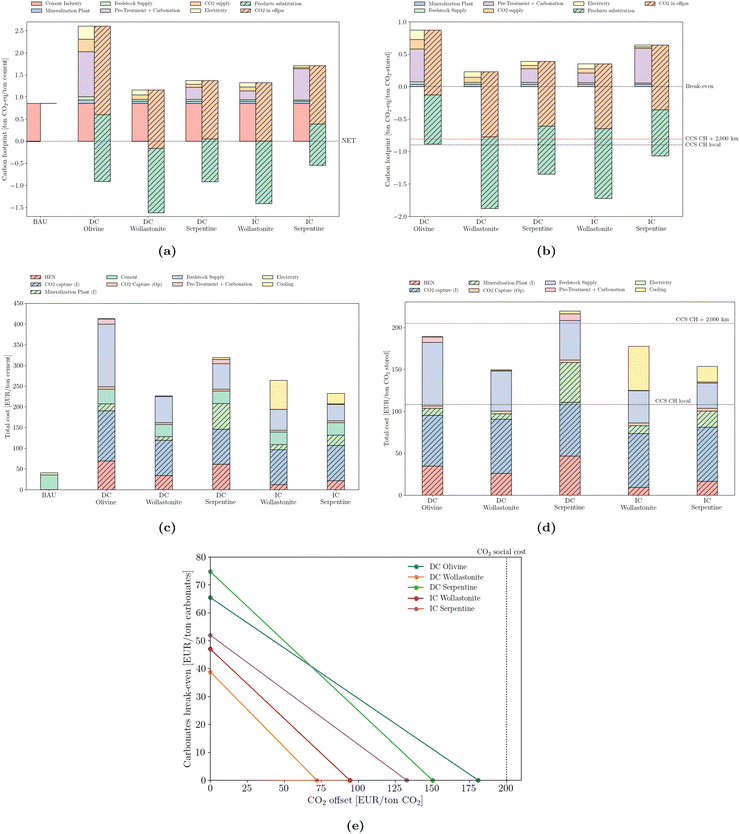 | ||
| Fig. 6 Emissions (carbon footprint) normalized by (a) cement production and (b) stored CO2. Total cost normalized by (c) cement production and (d) stored CO2. ‘CCS CH local’ and ‘CCS CH + 2000 km’ correspond to the carbon footprint of deep geological storage locally or upon 2000 km pipeline transport, according to Terlouw et al.73 (e) break-even values for carbonates and CO2 offset. | ||
The cost structure is normalized from two perspectives: by the total production of cement (Fig. 6c), as well as by the amount of CO2 effectively stored (Fig. 6d). The investment required to promote such a transition is logically consequential. However, its propagation into the cement's final production price is most likely unbearable from an industrial perspective. The least expensive solution requires a quintupling in cement market price, from approximately 45 EUR per ton to 225 EUR per ton. The most expensive design would require up to 420 EUR per ton of cement. From the CO2 storage perspective, values range between 150 and 220 EUR per ton of CO2, which is nevertheless considerably cheaper than any combined DAC solution.74 Furthermore, the possibility of deep storage using local infrastructure seems to outperform even the most cost-effective solution.
From an industrial perspective, it is useful to derive break-even values that would justify mineralization. Such an analysis of the cement sector (Fig. 6e) highlights the trade-off between selling carbonates and taxing emissions. In the absence of a carbon tax, the minimum selling price of calcium carbonate is 40 EUR per ton for the direct carbonation of wollastonite, and reaches 75 EUR per ton in the case of the direct carbonation of serpentine. Conversely, if carbonates are discharged, thus stripped of any economic value, a minimum emissions pricing of 75 EUR per ton of CO2 would justify the deployment of mineralization (DC Wollastonite). Recently, as of February 2023, the carbon price passed 100 EUR per ton CO2 in the EU, making this an economically attractive solution. However, regardless of the mineralization strategy, all values are below the social cost of 200 EUR/t of CO2 as defined by Kikstra et al.75 A combination of carbonates selling price and a CO2 tax is also possible. The solid lines define the minimum value of such a combination, with values lying in the area above the line rendering the adoption of mineralization profitable.
5.2 Waste incineration
The waste sector is different from any other. Not only are its carbon emissions counted differently, owing to its biogenic fraction (assumed 50/50 with the fossil counterpart), but also the co-generation of heat and electricity, together with metal recovery, are able to partially offset its fossil emissions. This is most obvious in Fig. 7a Nevertheless, efficient incinerators benefit from the integration of mineralization, which is able to bring the waste sector into the net-negative GHG domain. Similarly to cement production, the direct carbonation of wollastonite outperforms other types of mineral ores. On a CO2 basis (Fig. 7b), the coupling of mineralization outperforms that of deep-geological strategies, although relying again on substitution credits. From an economic perspective, mineralization brings the waste sector from a profitable system – with profits close to 50 EUR per ton of waste – to a non-profitable one – with expenses ranging from 70 to 120 EUR per ton of waste (Fig. 7c). Using the amount of stored CO2 as the normalization factor (Fig. 7d), costs range between 155 and 220 EUR per ton of CO2 stored. It is worth noting the investment required for the heat exchanger network (HEN), which is lower than in the cement sector, suggesting a less extensive integration. This is motivated not only by a lower waste heat temperature but also by a more integrated BAU system. Again, the use of local structures to store CO2 is cost-competitive with even the least expensive mineralization solution. However, capture and long-distance transport is more costly than any mineralization option. Break-even values (Fig. 7e) are more demanding compared to the other sectors, suggesting a more expensive integration.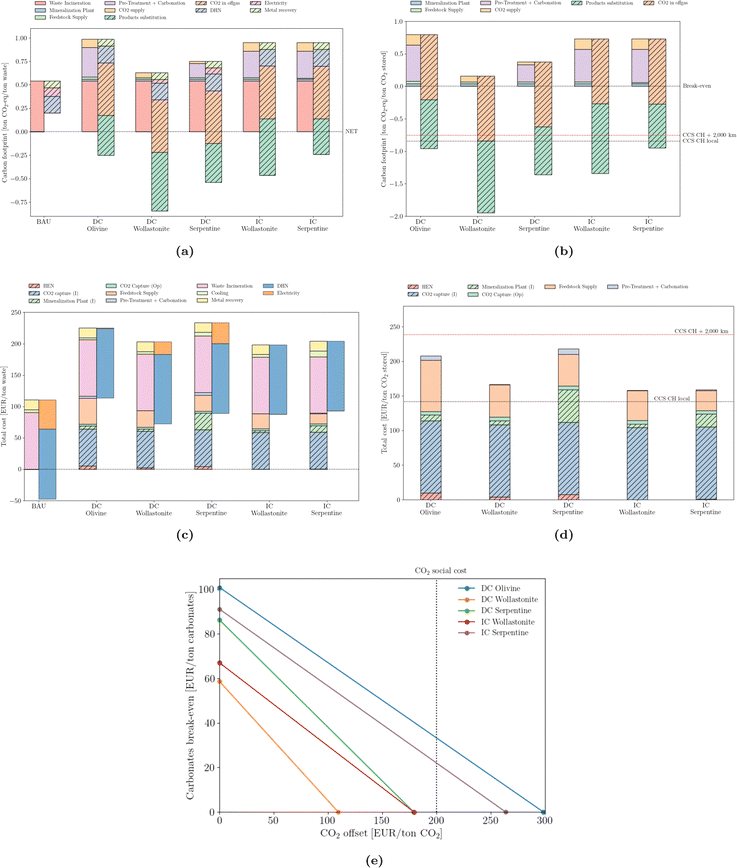 | ||
| Fig. 7 Emissions (carbon footprint) normalized by (a) ton of MSW incinerated and (b) stored CO2. Total cost normalized by (c) ton of MSW incinerated and (d) stored CO2. ‘CCS CH local’ and ‘CCS CH + 2000 km’ correspond to the carbon footprint of deep geological storage locally or upon 2000 km pipeline transport, according to Terlouw et al.;73 (e) break-even values for carbonates and CO2 offset. | ||
5.3 Steel manufacture
The steel sector produces considerably more emissions per ton of final product compared to either cement or thermovalorization of MSW (Fig. 8a). Achieving a net-zero steel sector is particularly difficult. The net-zero emission scenario of the IEA predicts residual CO2 emissions of 0.22 Gt by 205066 or, equivalently, 0.11 tCO2/tsteel. In this work, such a threshold is only achievable by coupling the direct carbonation of wollastonite. Nevertheless, and in line with the two previous sectors, CO2 mineralization can still provide net-negative emissions – Fig. 8b – that are larger than deep-geological options. The integration of mineralization results in an increase in the cost of steel manufacturing (Fig. 8c), of up to twice the reference production value; the capture process and the feedstock supply account for the majority of the extra cost. From the stored CO2 perspective (Fig. 8d), the values (below 200 EUR per ton) are less expensive than either the waste or cement sectors or the option to compress and pipeline CO2 over long distance. Notwithstanding, local storage still outperforms any mineralization design. Break-even values (Fig. 8e) are slightly lower than those of cement.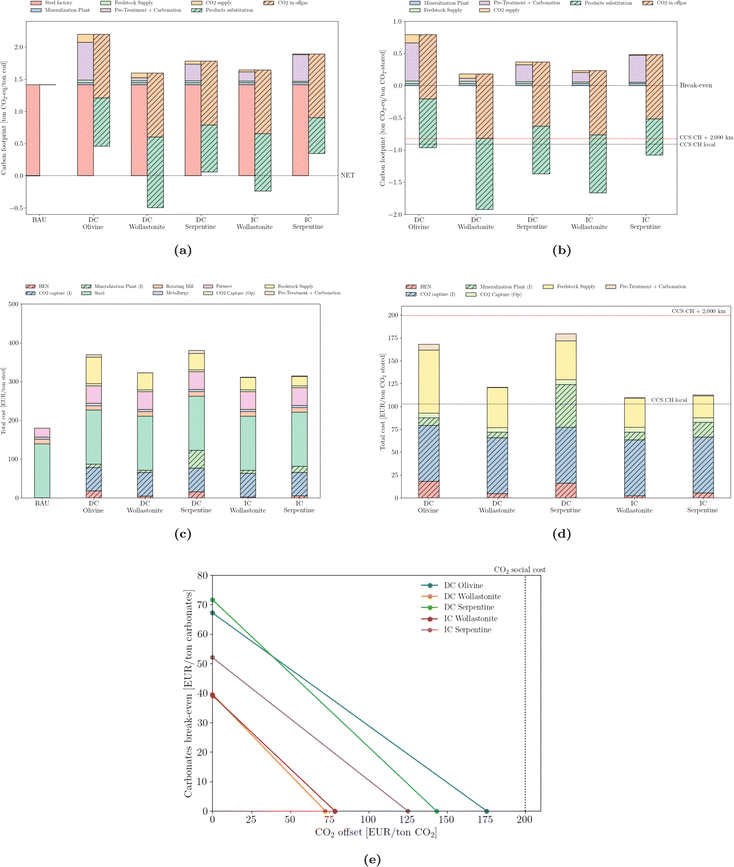 | ||
| Fig. 8 Emissions (carbon footprint) normalized by (a) steel production and (b) stored CO2. Total cost normalized by (c) steel production and (d) stored CO2. ‘CCS CH local’ and ‘CCS CH + 2,000 km’ correspond to the carbon footprint of deep geological storage locally or upon 2000 km pipeline transport, according to Terlouw et al.;73 (e) break-even values for carbonates and CO2 offset. | ||
5.4 Industrial comparison and benchmark
The environmental analysis breakdown, provided in the previous sections, is partially contingent on the emission factors associated with the present energy mix. However, investment decisions made today will be part of an industrial cluster for the upcoming decades. Rather than using sensitivity analysis on the carbon content of the energy mix, three ‘velocities’ of variable renewable energy adoption (fast, average, and slow, as described in Fig. SA.11, ESI†) are used. In this regard, the carbon footprint integration over the expected lifetime is a more reliable indicator of the true environmental impact of mineralization, as shown in Fig. 9 It is clear that, from an environmental perspective, three strategies (DC Serpentine, IC Wollastonite and DC Wollastonite) systematically achieve lower carbon footprints compared to deep-geological options. Among those strategies, direct carbonation of wollastonite ranks first. Conversely, the use of olivine and the indirect carbonation of serpentine seem to underperform compared with the deep-geological benchmark.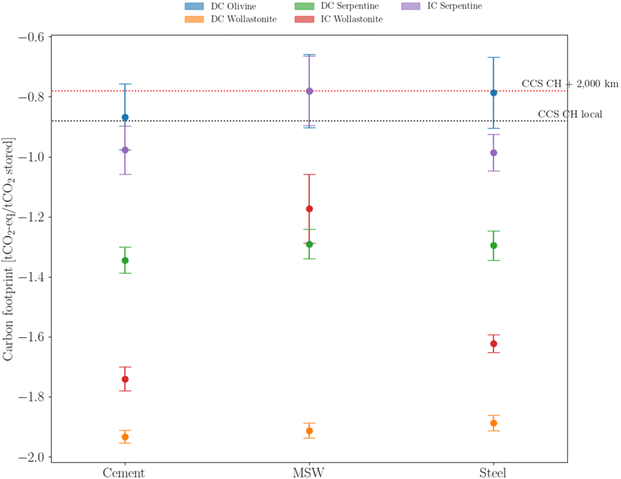 | ||
| Fig. 9 Average carbon footprint distribution based on the evolution of the electricity carbon content, according to eqn (S38) (ESI†). Middle points identify the ‘average’ VRE implementation, whereas the upper and lower caps identify the slow and fast VRE deployment, respectively. Colors identify different mineralization strategies. | ||
5.5 Cost analysis
Despite growing awareness of environmental and social concerns, economics remains the primary driver for investment decisions. It is thus imperative to explore the reliability of the cost partition provided for each industrial sector; a comparison with state-of-the-art values brings further insight into the role of industrial symbiosis as a way to promote mineralization. Rather than using averages to compare solutions, it is prudent to report ranges as well as the statistical distribution of potential savings. Table 1 summarizes, per sector, the literature values for the capture and sequestration stages, and the values obtained in this work, alongside the cost allocated to the HEN. The values of Δ were computed according to eqn (6) – translating savings with respect to the literature reference values. | (6) |
| Sector | Type | Mineral ore | Reference | This work | Δ (%) | |||||||
|---|---|---|---|---|---|---|---|---|---|---|---|---|
| (EUR/ton CO2 stored) | (EUR/ton CO2 stored) | |||||||||||
| Capture costa | Sequestration costb | TotalRef. | Capture cost (±20%) | Sequestration cost (±20%) | HEN (±20%) | TotalW | Median | Average | 5th percentile | |||
| a Capture cost references: cement;2,76 steel;76,77 MSW (the combination of steel and cement values). b Sequestration cost references: DC Olivine;14,78–80 DC Wollastonite;14,78–81 DC Serpentine;14,78–80 IC Wollastonite;79,82,83 IC Serpentine (identical to IC Wollastonite, no specific values reported in the literature). All costs were updated to 2022 (using the CEPCI index) and to EUR. | ||||||||||||
| Cement | DC | Olivine | 90–150 | 54–259 | 144–409 | 68 | 91 | 35 | 194 ± 39 | 44 | 41 | 13 |
| DC | Wollastonite | 90–150 | 92–174 | 182–324 | 68 | 56 | 26 | 150 ± 30 | 53 | 52 | 40 | |
| DC | Serpentine | 90–150 | 180–254 | 270–404 | 68 | 106 | 47 | 220 ± 44 | 50 | 49 | 40 | |
| IC | Wollastonite | 90–150 | 105–225 | 195–375 | 68 | 100 | 9 | 177 ± 35 | 43 | 41 | 25 | |
| IC | Serpentine | 90–150 | 105–225 | 195–375 | 68 | 69 | 17 | 154 ± 31 | 53 | 52 | 39 | |
| MSW | DC | Olivine | 70–150 | 54–259 | 124–409 | 110 | 89 | 9 | 208 ± 42 | 25 | 21 | −22 |
| DC | Wollastonite | 70–150 | 92–174 | 162–324 | 110 | 53 | 4 | 167 ± 33 | 33 | 32 | 11 | |
| DC | Serpentine | 70–150 | 180–254 | 250–404 | 110 | 101 | 8 | 219 ± 44 | 36 | 35 | 21 | |
| IC | Wollastonite | 70–150 | 105–225 | 175–375 | 110 | 48 | 0 | 158 ± 32 | 42 | 41 | 21 | |
| IC | Serpentine | 70–150 | 105–225 | 175–375 | 110 | 49 | 1 | 160 ± 32 | 42 | 41 | 21 | |
| Steel | DC | Olivine | 70–78 | 54–259 | 124–337 | 66 | 77 | 18 | 161 ± 32 | 38 | 33 | −5 |
| DC | Wollastonite | 70–78 | 92–174 | 162–252 | 66 | 50 | 5 | 120 ± 24 | 44 | 43 | 29 | |
| DC | Serpentine | 70–78 | 180–254 | 250–332 | 66 | 89 | 16 | 171 ± 34 | 47 | 46 | 37 | |
| IC | Wollastonite | 70–78 | 105–225 | 175–303 | 66 | 41 | 2 | 109 ± 22 | 55 | 54 | 40 | |
| IC | Serpentine | 70–78 | 105–225 | 175–303 | 66 | 40 | 5 | 111 ± 22 | 56 | 55 | 41 | |
The results are conclusive: the combination of CCS with industrial sectors containing waste heat and alkaline solid waste is economically sound and represents an improvement compared to the literature. In this regard, the cement sector shows the largest reduction, with average savings close to 50% and savings of at least 13% in 95% of the Monte Carlo runs, when compared with the deployment of carbon capture and mineralization separately. Cement is also the sector in which the HEN takes the largest share of the cost – evidence of strong heat integration between process and mineralization. Conversely, both the steel and waste sectors show more moderate savings, with considerably less HEN cost. Although on average both sectors represent net savings compared to the isolated options, there are some cost combinations that render the direct carbonation of olivine more expensive in the integrated case (with the 5th percentile being negative). Nevertheless, based on the results of this paper it is reasonable to update the seminal contribution of Mazzotti et al.14 from 2005, and state the economic feasibility of CO2 mineralization as long as it is properly integrated within an industrial cluster.
5.6 Prioritizing investment
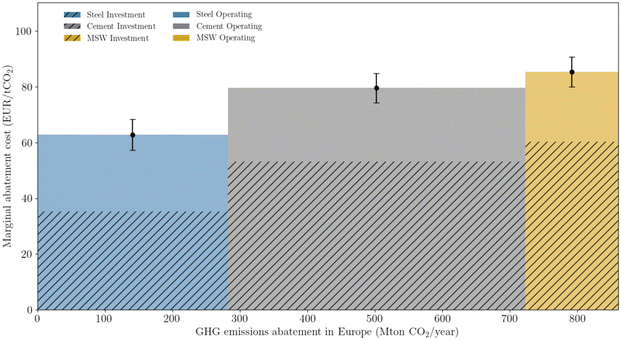
Prioritizing investments is a major concern at the macro-scale and is intimately linked with policy-making. Mineralization can be used to offset emissions across all three sectors studied. However, depending on the sector and type of mineral ore, costs can change sharply. The concept of MAC is employed to rank investment (Fig. 10), giving priority to the steel sector, followed by the cement, and lastly the waste sector. Regardless of sector, wollastonite is the ore that provides the lowest cost for offsetting emissions. The contrast between different ores is most noticeable for olivine, which requires approximately 200 EUR per ton CO2. Nevertheless, the overall relatively low MAC values, especially when compared with other net-negative technologies such as DAC, which can reach as high as 1000 EUR per ton,74 are a positive indicator for mineralization deployment.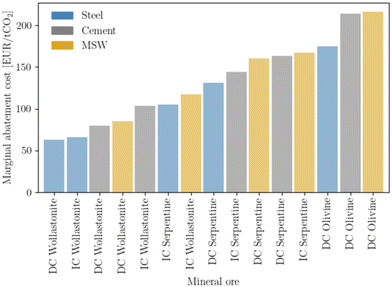 | ||
| Fig. 10 Marginal abatement cost, calculated according to eqn (5). | ||
A merit order curve (Fig. 11) complements the use of the marginal abatement cost, by showing the total abatement potential and the required investment. Combined, the three sectors allow an effective abatement of 860 Mton of CO2. The magnitude of such potential cannot be sufficiently emphasized. Not only is it enough to completely offset industrial European emissions (538 Mton of CO2), but it also corresponds to 27% of all (current) European emissions. Deploying mineralization is therefore an efficient way of valorizing industrial emissions and contributing to the challenging EU environmental goals. From an economic perspective, the area of each rectangle represents the total sector investment per year. The steel sector would require, on a yearly basis, 18 billion EUR, the cement sector close to 35 billion EUR, and the waste sector would amount to 12 billion EUR. Although such values may seem tremendous, they pale in comparison to the price of inaction, often translated as the social cost of CO2. Trusting the estimation of Kikstra et al.,75 and selecting the lowest bound of the social cost, the price of inaction is close to 170 billion per year (i.e. 200 EUR per ton of CO2 and 860 Mton of CO2 per year). Moreover, merit order curves are useful for policy-making, as they help to define a possible investment roadmap. Such an approach does not exclude, however, the integration of other constraints, which can jeopardize the implementation of one or multiple configurations.
Relying on wollastonite as the most efficient ore to sequester CO2 is a synonym for introducing a new entity into the CO2 value chain. Three distinct supply chains need to be created: (i) the supply of wollastonite as a feedstock; (ii) the transport of SiO2 to be used in blended cement formulation; and (iii) the disposal of carbonates. For mineralizing 860 Mton of CO2 per year, close to 2400 Mton of wollastonite must be supplied, generating 2000 Mton of carbonates and 1200 Mton of SiO2. According to Xie et al.,84 large amounts of wollastonite (in the order of 30 billion tons) are contained in the residual mine tailings of skarn deposits. Interestingly, skarns are metamorphic rocks, i.e. have been subjected to high temperature (between 500 °C and 600 °C) and pressure (between 200 and 350 MPa). Such a geological activity has replaced the harsh temperature treatment that is characteristic of other silicates, such as serpentine. This is a prime example of ‘natural integration’. However, wollastonite accounts on average for 35 wt% of skarn composition.85 Separation techniques involving magnetism and flotation are employed to isolate wollastonite, while the remaining fraction, predominantly composed of garnet and diopside, holds potential for alternative applications such as land/mine reclamation. In order to meet the projected demands, the extraction of 6800 Mton per year of skarns would be necessary. This extraction volume presents a significant challenge to the existing European mining industry, which operates at 8300 Mton per year (as of 2017).86 However, Europe boasts an ample supply of skarn deposits well-spread across the continent.53 Furthermore, the geographical distribution of skarns across the Pacific basin,84 as well as in Canada,85 and in the US,78 suggests abundant reserves. Concerns regarding the accessibility of those resources are out of the scope of this work, but are worth further research and exploration.
The disposal of the produced carbonates (MgCO3 and/or CaCO3) can be easily handled by land reclamation, such as filling empty pits, including those supplying wollastonite. This does not exclude its use for other purposes that could bring added value. Lastly, the integration of SiO2 for blended cement is limited to approximately 1 Gton per year34 – without affecting the substitution credit policy employed in this paper. Additional uses and off-takers, such as asphalt production, are able to fully absorb the production. A detailed list of potential uses is given in Table D1 in the ESI.†
6. Conclusions
This study proposed an approach to promote carbon capture and mineralization in industrial sectors using process systems engineering principles. Three sectors, cement production, waste incineration, and steel manufacture, were chosen due to their hard-to-eliminate emissions, waste heat, and alkaline solid residues. Although these residues can be used for mineralization, their quantity is limited and not sufficient to sequestrate more than 5% of the captured CO2 from each industry. Natural mineral ores rich in calcium and magnesium, such as serpentine, olivine, and wollastonite, were considered as an alternative. However, harsh pre-treatments made the process expensive and energy-intensive, hindering further industrial deployment. Our method used modeling and simulation, coupled with process integration and optimization tools to bypass such limitations, achieving greater detail and accuracy than other CCS systems in the literature.The use of a system integration approach proved to be consequential, with economic benefits of approximately 50% compared to stand-alone and non-integrated capture and storage technologies. Moreover, our solutions were cost-competitive with other CCUS options, ranging from 120 to 300 EUR per ton CO2 stored. On environmental grounds, it allowed for net-negative emissions, particularly when accounting for environmental credits from clinker substitution. Across industrial sectors, direct aqueous carbonation of wollastonite had the lowest average marginal abatement cost, at 62 EUR per ton CO2 for steel, 80 EUR per ton CO2 for cement, and 85 EUR per ton CO2 for waste. Combined, these sectors could abate 860 Mton of CO2 per year in Europe alone. This is more than all European industrial emissions and equates to nearly 27% of European GHG emissions, with a total annual investment estimated at 65 billion EUR. In addition, wollastonite reserves of 30 billion tons were found to be widely distributed, guaranteeing Europe's required amount for up to twelve years of operation. The method presented in this study offered a comprehensive approach to mineralization by locating it close to energy and material sources. Further work is required not only to optimize operating conditions and reactor design through a detailed kinetic study before moving to a demonstration plant, but also further research and exploration in accessible wollastonite reserves across the world.
Data availability
Data is available upon pertinent request.Conflicts of interest
The authors declare that they have no competing financial interests.Acknowledgements
The authors acknowledge the European Union's Horizon 2020 research and innovation programme under the Marie Sklodowska-Curie grant agreement no. 754354 and 754462, as well as FCT SFRH/BD/143538/2019.References
- M. Erans, et al., Direct air capture: Process technology, techno-economic and socio-political challenges, Energy Environ. Sci., 2022, 15, 1360–1405 RSC.
- A. G. Olabi, et al., Large scale application of carbon capture to process industries – A review, J. Cleaner Prod., 2022, 362, 132300 CrossRef CAS.
- R. G. Grim, et al., Transforming the carbon economy: Challenges and opportunities in the convergence of low-cost electricity and reductive CO2 utilization, Energy Environ. Sci., 2020, 13, 472–494 RSC.
- S.-Y. Pan, et al., CO2 mineralization and utilization by alkaline solid wastes for potential carbon reduction, Nat Sustain, 2020, 3, 399–405 CrossRef.
- H. Ostovari, L. Müller, J. Skocek and A. Bardow, From Unavoidable CO2 Source to CO2 Sink? A Cement Industry Based on CO2 Mineralization, Environ. Sci. Technol., 2021, 55, 5212–5223 CrossRef CAS PubMed.
- S. E. Tanzer and A. Ramírez, When are negative emissions negative emissions?, Energy Environ. Sci., 2019, 12, 1210–1218 RSC.
- T. Terlouw, C. Bauer, L. Rosa and M. Mazzotti, Life cycle assessment of carbon dioxide removal technologies: A critical review, Energy Environ. Sci., 2021, 14, 1701–1721 RSC.
- IEA. Transforming Industry through CCUS – Analysis. Tech. Rep. (2019).
- M. Bui, et al., Carbon capture and storage (CCS): The way forward, Energy Environ. Sci., 2018, 11, 1062–1176 RSC.
- J. Fagerlund, J. Highfield and R. Zevenhoven, Kinetics studies on wet and dry gas– solid carbonation of MgO and Mg(OH)2 for CO2 sequestration, RSC Adv., 2012, 2, 10380–10393 RSC.
- R. S. Norhasyima and T. M. I. Mahlia, Advances in CO2 utilization technology: A patent landscape review, J. CO2 Util., 2018, 26, 323–335 CrossRef CAS.
- A. Alturki, The Global Carbon Footprint and How New Carbon Mineralization Technologies Can Be Used to Reduce CO2 Emissions, ChemEngineering, 2022, 6, 44 CrossRef CAS.
- A. A. Olajire, A review of mineral carbonation technology in sequestration of CO2, J. Pet. Sci. Eng., 2013, 109, 364–392 CrossRef CAS.
- M. Mazzotti, Mineral carbonation and industrial uses of carbon dioxide, 2005 Search PubMed.
- K. S. Lackner, C. H. Wendt, D. P. Butt, E. L. Joyce and D. H. Sharp, Carbon dioxide disposal in carbonate minerals, Energy, 1995, 20, 1153–1170 CrossRef CAS.
- J. Lane, C. Greig and A. Garnett, Uncertain storage prospects create a conundrum for carbon capture and storage ambitions, Nat. Clim. Chang, 2021, 11, 925–936 CrossRef.
- F. d'Amore, P. Mocellin, C. Vianello, G. Maschio and F. Bezzo, Economic optimisation of European supply chains for CO2 capture, transport and sequestration, including societal risk analysis and risk mitigation measures, Appl. Energy, 2018, 223, 401–415 CrossRef.
- S. Ó. Snæbjörnsdóttir, et al., Carbon dioxide storage through mineral carbonation, Nat. Rev. Earth Environ., 2020, 1, 90–102 CrossRef.
- S. Delerce, C. Marieni and E. H. Oelkers, Carbonate geochemistry and its role in geologic carbon storage, in Surface Process, Transportation, and Storage, vol. 4 of Oil and Gas Chemistry Management Series, ed. Q. Wang, Gulf Professional Publishing, 2023, ch. 9, pp. 423–477 Search PubMed.
- H. Ostovari, L. Müller, F. Mayer and A. Bardow, A climate-optimal supply chain for CO2 capture, utilization, and storage by mineralization, J. Cleaner Prod., 2022, 360, 131750 CrossRef CAS.
- L. Rosa, V. Becattini, P. Gabrielli, A. Andreotti and M. Mazzotti, Carbon dioxide mineralization in recycled concrete aggregates can contribute immediately to carbon-neutrality, Resour., Conserv. Recycl., 2022, 184, 106436 CrossRef CAS.
- W. Seifritz, CO2 disposal by means of silicates, Nature, 1990, 345, 486 CrossRef.
- F. Wang, D. B. Dreisinger, M. Jarvis and T. Hitchins, The technology of CO2 sequestration by mineral carbonation: Current status and future prospects, Can. Metall. Q., 2018, 57, 46–58 CrossRef CAS.
- R. Zevenhoven and J. Fagerlund, Fixation of Carbon Dioxide into Inorganic Carbonates: The Natural and Artificial “Weathering of Silicates”, Carbon Dioxide as Chemical Feedstock, John Wiley & Sons, Ltd, 2010, chap. 14, pp. 353–379 Search PubMed.
- V. Romanov, et al., Mineralization of Carbon Dioxide: A Literature Review, ChemBioEng Rev., 2015, 2, 231–256 CrossRef CAS.
- R. Zevenhoven, M. Slotte, J. Åbacka and J. Highfield, A comparison of CO 2 mineral sequestration processes involving a dry or wet carbonation step, Energy, 2016, 117, 604–611 CrossRef CAS.
- N. Zhang, Y. E. Chai, R. M. Santos and L. Šiller, Advances in process development of aqueous CO2 mineralisation towards scalability, J. Environ. Chem. Eng., 2020, 8, 104453 CrossRef CAS.
- A. Ben Ghacham, E. Cecchi, L.-C. Pasquier, J.-F. Blais and G. Mercier, CO2 sequestration using waste concrete and anorthosite tailings by direct mineral carbonation in gas–solid–liquid and gas–solid routes, J. Environ. Manage., 2015, 163, 70–77 CrossRef CAS PubMed.
- G. Gadikota, Carbon mineralization pathways for carbon capture, storage and utilization, Commun. Chem., 2021, 4, 1–5 CrossRef PubMed.
- P.-C. Chiang and S.-Y. Pan, Carbon Dioxide Mineralization and Utilization, Springer Singapore, Singapore, 2017 Search PubMed.
- C. Julcour, et al., Development of an attrition-leaching hybrid process for direct aqueous mineral carbonation, Chem. Eng. J., 2015, 262, 716–726 CrossRef CAS.
- J. Pedro, et al., Mineral Carbonation of CO2 in Mafic Plutonic Rocks, I—Screening Criteria and Application to a Case Study in Southwest Portugal, Appl. Sci., 2020, 10, 4879 CrossRef CAS.
- S. Hovorka and P. Kelemen, The Building Blocks of CDR Systems: Geological Sequestration, CDR Primer, 2021 Search PubMed.
- H. Ostovari, A. Sternberg and A. Bardow, Rock ‘n’ use of CO2: Carbon footprint of carbon capture and utilization by mineralization, Sustainable Energy Fuels, 2020, 4, 4482–4496 RSC.
- M. Z. Kashim, H. Tsegab, O. Rahmani, Z. A. Abu Bakar and S. M. Aminpour, Reaction Mechanism of Wollastonite In Situ Mineral Carbonation for CO2 Sequestration: Effects of Saline Conditions, Temperature, and Pressure, ACS Omega, 2020, 5, 28942–28954 CrossRef CAS PubMed.
- R. Zevenhoven, S. Eloneva and S. Teir, Chemical fixation of CO2 in carbonates: Routes to valuable products and long-term storage, Catal. Today, 2006, 115, 73–79 CrossRef CAS.
- I. Tebbiche, L.-C. Pasquier, G. Mercier, J.-F. Blais and S. Kentish, Mineral carbonation with thermally activated serpentine; the implication of serpentine preheating temperature and heat integration, Chem. Eng. Res. Des., 2021, 172, 159–174 CrossRef CAS.
- L. Miró, S. Brückner and L. F. Cabeza, Mapping and discussing Industrial Waste Heat (IWH) potentials for different countries, Renewable Sustainable Energy Rev., 2015, 51, 847–855 CrossRef.
- H. Bütün, I. Kantor and F. Maréchal, An Optimisation Approach for Long-Term Industrial Investment Planning, Energies, 2019, 12, 4076 CrossRef.
- W. Liu, et al., CO2 mineral carbonation using industrial solid wastes: A review of recent developments, Chem. Eng. J., 2021, 416, 129093 CrossRef CAS.
- N. Thonemann, L. Zacharopoulos, F. Fromme and J. Nühlen, Environmental impacts of carbon capture and utilization by mineral carbonation: A systematic literature review and meta life cycle assessment, J. Cleaner Prod., 2022, 332, 130067 CrossRef CAS.
- Y. Katsuyama, et al., Development of a process for producing high-purity calcium carbonate (CaCO3) from waste cement using pressurized CO2, Environ. Prog., 2005, 24, 162–170 CrossRef CAS.
- J. Sipilä, S. Teir and R. Zevenhoven, Carbon dioxide sequestration by mineral carbonation Literature review update 2005–2007, Technical report VT 2008-1, 2008.
- A. Allouhi, S. Rehman, M. S. Buker and Z. Said, Up-to-date literature review on Solar PV systems: Technology progress, market status and R&D, J. Cleaner Prod., 2022, 362, 132339 CrossRef.
- G. Habert, et al., Environmental impacts and decarbonization strategies in the cement and concrete industries, Nat. Rev. Earth Environ., 2020, 1, 559–573 CrossRef.
- IEA, Putting CO2 to Use-Analysis, IEA, Paris, 2019, https://www.iea.org/reports/putting-co2-to-use.
- T. Berntsson and A. Åsblad, Annex XV: Industrial Excess Heat Recovery – Technologies and Applications, CIT Industriell Energi AB, Sweden, Final report, 2019.
- E. Benhelal, et al., The utilisation of feed and byproducts of mineral carbonation processes as pozzolanic cement replacements, J. Cleaner Prod., 2018, 186, 499–513 CrossRef CAS.
- C595/C595M. Standard Specification for Blended Hydraulic Cements. https://www.astm.org/c0595-08a.html (2021).
- H. Bütün, I. Kantor and F. Maréchal, Incorporating Location Aspects in Process Integration Methodology, Energies, 2019, 12, 3338 CrossRef.
- R. Castro-Amoedo, N. Morisod, J. Granacher and F. Maréchal, The Role of Biowaste: A Multi-Objective Optimization Platform for Combined Heat, Power and Fuel, Front. Energy Res., 2021, 9, 417 Search PubMed.
- I. I. Cplex, V12. 1: User's Manual for CPLEX, International Business Machines Corporation, 2009, 46, 157 Search PubMed.
- A. Cheilletz, E. Pelleter, A. Martín-Izard and F. Tornos World Skarn Deposits-Skarns of Western Europe. appendix 1–10 (2005).
- M. G. Plaza, S. Martínez and F. Rubiera, CO2 Capture, Use, and Storage in the Cement Industry: State of the Art and Expectations, Energies, 2020, 13, 5692 CrossRef CAS.
- IEA. World Energy Outlook 2022 – Analysis. https://www.iea.org/reports/world-energy-outlook-2022 (2022).
- EPOS. Enhanced energy and resource Efficiency and Performance in process industry Operations via onsite and cross-sectorial Symbiosis |EPOS Project|Fact Sheet|H2020|CORDIS|European Commission. https://cordis.europa.eu/project/id/679386.
- European comission directorate general for energy. Advancing Industrial Decarbonisation by Assessing the Future use of Renewable Energies in Industrial Processes, Tech. Rep., 2023 Search PubMed.
- E. De Lena, et al., Techno-economic analysis of calcium looping processes for low CO2 emission cement plants, Int. J. Greenhouse Gas Control, 2019, 82, 244–260 CrossRef CAS.
- S. O. Gardarsdottir, et al., Comparison of Technologies for CO2 Capture from Cement Production—Part 2: Cost Analysis, Energies, 2019, 12, 542 CrossRef CAS.
- E.-E. Chang, et al., Accelerated carbonation using municipal solid waste incinerator bottom ash and cold-rolling wastewater: Performance evaluation and reaction kinetics, Waste Manage., 2015, 43, 283–292 CrossRef CAS PubMed.
- Eurostat. Generation of waste by waste category, hazardousness and NACE Rev. 2 activity. https://appsso.eurostat.ec.europa.eu/nui/show.do?dataset=env_wasgen&lang=en (2022).
- Eurostat. Greenhouse gas emissions by source sector. https://appsso.eurostat.ec.europa.eu/nui/submitViewTableAction.do (2022).
- L. Rosa, D. L. Sanchez and M. Mazzotti, Assessment of carbon dioxide removal potential via BECCS in a carbon-neutral Europe, Energy Environ. Sci., 2021, 14, 3086–3097 RSC.
- A. W. Larsen and T. Astrup, CO2 emission factors for waste incineration: Influence from source separation of recyclable materials, Waste Manage., 2011, 31, 1597–1605 CrossRef CAS PubMed.
- X. Li, et al., Decarbonization in Complex Energy Systems: A Study on the Feasibility of Carbon Neutrality for Switzerland in 2050, Front. Energy Res., 2020, 8, 549615 CrossRef.
- IEA. Net Zero by 2050-A Roadmap for the Global Energy Sector 224 (2021).
- IEA. Energy Technology Perspectives 2020 – Analysis. https://www.iea.org/reports/energy-technology-perspectives-2020 (2020).
- W. Tian, et al., CO2 accounting model and carbon reduction analysis of iron and steel plants based on intra- and inter-process carbon metabolism, J. Cleaner Prod., 2022, 360, 132190 CrossRef CAS.
- W. Uribe-Soto, J.-F. Portha, J.-M. Commenge and L. Falk, A review of thermochemical processes and technologies to use steelworks off-gases, Renewable Sustainable Energy Rev., 2017, 74, 809–823 CrossRef CAS.
- D. E. Wiley, M. T. Ho and A. Bustamante, Assessment of opportunities for CO2 capture at iron and steel mills: An Australian perspective, Energy Procedia, 2011, 4, 2654–2661 CrossRef.
- S. E. Tanzer, K. Blok and A. Ramírez, Curing time: A temporally explicit life cycle CO2 accounting of mineralization, bioenergy, and CCS in the concrete sector, Faraday Discuss., 2021, 230, 271–291 RSC.
- M. D. Obrist, R. Kannan, T. J. Schmidt and T. Kober, Decarbonization pathways of the Swiss cement industry towards net zero emissions, J. Cleaner Prod., 2021, 288, 125413 CrossRef CAS.
- T. Terlouw, K. Treyer, C. Bauer and M. Mazzotti, Life Cycle Assessment of Direct Air Carbon Capture and Storage with Low-Carbon Energy Sources, Environ. Sci. Technol., 2021, 55, 11397–11411 CrossRef CAS PubMed.
- M. Ozkan, S. P. Nayak, A. D. Ruiz and W. Jiang, Current status and pillars of direct air capture technologies, iScience, 2022, 25, 103990 CrossRef CAS PubMed.
- J. S. Kikstra, et al., The social cost of carbon dioxide under climate-economy feedbacks and temperature variability, Environ. Res. Lett., 2021, 16, 094037 CrossRef CAS.
- IEA. Levelised cost of CO2 capture by sector and initial CO2 concentration, 2019 – Charts – Data & Statistics. https://www.iea.org/data-and-statistics/charts/levelised-cost-of-co2-capture-by-sector-and-initial-co2-concentration-2019 (2019).
- E. Tsupari, et al., Oxygen blast furnace with CO 2 capture and storage at an integrated steel mill – Part II: Economic feasibility in comparison with conventional blast furnace highlighting sensitivities, Int. J. Greenhouse Gas Control, 2015, 32, 189–196 CrossRef CAS.
- S. J. Gerdemann, W. K. O'Connor, D. C. Dahlin, L. R. Penner and H. Rush, Ex Situ Aqueous Mineral Carbonation, Environ. Sci. Technol., 2007, 41, 2587–2593 CrossRef CAS PubMed.
- S. Yadav and A. Mehra, A review on ex situ mineral carbonation, Environ. Sci. Pollut. Res., 2021, 28, 12202–12231 CrossRef CAS PubMed.
- P. K. Naraharisetti, T. Y. Yeo and J. Bu, New classification of CO2 mineralization processes and economic evaluation, Renewable Sustainable Energy Rev., 2019, 99, 220–233 CrossRef CAS.
- W. J. J. Huijgen, R. N. J. Comans and G.-J. Witkamp, Cost evaluation of CO2 sequestration by aqueous mineral carbonation, Energy Convers. Manage., 2007, 48, 1923–1935 CrossRef CAS.
- W. Ding, L. Fu, J. Ouyang and H. Yang, CO2 mineral sequestration by wollastonite carbonation, Phys. Chem. Minerals, 2014, 41, 489–496 CrossRef CAS.
- M. Kakizawa, A. Yamasaki and Y. Yanagisawa, A new CO2 disposal process via artificial weathering of calcium silicate accelerated by acetic acid, Energy, 2001, 26, 341–354 CrossRef CAS.
- H. Xie, et al., Feedstocks study on CO2 mineralization technology, Environ. Earth Sci., 2016, 75, 615 CrossRef.
- T. A. Grammatikopoulos and A. H. Clark, A comparative study of wollastonite skarn genesis in the Central Metasedimentary Belt, southeastern Ontario, Canada, Ore Geol. Rev., 2006, 29, 146–161 CrossRef.
- M. Regueiro and A. Alonso-Jimenez, Minerals in the future of Europe, Miner. Econ., 2021, 34, 209–224 CrossRef.
Footnotes |
| † Electronic supplementary information (ESI) available. See DOI: https://doi.org/10.1039/d3ee01803b |
| ‡ Refers to the carbonation reaction when it occurs at the CO2 point source, rather than in a geologic formation that contains reactive metals, i.e. ‘in situ’. |
| § The process can literally take “hundred thousands of years in Nature”.24 |
| This journal is © The Royal Society of Chemistry 2023 |

