Spirobifluorene with an asymmetric fluorenylcarbazolamine electron-donor as the hole transport material increases thermostability and efficiency of perovskite solar cells†
Yutong
Ren
a,
Yuefang
Wei
a,
Tianyu
Li
a,
Yanfei
Mu
b,
Min
Zhang
 b,
Yi
Yuan
a,
Jing
Zhang
a and
Peng
Wang
 *a
*a
aState Key Laboratory of Silicon and Advanced Semiconductor Materials, Department of Chemistry, Zhejiang University, Hangzhou 310028, China. E-mail: pw2015@zju.edu.cn
bInstitute for New Energy Materials and Low Carbon Technologies, Tianjin University of Technology, Tianjin, 300384, China
First published on 29th June 2023
Abstract
The efficiency of perovskite solar cells utilizing spiro-OMeTAD as the hole transport material has been persistently enhanced, attaining the current 25.7%. However, these high-efficiency cells are unable to withstand the harsh heat at 85 °C. In this report, we present a spirobifluorene based hole transport material with highly asymmetric fluorenylcarbazolamine as the electron-donor, denoted as SBF-FC. Compared to spiro-OMeTAD, SBF-FC exhibits a comparable HOMO energy level, but the glass transition temperature is almost twice as high. The composite produced by blending SBF-FC and 4-tert-butylpyridinium bis(trifluoromethanesulfonyl)imide at an 85![[thin space (1/6-em)]](https://www.rsc.org/images/entities/char_2009.gif) :
:![[thin space (1/6-em)]](https://www.rsc.org/images/entities/char_2009.gif) 15 weight ratio demonstrates a room temperature conductivity of 49 μS cm−1 while retaining a high glass transition temperature of 176 °C. Importantly, the SBF-FC based hole transport layer, deposited onto the surface of a FAPbI3 thin film, exhibits a more uniform morphology and remarkedly improved 85 °C durability, effectively suppressing the corrosion and decomposition of the perovskite film. By utilizing the SBF-FC based hole transport layer, we demonstrate perovskite solar cells achieving an average initial efficiency of 24.5% and long-term thermostability at 85 °C.
15 weight ratio demonstrates a room temperature conductivity of 49 μS cm−1 while retaining a high glass transition temperature of 176 °C. Importantly, the SBF-FC based hole transport layer, deposited onto the surface of a FAPbI3 thin film, exhibits a more uniform morphology and remarkedly improved 85 °C durability, effectively suppressing the corrosion and decomposition of the perovskite film. By utilizing the SBF-FC based hole transport layer, we demonstrate perovskite solar cells achieving an average initial efficiency of 24.5% and long-term thermostability at 85 °C.
Broad contextTo achieve efficient and stable PSCs, the selection of electron and hole transport layers is crucial, in addition to the perovskite light-absorbing layer. When utilizing oxide electron transport layers such as TiO2 or SnO2, it is essential to carefully select a hole transport layer (HTL) that exhibits specific fundamental characteristics. First, the HTL should be able to form a uniform and sufficiently thick film on the perovskite surface to prevent micro-scale contact between the metal electrode and the perovskite, which can trigger rapid charge recombination. Second, the HTL should have a HOMO energy level higher than the valence band maximum of the perovskite to facilitate swift injection of holes from the excited-state perovskite. Third, the HTL should possess appropriate hole density, mobility, and conductivity to minimize the internal resistance of the solar cell and slow down charge recombination at the interface between the perovskite and the HTL. Fourth, the HTL should maintain its morphology even at elevated temperatures. Finally, the HTL should effectively control the migration of both intrinsic and extrinsic species. |
1 Introduction
Lead halide perovskites are a class of affordable semiconductor materials that can be deposited as defect-tolerant polycrystalline thin films using solution-based techniques.1 These remarkable films exhibit excellent properties for harvesting solar light and transporting charge carriers.2 Notably, methylammonium lead triiodide,3 formamidinium lead triiodide (FAPbI3),4 cesium lead triiodide,5 and the related alloyed perovskites6 can all serve as light-harvesting active layers in solar cells, enabling efficient conversion of solar energy into electrical energy. Recent years have witnessed a surge in the exploitation of FAPbI3 in perovskite solar cells (PSCs),4,7,8 due to its broad spectral response and relatively high thermal decomposition temperature. With consecutive advancements in processing methods that control the composition, crystallinity, grain size, and morphology of perovskite thin films, laboratory-scale single-junction PSCs have surpassed power conversion efficiencies (PCE) of 25% by using spiro-OMeTAD as the hole transport material (HTM), as depicted in Fig. 1. However, the thermal stress at 85 °C exceeds the tolerance of these exceptionally efficient cells. Although using some HTMs including molecular semiconductors with high glass transition temperatures9–12 or polymeric semiconductors13,14 can enable the fabrication of PSCs with 85 °C thermostability, their initial PCEs are not yet sufficiently high. So far, the fabrication of a thermally durable (85 °C) PSC with an efficiency greater than 24% remains a significant challenge. | ||
| Fig. 1 Molecular structures of the hole transport materials spiro-OMeTAD, DM, and SBF-FC as well as the oxygen doping auxiliary reagent TBPHTFSI. | ||
Spiro-OMeTAD comprising a 9,9’-spirobifluorene (SBF) core and four bis(4-methoxyphenyl)amine (OMeDPA) electron-donors was first reported by Salbeck et al. in 1997.15 The structural origin of this material is traced back to the early 20th century when OMeDPA was first synthesized by Wieland et al. in 191016 and SBF was synthesized by Clarkson and Gomberg in 1930.17 Subsequently, doping spiro-OMeTAD with an oxidizing agent during the solution deposition of an amorphous film significantly improved the efficiency of solid-state dye-sensitized solar cells.18 Since 2012, the PCE record for PSCs has been repeatedly broken by the use of spiro-OMeTAD. We contend that these advancements stem not only from the commercial availability, but also from the appropriate energy levels, hole density, hole mobility, and morphology of a doped hole transport layer (HTL) of spiro-OMeTAD, as well as its sluggish charge recombination with perovskites. However, spiro-OMeTAD has a glass transition temperature (Tg) of marginally higher than 120 °C, which typically decreases upon doping, leading to crystallization and cracking of the HTL when exposed to a prolonged heating period at 85 °C.19–21 In our previous study, we have found that the degradation in the morphology of a spiro-OMeTAD based HTL ultimately reduces the efficiency of PSCs significantly.21 While efforts have been made to develop new HTMs that incorporate SBF and other electron-donors, their overall quality factors including film-forming properties, energy levels, hole conduction, and glass transition are not entirely satisfactory.22–28 For instance, Jeon et al.29 introduced a novel SBF based HTM with the electron-donor methoxyphenylfluorenamine for 60 °C thermostable perovskite solar cells, denoted as DM and is illustrated in Fig. 1. DM displays an elevated glass transition temperature of 161 °C but a reduced hole conduction relative to spiro-OMeTAD.
In this report, we present an SBF based HTM, denoted as SBF-FC (see Fig. 1), which is characterized by the electron-donor fluorenylcarbazolamine (FC). SBF-FC demonstrates a substantially higher Tg and superior film-forming properties compared to spiro-OMeTAD. Furthermore, under similar material processing conditions, SBF-FC exhibits enhanced hole mobility and conductivity. The utilization of SBF-FC as the HTL in PSCs results in average cell efficiency of ca. 24.5%, and the cells demonstrate good long-term thermostability at 85 °C. Our findings demonstrate that SBF-FC is a promising candidate for high-performance PSCs.
2 Results and discussion
2.1 Photoinduced charge separation
In this study, we employed a FAPbI3 thin film containing a small admixture of (PbI2)2RbCl8 as the light-absorbing layer. We first measured the photoluminescence lifetimes (τ) of FAPbI3 on glass and SnO2 substrates, which were found to be 3.6 μs and 192 ns, respectively (see Fig. S1 and Table S1, ESI†). The difference in τ values indicates that SnO2 can extract electrons from photoexcited FAPbI3. However, the photoinduced electron extraction yield by SnO2 was only 95%, likely due to the small conduction band offset between the two semiconductors. Moreover, we measured the τ of HTL-covered FAPbI3 and found it to be 32.4 ns for spiro-OMeTAD and 40.3 ns for SBF-FC. Despite the higher HOMO energy level and lower reorganization energy (see Table S2, ESI†), SBF-FC exhibits slower hole extraction than spiro-OMeTAD. This might be due to its weaker electronic wave function coupling with the perovskite, resulting from its less HOMO distribution on certain edge segments (see Fig. S2, ESI†). Nonetheless, SBF-FC still exhibits a hole extraction yield approaching 100% resulting from the photoexcited FAPbI3.2.2 Hole conduction
The series resistance of PSCs, which includes the resistance of the HTL, has a significant impact on the PCE.30 Apart from thickness, the resistivity of the HTL is also critical in determining its resistance. We conducted measurements using gold interdigital electrodes with a channel width of 10 μm to determine the direct-current conductivity (σ), i.e., the reciprocal of resistivity. Our results indicate that SBF-FC has an average σ of 0.28 μS cm−1 at 25 °C, which is more than twice as high as that of spiro-OMeTAD at 0.12 μS cm−1. To investigate the hole density (p) of the pristine HTL, we fabricated a metal–insulator–semiconductor device and obtained the capacitance–voltage curve. Using the Mott–Schottky relationship, we calculated an average p of 1.5 × 1017 cm−3 for SBF-FC, which is comparable to that of spiro-OMeTAD at 1.3 × 1017 cm−3.Undoped materials generate charge carriers through thermal excitation,31 which can be expressed as 2HTM = HTM+ + HTM−, where HTM+ and HTM− represent cation and anion free radicals of the HTM, respectively. For a HTM with an optical bandgap greater than 2 eV, the p generated by thermally excited disproportionation is expected to be less than 103 cm−3, which is at least 14 orders of magnitude lower than the measured value. Hence, we conclude that the HTL with a relatively high HOMO energy level has unintentionally been doped with oxygen from the air,32,33 even without deliberate doping. If we exclude acidic gases from the air, the chemical reaction can be represented by 2HTM + O2 = (HTM+)2O22−. The p generated by air oxidation doping is greater with a higher HOMO energy level of the HTM. We determined the hole mobility (μp) of the HTL using the formula μp = σ/qp (where q represents the elementary charge), which yielded a value of 1.2 × 10⁻⁵ cm2 V−1 s−1 for SBF-FC, twice that of spiro-OMeTAD's 5.8 × 10⁻⁶ cm2 V−1 s−1.
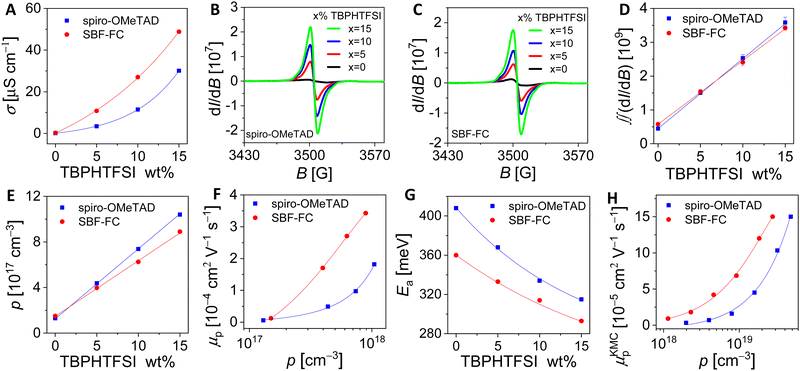
Next, we aimed to enhance the air oxidation doping of the HTL by incorporating 4-tert-butylpyridinium bis(trifluoromethanesulfonyl)imide (TBPHTFSI, Fig. 1), as the auxiliary reagent during the film deposition process.21 It is worth noting that in comparison to the conventional doping auxiliary reagent LiTFSI, TBPHTFSI exhibits less hygroscopicity and greater solubility in typical nonpolar organic solvents. Moreover, it possesses a thermal decomposition temperature exceeding 200 °C. The chemical reaction involved in this process can be represented by 2HTM + O2 + 2TBPH+TFSI− = 2HTM+TFSI− + H2O2 + 2TBP, where TBPH+ is the 4-tert-butylpyridinium cation, TFSI− is the bis(trifluoromethanesulfonyl)imide anion, and TBP is 4-tert-butylpyridine. Our results show that the σ value at 25 °C of the HTL composed of both HTM and TBPHTFSI, increases exponentially with the increase of the salt content (Fig. 2A). At the 15% weight percentage of TBPHTFSI, the σ values of the composite HTLs are 30.1 μS cm−1 for spiro-OMeTAD, 2.3 μS cm−1 for DM, and 48.8 μS cm−1 for SBF-FC. Moreover, the electron paramagnetic resonance (EPR) measurements demonstrate the gradual strengthening of cationic free radicals with an increase in the TBPHTFSI content (Fig. 2B and C). The p value of the HTL with TBPHTFSI was reckoned by comparing its EPR quadratic integral with that of a pristine film without TBPHTFSI (Fig. 2D), and it increased linearly with the increase of the salt content (Fig. 2E). Based on the relationship between μp, σ, and p, the μp value of the TBPHTFSI-containing HTL was calculated and found to gradually increase with an increase in p (Fig. 2F). At a specified p value, the μp value of the HTL exhibits a greater magnitude for SBF-FC when compared to spiro-OMeTAD.
Furthermore, we performed variable temperature conductivity measurements of the HTL and observed that the σ value increases with an increase in temperature (Fig. S3, ESI†). The activation energy of hole conduction was then calculated using the Arrhenius formula, which revealed an exponential decrease in the activation energy with the increase of the salt content (Fig. 2G). It can be concluded that the hole density gradually increases with the gradual increase of the TBPHTFSI content, leading to the gradual filling of traps, which in turn reduces the activation energy of hole conduction and increases the hole mobility.34–37
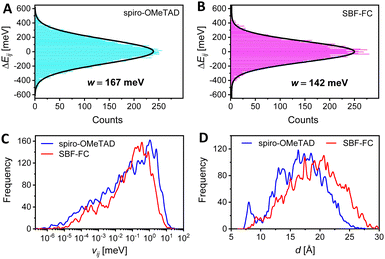
The kinetic Monte Carlo (KMC) method was further employed to simulate hole transport in amorphous solids.38 Our results, presented in Fig. 2H, demonstrate that as the p value increases, so does the simulated hole mobility (μKMCp). Notably, SBF-FC exhibits a higher μKMCp value than spiro-OMeTAD when p is identical. This finding is in agreement with previous experimental measurements. In amorphous molecular semiconductor films, charge carriers are highly localized, and their hopping between neighboring molecules is facilitated by thermal activation. The rate of hole hopping depends on various parameters, including the HOMO energy level difference of the hopping sites (ΔEij), the transfer integral (vij), the centroid distance (d), and the reorganization energy (λ). To estimate the energetic disorder (w), we used a Gaussian function to fit the ΔEij values. As depicted in Fig. 3A and B, the w value for spiro-OMeTAD is 167 meV, while that for SBF-FC is 142 meV. A smaller w value is advantageous for hole transport at low p. Although SBF-FC does not exhibit a conclusive advantage in vij (Fig. 3C), its average d is larger (Fig. 3D), which enhances hole transport. Furthermore, the λ value for spiro-OMeTAD is 172 meV, whereas that for SBF-FC is 155 meV. We attribute the smaller λ value of SBF-FC to the larger conjugated system of its electron-donor.
2.3 Glass transition of hole transport materials
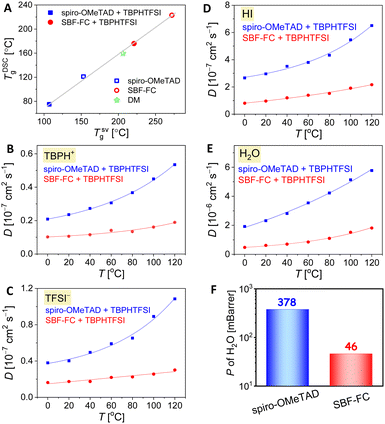
In PSCs, the amorphous organic HTL can experience strain and/or crystallization as it approaches its glass transition temperature (Tg), resulting in reduced film uniformity, flatness, and the formation of pinholes or cracks that can impair the cell efficiency. We first used differential scanning calorimetry (DSC) to measure the TDSCg of SBF-FC, which was found to be 222 °C, almost 100 °C higher than that of spiro-OMeTAD. This discrepancy in TDSCg is thought to be due to variations in intermolecular interactions. When 15 wt% TBPHTFSI was added, a noticeable plasticization effect was observed, resulting in a significant reduction of approximately 45 °C in TDSCg. Nevertheless, the TDSCg of the SBF-FC composite remained impressively high, reaching 176 °C, surpassing that of the spiro-OMeTAD counterpart, which has a TDSCg of only 75 °C. The thermal expansion coefficient of an amorphous solid experiences an abrupt change during glass transition. To determine the theoretical glass transition temperature (TSVg), we carried out linear fits of specific volume as a function of temperature for high-temperature and low-temperature data obtained through molecular dynamics simulations (Fig. S4, ESI†). As illustrated in Fig. 4A, a strong linear relationship exists between TDSCg and TSVg.2.4 Diffusion in the hole transport layer
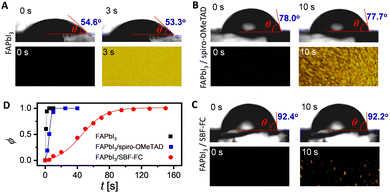
The doping of organic semiconductor materials with p-type and n-type impurities results in the presence of anions and cations, which serve to maintain electrostatic balance.39–41 In PSCs, changes in device parameters can occur due to the diffusion of certain components in the perovskite layer and HTL, as well as ion drift caused by the built-in electric field. For example, the migration of iodide anions into the HTL can reduce doping. Furthermore, the durability of PSCs can be compromised by the slow decomposition of the perovskite under conditions of high temperature and humidity. Thus, it is essential to control the infiltration of environmental moisture and the escape of volatile perovskite components through the HTL.42,43 Therefore, we employed molecular dynamics methods to investigate the diffusion of both intrinsic and extrinsic species in the HTL, including TBPH+, TFSI−, hydrogen iodide, and water. Our results, illustrated in Fig. 4B–E, show that the diffusion coefficients (D) of these species increase gradually with rising temperature. However, at a given temperature, the D values in the SBF-FC based HTL are lower than those observed in the spiro-OMeTAD congener.In a thin film, the permeability (P) of H2O is positively correlated with its diffusion coefficient and solubility. Theoretical simulations reveal that when the weight percentage of TBPHTFSI is 15%, the P of H2O in the SBF-FC based HTL is 0.046 Barrer, which is over eight times lower than the corresponding P (0.378 Barrer) of H2O in the spiro-OMeTAD analogue (see Fig. 4F). To assess the water permeation through the HTL, we deposited the layer onto FAPbI3 and dripped water droplets onto its surface. In the control experiment, a small water droplet on FAPbI3 maintains an almost constant contact angle (θ) for 3 s, while the polarizing optical microscope (POM) image is already filled with birefringent yellow PbI2 microcrystals (see Fig. 5A). After adding the HTL to the FAPbI3 film, the θ value significantly increases (see Fig. 5B and C). Specifically, the SBF-FC HTL shows a θ of 92.4°, while that of the spiro-OMeTAD layer is 78.0°. The blocking effect of the HTL slows down the evolution of the POM image; however, water molecules can still permeate through it. We employed the Bohart–Adams model to fit the area ratio (ϕ) of the yellow region as a function of time (see Fig. 5D). The full degradation time constant of FAPbI3 covered with the SBF-FC HTL is 153 s, which is significantly greater than that with the spiro-OMeTAD counterpart (17 s). The ratio (1![[thin space (1/6-em)]](https://www.rsc.org/images/entities/char_2009.gif) :
:![[thin space (1/6-em)]](https://www.rsc.org/images/entities/char_2009.gif) 9) of the reciprocals of the full degradation time constant closely matches the ratio (1
9) of the reciprocals of the full degradation time constant closely matches the ratio (1![[thin space (1/6-em)]](https://www.rsc.org/images/entities/char_2009.gif) :
:![[thin space (1/6-em)]](https://www.rsc.org/images/entities/char_2009.gif) 8) of simulated P values. Both HTLs used here are 80 nm thick, and increasing the layer thickness results in a nearly linear increase of the full degradation time constant.
8) of simulated P values. Both HTLs used here are 80 nm thick, and increasing the layer thickness results in a nearly linear increase of the full degradation time constant.
2.5 Application in perovskite solar cells
| Solar cell | J SC[mA cm−2] | V OC[V] | FF[%] | PCE[%] |
|---|---|---|---|---|
| a The photovoltaic parameters were measured under the AM1.5G conditions. The 0.25 cm2 small cells were covered with a black metal mask with an aperture area of 0.16 cm2 for measurements. The aging was carried out for 500 h at 85 °C. | ||||
| Spiro-OMeTAD | 25.9 | 1.140 | 77.6 | 22.9 |
| DM | 25.9 | 1.190 | 71.6 | 22.1 |
| SBF-FC | 25.9 | 1.180 | 80.9 | 24.7 |
| Spiro-OMeTAD/aged | 13.3 | 0.715 | 43.2 | 4.2 |
| SBF-FC/aged | 25.2 | 1.160 | 77.3 | 22.6 |
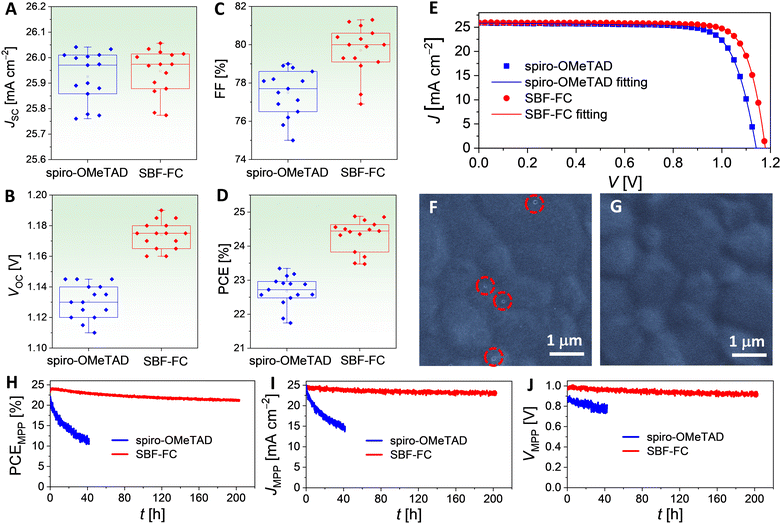
To gain insight into the discrepancies observed in the VOC and FF values, we utilized the Shockley diode equation44 to perform numerical fitting of the J–V data, as presented in Fig. 6E. Further simulations and analysis, outlined in Fig. S6 and Table S3 (ESI†), elucidate that the higher VOC exhibited by the SBF-FC cell is a result of a smaller reverse saturation current (Is) and a larger shunt resistance (Rsh), with the effect of Is being more pronounced. Additionally, the higher FF displayed by the SBF-FC cell can be attributed to a combination of factors, including a smaller Is, a smaller series resistance (Rs), and a larger Rsh. The influences of these parameters on FF are ranked in the order Is > Rs > Rsh. The smaller Rs is primarily associated with improved hole conduction of the HTL, while the larger Rsh is linked to slower charge recombination at the interface of the perovskite and HTL. The hole extraction study in Section 2.1 suggests that there is a weaker electronic wavefunction coupling between SBF-FC and the perovskite, which is consistent with the slower interface charge recombination. Moreover, scanning electron microscopy (SEM) images reveal that the spiro-OMeTAD layer on FAPbI3 contains a small number of nanoscale pinholes (Fig. 6F), whereas SBF-FC forms a dense and uniform layer on FAPbI3 (Fig. 6G). The pinholes may give rise to microdomain contact between the vacuum-deposited gold electrode and the perovskite, creating new charge recombination channels, which could also explain the larger Is observed for the spiro-OMeTAD cell.
Subsequently, the maximum power point (MPP) tracking was performed on PSCs under simulated AM1.5G conditions. The temporal evolutions of power conversion efficiency at MPP (PCEMPP), current density at MPP (JMPP), and voltage at MPP (VMPP) are shown in Fig. 6H–J. Over 200 h, the PCEMPP of the SBF-FC cell decreases from an initial value of 24.3% to a final value of 21.6%, with a retention rate of 89%. The corresponding JMPP and VMPP exhibit retention rates of 95% and 94%, respectively. In contrast, the PCEMPP of the spiro-OMeTAD cell decreases by 48% after only 40 hours. Numerical simulations of the J–V curves before and after light aging reveal that aging causes an increase in Rs and a decrease in Rsh. The decrease in Rsh is indicative of an acceleration of charge recombination, which may be attributed to an increase in perovskite layer defects. The increase in Rs may also be associated with the increase in perovskite defects and scattering centers and the reduction in doping in the HTL caused by iodine species migration. In Section 2.4, we have found that the diffusion coefficient of hydrogen iodide in the SBF-FC based HTL is indeed lower than that in spiro-OMeTAD control. Moreover, the degradation of the perovskite could also be influenced by species diffused from HTLs, such as TBPH+ and TFSI−. Preliminary modelling has shown that the cohesive energy density of the SBF-FC/TBPHTFSI composite is significantly higher than that of the spiro-OMeTAD counterpart, which should be relevant to the suppressed diffusion.
Thereby, we conclude that selecting an appropriate HTL to control species migration in PSCs is crucial for their practical operation.
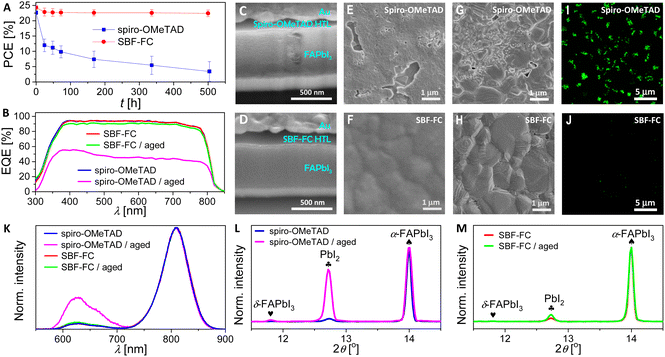
Fig. 7C and D present the cross-sectional scanning electron microscopy (SEM) images of the aged PSCs. The spiro-OMeTAD based cell, after aging at 85 °C, exhibits significant damage to its perovskite layer compared to the SBF-FC cell. Notably, this phenomenon was not observed in PSCs prior to aging (Fig. S9, ESI†). We obtained top-viewed SEM topographies by removing the gold electrode of the aged PSCs, as shown in Fig. 7E and F. The spiro-OMeTAD based HTL displays numerous cracks after aging, while the SBF-FC counterpart remains intact. To examine the surface morphology of the perovskite layer of PSCs, we removed the HTL by spin-coating chlorobenzene and isopropanol. Prior to aging, the perovskite layer of PSCs exhibits a polycrystalline structure, with nanoparticles scattered on the surface of micrometer grains, as depicted in Fig. S10 (ESI†). In contrast, for the aged PSC with spiro-OMeTAD, the perovskite film shows intergranular cracks and voids, and some perovskite microcrystals display severe corrosion and/or decomposition (Fig. 7G). Meanwhile, the morphological degradation of the perovskite film is relatively insignificant for the aged PSC with SBF-FC (Fig. 7H). Prior to aging, no spatially resolved microstructures were detected in the fluorescence optical microscopy images of the PSCs (Fig. S11, ESI†). However, after aging, a multitude of irregularly shaped PbI2 microparticles emitting green light were observed in the spiro-OMeTAD cell, as depicted in Fig. 7I. In contrast, a lower quantity of PbI2 microparticles was detected in the aged SBF-FC cell, as illustrated in Fig. 7J. The photoluminescence (PL) spectra of the PSCs before and after aging are presented in Fig. 7K. The full width at half maximum of the PL band centered at 808 nm remains consistent, irrespective of aging. The relatively weak PL band at 625 nm arises from the G-band emission of PbI2. Prior to aging, the G-band emission of PbI2 is faint, implying that the perovskite film contains a low quantity of PbI2. In contrast, for the aged PSCs, the G-band emission of PbI2 significantly intensifies, particularly in the spiro-OMeTAD cell. To evaluate the changes in X-ray diffraction of PSCs due to aging, we normalized the patterns using the diffraction peak of α-FAPbI3 as a reference (Fig. 7L and M). After aging, the intensity of the PbI2 diffraction peak increased by 16.7-fold for the spiro-OMeTAD cell, but only 1.2-fold for the SBF-FC cell.
3 Conclusions
In summary, we have developed a high glass transition temperature hole transport material, SBF-FC, by replacing the electron-donor dimethoxydiphenylamine of spirobifluorene with highly asymmetric trimethylated fluorenylcarbazolamine. When blended with an organic salt and processed through solution deposition, SBF-FC forms a thin film with excellent hole conduction and a uniform morphology. By replacing the standard hole transport material spiro-OMeTAD with SBF-FC in the fabrication of FAPbI3-based PSCs, we have observed a substantial improvement in device efficiency. This is mainly attributed to enhancements in series resistance, shunt resistance, and reverse saturation current. Moreover, the SBF-FC hole transport layer exhibits reduced diffusion of intrinsic and extrinsic species and a durable morphology at 85 °C, which effectively suppress the corrosion and decomposition of the perovskite layer. The use of SBF-FC has enabled the fabrication of PSCs with an average efficiency of 24.5% and long-term thermostability at 85 °C. This study presents a promising approach for advancing the practical application of PSCs.Conflicts of interest
The authors declare no competing interests.Acknowledgements
The authors acknowledge the financial support from the National Key Research and Development Program of China (2022YFA1204800), the National Natural Science Foundation of China (52073250 and 22275160), and the Science and Technology Innovation Program of Hunan Province (No. 2021RC5009).References
- D. W. deQuilettes, K. Frohna, D. Emin, T. Kirchartz, V. Bulovic, D. S. Ginger and S. D. Stranks, Chem. Rev., 2019, 119, 11007 CrossRef CAS PubMed.
- S. D. Stranks, G. E. Eperon, G. Grancini, C. Menelaou, M. J. P. Alcocer, T. Leijtens, L. M. Herz, A. Petrozza and H. J. Snaith, Science, 2013, 342, 341 CrossRef CAS PubMed.
- K. Wang, C. Wu, Y. Hou, D. Yang, T. Ye, J. Yoon, M. Sanghadasa and S. Priya, Energy Environ. Sci., 2020, 13, 3412 RSC.
- J. Park, J. Kim, H.-S. Yun, M. J. Paik, E. Noh, H. J. Mun, M. G. Kim, T. J. Shin and S. I. Seok, Nature, 2023, 616, 724 CrossRef CAS PubMed.
- H. Zhang, W. Xiang, X. Zuo, X. Gu, S. Zhang, Y. Du, Z. Wang, Y. Liu, H. Wu, P. Wang, Q. Cui, H. Su, Q. Tian and S. F. Liu, Angew. Chem., Int. Ed., 2023, 62, e202216634 CrossRef CAS PubMed.
- F. Zhang, S. Y. Park, C. Yao, H. Lu, S. P. Dunfield, C. Xiao, S. Uličná, X. Zhao, L. D. Hill, X. Chen, X. Wang, L. E. Mundt, K. H. Stone, L. T. Schelhas, G. Teeter, S. Parkin, E. L. Ratcliff, Y.-L. Loo, J. J. Berry, M. C. Beard, Y. Yan, B. W. Larson and K. Zhu, Science, 2022, 375, 71 CrossRef CAS PubMed.
- M. Kim, G.-H. Kim, T. K. Lee, I. W. Choi, H. W. Choi, Y. Jo, Y. J. Yoon, J. W. Kim, J. Lee, D. Huh, H. Lee, S. K. Kwak, J. Y. Kim and D. S. Kim, Joule, 2019, 3, 2179 CrossRef CAS.
- Y. Zhao, F. Ma, Z. Qu, S. Yu, T. Shen, H.-X. Deng, X. Chu, X. Peng, Y. Yuan, X. Zhang and J. You, Science, 2022, 377, 531 CrossRef CAS PubMed.
- T. Duong, J. Peng, D. Walter, J. Xiang, H. Shen, D. Chugh, M. Lockrey, D. Zhong, J. Li, K. Weber, T. P. White and K. R. Catchpole, ACS Energy Lett., 2018, 3, 2441 CrossRef CAS.
- J. Cao, X. Lv, P. Zhang, T. T. Chuong, B. Wu, X. Feng, C. Shan, J. Liu and Y. Tang, Adv. Mater., 2018, 30, 1800568 CrossRef PubMed.
- J. Wang, Y. Wang, X. Xie, Y. Ren, B. Zhang, L. He, J. Zhang, L.-D. Wang and P. Wang, ACS Energy Lett., 2021, 6, 1764 CrossRef CAS.
- S.-G. Kim, T. H. Le, T. de Monfreid, F. Goubard, T.-T. Bui and N.-G. Park, Adv. Mater., 2021, 33, 2007431 CrossRef CAS PubMed.
- Y. Kim, G. Kim, N. J. Jeon, C. Lim, J. Seo and B. J. Kim, ACS Energy Lett., 2020, 5, 3304 CrossRef CAS.
- Y. Zhang, Y. Ren, X. Xie, Y. Wei, L. He, L. Fang, J. Zhang, Y. Yuan and P. Wang, Adv. Funct. Mater., 2022, 32, 2108855 CrossRef CAS.
- J. Salbeck, N. Yu, J. Bauer, F. WeissGrtel and H. Bestgen, Synth. Met., 1997, 91, 209 CrossRef CAS.
- H. Wieland and E. Wecker, Ber. Dtsch. Chem. Ges., 1910, 43, 699 CrossRef CAS.
- R. G. Clarkson and M. Gomberg, J. Am. Chem. Soc., 1930, 52, 2881 CrossRef CAS.
- U. Bach, D. Lupo, P. Comte, J. E. Moser, F. Weissörtel, J. Salbeck, H. Spreitzer and M. Grätzel, Nature, 1998, 395, 583 CrossRef CAS.
- T. Malinauskas, D. Tomkute-Luksiene, R. Sens, M. Daskeviciene, R. Send, H. Wonneberger, V. Jankauskas, I. Bruder and V. Getautis, ACS Appl. Mater. Interfaces, 2015, 7, 11107 CrossRef CAS PubMed.
- X. Zhao, H.-S. Kim, J.-Y. Seo and N.-G. Park, ACS Appl. Mater. Interfaces, 2017, 9, 7148 CrossRef CAS PubMed.
- Y. Ren, M. Ren, X. Xie, J. Wang, Y. Cai, Y. Yuan, J. Zhang and P. Wang, Nano Energy, 2021, 81, 105655 CrossRef CAS.
- N. J. Jeon, H. G. Lee, Y. C. Kim, J. Seo, J. H. Noh, J. Lee and S. I. Seok, J. Am. Chem. Soc., 2014, 136, 7837 CrossRef CAS PubMed.
- Z. Hu, W. Fu, L. Yan, J. Miao, H. Yu, Y. He, O. Goto, H. Meng, H. Chen and W. Huang, Chem. Sci., 2016, 7, 5007 RSC.
- Y. Xue, P. Guo, H.-L. Yip, Y. Li and Y. Cao, J. Mater. Chem. A, 2017, 5, 3780 RSC.
- P.-H. Lin, K.-M. Lee, C.-C. Tinga and C.-Y. Liu, J. Mater. Chem. A, 2019, 7, 5934 RSC.
- M. Jeong, I. W. Choi, E. M. Go, Y. Cho, M. Kim, B. Lee, S. Jeong, Y. Jo, H. W. Choi, J. Lee, J.-H. Bae, S. K. Kwak, D. S. Kim and C. Yang, Science, 2020, 369, 1615 CrossRef CAS PubMed.
- Z. Deng, M. He, Y. Zhang, F. Ullah, K. Ding, J. Liang, Z. Zhang, H. Xu, Y. Qiu, Z. Xie, T. Shan, Z. Chen, H. Zhong and C.-C. Chen, Chem. Mater., 2021, 33, 285 CrossRef CAS.
- M. Han, Y. Liang, J. Chen, X. Zhang, R. Ghadari, X. Liu, N. Wu, Y. Wang, Y. Zhou, Y. Ding, M. Cai, H. Chen and S. Dai, ChemSusChem, 2022, 15, e202201485 CAS.
- N. J. Jeon, H. Na, E. H. Jung, T.-Y. Yang, Y. G. Lee, G. Kim, H.-W. Shin, S. I. Seok, J. Lee and J. Seo, Nat. Energy, 2018, 3, 682 CrossRef CAS.
- J. Nelson, The Physics of Solar Cells, World Scientific Pub Co Inc., 2003 Search PubMed.
- J. Simon and P. Bassoul, Design of Molecular Materials. Supramolecular Engineering, Wiley, 2000 Search PubMed.
- T. W. Barrett, H. Wohltjen and A. Snow, Nature, 1983, 301, 694 CrossRef CAS.
- D. M. de Leeuw, M. M. J. Simenon, A. R. Brown and R. E. F. Einerhand, Synth. Met., 1997, 87, 53 CrossRef CAS.
- S. Olthof, S. Mehraeen, S. K. Mohapatra, S. Barlow, V. Coropceanu, J.-L. Brédas, S. R. Marder and A. Kahn, Phys. Rev. Lett., 2012, 109, 176601 CrossRef PubMed.
- B. Yurash, D. X. Cao, V. V. Brus, D. Leifert, M. Wang, A. Dixon, M. Seifrid, A. E. Mansour, D. Lungwitz, T. Liu, P. J. Santiago, K. R. Graham, N. Koch, G. C. Bazan and T.-Q. Nguyen, Nat. Mater., 2019, 18, 1327 CrossRef CAS PubMed.
- M. Schwarze, C. Gaul, R. Scholz, F. Bussolotti, A. Hofacker, K. S. Schellhammer, B. Nell, B. D. Naab, Z. Bao, D. Spoltore, K. Vandewal, J. Widmer, S. Kera, N. Ueno, F. Ortmann and K. Leo, Nat. Mater., 2019, 18, 242 CrossRef CAS PubMed.
- D. Kiefer, R. Kroon, A. I. Hofmann, H. Sun, X. Liu, A. Giovannitti, D. Stegerer, A. Cano, J. Hynynen, L. Yu, Y. Zhang, D. Nai, T. F. Harrelson, M. Sommer, A. J. Moulé, M. Kemerink, S. R. Marder, I. McCulloch, M. Fahlman, S. Fabiano and C. Müller, Nat. Mater., 2019, 18, 149 CrossRef CAS PubMed.
- V. Rühle, A. Lukyanov, F. May, M. Schrader, T. Vehoff, J. Kirkpatrick, B. Baumeier and D. Andrienko, J. Chem. Theory Comput., 2011, 7, 3335 CrossRef PubMed.
- K. Walzer, B. Maennig, M. Pfeiffer and K. Leo, Chem. Rev., 2007, 107, 1233 CrossRef CAS PubMed.
- I. Salzmann, G. Heimel, M. Oehzelt, S. Winkler and N. Koch, Acc. Chem. Res., 2016, 49, 370 CrossRef CAS PubMed.
- A. D. Scaccabarozzi, A. Basu, F. Aniés, J. Liu, O. Zapata-Arteaga, R. Warren, Y. Firdaus, M. I. Nugraha, Y. Lin, M. Campoy-Quiles, N. Koch, C. Müller, L. Tsetseris, M. Heeney and T. D. Anthopoulos, Chem. Rev., 2022, 122, 4420 CrossRef CAS PubMed.
- C. C. Boyd, R. Cheacharoen, T. Leijtens and M. D. McGehee, Chem. Rev., 2019, 119, 3418 CrossRef CAS PubMed.
- S. P. Dunfield, L. Bliss, F. Zhang, J. M. Luther, K. Zhu, M. F. A. M. van Hest, M. O. Reese and J. J. Berry, Adv. Energy Mater., 2020, 10, 1904054 CrossRef CAS.
- S. Yoo, B. Domercq and B. Kippelen, J. Appl. Phys., 2005, 97, 103706 CrossRef.
Footnote |
| † Electronic supplementary information (ESI) available. See DOI: https://doi.org/10.1039/d3ee01284k |
| This journal is © The Royal Society of Chemistry 2023 |

