
 Open Access Article
 This Open Access Article is licensed under a Creative Commons Attribution-Non Commercial 3.0 Unported Licence
3D printed triply periodic minimal surfaces as advanced structured packings for solvent-based CO2 capture†
Nathan C.
Ellebracht
 a,
Pratanu
Roy
a,
Thomas
Moore
b,
Aldair E.
Gongora
b,
Diego I.
Oyarzun
b,
Joshuah K.
Stolaroff
c and
Du T.
Nguyen
*b
a,
Pratanu
Roy
a,
Thomas
Moore
b,
Aldair E.
Gongora
b,
Diego I.
Oyarzun
b,
Joshuah K.
Stolaroff
c and
Du T.
Nguyen
*b
aPhysical and Life Sciences Directorate, Lawrence Livermore National Laboratory, Livermore, California 94550, USA
bEngineering Directorate, Lawrence Livermore National Laboratory, Livermore, California 94550, USA. E-mail: nguyen98@llnl.gov
cMote, Inc, Los Angeles, California 90034, USA
First published on 14th March 2023
Abstract
Point-source CO2 capture is a critical technology for industrial decarbonization and certain CO2 removal processes. Solvent-based CO2 absorption is a mature process, but the capital investment and energy requirements are substantial, especially when economic drivers for its deployment are tenuous. We utilized additive manufacturing and computational fluid dynamics to screen and prototype structured packings in the vast design space accessible via advanced manufacturing and computer-aided design. 3D-printed triply periodic minimal surfaces (TPMS) were tested as advanced packing geometries for CO2 capture from simulated flue gas (10% CO2) and evaluated alongside a representative industrial packing geometry, Mellapak 250Y. 1D model fits of experimental absorption data revealed 49–61% increases in mass transfer performance (kLaeff) and 91–140% increases in effective gas–liquid interfacial area in TPMS packings (Gyroid and Schwarz-D) compared to 250Y. These advanced structured packings also featured similar or better maximum fluid loads and pressure drops than 250Y, reinforcing their industrial potential. Together with the capability to natively distribute fluid shown by the TPMS geometries, the performance improvements realized could reduce absorber capital costs by more than 30%.
Broader contextDeep industrial decarbonization is necessary to curb the rise of carbon dioxide emissions and the steady warming of the atmosphere. Solvent-based point-source carbon dioxide capture is one decarbonization solution for fossil fuel-based power generation. It also applies to various industrial processes including iron, steel, hydrogen, and chemicals production and is central to some carbon removal technologies like biomass carbon removal and storage (BiCRS). Although acid gas scrubbing with aqueous amines is very mature, commercial deployment of CO2 capture remains slow due to high costs, energy requirements, and sparse economic drivers. However, national and private commitments to decarbonization make this an increasingly relevant technology. This work targets a solvent-agnostic aspect of CO2 absorbers: the structured packing material which enables high interfacial surface area contact between the gas stream and the liquid solvent. Structured packing research has slowed, but we aim to bring about a step change in packing performance by accessing the vast design space afforded by advanced manufacturing. Results from this foray into novel structured packing designs showed mass transfer improvements of greater than 50% compared to industry-standard commercial packings, which could be associated with significant (30%) capital expenditure savings in deployments of industrial absorbers for CO2 capture. |
1. Introduction
The landmark Special Report from the Intergovernmental Panel on Climate Change in 2018 highlighted the clear benefit of limiting warning due to atmospheric greenhouse gas accumulation to 1.5 °C.1 At the time of submission, the global mean atmospheric CO2 concentration as reported by US National Oceanic and Atmospheric Administration has surpassed 415 ppm and increasing by about 2 ppm per year.2 Rapid decarbonization and emissions mitigation will be necessary to curb continued warming, and carbon capture, utilization, and storage (CCUS) technologies may be critical to this end.3 In addition to emissions reduction, point-source capture of CO2 is also a key component of certain CO2 removal (CDR) technologies like biomass carbon removal and storage (BiCRS).4,5 However, among options for decarbonization, the 2022 Working Group 3 Report from the IPCC made clear the limitations of CCUS resulting from its relatively high cost (50–200 $ per tCO2eq).6Solvent-based absorption is the most mature of the several technologies investigated for industrial CO2 capture, which also include solid adsorption, membrane separation, and biomass fixation.7 As of September 2021, there were only 27 operational commercial CCUS facilities (totaling 37 MtCO2 per year capacity), with an additional 111 Mt per year capacity in development.8 In conventional solvent-based absorption systems, a CO2-rich gas stream, such as post-combustion flue gas, is contacted with a CO2-absorbing solvent in a packed tower. Absorber CO2 capture performance depends on the packing, which provides a large interfacial area for the CO2-rich gas to contact and react with the liquid solvent.9,10 Most industrial structured packing designs feature a design motif of stacked corrugated sheets, as does Sulzer Mellapak™ 250Y,11 an exemplary packing which has been studied and benchmarked for decades.12–16 Despite the importance of structured packing, designs have not drastically changed in the century-long history of packed absorption towers. In a conventional CO2 absorber system, the CapEx for the packing and column are roughly 75% of the total costs and is mostly determined by the size of column and quantity of packing.17 Improvements in structured packings can cut drastically into these major cost drivers by reducing column size and packing volume. The persistent relevance of 250Y reflects the maturity of the technology, and as such non-marginal gains in performance are quite significant.
The advent of advanced manufacturing techniques like additive manufacturing has opened the door for groundbreaking design freedoms.18,19 The potential of this expanded design space is as yet underexplored and could enable long-overdue advances in structured packing design through control of the complex two-phase absorption environment. While previous studies have reported that solvents tend to form a 1 mm film on packings regardless of geometry,20,21 many researchers have aimed to improve packings through conventional design approaches. Researchers have proposed patterned surfaces that enhance gas-to-liquid mixing and surface area by perturbing the liquid flow.22–24 Similarly, packing surfaces have been designed to promote micro-mixing25 and surface-induced vortices.26 Novel packing structures, like ceramic foams and spherical meshes, have resulted in advances such as increased maximum fluid loads and reduced pressure drop.27–29 To date, limited performance improvements from mixing and mass transport have been achieved, in part due to the inherent limitations of conventional manufacturing techniques. Utilizing additive manufacturing,30,31 structured packing properties such as surface wettability32 can be tailored to enhance surface flow by assigning different contact angles to control flow.33,34 We further leveraged the design freedoms afforded by additive manufacturing to achieve a step change in packing performance with the potential greatly reduce system costs. Improvements to the packing are relevant not only to legacy CO2 solvents like monoethanolamine but also to modern solvents like piperazine and next-generation organic and ionic liquid solvents.35–37
Here, we present a framework to design, model, and experimentally evaluate additively manufactured structured packing geometries from the triply periodic minimal surface (TPMS) design space (Fig. 1). TPMS structures consist of two inter-penetrating fluid domains separated by a thin wall with periodic properties in all three dimensions; these nature-inspired periodic surfaces locally minimize area, exhibit zero mean curvature, and provide smoothly undulating paths for fluid flow.38–40 In previous studies, TPMS geometries have been demonstrated to markedly enhance transport performance in membranes and exchangers.41–44 In this work, we assessed various TPMS geometries as structured packings and critically compared their performance to a conventional structured packing, Mellapak 250Y. We developed a two-phase computational fluid dynamics (CFD) modeling framework, screened an array of TPMS geometries for their fluid flow characteristics, and selected several structured packing geometries to study experimentally: Gyroid, Schwarz-D, and Schwarz-P. We used a modular, liter-scale absorber apparatus to evaluate packing absorption performance for CO2 capture from simulated flue gas with aqueous sodium hydroxide as a model liquid solvent. We fit experimental data to a one-dimensional absorber model to determine interfacial areas and liquid mass transfer coefficients.45 Finally, we explored the scaling potential for TPMS packings by quantifying industrially relevant operating parameters such as pressure drop, liquid holdup, and flooding fluid loads. Ultimately, we revealed 49–61% mass transfer performance improvements in TPMS packings associated with great (91–140%) enhancement in gas–liquid interfacial area. These advanced packing geometries could reduce capture system CapEx by 30% and overall costs by 20%, improving the economic viability of point-source CO2 capture.17
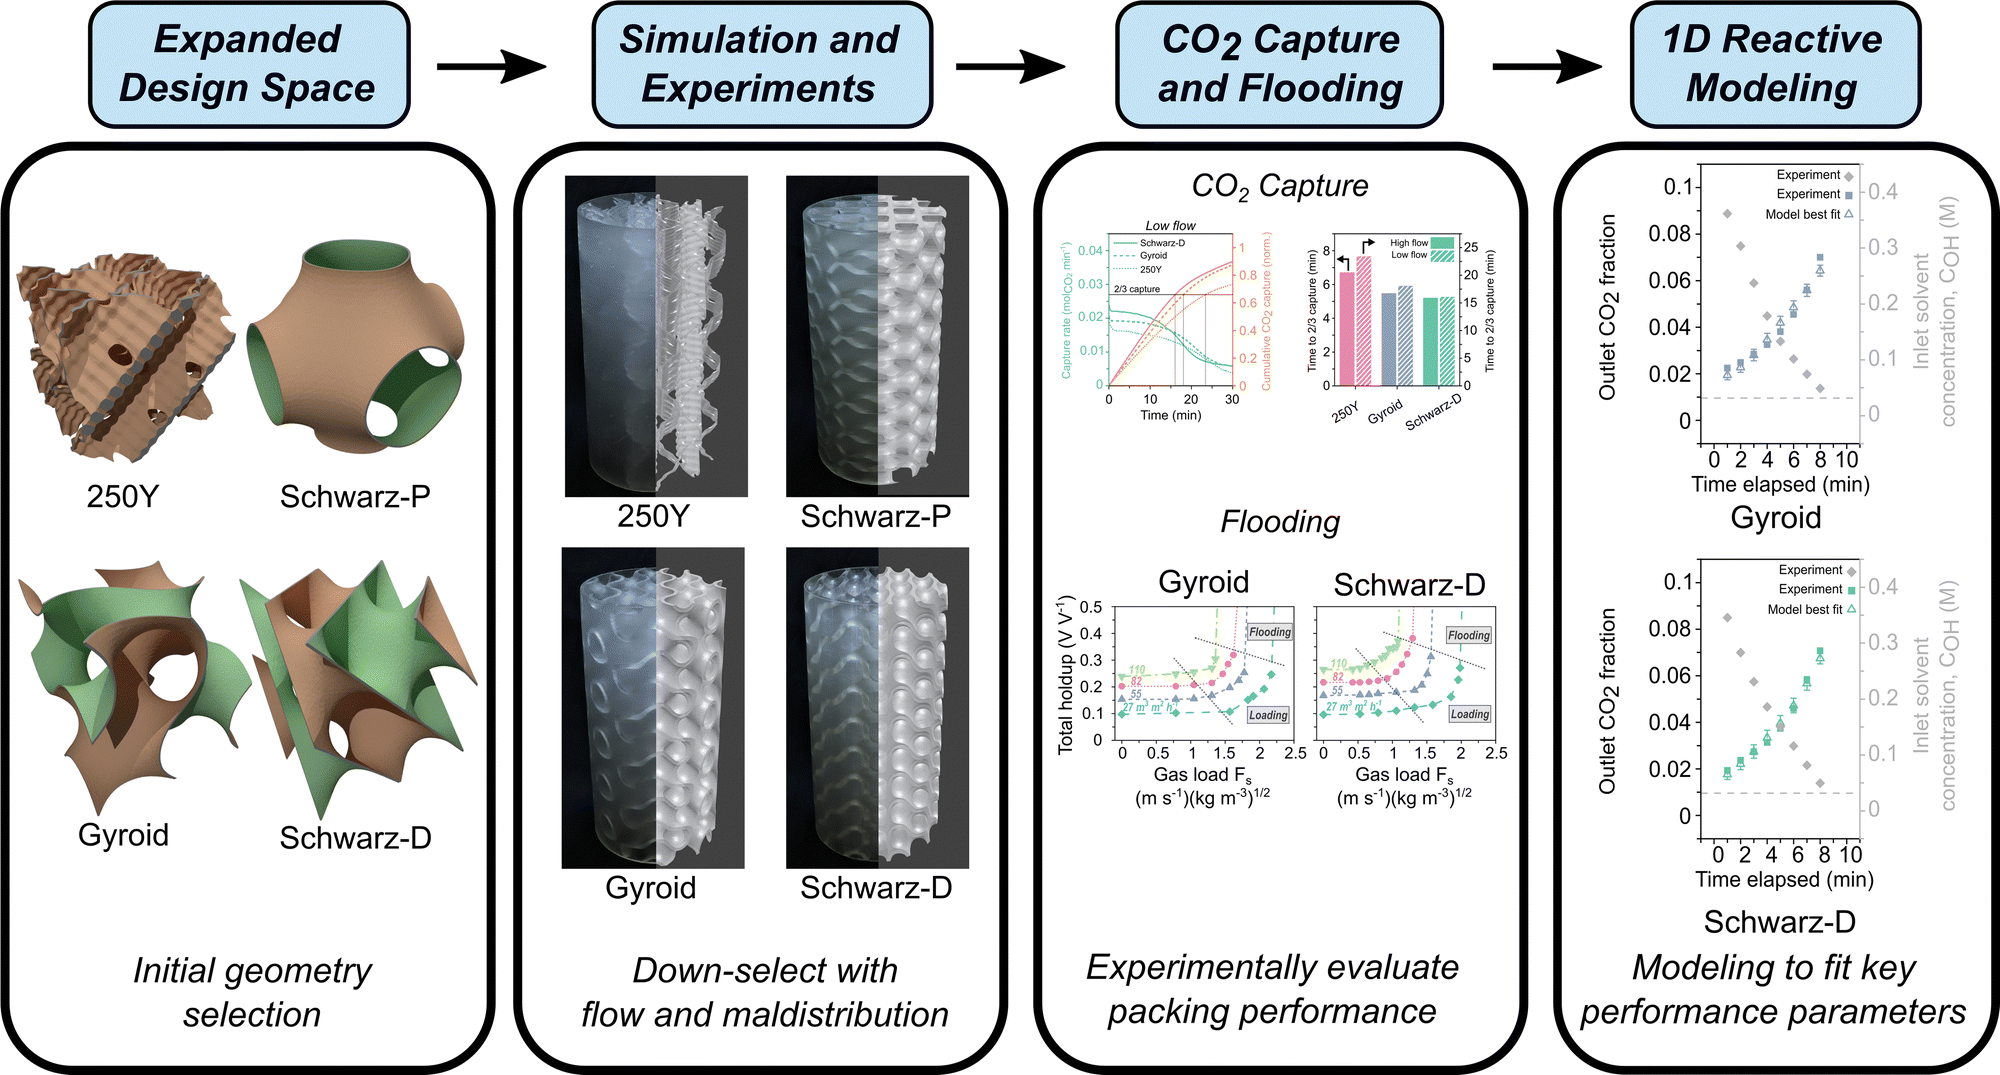 | ||
| Fig. 1 An experimental, simulation, and modeling framework for the design and evaluation of additively manufactured triply periodic minimal surface (TPMS) structured packings for their performance in solvent-based CO2 capture. | ||
2. Methods
2.1. Design and 3D printing of structured packings
Computer-assisted design (CAD) files for TPMS structured packings were constructed with geometric specific surface areas of 250 m2 m−3, the chosen fixed design parameter. MathMod, an open-source plotting program specialized for surfaces based on implicit functions, was used to generate wavefront files (6 × 6 × 10 unit cells at ≥100 resolution) for various TPMS structures using their defining equations (Table S1, ESI†). These surface files were imported into Blender, an open-source 3D graphics toolset, to convert the surfaces into 3D-printable packing structures. Each TPMS surface was scaled, smoothed, and thickened to 2 mm such that the resulting bulk structure had a specific surface area of 250 m2 m−3. A 74 mm diameter, 150 mm height section of each structure was fit with a 1.5 mm shell and exported for printing. Packings for holdup and pressure drop measurements were generated with a reduced diameter of 40.4 mm.Structured packings were 3D printed with Formlabs Form 2 stereolithography printers in Formlabs “Clear Resin” acrylate resin. Packings were printed oriented vertically with layer thickness set to 0.1 mm. Prints were washed in isopropyl alcohol and allowed to dry in ambient conditions overnight before curing in Form Cure 405 nm UV chambers for 60–75 min at 60 °C.
2.2. Liquid maldistribution measurements
We collected data on the outlet fluid distribution of packing geometries using a 3D-printed hexagonal collector array consisting of 37 individual cells. The collector featured an array of individual hexagonal columns (130 mm height, 7 mm side length, 1.5 mm spacing, 7 unit diameter) into which water collected after passing through a single 74 mm packing section. Water flowing at ∼1.2 L min−1 (20 m3 m−2 h−1) was directed to the top middle of a packing section placed on top of the collector. The quantity of water collected in each column was then measured. This was repeated at least three times for each packing and the results averaged and normalized for spatial analysis.The coefficient of variation (CoV) is one of the most widely used metrics for analyzing the liquid distribution within structured packings.46 The CoV is usually defined as the ratio of the standard deviation to the mean. However, this metric does not account for additional geometric factors, such as dispersion and clustering. Several other methods of measuring the liquid distribution within a structured packing have been developed, including ones based on radial liquid distributions or maldistribution coefficient.47–49
Ripley's K function is a tool typically used for spatial point analysis and describes how much spatial clustering occurs in a set of points.50 The K function is generally defined as the average number of events that occur within a predefined radius from any other event, which is then normalized to the density over the field of view. Amgad et al. extended Ripley's K function use to greyscale images51 and enabled us to quantify the maldistribution in the fluid flow with a method that preserved spatial information. In the greyscale extension of the K function, the result was represented as a function of distance K(r). Additional details and a comparison between the use of CoV and Ripley's K function can be found in the ESI.†
2.3. Solvent CO2 capture with benchtop absorption column
Solvent-based CO2 absorption in structured packings was performed with a modular absorber column comprised of both 3D-printed (Formlabs, clear resin) parts and commercial fittings (fluid connections, gaskets, etc.). The apparatus featured tee-shaped gas and liquid flow distributors at the gas (bottom) and liquid (top) flow inlets with evenly spaced circular orifices. Absorption performance of structured packings was evaluated using a fixed volume of recirculated aqueous solvent (NaOH) to remove CO2 from a simulated flue gas (10% CO2, balance N2). The liquid bottoms drained to a 3.8 L stirred reservoir which was fed back to the column using a US Solid M6-6L peristaltic pump. Inlet gas flow was controlled by a variable area flowmeter. The gaseous outlet from the absorber was fed to an Omega digital mass flowmeter and partially fed to an infrared CO2 sensor (SprintIR 0–100%). An inline pH electrode (Hanna Instruments HI1001) measured the solvent pH just before the liquid distributor.Absorption experiments in two flow regimes were performed for each packing type. Gas feed flow rates of ∼4.7 (“low flow”) or ∼28 SLPM (“high flow”) and recirculated solvent flow rates of 0.75 (“low flow”) or 2.75 L min−1 (“high flow”) were used. Stable, continuous two-phase flow was established in the absorber using N2 feed gas and freshly prepared NaOH solvent (Sigma Aldrich, 98%, dissolved in MilliQ H2O) at the desired liquid and gas flow rates. In low flow experiments, 2 L of 0.3 M NaOH solvent was used. For high flow experiments, solvent volume and concentration were increased to 3 L and 0.4 M NaOH, respectively. Absorber fluid flows and sump level were stabilized with N2 flow, then the gas feed line was switched to the simulated flue gas feed and the solvent was recirculated until pH fell below ∼11.4. Outlet gas flow rate, outlet gas CO2 fraction, and solvent pH were recorded during the capture experiments.
2.4. 1D absorption model fitting
A 1D absorber model was developed in MATLAB to fit packing parameters, liquid mass transfer coefficient, kL, and effective interfacial area, aeff, to experimental data from absorption experiments. The model utilized a numerical boundary value problem with fixed inlet gas CO2 fraction (10%, bottom) and inlet solvent concentration (top) specified by experimental data. The full 1D solution was used to determine the outlet CO2 fraction and calculate a squared residual from the corresponding experimental data point. Experimental absorption data points from every one (for high flow) or two minutes (for low flow) while pH ≥ 12.5 were extracted and fit with the model for a range of kL and aeff. An optimization function minimized the overall least squares sum across the modeled data range to determine the best fit packing parameter pair.Our model was based largely on that described by Wang et al.29 and considered the instantaneous reaction of CO2 at the gas–liquid interface with the aqueous hydroxide solvent using the following mass balance based on reaction-enhanced mass transport of CO2 along the length of the absorber:
 | (1) |
 | (2) |
 | (3) |
2.5. Absorber holdup, flooding, and pressure drop
Two-phase flow testing for flooding and pressure drop was performed with the absorber apparatus described above. Pressure drop was measured with Omega PX274 or PX277 differential pressure transducers with pressure ports in the column just above and below the packing section. For flooding and holdup experiments, three 150 mm packing sections of printed packings with reduced diameters (40.4 mm) were used to achieve flooding-range liquid and gas loads in the column given absolute flow rate constraints. These packings had the same geometric surface areas as the 74 mm packings (250 m2 m−3). A column bottom piece was 3D printed to affix a 37.5 mm diameter graduated glass column below the column. The system was loaded with a fixed volume of water to be recirculated. Holdup experiments were performed by fixing the liquid flow rate and increasing the inlet gas (house air) flow rate. The liquid level in the glass column was noted after each gas flow rate adjustment, and the total holdup was calculated sequentially from the change in liquid level. To note, due to the sequential nature of the loading measurements, possible wall effects, and some annular spaces trapping liquid, the absolute holdup values may be skewed by some non-negligible systemic error. The gas flow rate was increased until flooding occurred. Liquid flow rates were selected to test the same linear velocity (liquid load) range for each packing.2.6. Computational fluid dynamics simulations
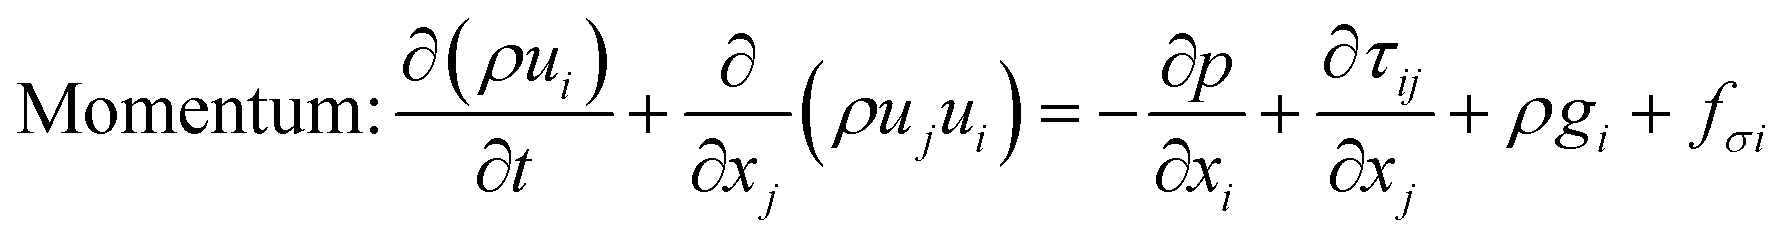
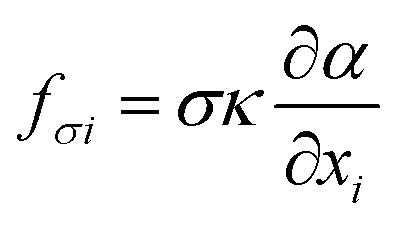
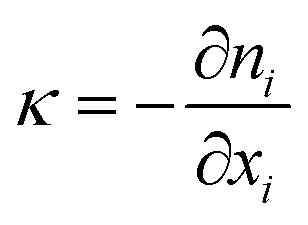
The computational modeling was performed using OpenFOAM,54 an open-source software package for solving computational mechanics problems. Two-phase flow in the structured packing was simulated using the interFoam solver within the OpenFOAM framework, which is a solver for incompressible immiscible fluids with volume of fluid (VOF) phase-fraction-based interface capturing method. The surface tension force is approximated using the continuum surface force (CSF) model introduced by Brackbill et al.55 In this model, the surface tension is assumed to be a volume or body force and the surface tension, σ, can be included in the momentum equations by using the gradient of volume fraction function, α. The governing equations are: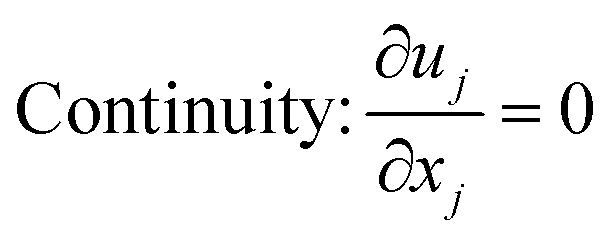 | (4) |
 | (5) |
 | (6) |
 | (7) |
Two-phase flow simulations were conducted to analyze and compare the liquid distribution in various structured packing geometries. The surface (.stl) files generated as described in Section 2.1 were imported into OpenFOAM and meshed using the built-in SnappyHexMesh utility. The quality of the generated mesh was checked to ensure reliable numerical solution. A circular liquid inlet similar to that used in maldistribution experiments was used in the simulation (Fig. S5, ESI†), and the resulting liquid distribution at the packing outlet was evaluated via the same K function treatment as described above.
3. Results and discussion
3.1. 3D-printed packing geometries and liquid maldistribution
Sulzer Mellapak 250Y (Fig. 1) is a commonly used and representative packing among the numerous commercial options for structured and random packings, and it was chosen to represent a legacy packing design in this work.11–13 This selection enables direct comparison of alternative designs to a packing relevant to industrial applications. Mellapak 250Y can be most simply described as stacked and offset corrugated sheets oriented vertically (Fig. 1). Triply periodic minimal surface (TPMS) geometries, featuring highly interconnected and tortuous flow paths, are considered here as alternative packing designs. While there is a vast array of TPMS designs that have been discovered to date (more structures in Fig. S1, ESI†), not all TPMS are expected to exhibit advantageous packing performance. To select packing designs from the TPMS design space, we down-selected structures based on the understanding of TPMS geometries in comparable transport phenomena, such as heat transfer simulations,56,57 and from available literature.58,59 We also prioritized those which have been featured in a body of prior work. The TPMS structures selected were Schwarz-D, Gyroid, and Schwarz-P (Fig. 1). All the designs considered in this study, including the legacy Mellapak 250Y, were 3D printed in the same inert photopolymer resin material and had identical geometric specific surface areas (250 m2 m−3, Table S1, ESI†) to ensure adequate head-to-head comparison.Maldistribution, the unevenness of fluid spatial distribution in packed column, is known to adversely affect separation efficiency in two-phase flow.60 We hypothesized that measures of maldistribution may provide valuable initial insight into packing performance. To this end, we performed qualitative (flow visualization) and quantitative (fluid distribution measurements) maldistribution experiments alongside computational fluid dynamics (CFD) simulations (Fig. 2). To note, the degree of maldistribution may change depending on the distributor or inlet conditions. The flow distributions observed in simulations were qualitatively similar to those observed in experiments. Flow maldistributions, as represented by an integrated K function metric,50,51 were computed for each of the designs from the experimental and simulated flow distributions (Fig. 2e). All TPMS packing designs tested exhibited improved (lower K) maldistribution relative to Mellapak 250Y. We found the Gyroid design to have the lowest maldistribution, with a K function maldistribution metric five times lower than that of 250Y. Experimentally measured maldistribution values were in excellent agreement with those predicted from simulation.
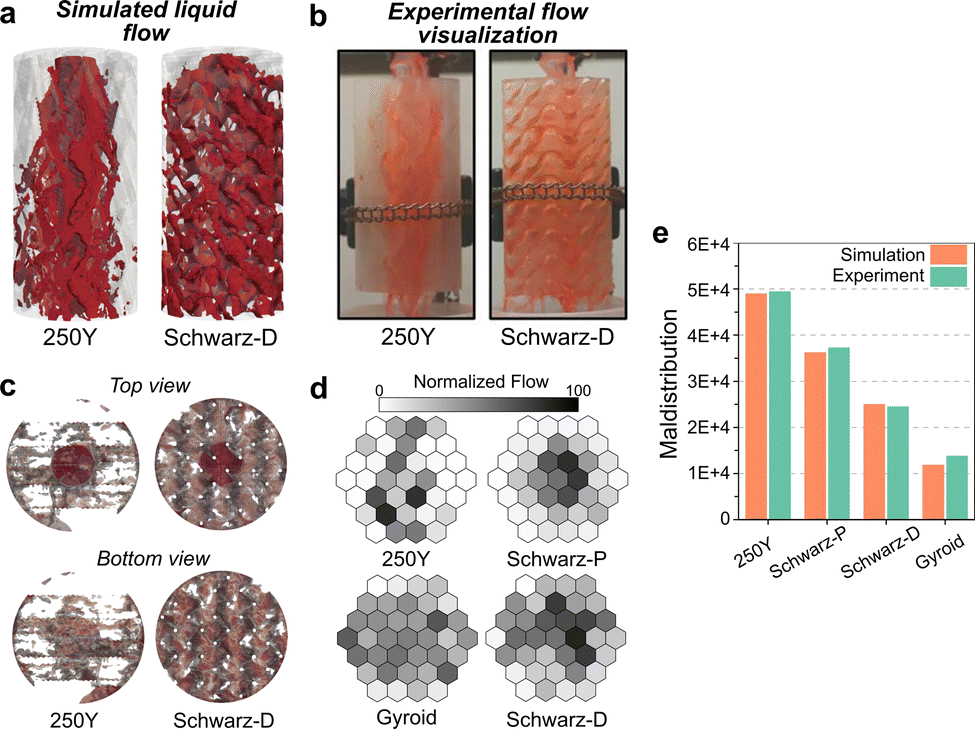 | ||
| Fig. 2 (a) Snapshots of transient computational fluid dynamics (CFD) simulations of two-phase flow through structured packings (video in ESI†). Each packing has a diameter of 74 mm. (b) Snapshots of flow visualization experiments in printed structured packings using dyed water (videos in ESI†). (c) Top and bottom orthonormal views of liquid flow distribution (transparent red) from CFD simulations. The darker circle in the top views is the liquid inlet area. (d) Experimental two-dimensional outlet liquid flow distributions from 150 mm packing sections measured with a hex-sectioned collector. Hex shading represents the outlet flow volume collected in each section normalized by the maximum for each structure. (e) Integrated K function maldistribution from experimental and simulated flow distributions. A lower maldistribution indicates more evenly distributed flow. | ||
The fluid distribution data (Fig. 2d) alongside the CFD results give physical insight into the observed qualitative differences. In 250Y, liquid flowed down the corrugated sheets while spreading perpendicular to the flow direction in one dimension, along the width of the sheet. The resulting liquid maldistribution of flow exiting the packing was roughly “flat” or planar, as reflected in the 2D flow distribution (Fig. 2c and d). In conventional packed towers, 90° rotations of packing layers and intermittent liquid redistribution elements are required to achieve sufficiently low maldistribution for optimal separation performance. By contrast, the liquid flow in Gyroid and Schwarz-D packings was readily distributed across the packing cross-section as it moved down the packing due to the fully interconnected flow paths. Flow distributors can account for greater than 10% of the total height in industrial absorbers and are themselves costly.17 These advanced packings could eliminate the need for flow distributors, reducing column height and improving the homogeneity of flow along the column height.
Comparative video examples of simulated and experimentally visualized flows in 250Y and Schwarz-D are included in the ESI.† Schwarz-P, which has open vertical channels when viewed down its vertical axis, displayed the worst flow distribution among the TPMS structures. The vertical open channels allowed liquid to pass through the packing with minimal horizontal distribution, as indicated by visual observation and measured 2D flow distribution. With the results from the CFD model and maldistribution testing, we selected the top two TPMS designs, Gyroid and Schwarz-D, for further testing. In this way, maldistribution prediction from CFD simulations may provide a means for selecting top candidates designs that may yield superior CO2 absorption performance.
3.2. Absorber CO2 capture performance with printed packings
We tested the CO2 absorption performance of the down-selected TPMS structures (Gyroid and Schwarz-D) alongside Mellapak 250Y in semi-batch operation (Fig. 3a) at two different gas and liquid flow conditions, nominally “high” and “low” flow. A fixed volume of liquid solvent, initially contained in an external reservoir, was recirculated through the absorber as a constant inlet feed of simulated flue gas was supplied. The initial CO2 removal efficiency was much greater than 50% in all experiments as the fresh, lean solvent (aqueous NaOH) captured a significant fraction of the CO2 from the simulated point source. Outlet CO2 fraction and inlet solvent pH sigmoidally increased and decreased, respectively, as the experiment proceeded and as the recirculated solvent was increasingly loaded with captured CO2 (Fig. S6, ESI†). To ensure sufficient experiment times to establish pseudo-equilibrated absorber states for model fitting, the absorber was operated at a high liquid load relative to the gas load (L/G), and as such the single-pass solvent utilization was generally low. The chemical stability of the clear resin photopolymer to alkaline solvents was verified with ATR-FTIR (Fig. S11, ESI†).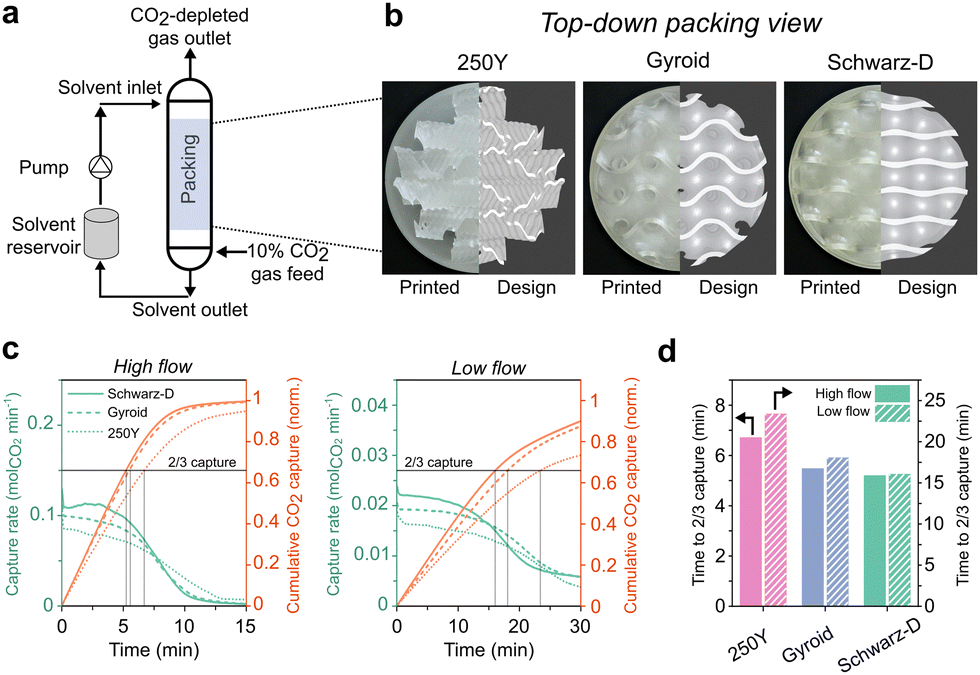 | ||
| Fig. 3 (a) Schematic of the semi-batch CO2 absorber setup, utilizing a continuous 10% CO2 (balance N2) gas feed and a fixed volume of recirculated liquid solvent. (b) Top-down view of the packing structures used in the absorption experiments. The left halves of the images are digital photographs of as-printed packings; the right halves are the originating computer-assisted designs. (c) Local CO2 removal rate (left) and cumulative CO2 captured, normalized by the solvent capacity (right), for high (left plot) and low (right plot) flow absorption experiments. (d) Time to 2/3 solvent utilization for different structured packings under nominal high and low flow conditions. | ||
The rates of CO2 absorption and cumulative CO2 captured for each packing are shown in Fig. 3c. Both TPMS structures (Gyroid and Schwarz-D) exhibited an increased CO2 flux from the feed gas despite having the same geometric specific surface area as 250Y, 250 m2 m−3. The flux decreased more rapidly over time in the TPMS packings as the solvent was utilized at a greater rate. As an initial performance metric, the time to two thirds solvent utilization was compared across structure packings (Fig. 3d). The improved CO2 capture performance in TPMS packings was observed in both high and low flow absorber operation and resulted in 18–23% and 23–31% reductions in solvent utilization times for Gyroid and Schwarz-D, respectively, compared to 250Y. Another indication of the superior performance of TPMS packings is the initial capture efficiency and resulting breakthrough CO2 concentrations (Table 1 and Fig. S6, ESI†), where similar improvements of ∼20% in both metrics were measured in Gyroid and Schwarz-D. These gains over mature state-of-the-art industrial packings are substantive and are initial indicators of the potential for meaningful cost reductions in industrial CCUS applications through reductions in absorber and packing height.
| Packing | Initial capture efficiency (%) | Initial capture rate (molCO2 min−1) | k L (mm s−1) | a eff (m−1) | k L a eff (s−1) |
|---|---|---|---|---|---|
| Schwarz-D | 83 | 0.11 | 0.14 | 415 | 0.059 |
| Gyroid | 79 | 0.10 | 0.19 | 330 | 0.064 |
| 250Y | 67 | 0.085 | 0.23 | 170 | 0.040 |
3.3. Absorption modeling and packing parameter fitting
Gyroid and Schwarz-D TPMS packings showed enhanced absorption compared to Mellapak 250Y in the CO2 capture experiments described above. To plausibly attribute these effects to physical phenomena, we implemented a 1D model for reactive absorption with chemical enhancement to fit the liquid mass transfer coefficient, kL, and the effective gas–liquid interfacial area, aeff, using absorber operation data. A subset of the experimental data from each set of experiments were fit using this model (Fig. 4a).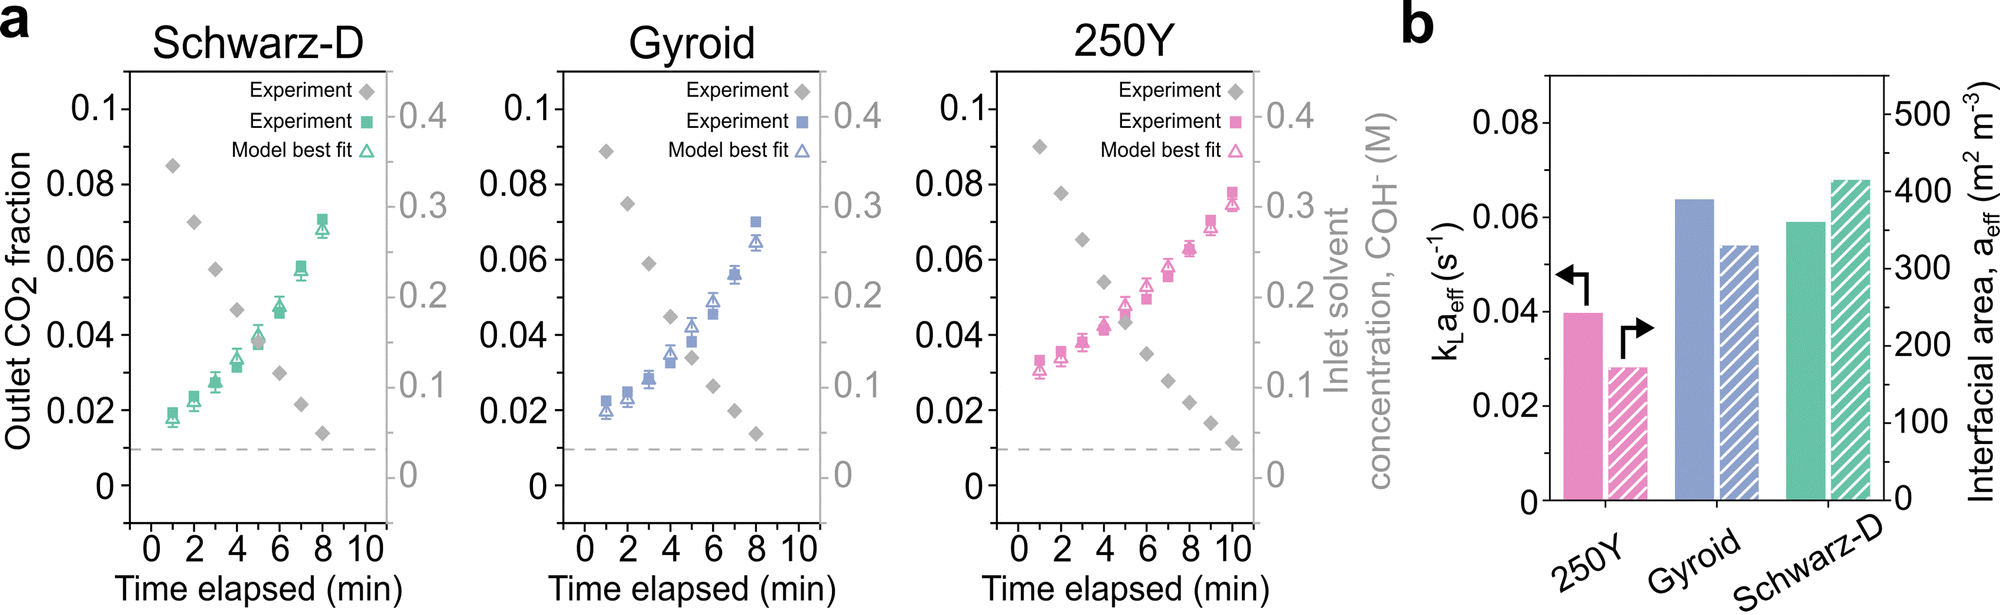 | ||
| Fig. 4 (a) Selected experimental timepoints of outlet gas CO2 fraction (filled colored symbols) and resulting modeled data (open symbols) for best fit aeff and kL parameters. Error bars represent model results with ±5% perturbed best fit parameters. The inlet solvent concentrations at each timepoint (filled grey symbols) and inlet CO2 concentration (10%) were the primary model inputs. Pearson correlation coefficients (R2) for model fits with best fit parameters for 250Y, Gyroid, and Schwarz-D were 0.976, 0.962, and 0.988, respectively. (b) Best fit absorption parameters for the structured packings studied. | ||
Best fit parameters for each packing type from high flow rate absorber data are displayed in Table 1. Critically, the fitting results indicate that the TPMS packings achieve remarkably high effective interfacial surface areas. The aeff values fit to the Schwarz-D and Gyroid data are 140% and 91% greater than that of 250Y, respectively. To represent the uncertainty in the fit parameters, we performed a basic heuristic sensitivity test by perturbing both best fit values by ±5%, a common method in statistical sensitivity analysis, reflected in the error bars in Fig. 4a.61 The accuracy is also shown in the fitting error across a broad parameter sweep (Fig. S8 and S9, ESI†).
For strong chemical solvents like aqueous sodium hydroxide and other typical liquid CO2 solvents like monoethanolamine, our modeling and literature indicate that an increase in interfacial surface area has a greater effect on absorptive flux than a moderate change in the second fitting parameter, the liquid phase mass transfer coefficient, kL.14,15 Despite a much lower best fit aeff, 250Y had the greatest liquid mass transfer coefficient among packings tested. While there is no single all-encompassing parameter to define the performance of structured packings, the product of these two parameters, kLaeff, is a reasonable lumped metric for head-to-head comparison. By this key metric, the fit values to Gyroid and Schwarz-D absorption data were 61% and 49% greater than that of 250Y, reinforcing the initial indications of superior performance from flow maldistribution and CO2 absorptive flux. These gains can translate to meaningful cost reductions in industrial CCUS, which is described further in Section 3.4.
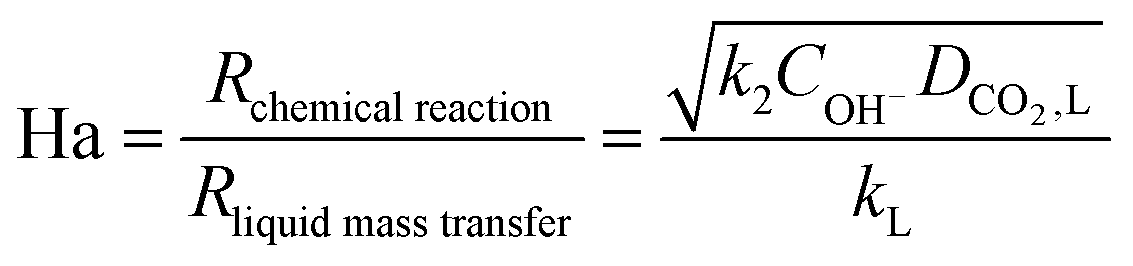
The interfacial area most significantly affects lean solvent data, where the reactive chemical enhancement of absorption is strongest. The increased initial fluxes in TPMS packings (Fig. 3c) are reflected in the higher fit values for interfacial areas (Table 1). As the solvent is recirculated and increasingly loaded, the chemical reaction rate, modeled as a second-order reaction between interfacial CO2 and dissolved hydroxide ions,53 decreases, and the mass transfer coefficient has a greater relative impact on the absorption. This effect is captured in the shape of the data over time and by the dimensionless Hatta number:
 | (8) |
The model assumes instantaneous surface reaction and is thus most relevant under moderate chemical enhancement. The chemical enhancement is a function of Ha (Fig. S10, ESI†), which in turn is a function of the solvent loading and the mass transfer coefficient. In general, the model considered experimental data corresponding to Ha of roughly 5–20 where a pseudo-first order reaction and simplified treatment of the solvent are applicable. At greater solvent loadings with less chemical enhancement, a more complex treatment of the absorption and aqueous chemistry would be necessary. The model had a similar fit quality for low flow experimental data (Fig. S7d–f, ESI†), but the fit interfacial areas were significantly lower across all packings (Table S4, ESI†), consistent with prior work showing lower interfacial areas associated with lower fluid loads.62 Low flow absorption was less representative of realistic operational regimes, and the results from high flow testing have greater industrial relevance. These analytical details are specific to the solvent used in this work, however the improved packing performance realized here could apply generally to any liquid capture solvent.36,37 A major tradeoff in certain advanced solvents like CO2-binding organic liquids (CO2BOLs) is their increased viscosity compared to classic aqueous solvents. An advantage of the vast design flexibility in TPMS packings is the potential for adaptability to altered solvent rheology and fluid dynamics, such that the performance achieved herein could similarly enhance CCUS with challenging advanced solvents.
3.4. Industrial performance metrics: liquid holdup, flooding, and pressure drop
The demonstrated improvements in fluid distribution, CO2 flux, and interfacial area with TPMS packing geometries indicate potential for point-source CO2 capture, but there are other aspects of structured packing performance critical to industrial use. In this section, we discuss TPMS packing performance across several key aspects of a drop-in packing technology: maximum fluid loads, column flooding points, and pressure drop. Fluid loads and flooding affect requisite column cross-section for a desired throughput, and pressure drop determines blower size and energy input. We collected simultaneous liquid holdup, flooding, and pressure drop data while steadily increasing gas load for fixed liquid flow rates.A typical tradeoff and point of optimization for liquid absorption is the packing surface area, an increase in which will increase the rate of CO2 removal but will decrease maximum fluid load and increase pressure drop. We found that the holdup and flooding profiles of the TPMS and 250Y packings were generally similar, with TPMS packings matching or outperforming 250Y at moderate to high liquid loads (Fig. 5a). The marked structural differences, including increased tortuosity and decreased void fractions in TPMS packings (Table S1, ESI†), may have been expected to result in a deviation in flooding behavior, but the loading profiles and flooding were in the same range as those of 250Y (Fig. 5a and c). To note, pressure drop and flooding results for 3D-printed 250Y were consistent with literature values for commercial 250Y packing.12,13 The TMPS packings had slightly higher liquid holdups across all conditions, due in part to their lower void fractions, a parameter which could be appreciably increased simply by decreasing the wall thickness. The increased holdups may also be reflective of the increased gas–liquid interfacial areas described in the previous section. Additional modeling work has shown that holdup and flooding are strongly affected by the solvent viscosity but performance trends in TPMS packings are consistent across aqueous and water-lean solvents.63
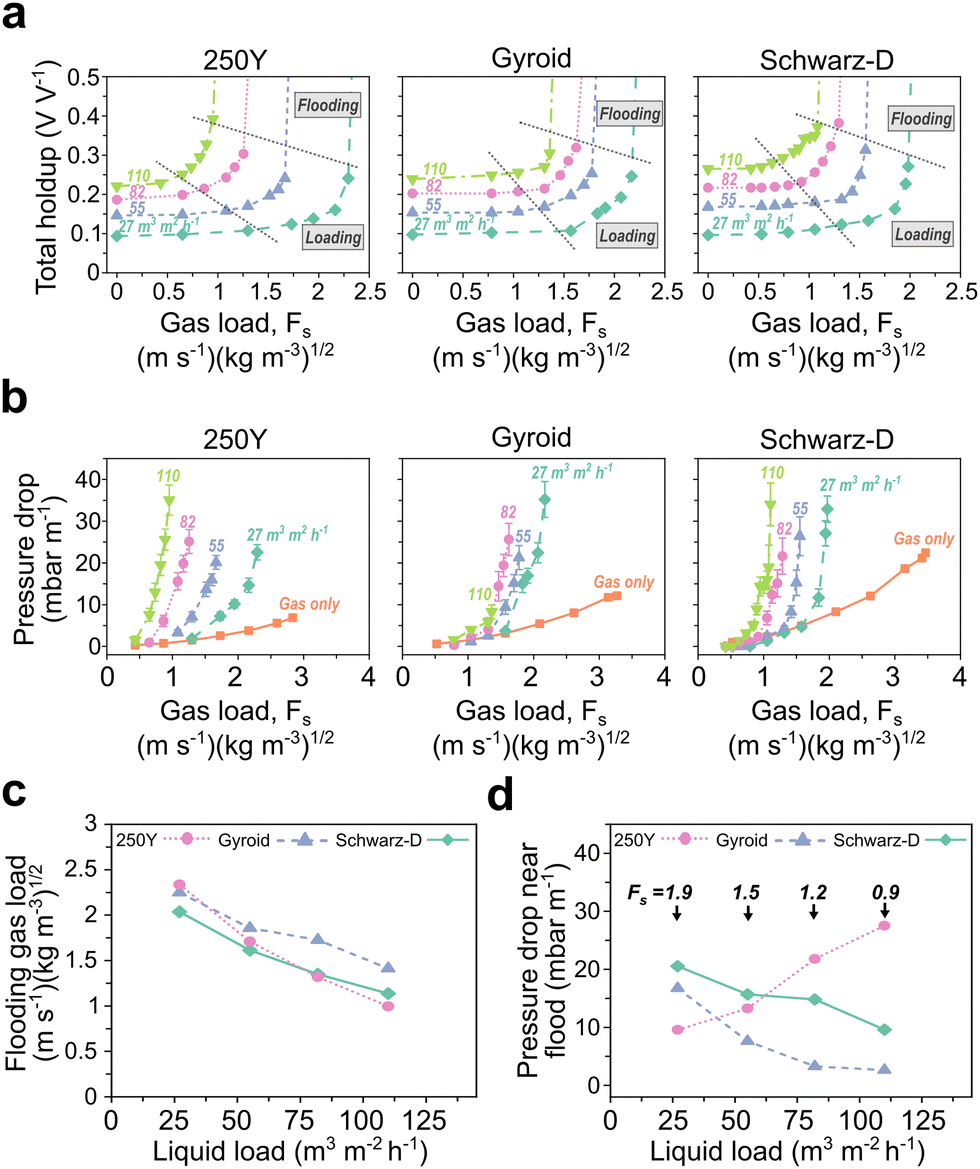 | ||
| Fig. 5 (a) Total liquid holdup data through flooding point as a function of gas load, FS, at four fixed liquid loads for each packing type. Black dotted lines are visual aids to indicate the loading and flooding flow regimes. The liquid load for each holdup curve is labeled above the curve and by color. (b) Gas-phase pressure drop measured during holdup experiments and under single-phase gas-only flow for each packing type. (c) Gas load, FS, at the onset of flooding for a range of liquid loads for each packing type. (d) Gas-phase pressure drop at a gas load taken near the point of flooding for a range of liquid loads. The gas load at which the pressure drop value was taken is labeled above the corresponding data points. | ||
We found that 250Y had the greatest flooding gas load only at the lowest liquid load studied (27 m h−1). At moderate to high liquid loads, Schwarz-D and 250Y had similar maximum gas loads, and the Gyroid packing achieved the greatest gas loads before flooding at relatively high liquid flows (82–110 m h−1) (Fig. 5a). At the highest liquid load tested (110 m h−1), the gas loads at flooding for Gyroid and Schwarz-D were 42% and 14% greater than that of 250Y, respectively. This result was potentially counter-intuitive, as 250Y has a more open and less tortuous structure than Gyroid and Schwarz-D, but we hypothesize that the improved radial flow distribution uncovered in the TPMS packing maldistributions helps mitigate the onset of flooding. While flooding is a complex, multi-phase phenomenon, the TPMS packings appear additionally promising by this crucial packing metric.
Finally, we measured gas-phase pressure drops as functions of gas load during holdup and flooding experiments (Fig. 5b). Results for pressure drop followed a similar trend as those in flooding, where the 250Y packing performed best, i.e. had the lowest pressure drop, with low liquid or single-phase (gas-only) flow. As seen in Fig. 5d, as liquid load increased, the pressure drop near flooding in 250Y steadily increased and met or surpassed those measured in the TPMS packings for the same conditions. To note, this specific result is convoluted by each packing having a different flooding point, so, for example, Gyroid is further from flooding at a liquid load of 110 m h−1 and a gas load of 0.9 m s−1 (kg m−3)1/2 than 250Y. Taken together with the flooding results, the pressure drop data could indicate that the simple vertical flow channels of corrugated 250Y perform well under low to moderate fluid loadings but fail to handle the two-phase countercurrent flow at high fluid loads as well as the periodic structures of Gyroid and Schwarz-D were shown to.
The cross-sectional area of an absorber tower will be determined by the maximum gas load, or linear velocity, achievable with the associated packing. For a fixed gas flow rate, an increased max load allows for a decreased tower cross-section, which helps reduce the absorber CapEx. The major takeaway from these data is that the TPMS packings investigated operate with similar, if not slightly improved, pressure drop and flooding behavior at realistic gas and liquid loads for industrial CO2 absorption as compared to conventional 250Y. This result, together with the improvements in interfacial areas and absorptive fluxes, highlights the potential that the TPMS packing design space has to improve upon legacy packing structures.
Using the straightforward technoeconomic framework for an industrial point-source CO2 absorber utilizing 250Y described by Wang et al,17 we estimated that the TPMS packing performance shown in this work could reduce annualized CapEx by 31%. To determine this, we adjusted the optimized 250Y case from the reference, estimating reduced packing volume and column size from the TPMS kLaeff measured and removing the liquid distributor. The packing and column size constitute 76% of the overall cost, and as such the 33% reduction in packing height and 26% reduction in overall column height yielded an overall cost reduction of 23%. We assumed no change in energy requirement or flooding performance given the similarities in pressure drop and loading (Fig. 5).
A critical assumption in this economic assessment is that advanced structured packings may eventually be manufactured at a cost similar to that of current industrial packings. Of course, this is not yet the case, as the manufacture of stamped sheet packings like 250Y is streamlined and rapid. Industrially relevant 3D printing methods like stereolithography or fused deposition modeling are costly and have fairly slow vertical build rates (current best on the order of 0.5 m h−1).64,65 However, additive manufacturing is being rapidly adopted across industries, and costs are expected to fall as adoption increases. For certain TPMS structures, it may be feasible to manufacture or assemble geometrically identical structures through conventional manufacturing. Ultimately, use of advanced packings with improved performance but increased cost would be an economic and risk consideration, but as additive manufacturing costs fall and further packing improvements are realized, the potential cost benefit will steadily improve.
Finally, we utilized the Integrated Environmental Control Model66 to estimate overall costs of a full-scale amine-based absorber and stripper CCS retrofit for a fossil fired power plant to further contextualize the impact of absorber improvements. With the built-in absorber model utilizing the CanSolv process, we established several simple retrofit scenarios for power generating facilities with nameplate capacities ranging from 75 to 300 MW. In these scenarios, the CO2 absorber (column and internals) are 15–20% of overall annualized CapEx costs for the CCS facility. The potential improvements detailed above amount to a 5–6% reduction in total capital costs which in turn represent a 3–4% saving in overall annualized costs.
There are many potential design manipulations with TPMS geometries, including further optimization of aspects like wall thickness, cell size, structure orientation, and aspect ratio. Feature improvements from conventional packing research like surface roughness may also be incorporated. Continued development of advanced packing structures would also entail more detailed technoeconomic analysis to fully quantify tradeoffs in column height, capital costs, and energy requirements across a range of operating conditions and for various point sources of CO2. Testing with other classical CO2 solvents as well as next-generation solvents like CO2BOLs could further validate the utility of advanced packing geometries described here. The packing performance we demonstrated is an impactful improvement to a very mature technology where gains are typically marginal, and the potential for these packing geometries as a drop-in technology warrants further investigation.
4. Conclusions
In this study, we utilized additive manufacturing to access a new design space for structured packings in CO2 absorbers and established a computational and experimental workflow for next-generation packing design. We compared down-selected TPMS geometries, including Gyroid, Schwarz-D, and Schwarz-P, to conventional Mellapak 250Y structured packing. Low-cost CFD simulations and experimental screening of liquid flow allowed us to target Gyroid and Schwarz-D as geometries of interest. By fitting data from liter-scale point-source absorption experiments to a 1D absorption model, we showed gains of 49–61% in kLaeff and 91–140% in effective gas–liquid interfacial areas in TPMS packings compared to those of 250Y. Simultaneous pressure drop and fluid loading experiments revealed minimal, if any, tradeoffs in maximum fluid loads and column pressure drop in the TPMS packings. For a conventional point-source CO2 capture absorber, these packings could reduce annualized CapEx by 31% and overall costs by 23%. These substantive improvements to a mature technology indicate great potential for drop-in industrial application and motivate further investigation and scaled demonstration of the advanced packings studied here.Author contributions
N. C. E. designed and performed experiments, conducted experimental data analysis and 1D absorber model fitting, and was the primary writing contributor (conceptualization, formal analysis, investigation, methodology, visualization, writing – original draft). J. K. S. and D. T. N. constructed the project scope and aided in experimental design and analysis (funding acquisition, conceptualization, project administration, supervision). D. T. N. aided in preliminary experiments and maldistribution analysis (investigation, visualization). P. R. performed computational fluid dynamics simulations and post-processed the results (investigation, methodology, visualization). T. M. contributed to the 1D absorber model and discussions (methodology). A. E. G. and D. I. O. assisted with simulations, in discussions of manuscript structure, in figure design, and with writing (visualization, methodology, writing – review & editing).Conflicts of interest
There are no conflicts to declare.Acknowledgements
This worked was performed under the auspices of the U.S. Department of Energy by Lawrence Livermore National Laboratory under contract DE-AC52-09NA27344 and within the LDRD program 22-SI-006. Funded was provided by the U.S. Department of Energy Office of Fossil Energy and Carbon Management under FWP-FEW0225. This work has been assigned an LLNL Information Management release number of LLNL-JRNL-836735.References
- Global Warming of 1.5 °C, An IPCC Special Report on the impacts of global warming of 1.5 °C above pre-industrial levels and related global greenhouse gas emission pathways, in the context of strengthening the global response to the threat of climate change, sustainable development, and efforts to eradicate poverty, IPCC, Cambridge University Press, 2018.
- NOAA, P. Tans and R. Keeling, Trends in Atmospheric Carbon Dioxide, https://gml.noaa.gov/ccgg/trends/, (accessed June 28, 2022).
- M. Bui, C. S. Adjiman, A. Bardow, E. J. Anthony, A. Boston, S. Brown, P. S. Fennell, S. Fuss, A. Galindo, L. A. Hackett, J. P. Hallett, H. J. Herzog, G. Jackson, J. Kemper, S. Krevor, G. C. Maitland, M. Matuszewski, I. S. Metcalfe, C. Petit, G. Puxty, J. Reimer, D. M. Reiner, E. S. Rubin, S. A. Scott, N. Shah, B. Smit, J. P. M. Trusler, P. Webley, J. Wilcox and N. M. Dowell, Energy Environ. Sci., 2018, 11, 1062–1176 RSC.
- S. E. Baker, J. K. Stolaroff, G. Peridas, S. H. Pang, H. M. Goldstein, F. R. Lucci, W. Li, E. W. Slessarev, J. Pett-Ridge, F. J. Ryerson, J. L. Wagoner, W. Kirkendell, R. D. Aines, D. L. Sanchez, B. Cabiyo, J. Baker, S. McCoy, S. Uden, R. Runnebaum, J. Wilcox, P. C. Psarras, H. Pilorgé, N. McQueen, D. Maynard and C. McCormick, Getting to Neutral: Options for Negative Carbon Emissions in California, Lawrence Livermore National Laboratory, 2020.
- R. Aines and S. McCoy, The Transition of CCS from Fossil Fuel CO2 Control to Negative Emissions, in CO2 Summit III: Pathways to Carbon Capture, Utilization, and Storage Deployment, ed. J. Wilcox, H. Krutka, S. Liguori and N. Mac Dowell, ECI Symposium Series, 2017 Search PubMed.
- Climate Change 2022: Mitigation of Climate Change Working Group III Contribution to the IPCC Sixth Assessment Report, IPCC, Cambridge University Press, Cambridge, UK and New York, NY, USA, 2022.
- A. A. Olajire, Energy, 2010, 35, 2610–2628 CrossRef CAS.
- Global CCS Institute, Global Status of CCS 2021, 2021.
- G. T. Rochelle, Science, 2009, 325, 1652–1654 CrossRef CAS PubMed.
- G. T. Rochelle, in Absorption-Based Post-combustion Capture of Carbon Dioxide, ed. P. H. M. Feron, Woodhead Publishing, 2016, pp. 35–67 Search PubMed.
- Structured Packings: Energy-efficient, innovative and profitable, Sulzer Chemtech, 2020.
- P. Suess and L. Spiegel, Chem. Eng. Process.: Process Intensif., 1992, 31, 119–124 CrossRef CAS.
- L. Schpigel and W. Meier, Chem. Pet. Eng., 1994, 30, 118–125 CrossRef.
- L. Valenz, F. J. Rejl, J. Šíma and V. Linek, Ind. Eng. Chem. Res., 2011, 50, 12134–12142 CrossRef CAS.
- L. Valenz, F. J. Rejl and V. Linek, Ind. Eng. Chem. Res., 2011, 50, 2262–2271 CrossRef CAS.
- O. M. Basha, R. Wang, I. K. Gamwo, N. S. Siefert and B. I. Morsi, Int. J. Chem. React. Eng., 2020, 18(3) DOI:10.1515/ijcre-2019-0207.
- C. Wang, A. F. Seibert and G. T. Rochelle, Int. J. Greenhouse Gas Control, 2015, 42, 124–131 CrossRef.
- Y. Huang, M. C. Leu, J. Mazumder and A. Donmez, J. Manuf. Sci. Eng., 2015, 137(1), 014001 CrossRef.
- Y. Xiong, P. L. T. Duong, D. Wang, S.-I. Park, Q. Ge, N. Raghavan and D. W. Rosen, J. Mech. Des., 2019, 141(10) DOI:10.1115/1.4043587.
- S. V. Alekseenko, D. M. Markovich, A. R. Evseev, A. V. Bobylev, B. V. Tarasov and V. M. Karsten, Theor. Found. Chem. Eng., 2007, 41, 417–423 CrossRef CAS.
- S. Gerke, H. Leuner and J.-U. Repke, Chem. Eng. Trans., 2018, 69, 1–6 Search PubMed.
- M. Mortazavi, R. Nasr Isfahani, S. Bigham and S. Moghaddam, Energy, 2015, 87, 270–278 CrossRef CAS.
- M. Mortazavi, M. Schmid and S. Moghaddam, Appl. Energy, 2017, 198, 173–179 CrossRef.
- M. Xie, W. Luo and S. R. Gray, Water Res., 2017, 124, 238–243 CrossRef CAS PubMed.
- R. Nasr Isfahani and S. Moghaddam, Int. J. Heat Mass Transfer, 2013, 63, 82–90 CrossRef CAS.
- S. Bigham, D. Yu, D. Chugh and S. Moghaddam, Energy, 2014, 65, 621–630 CrossRef CAS.
- X. Wen, A. Afacan, K. Nandakumar and K. T. Chuang, Chem. Eng. Res. Des., 2005, 83, 515–526 CrossRef CAS.
- H. Weng, J. Luo, Y. Yin, Z. Duan, Y. Sha, L. Ye, S. Tu and Y. Lai, Chem. Eng. Process.: Process Intensif., 2013, 72, 68–73 CrossRef CAS.
- Z. Wang, M. Gupta, S. S. Warudkar, K. R. Cox, G. J. Hirasaki and M. S. Wong, Ind. Eng. Chem. Res., 2016, 55, 1387–1400 CrossRef CAS.
- J. E. Bara, C. I. Hawkins, D. T. Neuberger and S. W. Poppell, Nanomater. Energy, 2013, 2, 235–243 CrossRef CAS.
- C. Fee, S. Nawada and S. Dimartino, J. Chromatogr. A, 2014, 1333, 18–24 CrossRef CAS PubMed.
- Z. He, Y. Chen, J. Yang, C. Tang, J. Lv, Y. Liu, J. Mei, W. Lau and D. Hui, Composites, Part B, 2017, 129, 58–65 CrossRef CAS.
- D. Huerta-Murillo, A. I. Aguilar-Morales, S. Alamri, J. T. Cardoso, R. Jagdheesh, A. F. Lasagni and J. L. Ocaña, Opt. Lasers Eng., 2017, 98, 134–142 CrossRef.
- G. C. Bandara, C. A. Heist and V. T. Remcho, Talanta, 2018, 176, 589–594 CrossRef CAS PubMed.
- J. F. Brennecke and B. E. Gurkan, J. Phys. Chem. Lett., 2010, 1, 3459–3464 CrossRef CAS.
- D. J. Heldebrant, P. K. Koech, V.-A. Glezakou, R. Rousseau, D. Malhotra and D. C. Cantu, Chem. Rev., 2017, 117, 9594–9624 CrossRef CAS PubMed.
- P. Brandl, M. Bui, J. P. Hallett and N. Mac Dowell, Int. J. Greenhouse Gas Control, 2022, 120, 103771 CrossRef CAS.
- H. Karcher, K. Polthier, J. Klinowski and A. L. Mackay, Philos. Trans. R. Soc., A, 1996, 354, 2077–2104 CrossRef.
- W. Fischer, K. Jacek and M. A. Lindsay, Philos. Trans. R. Soc., A, 1996, 354, 2105–2142 CrossRef CAS.
- E. A. Lord and A. L. Mackay, Curr. Sci., 2003, 85, 346–362 Search PubMed.
- T. Femmer, A. J. C. Kuehne and M. Wessling, Chem. Eng. J., 2015, 273, 438–445 CrossRef CAS.
- N. Thomas, N. Sreedhar, O. Al-Ketan, R. Rowshan, R. K. Abu Al-Rub and H. Arafat, Desalination, 2018, 443, 256–271 CrossRef CAS.
- O. Al-Ketan and R. K. Abu Al-Rub, Adv. Eng. Mater., 2019, 21, 1900524 CrossRef.
- L. Han and S. Che, Adv. Mater., 2018, 30, 1705708 CrossRef PubMed.
- J. F. Rejl, V. Linek, T. Moucha and L. Valenz, Chem. Eng. Res. Des., 2009, 87, 695–704 CrossRef CAS.
- C. W. Fitz, D. W. King and J. G. Kunesh, Chem. Eng. Res. Des., 1999, 77, 482–486 CrossRef CAS.
- D. P. Edwards, K. R. Krishnamurthy and R. W. Potthoff, Chem. Eng. Res. Des., 1999, 77, 656–662 CrossRef CAS.
- Ž. Olujić, R. Van Baak, J. Haaring, B. Kaibel and H. Jansen, Chem. Eng. Res. Des., 2006, 84, 867–874 CrossRef.
- M. Fourati, V. Roig and L. Raynal, Chem. Eng. Sci., 2012, 80, 1–15 CrossRef CAS.
- P. M. Dixon, Encyclopedia of Environmetrics, John Wiley & Sons, Ltd, 2013 Search PubMed.
- M. Amgad, A. Itoh and M. M. K. Tsui, PLoS One, 2015, 10, e0144404 CrossRef PubMed.
- R. M. Wellek, R. J. Brunson and F. H. Law, Can. J. Chem. Eng., 1978, 56, 181–186 CrossRef CAS.
- L. Kucka, E. Y. Kenig and A. Górak, Ind. Eng. Chem. Res., 2002, 41, 5952–5957 CrossRef CAS.
- H. G. Weller, G. Tabor, H. Jasak and C. Fureby, Comput. Phys., 1998, 12, 620–631 CrossRef.
- J. U. Brackbill, D. B. Kothe and C. Zemach, J. Comput. Phys., 1992, 100, 335–354 CrossRef CAS.
- J. Iyer, T. Moore, D. Nguyen, P. Roy and J. Stolaroff, Appl. Therm. Eng., 2022, 209, 118192 CrossRef.
- J. P. Kelly, L. R. Finkenauer, P. Roy, J. K. Stolaroff, D. T. Nguyen, M. S. Ross, A. T. Hoff and J. J. Haslam, Addit. Manuf., 2022, 56, 102937 CAS.
- T. Femmer, A. J. C. Kuehne, J. Torres-Rendon, A. Walther and M. Wessling, J. Membr. Sci., 2015, 478, 12–18 CrossRef CAS.
- F. Hesselmann, N. Scherenberg, P. Bongartz, S. Djeljadini, M. Wessling, C. Cornelissen, T. Schmitz-Rode, U. Steinseifer, S. V. Jansen and J. Arens, J. Membr. Sci., 2021, 634, 119371 CrossRef CAS.
- M. J. Lockett and J. F. Billingham, Chem. Eng. Res. Des., 2003, 81, 131–135 CrossRef CAS.
- T. Turányi, J. Math. Chem., 1990, 5, 203–248 CrossRef.
- R. E. Tsai, A. F. Seibert, R. B. Eldridge and G. T. Rochelle, AIChE J., 2011, 57, 1173–1184 CrossRef CAS.
- R. K. Singh, Y. Fu, C. Zeng, D. T. Nguyen, P. Roy, J. Bao, Z. Xu and G. Panagakos, Chem. Eng. J., 2022, 450, 138124 CrossRef CAS.
- M. A. Sarabia-Vallejos, F. E. Rodríguez-Umanzor, C. M. González-Henríquez and J. Rodríguez-Hernández, Polymers, 2022, 14, 1351 CrossRef CAS PubMed.
- D. A. Walker, J. L. Hedrick and C. A. Mirkin, Science, 2019, 366, 360–364 CrossRef CAS PubMed.
- University of Wyoming and National Energy Technology Laboratory, Integrated Environmental Control Model, https://www.uwyo.edu/iecm/index.html, (accessed August 12, 2021).
Footnote |
| † Electronic supplementary information (ESI) available: TPMS examples; maldistribution quantification; flow visualization videos; absorber operation data; model fitting details and sensitivity; resin stability. See DOI: https://doi.org/10.1039/d2ee03658d |
| This journal is © The Royal Society of Chemistry 2023 |