 Open Access Article
Creative Commons Attribution 3.0 Unported Licence
Heterogeneous chemistry of methyl ethyl ketone on mineral oxide surfaces: impacts of relative humidity and nitrogen dioxide on product formation†
Eshani
Hettiarachchi
 and
Vicki H.
Grassian
 *
*
Department of Chemistry and Biochemistry, University of California San Diego, 9500 Gilman Drive, La Jolla, California 92093, USA. E-mail: vhgrassian@ucsd.edu
First published on 30th March 2023
Abstract
Despite their atmospheric abundance, heterogeneous and multiphase reactions of carbonyl compounds are poorly understood. In this study, we investigate the surface adsorption and surface chemistry of methyl ethyl ketone (MEK), the second most abundant ketone in the atmosphere, with several mineral oxide surfaces including SiO2, α-Fe2O3 and TiO2. In particular, the chemistry of MEK with these common components of mineral dust, under both dry and high relative humidity (RH%) conditions, has been investigated. Furthermore, reactions of adsorbed MEK with gas-phase NO2 were also examined. We show that MEK molecularly and reversibly adsorbs on SiO2 whereas irreversible adsorption occurs on both α-Fe2O3 and TiO2 surfaces, followed by the formation of higher molar mass species resulting from dimerization and oligomerization reactions. Isotope labeling experiments confirmed the incorporation of H atoms from surface hydroxyl groups and strongly adsorbed water into these oligomer products. Most interesting is that at 80% RH, oligomer formation on α-Fe2O3 shifts toward a higher relative abundance of MEK tetramer relative to the dimer while on TiO2 there was no change in product distribution. In the presence of gas-phase NO2, MEK undergoes degradation to formaldehyde and acetaldehyde, followed by the formation of aldol condensation products of these aldehydes on the α-Fe2O3 surface. Overall, this study provides mechanistic insights on mineralogy-specific heterogeneous chemistry of a prevalent and atmospherically abundant ketone.
Environmental significanceMethyl ethyl ketone (MEK) is the second most abundant ketone in the atmosphere and an important precursor of secondary organic aerosols. Currently its reactions with primary pollutant gases and water vapor in the presence of mineral surfaces are poorly understood. Heterogeneous reactions of MEK on mineral oxide surfaces show a range of products that form on the surface in the presence of water and nitrogen dioxide and the product distribution changes. Eighteen different compounds are found suggesting multiple mechanisms by which MEK can interact with these surfaces. These results improve our understanding of heterogeneous chemistry of mineral dust aerosols and, in particular, reactions of carbonyl compounds on mineral surfaces. |
1 Introduction
Secondary organic aerosols (SOAs) form a significant fraction of atmospheric particulate matter (PM) and play important roles in climate change, air quality, and human health.1–5 Atmospheric carbonyl compounds are the major constituents of SOAs.6–9 Low molar mass carbonyl compounds such as acetone and methyl ethyl ketone (MEK) are primary precursors contributing to numerous oxygenated SOAs.9 For example, polymers formed from small carbonyls are a major component of organic aerosols.10 Gas-phase photochemical reactions with atmospheric oxidants such as hydroxyl radicals and ozone are considered to be the major reaction pathways for carbonyl compounds due to their higher volatility.6,9,11,12 Furthermore, some carbonyl compounds such as glyoxal are precursors for Brown Carbon (BrC) formation.13–17 Despite the abundance of carbonyl compounds in the atmosphere, for the most part, heterogeneous and multiphase reactions of these compounds on mineral surfaces were considered insignificant due to their volatility.12MEK is the second most abundant atmospheric carbonyl compound after acetone,11,18 with a typical mixing ratio of 0.03–4 ppb.19 MEK is emitted via both biogenic and anthropogenic sources. Biogenic sources include direct emissions such as biomass burning and from the terrestrial biosphere, including but not limited to dry plant matter, plant roots, and bacteria.19–24 MEK is directly emitted from certain anthropogenic sources such as solvent evaporation, vehicle exhaust,19,25–28 and secondary production from the oxidation of anthropogenic alkanes.11,29,30 Although MEK has been detected alongside other volatile organic compounds (VOCs), atmospheric MEK has received little attention19 and there are few studies of its heterogeneous reactions on aerosol surfaces.31–34 Although unrelated to atmospheric chemistry, some studies on MEK adsorption on photocatalysts such as TiO2 have found, and in the absence of light, the MEK adsorption correlates with the surface area of the catalyst.35 In the gas phase, MEK reacts with hydroxyl radicals to form acetaldehyde and formaldehyde.19 These carbonyl compounds although have long been considered insignificant contributors to aerosol mass due to their higher volatility, recent studies conducted with formaldehyde and glyoxal suggest otherwise.36–39 In particular, the hydration of carbonyl compounds, e.g. acetone, glyoxal, and formaldehyde, and subsequent heterogeneous chemistry, including oligomerization, dehydration, and aldol condensation, have been previously observed.31–34,38,40 In previous studies with metal oxide surfaces,31,32 the adsorption, chemistry and photochemistry of small carbonyl compounds have been investigated to understand heterogeneous chemistry. In the current study, we extend this aspect further to identify the products formed on these surfaces and investigate the detailed mechanism via isotope labeling experiments. Moreover, different from previous studies, the current effort focuses on the heterogeneous and multiphase chemistry of small carbonyl compounds on metal oxide surfaces, instead of salts such as ammonium sulfate aerosol particles.33,34 In the presence of NOx in the gas phase, MEK can lead to peroxyacetyl nitrate and ozone formation.41,42 However, MEK reactions with trace gases such as NO2 on mineral aerosol surfaces remain unknown.
In this study, the surface adsorption and surface reactions of MEK on mineral oxide surfaces, SiO2, α-Fe2O3, and TiO2 were investigated. SiO2 is a major component in mineral dust, yet relatively inert, whereas α-Fe2O3 and TiO2 are more reactive components.43 MEK can adsorb onto and undergo heterogeneous reactions on these mineral surfaces. Furthermore, given the importance of water vapor in atmospheric reactions,44 MEK adsorption on mineral surfaces under both dry and high relative humidity (RH) conditions was considered as well as the reactions of adsorbed-MEK with NO2. NO2 is found in the atmosphere, primarily emitted via fossil fuel combustion and vehicle exhausts,45,46 and due to the higher correlation of atmospheric NO2 concentrations to traffic, it is used as a traffic-related air pollution marker.46 Therefore, interactions between MEK with mineral dust and NO2 during dust transport and urban dust episodes can facilitate the formation of a range of oxygenated SOAs as discussed in detail here.
Most interesting, and discussed in more detail below, despite suggestions that small carbonyl compounds are too volatile to be significantly involved in heterogeneous chemistry leading to SOA formation, is that this study provides insights into the formation of a range of SOAs from MEK on mineral surfaces that can occur. Both Fourier transform infrared (FTIR) spectroscopy as an in situ probe of product formation and high-resolution mass spectrometry (HRMS) of solvent-extracted products were used to unravel the complex heterogeneous chemistry occurring on mineral dust surfaces.
2 Materials and methods
2.1 Transmission FTIR spectroscopy and methods
Transmission FTIR spectroscopy was used to monitor reactions on oxide surfaces at 296 ± 1 K. Additional details of the infrared cell and gas handling system have been previously described.47–52 Oxide particles (SiO2, Aerosil OX50, α-Fe2O3, hematite, 99+%, Fischer Scientific, and TiO2, rutile, Sigma Aldrich) with a BET surface area of 30 + 1 m2 g−1, 80 + 10 m2 g−1, and 31 + 4 m2 g−1, respectively, were heated in an oven at 473 ± 1 K overnight to remove organic contaminants and then pressed onto one half of a tungsten grid (ca. 5 mg). The grid was then placed in the sample IR cell compartment, held by two stainless steel jaws. Following the preparation of the mineral sample and placement in the IR cell, the system was evacuated for 4 h using a turbomolecular pump. SiO2 was further heated once pressed to the tungsten grid. α-Fe2O3 and TiO2 surfaces were subsequently exposed to 50% RH water vapor for 2 h to ensure a fully hydroxylated terminated surface. Once hydroxylated, the system was evacuated for another 6 h to remove water vapor in the chamber. SiO2 surfaces were not subjected to hydroxylation, as the surfaces have strong signals arising from silanol groups. The MEK adsorption mechanisms on α-Fe2O3 and TiO2 surfaces were explored using deuterated water vapor in the surface hydroxylation step above. In particular, 10–20 Torr of D2O (Sigma Aldrich, 99.9%) degassed via several cycles of the freeze–thaw–pump method was introduced into the IR cell loaded with either an α-Fe2O3 or TiO2 surface for 30 min followed by evacuation. The process was repeated until the surface is fully deuteroxylated.53,54After evacuation, the surface was exposed to the desired pressure of methyl ethyl ketone (MEK, 2-butanone, 99%, Sigma Aldrich) for 20 min under dry conditions (RH < 1%). The MEK sample was degassed at least three times with consecutive freeze–pump–thaw cycles prior to use. Then, in order to understand the impact of RH% on the adsorption of MEK on mineral surfaces, in a different set of experiments, 20 mTorr of MEK was introduced into the IR cell and allowed adsorption for 30 min. Then, the RH% inside the IR cell was brought to 80% by introducing water vapor and the reactions were monitored over 4 h. Following the adsorption, the surfaces were evacuated overnight. Similarly, the reactions of MEK with NO2 on mineral surfaces were studied by introducing 5 mTorr of NO2 (2 ppm in N2, Airgas) into the IR cell after allowing 20 mTorr of MEK adsorption on mineral surfaces. Here, the reactions were monitored over 4 h, and the surfaces were evacuated overnight following the adsorption. Relatively higher concentrations of reactants compared to their atmospheric concentrations were used in this study to determine the feasibility of these types of reactions. Additionally, mass spectrometric analysis of surface products required these higher concentrations for definitive confirmation.
Prior to and following the exposure to gases, single-beam spectra (250 scans) of the surface and gas phase were acquired using a resolution of 4 cm−1 and covering the spectral range of 600 to 4000 cm−1. This was accomplished by the use of a linear translator with the infrared beam interrogating the portion of the grid pressed with mineral particles followed by the portion of the grid left blank. Absorption spectra on mineral particles are reported as the difference in the mineral spectra before and after exposure to gases. Absorption bands due to gas-phase components, as measured through the blank half of the tungsten grid under identical conditions, were subtracted to obtain the FTIR spectra of adsorbed species only.
2.2 High-resolution mass spectrometry
Organic products formed on mineral surfaces following the adsorption of MEK, and subsequent reactions with NO2, were analyzed using a direct-injection linear ion trap (Thermo Fisher Orbitrap) high-resolution mass spectrometer (HRMS). Additional experiments with ∼5 mg of two authentic dust samples, Arizona Test Dust (AZTD, Powder Technologies) and Gobi Dust (NIES, Japan),55 were conducted by exposing them to 20 mTorr MEK for 30 min followed by evacuation. Adsorbed products were extracted from the solid substrate using methanol (CH3OH, Fisher Scientific, HPLC grade) as the solvent. Methanol was chosen as the solvent as it produced the best signal for MEK standards. The sample vial, syringe, and all other glassware used in the transfer process were cleaned prior to use with methanol, and Milli-Q water (Millipore Sigma, 18.2 MΩ), and baked in an oven at 773 ± 1 K to further remove trace organics. Plastic vials used in sample preparation were sonicated in methanol for 60 min and washed thoroughly prior to use. All of the samples were stored at 253 ± 1 K and analyzed within 48 h of collection. Product stability was tested for up to 40 days under the freeze storage conditions used. It was determined that no transformations of products occurred.HRMS analysis in both positive electrospray ionization (ESI) ([M + H]+ and [M + Na]+) and negative ESI modes ([M![[thin space (1/6-em)]](https://www.rsc.org/images/entities/char_2009.gif) −
−![[thin space (1/6-em)]](https://www.rsc.org/images/entities/char_2009.gif) H]) was used; however, structure elucidation was conducted with positive ESI mode data. The heated electrospray ionization (HESI) source was operated at 373.15 K. The ESI capillary was set to a voltage of 3.5 kV at 623.15 K. The HESI-Orbitrap MS was calibrated prior to use. Mass spectra were acquired with a mass range of 50–2000 Da. Peaks with a mass tolerance of > 5 ppm were rejected. Unconfirmed minor products (low intensity) are not reported. Compositions were calculated with the following element ranges: 12C, 0–60; 1H, 0–150; 2H, 0–50; 16O, 0–25; 14N, 0–3; 23Na, 0–5; 39K, 0–5; 56Fe, 0–5; 28Si, 0–5; 48Ti, 0–5. Tandem mass spectrometry (MS/MS) with a collision energy of 40 eV was used for structure determination.
H]) was used; however, structure elucidation was conducted with positive ESI mode data. The heated electrospray ionization (HESI) source was operated at 373.15 K. The ESI capillary was set to a voltage of 3.5 kV at 623.15 K. The HESI-Orbitrap MS was calibrated prior to use. Mass spectra were acquired with a mass range of 50–2000 Da. Peaks with a mass tolerance of > 5 ppm were rejected. Unconfirmed minor products (low intensity) are not reported. Compositions were calculated with the following element ranges: 12C, 0–60; 1H, 0–150; 2H, 0–50; 16O, 0–25; 14N, 0–3; 23Na, 0–5; 39K, 0–5; 56Fe, 0–5; 28Si, 0–5; 48Ti, 0–5. Tandem mass spectrometry (MS/MS) with a collision energy of 40 eV was used for structure determination.
3 Results and discussion
3.1 MEK adsorption and oligomerization on oxide surfaces
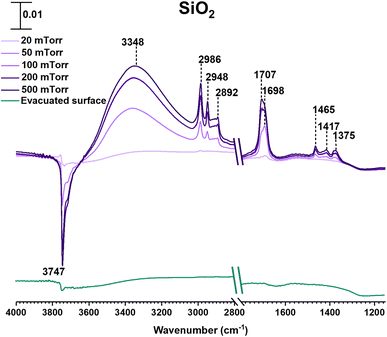
SiO2 surfaces exposed to gas-phase MEK at various pressures under dry conditions show new spectral features due to surface adsorption as seen in Fig. 1. Most notable are the infrared absorption bands in the regions extending from 2800 to 4000 cm−1 and 1150 to 1800 cm−1. The bands between 2800 and 3000 cm−1 were assigned to C–H stretching vibrations and those between 1300 and 1500 cm−1 were assigned to C–H bending modes (Table 1).56 The adsorbed carbonyl group on SiO2 surfaces is observed at 1698 cm−1 and 1707 cm−1 indicating multilayer adsorption. Moreover, the carbonyl group of MEK interacts with silanol groups via H-bond formation. At relatively lower MEK pressures, the peak at 1698 cm−1 is stronger, whereas, at higher MEK pressures, the peak at 1707 cm−1 supersedes as adsorbed layers farther away from the surface have more gas-phase-like characteristics. These frequencies observed for the absorption bands found for adsorbed MEK correspond fairly closely to its gas-phase vibrational frequencies indicating that MEK is molecularly adsorbed onto SiO2 surfaces.57 The Gas-Phase-MEK FTIR spectrum is provided in ESI Fig. S1.†| Vibrational mode | Peak assignment | ||
|---|---|---|---|
| SiO2 | α-Fe2O3 | TiO2 | |
| Loss of isolated silanol groups | 3747 | — | — |
| Loss of surface hydroxyl groups | — | 3670, 3620 | — |
| Hydrogen bond network formation | 3348 | — | — |
| C–H bond stretching vibrations | 2986, 2948, 2892 | 2971, 2941, 2910, 2883, 2855 | 2970, 2939, 2888 |
C![[double bond, length as m-dash]](https://www.rsc.org/images/entities/char_e001.gif) O bond stretching O bond stretching |
1698,1701 | 1683 | 1690 |
| Adsorbed water, bending vibration | — | 1635 | 1648 |
C![[double bond, length as m-dash]](https://www.rsc.org/images/entities/char_e001.gif) C bond stretching of an alpha-beta unsaturated ketone, and other conjugated systems C bond stretching of an alpha-beta unsaturated ketone, and other conjugated systems |
— | 1615, 1568 | 1580 |
| C–H bond bending vibrations | 1465, 1417, 1375 | 1464, 1410, 1381, 1367, 1340 | 1461, 1408, 1390, 1364 |
| C–O bond stretching vibrations, particularly of alcohols | — | 1281, 1242, 1202, 1175 | 1264, 1184 |
A loss at 3747 cm−1 suggests that isolated silanol groups on the silica surface are interacting via hydrogen bonding with MEK molecules.58,59 Furthermore, a band for the hydrogen bond between MEK and the silanol group appears with an absorption maximum at 3348 cm−1. Upon evacuating overnight, almost all of the adsorbed MEK is removed, thus suggesting reversible adsorption of MEK on SiO2 surfaces. Additionally, HRMS analysis of samples extracted from MEK-treated surfaces while outside the acceptable mass tolerance limits detected only a minor quantity of residual MEK (C4H8ONa, m/z 95.05) in positive ESI mode. No MEK derivatives were confirmed during the HRMS analysis. This indicates that adsorbed MEK does not transform into other compounds on SiO2 under dark and dry conditions. The HRMS pattern for the MEK standard in methanol is provided in Fig. S2.† Briefly, at lower MEK standard concentrations (70 ppm), the sodated MEK monomer was observed at m/z = 95.05 for C4H8Ona, whereas, at higher MEK concentrations (1000 ppm), a sodated MEK ‘dimer’ was identified at m/z = 167.10. MS/MS fragmentation of this peak produced one major fragment at 95.05 suggesting cluster formation during chemical ionization (Table S1†).60 However, no other MEK clusters/‘oligomers’ were observed in the 1000 ppm MEK standard during HRMS analysis (Fig. S2†).
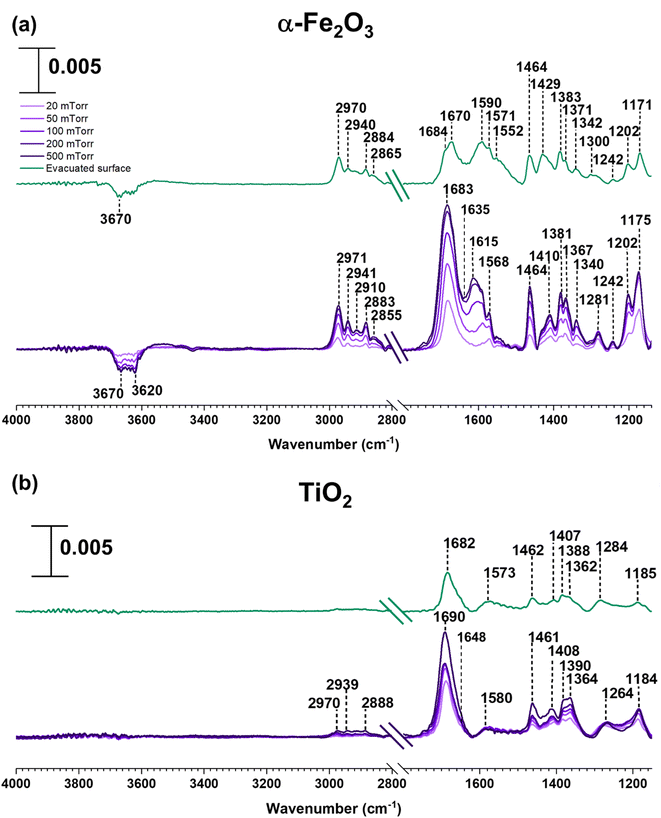
In contrast to SiO2 surfaces, MEK-exposed α-Fe2O3 surfaces show the appearance of additional spectral features suggesting the transformation of MEK to other adsorbed species on the surface (Fig. 2). These features include the shifting of the carbonyl peak to 1683 cm−1 along with the appearance of new peaks around 1615 and 1568 cm−1 (consistent with C![[double bond, length as m-dash]](https://www.rsc.org/images/entities/char_e001.gif) C stretching vibrations).31,32,56,62 These spectral features indicate the formation of alpha-beta unsaturated ketones and conjugated compounds on the α-Fe2O3 surface. Furthermore, peaks in the spectral region from 1150 to 1290 cm−1 for C–O bond vibrations indicate the formation of alcohol groups. Unlike on SiO2 surfaces, it is important to note the formation of water as indicated by the presence of the adsorbed water bending vibration at ∼1635 cm−1.51,56 MEK-exposed TiO2 surfaces show similar spectral features. While a shoulder at ∼1648 cm−1 appears suggesting the presence of adsorbed water, on TiO2 surfaces, the feature is not as prominent as on α-Fe2O3 surfaces. The adsorbed organic species were extracted in methanol and were further analyzed using HRMS for the identification and structure elucidation of the products formed. MS/MS was performed for identified compounds to confirm their structures. The full list of these fragmentation patterns is provided in Table S1†. Moreover, when assigning C
C stretching vibrations).31,32,56,62 These spectral features indicate the formation of alpha-beta unsaturated ketones and conjugated compounds on the α-Fe2O3 surface. Furthermore, peaks in the spectral region from 1150 to 1290 cm−1 for C–O bond vibrations indicate the formation of alcohol groups. Unlike on SiO2 surfaces, it is important to note the formation of water as indicated by the presence of the adsorbed water bending vibration at ∼1635 cm−1.51,56 MEK-exposed TiO2 surfaces show similar spectral features. While a shoulder at ∼1648 cm−1 appears suggesting the presence of adsorbed water, on TiO2 surfaces, the feature is not as prominent as on α-Fe2O3 surfaces. The adsorbed organic species were extracted in methanol and were further analyzed using HRMS for the identification and structure elucidation of the products formed. MS/MS was performed for identified compounds to confirm their structures. The full list of these fragmentation patterns is provided in Table S1†. Moreover, when assigning C![[double bond, length as m-dash]](https://www.rsc.org/images/entities/char_e001.gif) C bonds to these structures, particularly for dehydration products, overall theoretical stability due to extended conjugation and MS/MS fragmentation patterns were considered. The stereochemistry of molecules was not taken into account with these structural assignments.
C bonds to these structures, particularly for dehydration products, overall theoretical stability due to extended conjugation and MS/MS fragmentation patterns were considered. The stereochemistry of molecules was not taken into account with these structural assignments.
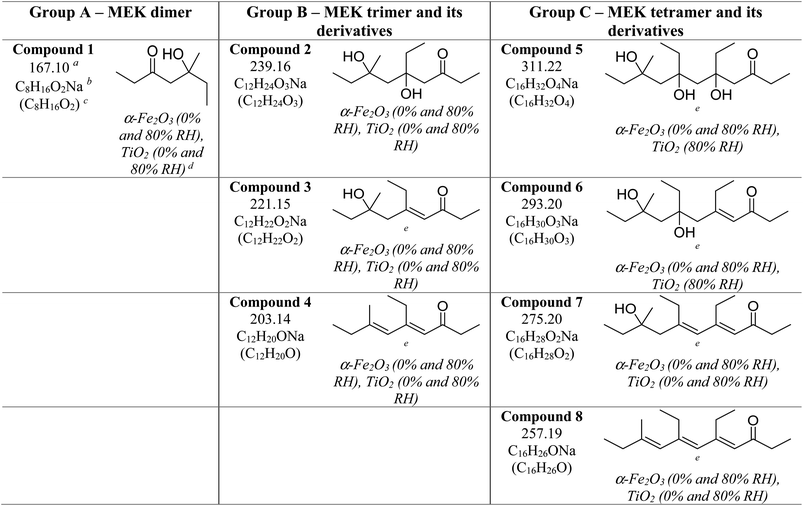
Three groups of oligomers were identified on both α-Fe2O3 and TiO2 surfaces (Fig. 3 and Table 2). These oligomer groups are Group A: MEK dimer, Group B: MEK trimer and its derivatives (dehydration products), and Group C: MEK tetramer and its derivatives (dehydration products). For both α-Fe2O3 and TiO2 surfaces, a MEK dimer (Compound 1, C8H16O2Na, m/z = 167.10) was observed with the highest relative abundance. However, a dehydrated product of MEK dimer was not observed. This differs from acetone adsorption on TiO2, in which mesityl oxide, a dehydration product of acetone aldol-condensation reaction, was observed.32 MS/MS analysis of the m/z peak at 167.10 produced major fragments at m/z = 95.05 for C4H8ONa and 138.03 for C6H11O2Na. Another fragment was identified at m/z = 127.11 for C8H15O, for water loss during MS/MS analysis, which supports the presence of an OH group that is eliminated as water. The MS/MS fragmentation pattern of m/z = 167.10 for solvent-extracted samples is particularly different from that of high-concentration MEK standard samples (1000 ppm) where one fragment at m/z = 95.05 for the MEK monomer was observed (Fig. S2† and Table S1†). This indicates that at higher concentrations, the standard sample produced a ‘dimer’ under MS conditions, commonly known as cluster formation,60 while on surfaces, a dimer is formed from surface reactions with the structure of compound 1.
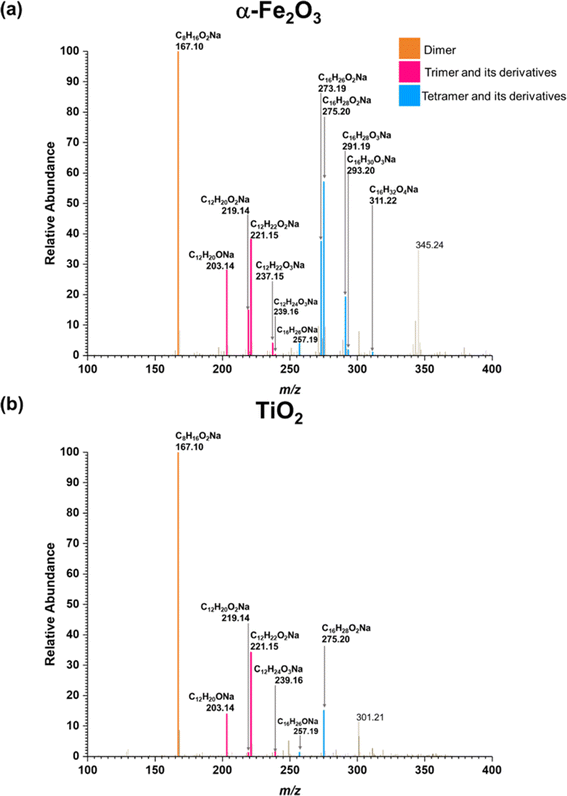 | ||
| Fig. 3 HRMS patterns of surface products formed upon adsorption of MEK on (a) α-Fe2O3 and (b) TiO2 under dry conditions. | ||
Additionally, a MEK trimer (Compound 2, C12H24O3Na, m/z = 239.16) and two dehydration products (Compound 3, C12H22O2Na, m/z = 221.15 and Compound 4, C12H20ONa, m/z = 203.14) were identified on both α-Fe2O3 and TiO2 surfaces, along with their fragments. The MS/MS analysis of the peak at m/z = 239.10 produced a fragment at 221.15 for C12H22O2Na, whereas the fragmentation of the peak at m/z = 221.15 produced several different fragments notably at m/z = 95.05 (MEK monomer unit), 203.14 (C12H20ONa) and, 151.07 (C7H12O2Na). The evidence of forming a MEK tetramer and its dehydration products was observed on both α-Fe2O3 and TiO2 surfaces. On α-Fe2O3 surfaces, four different compounds, namely, MEK tetramer (Compound 5, C16H32O4Na, m/z = 311.22), Compound 6 (C16H30O3Na, m/z = 293.20), Compound 7 (C16H28O2Na, m/z = 275.20), and Compound 8 (C16H26ONa, m/z = 257.19), were observed with a higher relative abundance than group B compounds. However, on TiO2 surfaces, only Compounds 7 and 8 were observed with a lower relative abundance than group B compounds. This indicates that the tetramer formation is favored on α-Fe2O3 surfaces over TiO2 underscoring the role of specific mineral surfaces in the oligomerization of MEK. Such carbonyl compound oligomerization has previously been observed with pinonaldehyde on acidic aerosols such as mixtures of (NH4)2SO4 and H2SO4.63 Furthermore, these HRMS data are complemented by the FTIR spectra produced by the adsorption of MEK on these oxide surfaces, in which the spectral features show the formation of conjugated carbonyl systems and alcohol groups. Furthermore, HRMS analysis of surface products with varying MEK initial pressures in the range used in this study shows no change in oligomer distribution. Additionally, adsorbed water observed in part is due to the dehydration of MEK oligomers formed on surfaces. Numerous laboratory and field observations indicate the formation of various oligomers of smaller atmospheric carbonyls and their derivatives. However, most of these studies are limited to photochemical and/or aqueous phase conditions,40,64–66 while a limited understanding exists for small carbonyl-oligomerization in multiphase chemistry.12,31,32,38 Thus, our study provides new evidence on mineral-specific heterogeneous reactions of MEK.
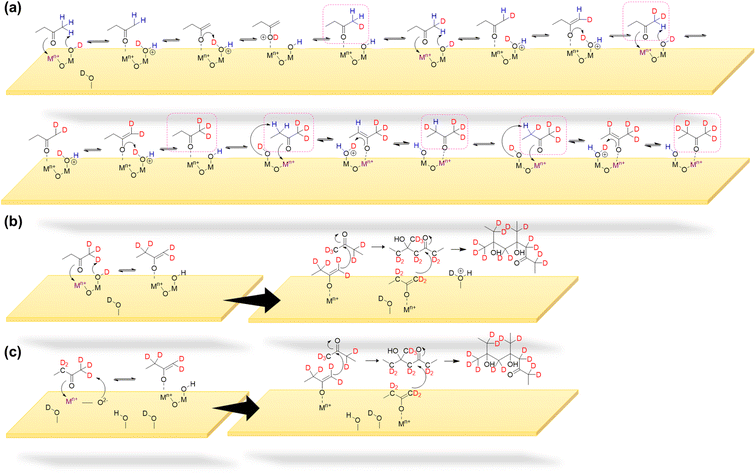
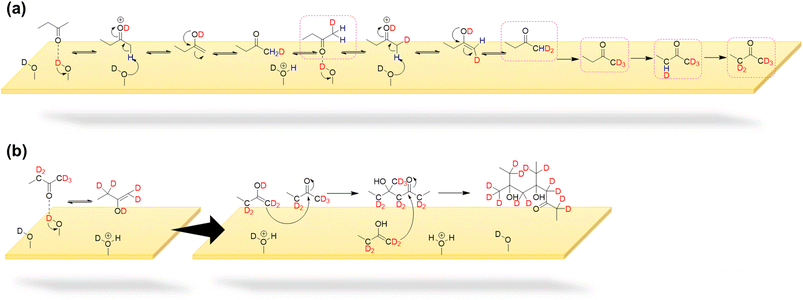
The formation of a series of oligomers on α-Fe2O3 and TiO2 surfaces can be explained by surface-mediated keto–enol tautomerism (KET) followed by aldol condensation of MEK67 (Schemes 1 and 2). The oligomerization can occur via two reaction pathways. Both α-Fe2O3 and TiO2 surfaces are known to contain surface hydroxyl groups. MEK may strongly adsorb onto Lewis acid sites (Fe3+ or Ti4+) and reduced defect sites (Fe2+ or Ti3+) on oxide surfaces followed by the formation of a surface–enolate complex.31,32,61,68 This is followed by abstraction of a proton from MEK (α-H) by either surface oxygen atoms or surface hydroxyl groups. The interaction of MEK with surface O–H groups is suggested by the FTIR data as a loss of surface O–H groups (3620 and 3670 cm−1) from α-Fe2O3 is seen. A similar aldol-condensation mechanism has previously been proposed with acetone by other investigators on oxide surfaces with acidic or basic properties such as TiO2, α-Fe2O3, and α-Al2O3.31,32,62
The MEK dimer and oligomer formation mechanisms on mineral oxide surfaces were explored using fully deuteroxylated α-Fe2O3 and TiO2 surfaces. Surface deuteroxylation was conducted by exposing surfaces to ∼10 Torr of D2O repeatedly until complete surface deuteroxylation is achieved.53,54 Then, 100 mTorr of MEK was exposed to the deuteroxylated α-Fe2O3 or TiO2 surface for over 4 h followed by overnight evacuation (Fig. S3† and Table S2†). Upon exposure to MEK, loss of O-D groups on α-Fe2O3 surfaces is seen around 2708 and 2672 cm−1 due to their interaction with MEK whereas new spectral features appeared around 2600 cm−1 suggesting the formation of an OD, H-bond network. Furthermore, spectral features corresponding to C–D bond formation were observed from 2119–2500 cm−1. Additionally, a smaller peak around 3620 cm−1 begun to appear along with the evidence of OH and H-bond formation at ∼3458 cm−1. FTIR spectra indicate that surface originated deuterium atoms get incorporated with surface products formed while MEK originated H atoms get incorporated with the surface, forming surface hydroxyl groups. For deuteroxylated TiO2 spectra, some spectral features corresponding to the loss of surface O-D groups were seen whereas no significant changes were observed around ∼3600 cm−1 corresponding to surface O–H groups. Adsorbed species extracted to methanol was analyzed via HRMS for deuterated products of MEK dimer and oligomers (Fig. S4† and Table S3†).
As shown in Scheme 1a & b on mineral surfaces, surface hydroxyl/deuteroxyl groups were protonated by a methyl hydrogen from MEK, thereby producing surface-adsorbed water molecules. Thus, this mechanistic pathway suggests another source of surface-adsorbed water seen in the FTIR spectra (bending mode of water at 1635 cm−1 on α-Fe2O3 and 1648 cm−1 on TiO2). In isotope labeling experiments, deuterated products of MEK dimer and oligomers were observed in HRMS analysis for both surfaces, confirming the exchange of surface hydrogens from hydroxyl groups to the products formed on surfaces (Fig. S4 and S5†). Furthermore, for α-Fe2O3 surfaces, during enolate formation, most α-H of MEK is exchanged with deuterium atoms from surface deuteroxyl groups indicating the constant proton-exchange nature between the enolate and the surface. This is further complimented by the appearance of FTIR spectral features for surface OH groups on deuterated α-Fe2O3 surfaces upon exposure to MEK (Fig. S3†). For TiO2 surfaces, while deuterated oligomers were observed, the products with higher deuteration were observed with a lower intensity. For example, for α-Fe2O3 surfaces, C8H9D7O2 was observed with the highest intensity for the deuterated MEK dimer group (Fig. S4†), whereas for TiO2 surfaces, C8H11D5O2 was observed with the highest intensity for the same group. This trend with a higher degree of deuteration was seen among the other oligomer groups observed on α-Fe2O3 surfaces compared to that of TiO2 surfaces (Table S3†). This higher degree of deuteration may correspond to higher surface hydroxyl group density on α-Fe2O3 surfaces than TiO2 as observed in FTIR spectra. For the deuterated MEK dimer, for both α-Fe2O3 and TiO2 surfaces, no more than 9 deuterium atoms were observed suggesting that the deuteration of the MEK molecule can occur prior to dimerization (Scheme 1a, Fig. S4, S5 and Table S3†). Once the surface-adsorbed MEK-enolate-complex is formed, it self-condensates with another MEK molecule to form a MEK dimer, or cross-condensates with another MEK dimer (or oligomer) to form either a MEK trimer or a tetramer.
A surface-adsorbed enolate complex forms via H abstraction by surface oxygen sites resulting in a similar aldol-condensation pathway (Scheme 1c)61 which makes this reaction pathway also possible. The highest relative abundance of MEK dimer observed suggests that the formation of trimers and tetramers may be challenging due to the surface-adsorbed nature of the enolate complex. In these schemes, the abstraction of a methyl H is considered, although the abstraction of α-H from the ethyl group of MEK may form a more stable enolate form owing to substitution. The formation of the fragment C6H11O2Na from MEK dimer (m/z = 167.10) suggests that 1 is an ethyl ketone (its enolate formed by the abstraction of methyl H), instead of a methyl ketone.
In another formation pathway, the surface hydroxyl groups and adsorbed water induce the formation of MEK enol which then undergoes self-condensation with another MEK molecule to form a MEK dimer (Scheme 2). Hydrogen exchange from surface hydroxyl groups to MEK molecules can also be expected during this mechanistic pathway, deuterating α-H atoms. Further formation of MEK enol may continue to cross-condensate, forming other MEK oligomers. The MEK enol formation occurs near the surface as opposed to the adsorbed enolate complex explained in Scheme 1, making it less challenging to form oligomers with 3 or 4 MEK units. Surface-adsorbed water on α-Fe2O3 surfaces appears to enhance the KET of protonated MEK, facilitating a higher relative abundance of MEK trimer and tetramer in comparison to their relative abundances on TiO2 surfaces, once again highlighting the important role the mineral surface plays (Fig. 3). Here, the relative abundance was considered with respect to the 100% relative abundance of the particular HRMS scan. The role of water molecules in the oligomerization of MEK on mineral surfaces is discussed in detail in below.
Additionally, studies conducted with the two authentic dust samples, Arizona Test Dust (AZTD) and Gobi Dust, showed the formation of similar oligomers from MEK on these surfaces. For AZTD, all Compounds 1–8 was identified (Fig. S6†). However, for Gobi dust, the formation of MEK dimer mostly was observed.
3.2 Surface product formation from adsorbed MEK in the presence of high relative humidity
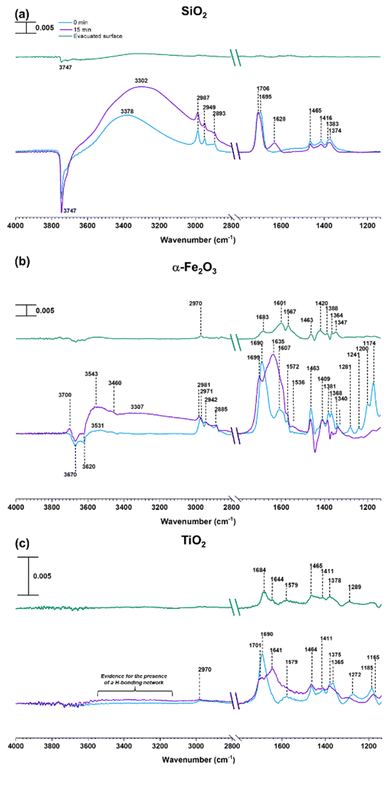
As discussed above, water can play an important role in the reaction chemistry of MEK on oxide surfaces. In order to further investigate the role of water molecules in MEK oligomerization, experiments were conducted at 80% RH. Fig. 4 shows the infrared spectrum of surfaces following exposure to MEK and water vapor after 4 h. On SiO2, upon exposure to water vapor, an adsorbed water bending vibration appears at 1628 cm−1 and a broad hydrogen stretching region is observed from 3380 to 3300 cm−1. Upon evacuation of the infrared cell, almost all adsorbed species were desorbed into the gas phase leaving little signal observed. However, at 80% RH, MEK-adsorbed α-Fe2O3 surfaces started to develop additional spectral features, notable at 3700 cm−1 (alcohol, free O–H stretching), at 3460, 3307, and 3543 cm−1 for strong H-bonded networks of adsorbed water, MEK, and alcohols, and at 1635 cm−1 (adsorbed water bending vibration). Furthermore, once evacuated, the surface retained most of these spectral features, although with a lower intensity, and with fewer spectral features in the region from 1150 to 1690 cm−1, indicating significant changes to the surface chemistry in the presence of adsorbed water. In contrast to α-Fe2O3 surfaces, evidence for an only weakly adsorbed H-bond network was observed on MEK-exposed TiO2 surfaces at 80% RH. However, adsorbed water on the surface was observed at 1641 cm−1 (water bending vibration) along with the presence of adsorbed-MEK spectral features comparable to those under dryer conditions. Upon evacuation, most of these spectral features were retained on the surface. The solvent-extracted products were further analyzed with HRMS and MS/MS to identify the product formation on each surface.All compounds (1–8) observed under the dry conditions were also observed under humid conditions on both α-Fe2O3 and TiO2 surfaces (Fig. 5). However, the relative distribution of compounds significantly differed. For α-Fe2O3 surfaces, the relative abundance of MEK dimer (m/z = 167.10) decreased more than 10-fold under humid conditions while the dehydrated products of both MEK trimer (m/z = 203.14, 221.15) and MEK tetramer (m/z = 257.19, 275.20) increased by ∼1.5-fold, 1.3-fold, 3-fold, and 1.7-fold respectively suggesting the enhanced formation of MEK trimer and tetramer, and their dehydration products at higher RH. A qualitative analysis was not conducted for the corresponding peaks for MEK trimer and tetramer due to their lower relative abundances. For TiO2, the relative abundance of MEK dimer remained at 100% upon exposure to 80% RH. Nevertheless, the relative intensities of the HRMS peaks corresponding to MEK trimer (m/z = 239.16) and tetramer (m/z = 311.22, 293.20) were increased by ∼7-fold, ∼7-fold, and ∼18-fold respectively in comparison to their dryer counterparts indicating increased trimer and dimer formation on TiO2 surfaces as well in the presence of water vapor.
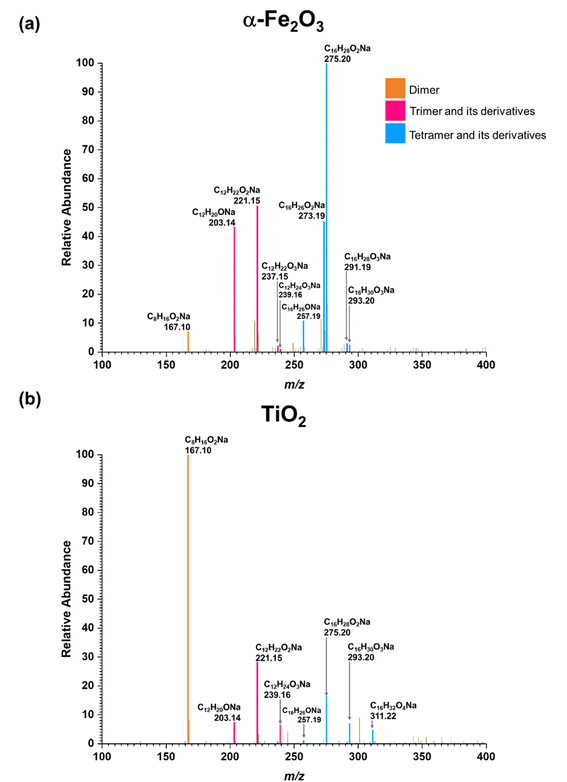 | ||
| Fig. 5 HRMS patterns of surface products formed upon adsorption of MEK at 80% RH on (a) α-Fe2O3 and (b) TiO2. | ||
Adsorbed water on both α-Fe2O3 and TiO2 surfaces can introduce an additional oligomerization pathway via surface-induced enol formation as explained in Scheme 2. Water may also act as a catalyst for the KET step.69,70 Higher relative humidity conditions such as those simulated in these experiments produce a strong H-bonded-water network with MEK molecules,71 and on the surface as supported by the FTIR spectra of MEK-exposed α-Fe2O3 at 80% RH (Fig. S3†). The formation of these H-bonds induces KET as well as stabilizes the enol form of MEK.71,72 Therefore, the observed increase of high-molecular-weight oligomers of MEK on α-Fe2O3 (predominantly) and TiO2 surfaces at 80% RH may be due to the enhanced enolization on the surface. Furthermore, the better ability of α-Fe2O3 surfaces to form a strong H-bonded network than TiO2 surfaces as observed in FTIR spectra and specifics of the H-bond networks such as bond strengths, lengths, and orientations73,74 may have led to the formation of MEK trimer and tetramer with higher relative abundance on α-Fe2O3 than that of TiO2 surfaces. Furthermore, given that SiO2 is a neutral surface that only facilitates physisorption of both MEK and water molecules, the acidity of adsorbed water may be insufficient to induce KET.75,76 Although, small carbonyls undergo hydration followed by polymerization in the atmosphere,34,38 such a reaction was ruled out in these systems due to the absence of relevant HRMS evidence. The MEK surface coverages were determined from volumetric measurements77 and for α-Fe2O3 and TiO2 these were calculated to be 1.1 × 10¹⁴ and 9.3 × 10¹³ molecules per cm2, respectively at an initial MEK pressure of 20 mTorr. Thus, these findings underscore the role of mineral oxide surfaces in not only the adsorption of atmospherically relevant ketones such as MEK but also in surface-mediated product formation under varying environmental conditions such as RH%.
3.3 Degradation followed by cross-condensation reaction of MEK with NO2 on α-Fe2O3 surfaces
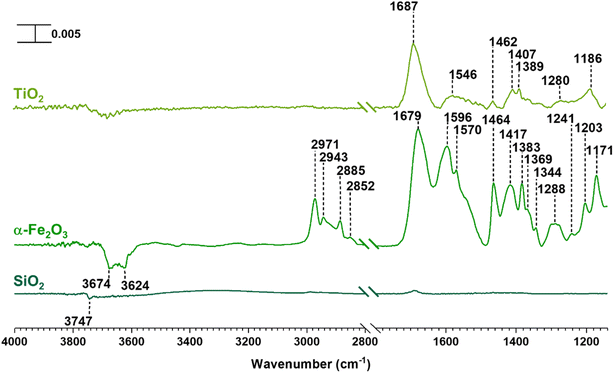
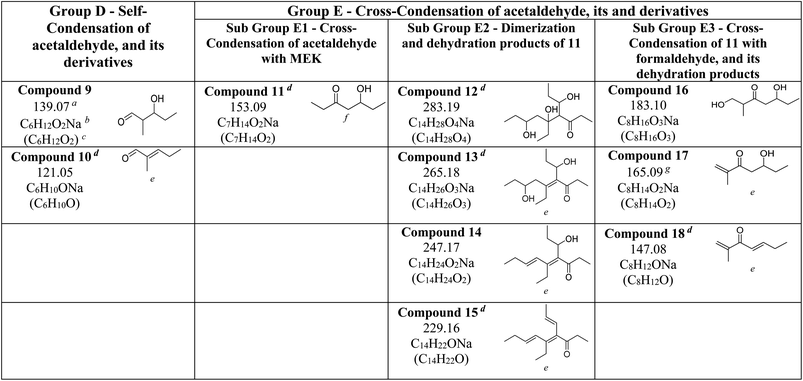
The reactions of MEK-adsorbed mineral surfaces with NO2 (g) were studied under dry conditions. For all three surfaces, upon exposure to NO2 (g), no visibly significant changes were observed on FTIR spectra. On evacuated SiO2 surfaces, all but residual quantities of MEK were desorbed (Fig. 6). For evacuated α-Fe2O3 surfaces, spectral features in the C–H stretching vibration region remained the same in comparison to those of MEK only. However, slight differences in spectral features between 1670 and 1690 cm−1 were observed, perhaps indicating changes in the surface product speciation. No major differences were observed on the FTIR spectrum of evacuated TiO2 surfaces, however, suggesting predominantly surface-mediated additional reaction pathways on α-Fe2O3 surfaces. Furthermore, no evidence was found for adsorbed organonitrates and/or adsorbed nitrate species formation on either surface. The solvent-extracted samples were analyzed with HRMS and MS/MS.All compounds from 1–8 were identified on both MEK-adsorbed α-Fe2O3 and TiO2 surfaces exposed to NO2(g). Interestingly, 5 and 6 which were not present on MEK-exposed TiO2 surfaces were identified when allowed reaction with NO2, suggesting increased oligomerization in the presence of NO2. Moreover, a range of new compounds were observed on α-Fe2O3 surfaces highlighting the surface-specific reactions involving MEK and NO2 (Fig. 7 and Table 3). These compounds are acetaldehyde dimer (Compound 9, C6H12O2Na, m/z = 139.07), and its dehydration product (Compound 10, C6H10ONa, m/z = 121.05), Compound 11 (C7H14O2Na, m/z = 153.09), Compound 12 (C14H28O4Na, m/z = 283.19), Compound 13 (C14H26O3Na, m/z = 265.18), Compound 14 (C14H24O2Na, m/z = 247.17), Compound 15 (C14H22ONa, m/z = 229.16), Compound 16 (C8H16O3Na, m/z = 183.10), Compound 17 (C8H14O2Na, m/z = 165.09), and Compound 18 (C8H12ONa, m/z = 147.08).
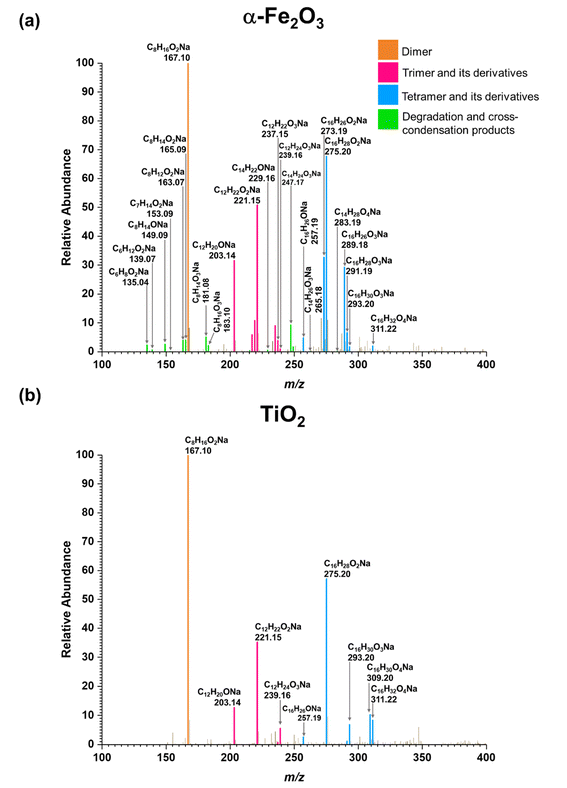 | ||
| Fig. 7 HRMS patterns of surface products formed from the reaction of MEK with NO2 on (a) α-Fe2O3 and (b) TiO2 under dry conditions. | ||
a : m/z.
b : Observed formula.
c : Molecular formula.
d : Observed with trace quantities, within acceptable mass tolerance.
e : C![[double bond, length as m-dash]](https://www.rsc.org/images/entities/char_e001.gif) C was assigned based on the most stable structure due to the formation of conjugated systems and/or MS/MS pattern.
f : The structure was determined based on the MS/MS pattern of 14 due to the lower intensity of 11.
g : m/z = 165.09 also forms from MEK dimer (m/z = 167.10) due to the loss of 2H during analysis. Here, the ratio of 165.09/167.10 is higher compared to other systems with MEK dimer indicating a second source of formation. C was assigned based on the most stable structure due to the formation of conjugated systems and/or MS/MS pattern.
f : The structure was determined based on the MS/MS pattern of 14 due to the lower intensity of 11.
g : m/z = 165.09 also forms from MEK dimer (m/z = 167.10) due to the loss of 2H during analysis. Here, the ratio of 165.09/167.10 is higher compared to other systems with MEK dimer indicating a second source of formation.
|
|---|
|
The formation of these compounds indicates that adsorbed MEK on α-Fe2O3 surfaces undergo a degradation process in the presence of NO2 to produce acetaldehyde and formaldehyde, which is a well-known atmospheric reaction often considered to occur under photochemical conditions and/or in the presence of ozone.19 NO2 is an oxidizer and degradation of MEK by NO2 is mediated on α-Fe2O3 surfaces, perhaps by adsorbed nitrate species. While neither acetaldehyde nor formaldehyde was identified in our experiments possibly due to lower m/z values, Compounds 9 and 10 are self-condensation products of acetaldehyde (Scheme 3). Compound 11 may be formed via cross-condensation of MEK with acetaldehyde. However, 11 is a precursor for both 12 and 16, and thus observed with lower relative intensity. The dimerization of 11 forms 12, and subsequent dehydration products, 13, 14, and 15. The structure of 14 was confirmed via MS/MS and, extended to its monomer, 11. Briefly, for m/z = 247.17 to produce a fragment at 218.12, both 14 and 11 must be ethyl ketones. This structure will be possible only with the cross-condensation of MEK enolate with acetaldehyde (Scheme 3). The cross-condensation of 11 with formaldehyde forms 16, along with its subsequent dehydration products, 17 and 18. Furthermore, the m/z fragment at 165.09 for C8H14O2Na also forms during MS analysis due to the loss of 2H from the MEK dimer. However, for solvent-extracted samples of MEK-adsorbed α-Fe2O3, the ratio of relative intensities of 165.09/167.10 is 0.017 whereas that for NO2-exposed MEK-adsorbed α-Fe2O3 is 0.041, evidence of additional sources for the formation of the fragment at m/z = 165.09. Therefore, these results underscore the surface-specific SOA formation on mineral surfaces from common VOCs such as MEK in the presence of trace gas pollutants such as NO2.
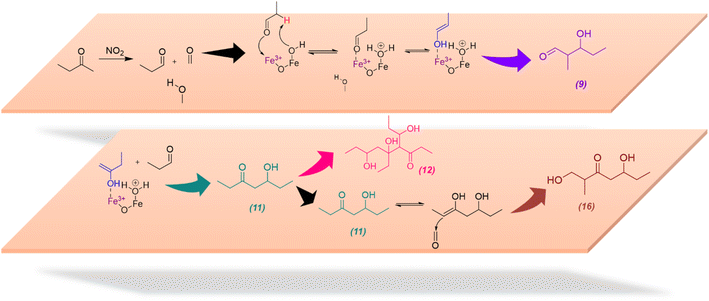 | ||
| Scheme 3 Proposed mechanistic pathways for the formation of MEK degradation and cross-condensation products 9, 11, 12, and 16 on α-Fe2O3 surfaces in the presence of NO2 (g). | ||
4 Conclusion
The adsorption of methyl ethyl ketone (MEK) on oxide surfaces, specifically α-Fe2O3 and TiO2, yields MEK oligomers and their dehydration products. Similar oligomer formation chemistry was observed with authentic dust samples, Arizona Test Dust and Gobi Dust samples. These oligomers were primarily MEK dimer, MEK trimer, and MEK tetramer whereas these products do not form on SiO2. The formation of these oligomers on mineral oxide surfaces involves reactions with surface hydroxyl groups as confirmed via isotope labeling experiments with deuteroxylated α-Fe2O3 and TiO2 surfaces. In the presence of gas-phase water (80% RH), surface product speciation on α-Fe2O3 surfaces shifted toward high-molecular-weight oligomers and their dehydration products, whereas for TiO2, a slight increase in high-molecular-weight oligomers was identified. These results indicate the important role of water molecules in these surface-mediated oligomerization reactions that are mineral specific. Moreover, when MEK-adsorbed mineral surfaces were exposed to NO2(g), MEK degradation to acetaldehyde and formaldehyde on α-Fe2O3 surfaces followed by self- and cross-condensation was observed, underscoring the specific role of mineral surface.Overall, this study shows how mineral dust aerosol surfaces can interact with atmospherically prevalent carbonyl compounds that are often regarded as too insignificant to be involved in heterogeneous and multiphase reactions to yield SOAs. Moreover, these compounds can be oxidized in the presence of nitrogen oxides. These data show that small carbonyl compounds interact with surfaces and undergo oligomerization reactions producing high-molecular-weight and oxygenated SOAs. Furthermore, water molecules in the atmosphere act as a catalyst/aid in catalyzing these surface-mediated reactions and stabilizing intermediates, thereby enhancing the formation of these larger oligomers on mineral surfaces that are mineral specific. Additionally, VOCs such as MEK can undergo surface-mediated degradation in the presence of NO2, even under dark conditions irrespective of the availability of other common oxidants such as HO, ozone, or H2O2, thereby initiating additional aldol-condensation reactions on mineral surfaces. In the environment, VOCs such as MEK are ubiquitous, emitting from both natural and anthropogenic sources. During dust transport and urban dust episodes, these VOCs and trace gas pollutants such as NO2 can interact with each other, forming SOAs that are more highly oxygenated and less volatile as shown here on these different mineral surfaces under different relative humidity. Further reactions of these oligomers formed from MEK with other atmospheric components may induce the formation of BrC, and this is an area worthy of additional study. This study suggests that heterogeneous reactions are possible pathways for oligomerization reactions of small organic compounds and the formation of various highly oxygenated SOAs. Furthermore, the adsorption of small carbonyl compounds on authentic dust such as Arizona Test Dust and natural dust samples show that these reactivities occur within these samples and on different mineral surfaces that make up these complex dust samples.
Author contribution
Conceptualization was jointly by VHG & EH; funding acquisition, supervision, and project administration were carried out by VHG; investigation, data curation, formal analysis, validation, and writing the original draft of the manuscript were carried out by EH; reviewing and editing of the manuscript were performed jointly by VHG & EH.Conflicts of interest
All authors declare no competing interests.Acknowledgements
This study is supported by the National Science Foundation under Grant CHE-2002607. The authors acknowledge Cholaphan Deeleepojananan for helpful discussions.References
- H. O. T. Pye, C. K. Ward-Caviness, B. N. Murphy, K. W. Appel and K. M. Seltzer, Secondary organic aerosol association with cardiorespiratory disease mortality in the United States, Nat. Commun., 2021, 12, 7215 CrossRef CAS PubMed.
- J. Liu, B. Chu, T. Chen, C. Zhong, C. Liu, Q. Ma, J. Ma, P. Zhang and H. He, Secondary Organic Aerosol Formation Potential from Ambient Air in Beijing: Effects of Atmospheric Oxidation Capacity at Different Pollution Levels, Environ. Sci. Technol., 2021, 55, 4565–4572 CrossRef CAS PubMed.
- C. Wong, D. Vite and S. A. Nizkorodov, Stability of α-Pinene and d -Limonene Ozonolysis Secondary Organic Aerosol Compounds Toward Hydrolysis and Hydration, ACS Earth Space Chem., 2021, 5, 2555–2564 CrossRef CAS.
- F. Khan, K. Kwapiszewska, Y. Zhang, Y. Chen, A. T. Lambe, A. Kołodziejczyk, N. Jalal, K. Rudzinski, A. Martínez-Romero, R. C. Fry, J. D. Surratt and R. Szmigielski, Toxicological Responses of α-Pinene-Derived Secondary Organic Aerosol and Its Molecular Tracers in Human Lung Cell Lines, Chem. Res. Toxicol., 2021, 34, 817–832 Search PubMed.
- S. Ge, G. Wang, S. Zhang, D. Li, Y. Xie, C. Wu, Q. Yuan, J. Chen and H. Zhang, Abundant NH3 in China Enhances Atmospheric HONO Production by Promoting the Heterogeneous Reaction of SO2 with NO2, Environ. Sci. Technol., 2019, 53, 14339–14347 CrossRef CAS PubMed.
- S. A. Mang, D. K. Henricksen, A. P. Bateman, M. P. S. Andersen, D. R. Blake and S. A. Nizkorodov, Contribution of Carbonyl Photochemistry to Aging of Atmospheric Secondary Organic Aerosol, J. Phys. Chem. A, 2008, 112, 8337–8344 CrossRef CAS PubMed.
- D. Srivastava, T. V. Vu, S. Tong, Z. Shi and R. M. Harrison, Formation of secondary organic aerosols from anthropogenic precursors in laboratory studies, npj Clim. Atmos. Sci., 2022, 5, 22 CrossRef CAS.
- B. Ervens and S. M. Kreidenweis, SOA Formation by Biogenic and Carbonyl Compounds: Data Evaluation and Application, Environ. Sci. Technol., 2007, 41, 3904–3910 CrossRef CAS PubMed.
- Q. Liu, Y. Gao, W. Huang, Z. Ling, Z. Wang and X. Wang, Carbonyl compounds in the atmosphere: A review of abundance, source and their contributions to O3 and SOA formation, Atmos. Res., 2022, 274, 106184 CrossRef CAS.
- M. Kalberer, D. Paulsen, M. Sax, M. Steinbacher, J. Dommen, A. S. H. Prevot, R. Fisseha, E. Weingartner, V. Frankevich, R. Zenobi and U. Baltensperger, Identification of Polymers as Major Components of Atmospheric Organic Aerosols, Science, 2004, 303, 1659–1662 CrossRef CAS PubMed.
- J. F. Brewer, E. V. Fischer, R. Commane, S. C. Wofsy, B. C. Daube, E. C. Apel, A. J. Hills, R. S. Hornbrook, B. Barletta, S. Meinardi, D. R. Blake, E. A. Ray and A. R. Ravishankara, Evidence for an Oceanic Source of Methyl Ethyl Ketone to the Atmosphere, Geophys. Res. Lett., 2020, 47(4), e2019GL086045 CrossRef CAS.
- H. Shen, Z. Chen, H. Li, X. Qian, X. Qin and W. Shi, Gas-Particle Partitioning of Carbonyl Compounds in the Ambient Atmosphere, Environ. Sci. Technol., 2018, 52, 10997–11006 CrossRef CAS PubMed.
- G. T. Drozd, K. S.-M. Brown and H. Q. Karp, Effects of Organic Matrices on Nucleophilic Aqueous Aerosol Chemistry: Yields and Mechanistic Insight for Brown Carbon Formation from Glyoxal and Ammonia, ACS Earth Space Chem., 2022, 6, 1772–1781 CrossRef CAS.
- S. Tang, F. Li, J. Lv, L. Liu, G. Wu, Y. Wang, W. Yu, Y. Wang and G. Jiang, Unexpected molecular diversity of brown carbon formed by Maillard-like reactions in aqueous aerosols, Chem. Sci., 2022, 13, 8401–8411 RSC.
- R. Zhang, M. Gen, Z. Liang, Y. J. Li and C. K. Chan, Photochemical Reactions of Glyoxal during Particulate Ammonium Nitrate Photolysis: Brown Carbon Formation, Enhanced Glyoxal Decay, and Organic Phase Formation, Environ. Sci. Technol., 2022, 56, 1605–1614 CrossRef CAS PubMed.
- N. G. Jimenez, K. D. Sharp, T. Gramyk, D. Z. Ugland, M.-K. Tran, A. Rojas, M. A. Rafla, D. Stewart, M. M. Galloway, P. Lin, A. Laskin, M. Cazaunau, E. Pangui, J. F. Doussin and D. O. De Haan, Radical-Initiated Brown Carbon Formation in Sunlit Carbonyl–Amine–Ammonium Sulfate Mixtures and Aqueous Aerosol Particles, ACS Earth Space Chem., 2022, 6, 228–238 CrossRef CAS.
- K. M. Updyke, T. B. Nguyen and S. A. Nizkorodov, Formation of brown carbon via reactions of ammonia with secondary organic aerosols from biogenic and anthropogenic precursors, Atmos. Environ., 2012, 63, 22–31 CrossRef CAS.
- J. F. Brewer, D. K. Papanastasiou, J. B. Burkholder, E. V. Fischer, Y. Ren, A. Mellouki and A. R. Ravishankara, Atmospheric Photolysis of Methyl Ethyl, Diethyl, and Propyl Ethyl Ketones: Temperature-Dependent UV Absorption Cross Sections, J. Geophys. Res.: Atmos., 2019, 124, 5906–5918 CrossRef CAS.
- A. M. Yáñez-Serrano, A. C. Nölscher, E. Bourtsoukidis, B. Derstroff, N. Zannoni, V. Gros, M. Lanza, J. Brito, S. M. Noe, E. House, C. N. Hewitt, B. Langford, E. Nemitz, T. Behrendt, J. Williams, P. Artaxo, M. O. Andreae and J. Kesselmeier, Atmospheric mixing ratios of methyl ethyl ketone (2-butanone) in tropical, boreal, temperate and marine environments, Atmos. Chem. Phys., 2016, 16, 10965–10984 CrossRef.
- B. Davison, A. Brunner, C. Ammann, C. Spirig, M. Jocher and A. Neftel, Cut-induced VOC emissions from agricultural grasslands, Plant Biol., 2008, 10, 76–85 CrossRef CAS PubMed.
- K. A. McKinney, B. H. Lee, A. Vasta, T. V. Pho and J. W. Munger, Emissions of isoprenoids and oxygenated biogenic volatile organic compounds from a New England mixed forest, Atmos. Chem. Phys., 2011, 11, 4807–4831 CrossRef CAS.
- T. M. Ruuskanen, M. Müller, R. Schnitzhofer, T. Karl, M. Graus, I. Bamberger, L. Hörtnagl, F. Brilli, G. Wohlfahrt and A. Hansel, Eddy covariance VOC emission and deposition fluxes above grassland using PTR-TOF, Atmos. Chem. Phys., 2011, 11, 611–625 CrossRef CAS PubMed.
- G. Song and C.-M. Ryu, Two Volatile Organic Compounds Trigger Plant Self-Defense against a Bacterial Pathogen and a Sucking Insect in Cucumber under Open Field Conditions, Int. J. Mol. Sci., 2013, 14, 9803–9819 CrossRef PubMed.
- A. Tani, K. Muramatsu and T. Mochizuki, Emission of Methyl Ethyl Ketone and 2-Butanol Converted from Methyl Vinyl Ketone in Plant Leaves, Atmosphere, 2020, 11, 793 CrossRef CAS.
- M. O. Andreae and P. Merlet, Emission of trace gases and aerosols from biomass burning, Global Biogeochem. Cycles, 2001, 15, 955–966 CrossRef CAS.
- S. Kim, S.-Y. Kim, M. Lee, H. Shim, G. M. Wolfe, A. B. Guenther, A. He, Y. Hong and J. Han, Impact of isoprene and HONO chemistry on ozone and OVOC formation in a semirural South Korean forest, Atmos. Chem. Phys., 2015, 15, 4357–4371 CrossRef CAS.
- D. M. Bon, I. M. Ulbrich, J. A. de Gouw, C. Warneke, W. C. Kuster, M. L. Alexander, A. Baker, A. J. Beyersdorf, D. Blake, R. Fall, J. L. Jimenez, S. C. Herndon, L. G. Huey, W. B. Knighton, J. Ortega, S. Springston and O. Vargas, Measurements of volatile organic compounds at a suburban ground site (T1) in Mexico City during the MILAGRO 2006 campaign: measurement comparison, emission ratios, and source attribution, Atmos. Chem. Phys., 2011, 11, 2399–2421 CrossRef CAS.
- J. Brito, F. Wurm, A. M. Yáñez-Serrano, J. V. de Assunção, J. M. Godoy and P. Artaxo, Vehicular Emission Ratios of VOCs in a Megacity Impacted by Extensive Ethanol Use: Results of Ambient Measurements in São Paulo, Brazil, Environ. Sci. Technol., 2015, 49, 11381–11387 CrossRef CAS PubMed.
- J. de Gouw and C. Warneke, Measurements of volatile organic compounds in the earth's atmosphere using proton-transfer-reaction mass spectrometry, Mass Spectrom. Rev., 2007, 26, 223–257 CrossRef CAS PubMed.
- R. Sommariva, J. A. de Gouw, M. Trainer, E. Atlas, P. D. Goldan, W. C. Kuster, C. Warneke and F. C. Fehsenfeld, Emissions and photochemistry of oxygenated VOCs in urban plumes in the Northeastern United States, Atmos. Chem. Phys., 2011, 11, 7081–7096 CrossRef CAS.
- P. Li, K. A. Perreau, E. Covington, C. H. Song, G. R. Carmichael and V. H. Grassian, Heterogeneous reactions of volatile organic compounds on oxide particles of the most abundant crustal elements: Surface reactions of acetaldehyde, acetone, and propionaldehyde on SiO2, Al2O3, Fe2O3, TiO2, and CaO, J. Geophys. Res.: Atmos., 2001, 106, 5517–5529 CrossRef CAS.
- M. El-Maazawi, A. N. Finken, A. B. Nair and V. H. Grassian, Adsorption and Photocatalytic Oxidation of Acetone on TiO2: An in Situ Transmission FT-IR Study, J. Catal., 2000, 191, 138–146 CrossRef CAS.
- Y. Li, Y. Ji, J. Zhao, Y. Wang, Q. Shi, J. Peng, Y. Wang, C. Wang, F. Zhang, Y. Wang, J. H. Seinfeld and R. Zhang, Unexpected Oligomerization of Small α-Dicarbonyls for Secondary Organic Aerosol and Brown Carbon Formation, Environ. Sci. Technol., 2021, 55, 4430–4439 CrossRef CAS PubMed.
- M. Jang and R. M. Kamens, Atmospheric Secondary Aerosol Formation by Heterogeneous Reactions of Aldehydes in the Presence of a Sulfuric Acid Aerosol Catalyst, Environ. Sci. Technol., 2001, 35, 4758–4766 CrossRef CAS PubMed.
- M. Hajaghazadeh, V. Vaiano, D. Sannino, H. Kakooei, R. Sotudeh-Gharebagh and P. Ciambelli, Heterogeneous photocatalytic oxidation of methyl ethyl ketone under UV-A light in an LED-fluidized bed reactor, Catal. Today, 2014, 230, 79–84 CrossRef CAS.
- C. Knote, A. Hodzic, J. L. Jimenez, R. Volkamer, J. J. Orlando, S. Baidar, J. Brioude, J. Fast, D. R. Gentner, A. H. Goldstein, P. L. Hayes, W. B. Knighton, H. Oetjen, A. Setyan, H. Stark, R. Thalman, G. Tyndall, R. Washenfelder, E. Waxman and Q. Zhang, Simulation of semi-explicit mechanisms of SOA formation from glyoxal in aerosol in a 3-D model, Atmos. Chem. Phys., 2014, 14, 6213–6239 CrossRef.
- T.-M. Fu, D. J. Jacob, F. Wittrock, J. P. Burrows, M. Vrekoussis and D. K. Henze, Global budgets of atmospheric glyoxal and methylglyoxal, and implications for formation of secondary organic aerosols, J. Geophys. Res., 2008, 113, D15303 CrossRef.
- M. Jang, N. M. Czoschke, S. Lee and R. M. Kamens, Heterogeneous Atmospheric Aerosol Production by Acid-Catalyzed Particle-Phase Reactions, Science, 2002, 298, 814–817 CrossRef CAS PubMed.
- R. Volkamer, F. San Martini, L. T. Molina, D. Salcedo, J. L. Jimenez and M. J. Molina, A missing sink for gas-phase glyoxal in Mexico City: Formation of secondary organic aerosol, Geophys. Res. Lett., 2007, 34, L19807 CrossRef.
- Y. Ji, Q. Shi, X. Ma, L. Gao, J. Wang, Y. Li, Y. Gao, G. Li, R. Zhang and T. An, Elucidating the critical oligomeric steps in secondary organic aerosol and brown carbon formation, Atmos. Chem. Phys., 2022, 22, 7259–7271 CrossRef CAS.
- D. Grosjean, E. Grosjean and L. F. R. Moreira, Speciated Ambient Carbonyls in Rio de Janeiro, Brazil, Environ. Sci. Technol., 2002, 36, 1389–1395 CrossRef CAS PubMed.
- P. Pinho, C. Pio and M. Jenkin, Evaluation of isoprene degradation in the detailed tropospheric chemical mechanism, MCM v3, using environmental chamber data, Atmos. Environ., 2005, 39, 1303–1322 CrossRef CAS.
- K. Kandler, N. Benker, U. Bundke, E. Cuevas, M. Ebert, P. Knippertz, S. Rodríguez, L. Schütz and S. Weinbruch, Chemical Composition and Complex Refractive Index of Saharan Mineral Dust at Izaña, Tenerife (Spain) Derived by Electron Microscopy, Atmos. Environ., 2007, 41, 8058–8074 CrossRef CAS.
- G. Rubasinghege and V. H. Grassian, Role(s) of adsorbed water in the surface chemistry of environmental interfaces, Chem. Commun., 2013, 49, 3071 RSC.
- Z. Bozkurt, Ö. Ö. Üzmez, T. Döğeroğlu, G. Artun and E. O. Gaga, Atmospheric concentrations of SO2, NO2, ozone and VOCs in Düzce, Turkey using passive air samplers: Sources, spatial and seasonal variations and health risk estimation, Atmos. Pollut. Res., 2018, 9, 1146–1156 CrossRef CAS.
- L. Pinault, D. Crouse, M. Jerrett, M. Brauer and M. Tjepkema, Spatial associations between socioeconomic groups and NO2 air pollution exposure within three large Canadian cities, Environ. Res., 2016, 147, 373–382 CrossRef CAS PubMed.
- C. E. Nanayakkara, W. A. Larish and V. H. Grassian, Titanium Dioxide Nanoparticle Surface Reactivity with Atmospheric Gases, CO2, SO2, and NO2: Roles of Surface Hydroxyl Groups and Adsorbed Water in the Formation and Stability of Adsorbed Products, J. Phys. Chem. C, 2014, 118, 23011–23021 CrossRef CAS.
- M. Tang, W. A. Larish, Y. Fang, A. Gankanda and V. H. Grassian, Heterogeneous Reactions of Acetic Acid with Oxide Surfaces: Effects of Mineralogy and Relative Humidity, J. Phys. Chem. A, 2016, 120, 5609–5616 CrossRef CAS PubMed.
- Y. Fang, M. Tang and V. H. Grassian, Competition between Displacement and Dissociation of a Strong Acid Compared to a Weak Acid Adsorbed on Silica Particle Surfaces: The Role of Adsorbed Water, J. Phys. Chem. A, 2016, 120, 4016–4024 CrossRef CAS PubMed.
- Y. Fang, D. Lesnicki, K. J. Wall, M. P. Gaigeot, M. Sulpizi, V. Vaida and V. H. Grassian, Heterogeneous Interactions between Gas-Phase Pyruvic Acid and Hydroxylated Silica Surfaces: A Combined Experimental and Theoretical Study, J. Phys. Chem. A, 2019, 123, 983–991 CrossRef CAS PubMed.
- A. L. Goodman, E. T. Bernard and V. H. Grassian, Spectroscopic Study of Nitric Acid and Water Adsorption on Oxide Particles: Enhanced Nitric Acid Uptake Kinetics in the Presence of Adsorbed Water, J. Phys. Chem. A, 2001, 105, 6443–6457 CrossRef CAS.
- E. Hettiarachchi and V. H. Grassian, Heterogeneous Formation of Organonitrates (ON) and Nitroxy-Organosulfates (NOS) from Adsorbed α-Pinene-Derived Organosulfates (OS) on Mineral Surfaces, ACS Earth Space Chem., 2022, 6, 3017–3030 CrossRef CAS PubMed.
- C. E. Nanayakkara, J. Pettibone and V. H. Grassian, Sulfur dioxide adsorption and photooxidation on isotopically-labeled titanium dioxide nanoparticle surfaces: Roles of surface hydroxyl groups and adsorbed water in the formation and stability of adsorbed sulfite and sulfate, Phys. Chem. Chem. Phys., 2012, 14, 6957–6966 RSC.
- J. Baltrusaitis and V. H. Grassian, Surface Reactions of Carbon Dioxide at the Adsorbed Water–Iron Oxide Interface, J. Phys. Chem. B, 2005, 109, 12227–12230 CrossRef CAS PubMed.
- G. M. Underwood, P. Li, H. Al-Abadleh and V. H. Grassian, A Knudsen Cell Study of the Heterogeneous Reactivity of Nitric Acid on Oxide and Mineral Dust Particles, J. Phys. Chem. A, 2001, 105, 6609–6620 CrossRef CAS.
- G. Socrates, Infrared and Raman Characteristic Group Frequencies, Wiley, 3rd edn, 2000 Search PubMed.
- Methyl Ethyl Ketone – NIST, https://webbook.nist.gov/cgi/cbook.cgi?Spec=C78933%26Index=12%26Type=IR%26Large=on%26SVG=on, (accessed 5 December 2022) Search PubMed.
- E. S. Frank, H. Fan, M. Shrestha, S. Riahi, D. J. Tobias and V. H. Grassian, Impact of Adsorbed Water on the Interaction of Limonene with Hydroxylated SiO2 : Implications of π-Hydrogen Bonding for Surfaces in Humid Environments, J. Phys. Chem. A, 2020, 124, 10592–10599 CrossRef CAS PubMed.
- K. Hadjiivanov, in Advances in Catalysis, 2014, pp. 99–318 Search PubMed.
- R. A. Hancock, B. S. Thyagarajan and R. Walder, Chemical ionization mass spectrometry: Oligomerization reactions in tight ion sources, Org. Mass Spectrom., 1980, 15, 101–104 CrossRef CAS.
- D. M. Griffiths and C. H. Rochester, Infrared study of the adsorption of acetone on rutile, J. Chem. Soc., Faraday Trans. 1, 1978, 74, 403 RSC.
- A. Panov and J. J. Fripiat, An Infrared Spectroscopic Study of Acetone and Mesityl Oxide Adsorption on Acid Catalyst, Langmuir, 1998, 14, 3788–3796 CrossRef CAS.
- J. Liggio and S.-M. Li, Reactive uptake of pinonaldehyde on acidic aerosols, J. Geophys. Res., 2006, 111, D24303 CrossRef.
- P. Renard, S. Tlili, S. Ravier, E. Quivet and A. Monod, Aqueous phase oligomerization of α,β-unsaturated carbonyls and acids investigated using ion mobility spectrometry coupled to mass spectrometry (IMS-MS), Atmos. Environ., 2016, 130, 153–162 CrossRef CAS.
- Y. Liu, F. Siekmann, P. Renard, A. El Zein, G. Salque, I. El Haddad, B. Temime-Roussel, D. Voisin, R. Thissen and A. Monod, Oligomer and SOA formation through aqueous phase photooxidation of methacrolein and methyl vinyl ketone, Atmos. Environ., 2012, 49, 123–129 CrossRef CAS.
- P. Renard, F. Siekmann, G. Salque, C. Demelas, B. Coulomb, L. Vassalo, S. Ravier, B. Temime-Roussel, D. Voisin and A. Monod, Aqueous-phase oligomerization of methyl vinyl ketone through photooxidation – Part 1: Aging processes of oligomers, Atmos. Chem. Phys., 2015, 15, 21–35 CrossRef.
- J. Clayden, N. Greeves and S. Warren, Organic Chemistry, New York: Oxford University Press, 2nd edn, 2012 Search PubMed.
- H. Metiu, S. Chrétien, Z. Hu, B. Li and X. Sun, Chemistry of Lewis Acid–Base Pairs on Oxide Surfaces, J. Phys. Chem. C, 2012, 116, 10439–10450 CrossRef CAS.
- G. Alagona, C. Ghio and P. I. Nagy, The catalytic effect of water on the keto–enol tautomerism. Pyruvate and acetylacetone: a computational challenge, Phys. Chem. Chem. Phys., 2010, 12, 10173 RSC.
- A. Datar, H. Paithankar, P. Deb, J. Chugh, S. Bagchi, A. Mukherjee and A. Hazra, Water-Controlled Keto–Enol Tautomerization of a Prebiotic Nucleobase, J. Phys. Chem. B, 2022, 126, 5735–5743 CrossRef CAS PubMed.
- S. Yamabe, N. Tsuchida and K. Miyajima, Reaction Paths of Keto−Enol Tautomerization of β-Diketones, J. Phys. Chem. A, 2004, 108, 2750–2757 CrossRef CAS.
- X. Jin, D. Wu, C. Liu, S. Huang, Z. Zhou, H. Wu, X. Chen, M. Huang, S. Zhou and C. Gu, Facet effect of hematite on the hydrolysis of phthalate esters under ambient humidity conditions, Nat. Commun., 2022, 13, 6125 CrossRef CAS PubMed.
- T. Zheng, C. Wu, M. Chen, Y. Zhang and P. T. Cummings, A DFT study of water adsorption on rutile TiO 2 (110) surface: The effects of surface steps, J. Chem. Phys., 2016, 145, 044702 CrossRef PubMed.
- F. Jones, A. L. Rohl, J. B. Farrow and W. van Bronswijk, Molecular modeling of water adsorption on hematite, Phys. Chem. Chem. Phys., 2000, 2, 3209–3216 RSC.
- C. A. Morrow, D. E. Moore and D. A. Lockner, The effect of mineral bond strength and adsorbed water on fault gouge frictional strength, Geophys. Res. Lett., 2000, 27, 815–818 CrossRef.
- M. Sulpizi, M.-P. Gaigeot and M. Sprik, The Silica–Water Interface: How the Silanols Determine the Surface Acidity and Modulate the Water Properties, J. Chem. Theory Comput., 2012, 8, 1037–1047 CrossRef CAS PubMed.
- Y. Fang, P. S. J. Lakey, S. Riahi, A. T. McDonald, M. Shrestha, D. J. Tobias, M. Shiraiwa and V. H. Grassian, A molecular picture of surface interactions of organic compounds on prevalent indoor surfaces: Limonene adsorption on SiO2, Chem. Sci., 2019, 10, 2906–2914 RSC.
Footnote |
| † Electronic supplementary information (ESI) available: MEK gas-phase FTIR spectrum, HRMS pattern for the MEK standard, MS/MS fragmentation of identified surface products, FTIR spectra for MEK adsorption on hydroxylated and deuteroxylated α-Fe2O3 surfaces and peak assignments, HRMS pattern for surface products for MEK adsorption on deuteroxylated α-Fe2O3 and TiO2 surfaces, mass spectrometry data of identified deuterated products, and HRMS pattern for surface products for MEK adsorption on authentic dust. See DOI: https://doi.org/10.1039/d3ea00023k |
| This journal is © The Royal Society of Chemistry 2023 |

