
 Open Access Article
 This Open Access Article is licensed under a Creative Commons Attribution-Non Commercial 3.0 Unported Licence
A computer-based solution to the oxidation kinetics of fluorinated and oxygenated volatile organic compounds†
Luís P.
Viegas
 *a and
Frank
Jensen
b
*a and
Frank
Jensen
b
aCoimbra Chemistry Centre-Institute of Molecular Sciences (CQC-IMS), Department of Chemistry, University of Coimbra, Coimbra 3004-535, Portugal. E-mail: lpviegas@ci.uc.pt
bChemistry Department, Aarhus University, DK-8000 Aarhus, Denmark
First published on 13th March 2023
Abstract
The OH radical is the most powerful atmospheric oxidant, being responsible for the chemical breakdown of many pollutants released into the troposphere, including saturated volatile organic compounds (VOCs). Numerous of these VOCs are strong greenhouse gases, including hydrofluorocarbons, whose industrial emissions to the environment have grown significantly over time and are gradually being phased out. The calculation of OH-initiated oxidation reaction rate constants represents an approach to determine the atmospheric impact of fluorine-containing oxygenated VOCs, which have been regarded as a good substitute for hydrofluorocarbons. Such calculations are challenging, especially when the VOCs are conformationally flexible. We have recently developed a cost-effective computational protocol for such systems based on density functional calculations and on the coupling of multiconformer transition state theory with constrained transition state randomization. The protocol has, however, only been calibrated against a small number of experiments, practically all of which involved OVOCs from the ether family. In this study, we extend the scope by applying the protocol to five families of OVOCs (C3-fluorine containing alcohols, aldehydes, esters, ethers and ketones) and compare the calculated reaction rates with the recommended experimental values. Our calculated rate coefficients, on average, agree with the recommended experimental values to within a factor of two, with the maximum deviation being a factor of 2.8. These results validate the use of the protocol for computational tropospheric degradation studies of conformationally flexible OVOCs with an unprecedented accuracy.
Environmental significanceThe impact of hydrofluorocarbons (HFCs) on global warming can be hundreds to thousands of times greater than that of CO2. With the rapid rise of HFC emissions and their projected catastrophic effects on the atmosphere and climate, the Kigali Amendment of 2016 seeks to drastically reduce the global production and consumption of HFCs, thus contributing to the Paris agreement target of limiting the global temperature rise below 2 degrees Celsius. For this reason, new ideas and green technologies are necessary to achieve the Kigali goals and mitigate climate change effectively. Based on the results of the present study, we demonstrate that our cost-effective computational protocol is capable of predicting with unprecedented accuracy the rate coefficients of the OH– initiated reactions of several families of saturated organic compounds that could replace HFCs. Consequently, our computational approach has the potential not only to deliver the required fundamental knowledge but also to actively take part in this critical scientific endeavour. |
1 Introduction
In the wake of the realization that chlorofluorocarbon (CFC) compounds were part of the ozone depletion problem and were causing global warming,1–4 theoretical and experimental efforts to find environmentally friendly CFC replacements have expanded dramatically. Almost 200 nations adopted the Kigali Amendment to the Montreal Protocol5 in October 2016, making this subject even more relevant. Ratifying this protocol makes countries stop using and producing hydrofluorocarbons (HFCs), which makes it important to find environmentally friendly alternatives, since these second-generation replacements have a high global warming potential.6 One of the most important parameters defining the global warming potential of a compound is its atmospheric lifetime.7 The atmospheric lifetime is often decreased by introducing oxygen-containing functional groups, and fluorine-containing oxygenated volatile organic compounds (OVOCs) are candidates for third-generation replacements in industrial and commercial applications.8 Relative to their non-oxygenated fluorinated counterparts, the oxygen functional groups promote chemical activation by hydrogen-atom abstraction at distant sites from the substituent group, and thus increase the atmospheric reactivity by OH radicals.9–11 There are a variety of applications8 for fluorinated alcohols, aldehydes, esters, ethers and ketones in industry and they can potentially replace HFCs, as mandated by the Kigali Amendment to the Montreal Protocol.The two main degradation pathways associated with OVOCs are photolysis and reaction with OH radicals, with the former being relevant only for certain families of OVOCs, such as aldehydes and ketones:9,11,12 these two families of compounds contain a carbonyl group which absorbs radiation in the ultraviolet region around 280 nm due to its n → π* transition.13 The global lifetime7,14 (also referred to as “lifetime”, “total lifetime” or “turnover time”15) of OVOCs based on these two degradation pathways can be estimated as follows:
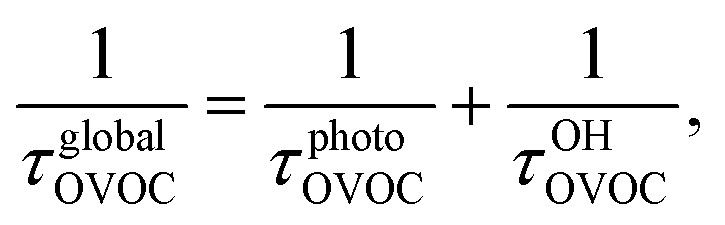 | (1) |
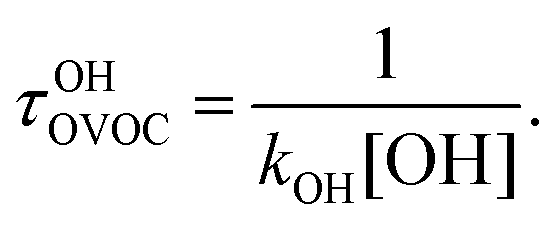 | (2) |
In these bimolecular degradation reactions, the OH radical typically abstracts a hydrogen atom from the OVOC9,11,19–21
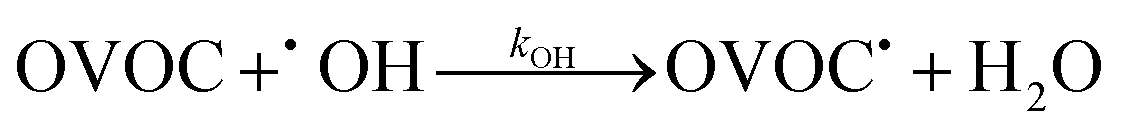 | (3) |
There are, however, some challenges associated with obtaining accurate rate constants by computational methods. For reactions where the dynamical bottleneck is difficult to locate, robust approaches24–29 based on variational transition state theory (VTST) are necessary. However, these become unmanageable for molecules exhibiting rich conformational complexity, such as in molecules of moderate/large size. Fortunately, for reactions involving the OH radical and fluorine-containing saturated oxygenated VOCs such as the ones explored in this work, the use of VTST is not necessary, since the transition states are well approximated by following the conventional TST approach of placing the dividing surfaces that separate reactants from products at the saddle-points of the potential energy surfaces (PESs), instead of having to variationally optimize them. Within such a framework, we have recently developed,30,31 tested32–36 and improved37 a computational protocol for a cost-effective calculation of bimolecular rate constants for the reaction between ˙OH and VOCs of moderate/large size. This protocol is based on multiconformer transition state theory (MC-TST)38–44 and a method for performing transition state sampling called constrained transition state randomization (CTSR).37 The MC-TST/CTSR protocol has provided promising results for fluorinated ethers, but it clearly needs to be tested for a wider range of fluorinated OVOC compounds before it can be routinely applied. In the present case we extend the calibration study to compounds belonging to the hydrofluoroalcohol, hydrofluoroaldehyde, hydrofluoroester, hydrofluoroether and hydrofluoroketone families. The study aims to assess the effectiveness of the MC-TST/CTSR protocol in obtaining accurate rate constants for the reaction between the OH radical and the five fluorinated OVOC families listed above. We have considered two examples of C3-fluorinated OVOCs for each of the five families of compounds, for a total of 10 systems. Our main focus will be a comparison of the MC-TST/CTSR predicted rate constants with the recommended experimental values at 298.15 K, but where experimental information is available, we also compare branching ratios and Arrhenius parameters.
2 Theory and methods
2.1 Theoretical background
A typical example of a radical–molecule reaction of atmospheric interest45 is the reaction between OVOCs and ˙OH,9,19,20 where both reactant and product channels exhibit loose complexes that are connected by hydrogen-abstraction transition states (TSs). The reaction profile features three steps: (1) formation of a prereaction complex (PRC) from the isolated OVOC + OH radical, (2) formation of a product complex by hydrogen abstraction from the OVOC, and (3) formation of the separated products (OVOC radical and water) from the product complex (PC): | (4) |
 | (5) |
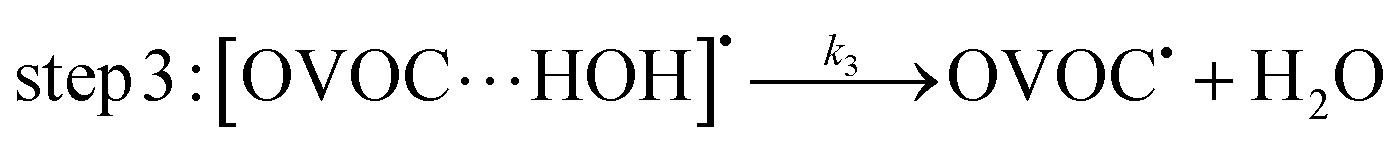 | (6) |
If a constant prereaction complex concentration is assumed (steady-state assumption,46 with k−1 + k2 ≫ k1, indicating46,47 that the removal process of the PRC is much faster than its formation and leading to d[PRC]/dt = 0), the effective rate constant for reaction (3) is given by48–51
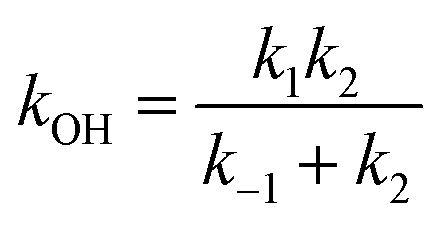 | (7) |
It is generally found that k−1 reverse rate constants for step 1 in tropospheric reactions are much larger than k2 rate constants for the irreversible unimolecular step 2 (the conditions for which k−1 ≫ k2 are discussed in detail elsewhere30,31,47–51), and kOH = k1k2/k−1 is therefore the overall rate constant for the total reaction. The underlying reason is that the system is fully equilibrated and thermalized at the high-pressure limit (equilibrium-state model is applicable,47 where k1, k−1 ≫ k2), and thus the Boltzmann equilibrium distribution can be used to describe the reactants, the PRC, and the TS in step 2. In order to check whether the steady- and equilibrium-state conditions are met, particularly if the hydrogen-abstraction TSs are energetically below the reactants, the Gibbs free energies associated with the reaction path should be calculated and their relative values verified before carrying out the calculations. For tropospheric reactions at 298.15 K, a typical Gibbs free energy profile along the reaction coordinate usually supports the following inequalities:47 ΔGR < ΔGPRC < ΔGTS and ΔGR ≫ΔGPC, where GR is the Gibbs free energy of the reactants, against which the remaining free energies are calculated (ΔGR = 0 kcal mol−1). For example, for the 10 reactions studied in this investigation the following average values are obtained: 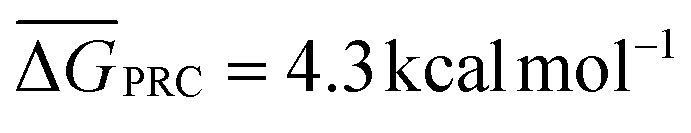 ,
, 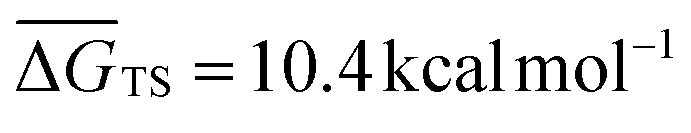 and
and 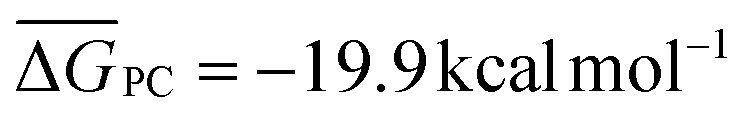 . From these values we infer that both the steady-state and equilibrium-state assumptions are satisfied47 for the reactions under study. We can consequently calculate k1/k−1 as the Keq thermal equilibrium constant for the fast pre-equilibrium between the isolated reactants and the PRC, which can be obtained using all of the usual statistical thermodynamic methods.48–51 We can calculate k2 by resorting to thermal TST and simplify the TST-based rate coefficient into kOH = Keqk2. We will utilize this approach, which has been (and still is) widely used to describe reactions between OVOCs and ˙OH in the past. Within the framework of MC-TST, this approach offers the advantage of avoiding the need to consider the sampling of PRCs, as the sum of the Boltzmann averaged partition functions of the PRC conformers cancel out in the Keqk2 product, with the same occurring to the energy values present in both exponential factors. Such a simplification is very important in terms of the applicability of the computational protocol, since the sampling procedures for prereaction complexes involving flexible VOCs and ˙OH can be very complex.43
Our latest version of the MC-TST/CTSR protocol31,35,37 incorporates the approach used by Petit and Harvey,40 where both the numerator and denominator of eqn (7) are multiplied by Keq
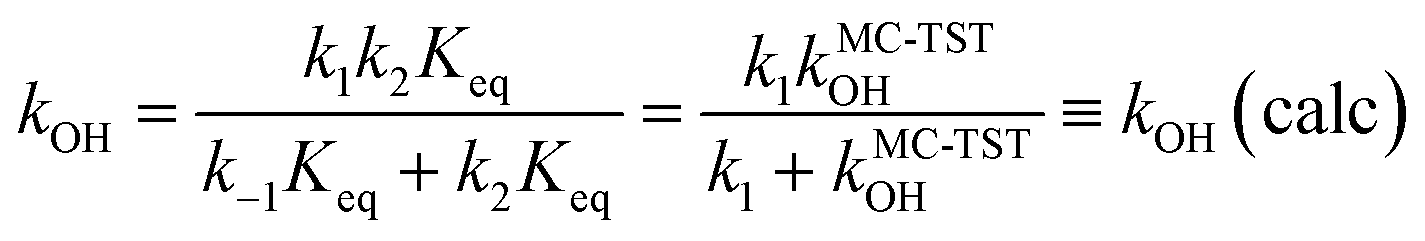 | (8) |
The branching ratio concerning hydrogen abstraction at a generic –RH abstraction site will be calculated according to
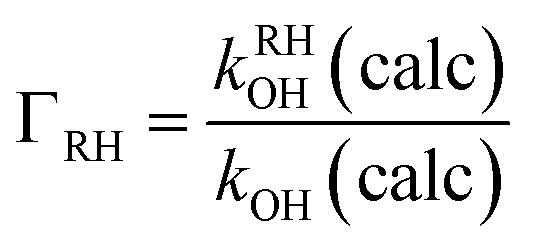 | (9) |
2.2 Computational methods
The rate coefficient in our MC-TST/CTSR protocol is calculated from the following expression,30,31,37 which stems from the derivation presented in the ESI† of ref. 42: | (10) |
 | (11) |
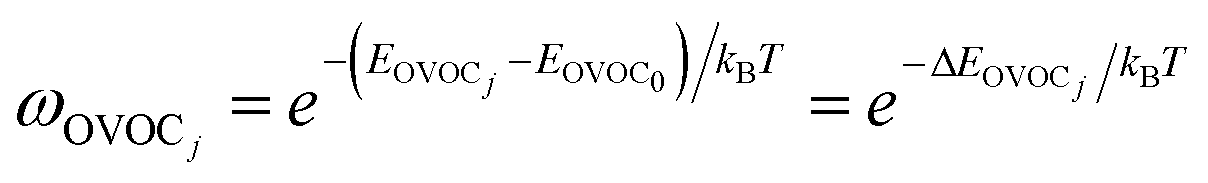
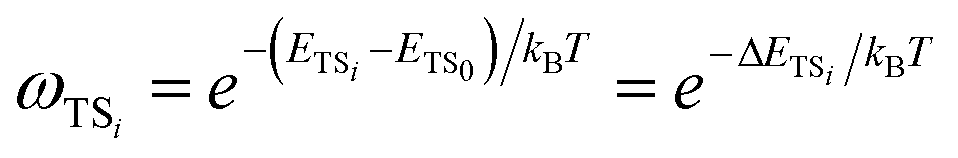 | (12) |
The σrot,OVOCj, σrot,TSi, αj and αi are the rotational symmetry numbers and reaction path degeneracy parameters of conformations OVOCj and TSi, respectively. The quantity V‡ is calculated30,39,41,42 as V‡ = ETS0 − (EOVOC0 + EOH) where the subscript 0 indicates the lowest energy conformer. Also, n0 = p/kBT is the Loschmidt number at a temperature of 298.15 K and a pressure of one atmosphere and kB and h are the Boltzmann and Planck's constants, respectively. Finally, κ(T) represents the tunneling correction which is frequently calculated at a very low computational cost30,41,42 from the asymmetric Eckart expression,56 where the forward (V1) and reverse (V2) barrier heights are obtained by performing intrinsic reaction coordinate calculations from TS0 and optimizing the respective PRC and PC at the endpoints. This approach, which we have been using in this MC-TST protocol,31 is often able to reproduce expensive and robust multidimensional transmission coefficients, such as the small curvature tunneling correction.57 This is mainly due to favorable error cancellation effects in the Eckart approximation, whereby the underestimation of the tunneling probability (neglect of corner-cutting58–60) is compensated by an overestimation of the tunneling probability (rigidity of the asymmetrical Eckart function produces a potential energy barrier which is too narrow59–63). In the case of lower temperatures, however, the overestimation of the Eckart tunneling probability may be too drastic, resulting in an overestimation of κ(T) and of the rate coefficient itself. As a more robust but still affordable alternative to the Eckart model, we have performed extra calculations of κ(T) through the use of semiclassical TST (SCTST).64–67 In particular, we have used an improved one-dimensional model68 (iSCTST) that besides including the anharmonicity of the reaction mode it also correctly includes the energetic information about the PRC and PC, thus allowing a qualitatively correct representation of deep tunneling which was absent in the original formulation of SCTST. For a molecule with N atoms and with F = 3N − 6 vibrational degrees of freedom, the xkl anharmonic constant for the reaction mode in this one-dimensional model can be obtained by recognizing that the transition state frequency for the reaction coordinate (usually taken as mode F) is imaginary (ωF = i![[small omega, Greek, macron]](https://www.rsc.org/images/entities/i_char_e0da.gif) F) and that the reaction mode is assumed not to be coupled with the remaining vibrational (spectator) modes in the TS, with the latter being treated harmonically. Considering these assumptions, one can obtain the xFF value for the anharmonic constant of the reaction mode as66
F) and that the reaction mode is assumed not to be coupled with the remaining vibrational (spectator) modes in the TS, with the latter being treated harmonically. Considering these assumptions, one can obtain the xFF value for the anharmonic constant of the reaction mode as66
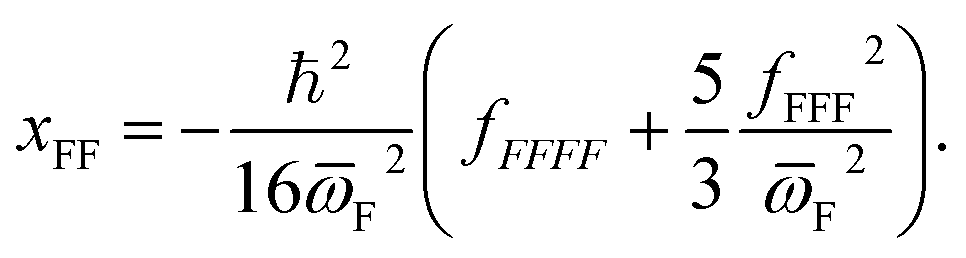 | (13) |
Similarly, a barrier height correction parameter (G0) should be included in the calculation of V1 and V269
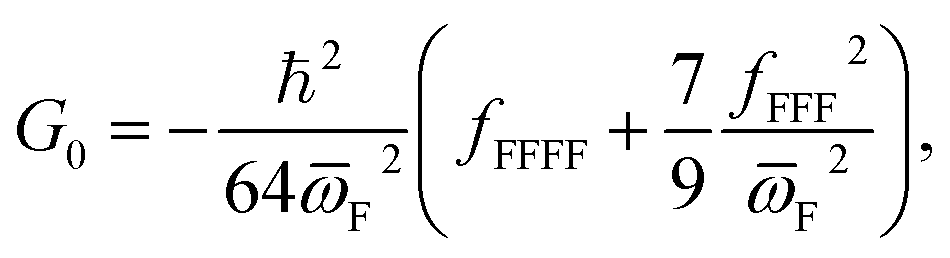 | (14) |
 | (15) |
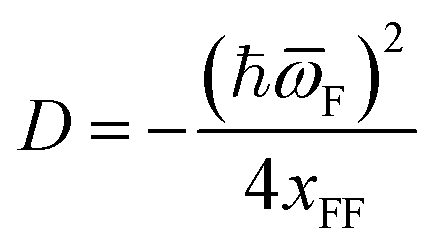
F, V1 and V2 (which are also required by the asymmetric Eckart model), Wagner's approach then requires the calculation of fFFF and fFFFF in order to obtain xFF, G0 and D. In SCTST, the anharmonic data is calculated through second-order vibrational perturbation theory (VPT2), which can be routinely70 employed in Gaussian71 for extraction of fFFF and fFFFF. Although we have performed full VPT2 calculations for each TS0 in Gaussian, the data required for a one-dimensional case can be obtained with less computational effort with just a few single point energy calculations.72,73
To determine the remaining parameters of eqn (10), electronic structure calculations were performed with the GAMESS package.74 The calculations were carried out using our reformulated protocol,31 which includes optimizing minima and TSs at the M08-HX/pcseg-2 level,75,76 with the value of V‡ being refined with single-point energy calculations at the M08-HX/apcseg-2 level.
A crucial issue in solving eqn (10) is related to the reactant and TS conformer sampling procedure. The reactant conformers are calculated via the open source CONFAB,77 the best performing freely available knowledge-based conformer generation tool.78 However, and because CONFAB is based on force fields, there may be occasions when some low- and high-energy conformers79 may be overlooked. Such a problem could be circumvented by targeting a near-complete description of the rotameric space with more robust and computational demanding screening methods,42,43,80,81 but an increase in molecular size quickly renders this solution computationally ineffective, which is the opposite of what this computational protocol tries to achieve.
It should also be added that the CTSR procedure does not guarantee that the lowest energy TS is found. Nevertheless, the probability of doing so can be augmented by increasing the number of generated geometries and/or by replacing the intermediate PM3 step by optimizations at higher levels of theory. An estimation of the success rate of the CTSR sampling procedure would require a benchmark study on a chosen set of molecules, which would imply a very thourough and extensive mapping of the PESs associated to such OH abstraction reactions. This is an extremely difficult and laborious task which, to our knowledge, has not yet been done. However, we can state that (1) we are not aware of theoretical atmospheric studies concerning OH-initiated oxidation reactions that report such a high number of TSs in molecules having a similar size to the ones studied in this work and (2) the CTSR procedure is a considerable improvement37 to the simplistic method that we were using in previous versions of the MC-TST protocol.30,31
Naturally, one way to evaluate the impact of these approximations is to verify the quality of the rate constants calculated by the MC-TST/CTSR protocol, which can be considered an improved version of our initial protocol.30,31 The CTSR approach is still relatively new37 and only two MC-TST/CTSR calculated rate constants have been compared with experimental results, both agreeing with the experimental rate coefficient36,37 within a factor of two. In addition, it is interesting to note, since error cancellation is an important and sometimes unpredictable factor in TST calculations,40,42,82–84 that the MC-TST/CTSR rate constant of the reaction between ˙OH and 2-butanethiol37 considering a full description of the reactant conformers is actually farther from the recommended experimental value than the MC-TST/CTSR rate constant based on the CONFAB approach. Considering the fact that it is difficult to predict the variability in error cancellation effects in a typical TST calculation, we make an effort to address this issue by introducing error bars as part of our approach.31
More details about the theoretical background behind eqn (10) are described in previous publications,30,31,37–44 and these also discuss the necessary steps to calculate the parameters described above.30,31,35,37 The present work focuses on the quality of the MC-TST/CTSR theoretical results for the 10 case studies for reaction (3), and the interested reader can consult the previous references for technical details.
3 Results and discussion
Experimental information for all 10 rate constants and respective Arrhenius fits of the form k(T) = A![[thin space (1/6-em)]](https://www.rsc.org/images/entities/char_2009.gif) exp(−B/T) were gathered from a recent database85 which compiles rate coefficients for the gas-phase reactions of organic compounds with OH, Cl, NO3 radicals and O3.
exp(−B/T) were gathered from a recent database85 which compiles rate coefficients for the gas-phase reactions of organic compounds with OH, Cl, NO3 radicals and O3.
To assess the deviation between the experimental and calculated rate constants, we will use86 a factor ρ defined by
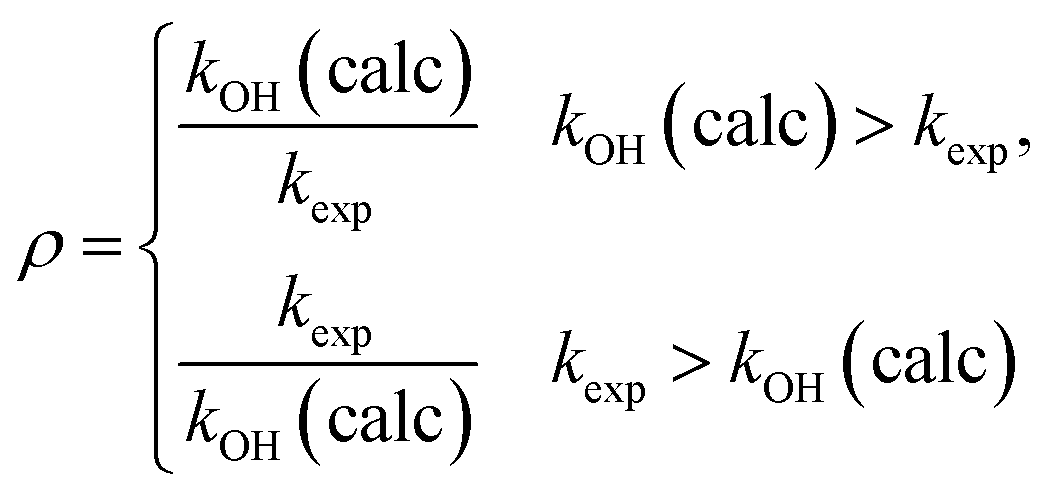 | (16) |
This is always larger than one and allows a quantification of the average 〈ρ〉 deviation.
For each compound we have extended our MC-TST calculations to a temperature interval relevant for atmospheric conditions in the troposphere,12,85,87 namely 230 ≤ T/K ≤ 320, and fitted the corresponding data to an Arrhenius–Kooij equation85,88,89 of the form k(T) = Aexp(−B/T)(T/298)n. This provides the necessary flexibility to model the curvature of the data points caused by the quantum tunneling factor in eqn (10) and the kinetic model that includes the formation of the prereactant complex85,90 in eqn (8). The rate constants have been assigned error bars by propagating the error associated with the barrier heights,34 which are frequently the largest source of uncertainty in a rate constant calculation.31 In a recent work,34 the error bars were estimated by assessing the behavior of a M08-HX-based model chemistry against three specific OH hydrogen transfer reactions of the HTBH38/08 database91 that bared a resemblance to the reactions under analysis.31,34 Such a procedure lead to a mean unsigned error (MUE) of 0.6 kcal mol−1, which was taken92 as the uncertainty (σ‡V) associated to V‡ and propagated accordingly. However, in the present work, we have benchmarked our M08-HX/apcseg-2//M08-HX/pcseg-2 barrier heights against corresponding high-level coupled-cluster calculations, namely CCSD(T)/cc-pVTZ//M08-HX/pcseg-2. Such a comparison between model chemistries yielded a MUE of approximately 0.3 kcal mol−1, which was used92 as σ‡V for the present 10 barrier heights: V‡ ± 0.3 kcal mol−1. This value is in line with the well known fact that the M08-HX functional performs well in describing hydrogen abstraction barrier heights, yielding MUE values of 1.00 and 0.73 kcal mol−1 for the DBH76 and HTBH38 data sets involving this particular type of barrier heights.75 The coupled-cluster calculations were performed with Gaussian71 and the details of this analysis can be found in Section 3.6.
Furthermore, the temperature interval used for plotting the experimental Arrhenius curves corresponds to the intersection between our selected Tcalc = [230, 320] temperature interval and the temperature interval identified in ref. 85 for each particular OVOC, Texp = [Tmin, Tmax]: Tplotexp = Tcalc ∩ Texp = [T1,T2].
For each OVOC with experimental Arrhenius parameters we can define an sOVOC similarity index based on T1 and T2 temperatures:
| sOVOC = |Δ(T1) − Δ(T2)|−1 | (17) |
| Δ(Tx) = logkexp(Tx) − logkAK(Tx), | (18) |
Our calculated branching ratios will be compared with the results given from ref. 13, which were derived using the SARs from Kwok and Atkinson.93 The SAR approach is “necessarily subject to significant uncertainty” and is used13 “to provide a qualitative measure of the reactivity at various sites”. While the SARs from Kwok and Atkinson perform well for simple hydrocarbons over large temperature ranges, they are much less accurate for OVOCs, where the “agreement between experimental rate data and values calculated using the SAR method for reactions of OH with compounds containing oxygenated functional groups is in general rather poor”.9 One of the reasons for such a poor agreement is suggested to lie in the difficulty of incorporating long-range activating effects of oxygenated functional groups in the SAR models.9
Note that the results for both the rate constants at 298.15 K and respective branching ratios will be presented with the protocol's usual procedure of calculating V‡ at the M08-HX/apcseg-2//M08-HX/pcseg-2 level of theory along with κ(T) being obtained with the asymmetric Eckart model.31
3.1 Hydrofluoroalcohols
Of the five families of studied OVOCs, hydrofluoroalcohols were the only one that required adjustments to the CTSR procedure. The CTSR code first randomly generates ˙OH-molecule structures which are then subjected to constraints targeting an optimization of TSs at the PM3 level of theory. The three constraints used throughout this work were: (1) the distance between the ˙OH oxygen atom and the hydrogen atom under attack must lie in the [1.2, 1.4] Å interval; (2) the distance between the ˙OH oxygen atom and all reactants' non-hydrogen atoms must be greater than 1.70 Å and (3) the distance between the ˙OH hydrogen atom and all reactants' hydrogen atoms must be greater than 0.70 Å. Structures are then generated by the CTSR code and subsequently used as input geometry in PM3 saddle-point optimizations. Next, the converged PM3 calculations are used as starting structures for the saddle-point optimizations at the M08-HX/pcseg-2 level. This procedure, however, did not lead to the discovery of any TSs regarding the ˙OH attack on the –OH group at the PM3 level, even if the numerical value of the constraints were changed. Consequently, we then employed a more robust and computationally more demanding procedure that used MP2/cc-pVDZ saddle-point optimizations instead of the very fast PM3 step. The only altered constraint was the first, where the distance between the ˙OH oxygen atom and the hydrogen atom under attack was limited to the interval [1.05, 1.35] Å. This modification in the procedure led to the finding of several TSs involving an attack on the –OH group.We should emphasize that the choice of using the MP2/cc-pVDZ level was preceded by an initial test with the more obvious M08-HX/pcseg-1 level of theory. However, the latter approach yielded less TSs, with the optimization procedure often showing convergence difficulties. It should be emphasized that the use of the MP2/cc-pVDZ procedure represents an ad hoc fix for this particular system and there may be more cases where the original CTSR procedure37 needs to be modified.
 | (19) |
The calculated branching ratios for the two abstraction sites are ΓCH2 = 99% and ΓOH = 1%, which are significantly different from the SAR predictions of ΓCH2 = 58% and ΓOH = 42%. The low fraction of reactions leading to abstraction from the –OH group is due to the fact that the lowest energy TS corresponding to an abstraction from the –OH group is 1.87 kcal mol−1 above TS0, which correspons an hydrogen abstraction from the –CH2 group. The corresponding V‡ barrier height is 1.82 kcal mol−1.
The fit to the Arrhenius–Kooij equation provides k(298.15 K) = (8.8 ± 3.3) × 10−14 cm3 molecule−1 s−1, while the experimental results85,94 yield an Arrhenius expression of k(T) = 1.28 × 10⁻¹²exp(−748/T) cm3 molecule−1 s−1 valid in the [250,430] K temperature interval. The experimental recommended rate constant at 298.15 K is k(298.15 K) = (1.04 ± 0.21) × 10−13 cm3 molecule−1 s−1, which leads to ρ ≈ 1.2. The kOH(calc) points in the 230 ≤ T/K ≤ 320 temperature interval are shown in Fig. 1, together with the Arrhenius–Kooij fit to those points and the experimental Arrhenius fit given above.
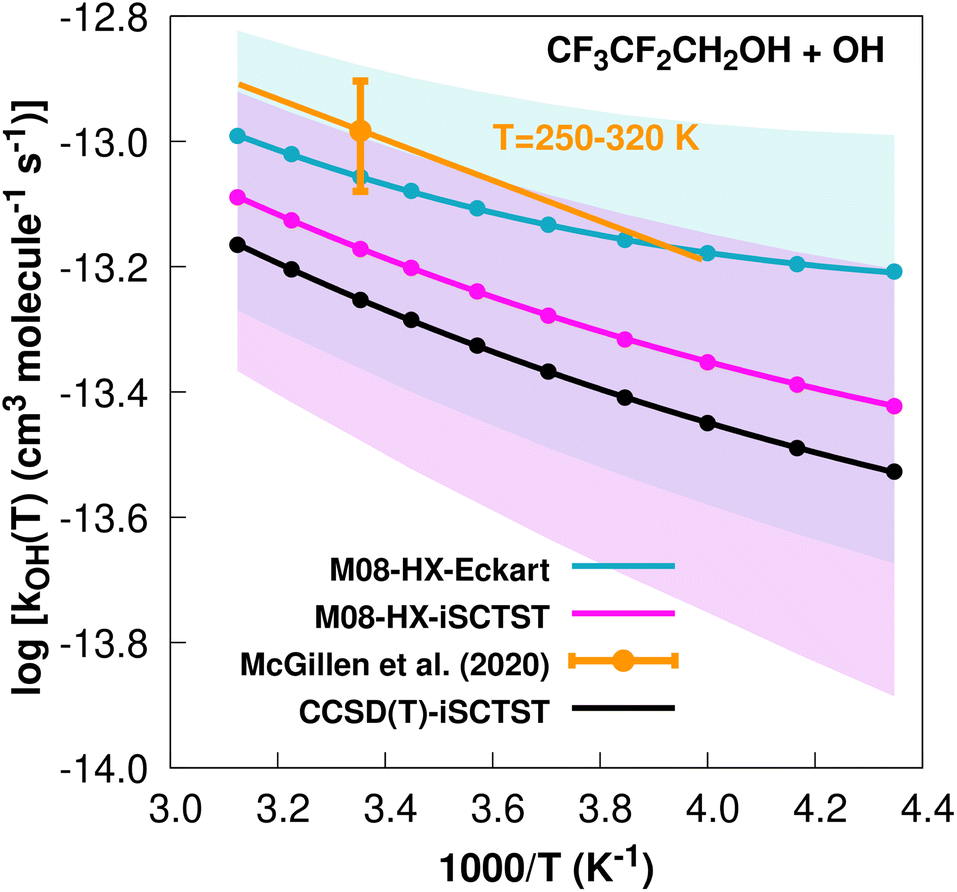 | ||
| Fig. 1
k
OH(calc) data points (solid blue, purple and black circles) and respective Arrhenius–Kooij fits (solid blue, purple and black lines) with σ error bars (shaded blue and purple areas) for the CF3CF2CH2OH + ˙OH reaction in the Tcalc = [230, 320] K temperature interval. Standard Arrhenius fit (solid orange line) based on experimental data85 in the Tplotexp = [250,320] K temperature interval together with the recommended experimental rate coefficient at 298.15 K (color online). | ||
 | (20) |
The calculated branching ratios for the three abstraction sites are: ΓCHF2 = 5%, ΓCH2 = 94% and ΓOH = 1%, which can be compared with the SAR predictions: ΓCHF2 = 3%, ΓCH2 = 25% and ΓOH = 72%. Note that the SAR predictions of ΓCHF2 = 7%, ΓCH2 = 30% and ΓOH = 69% given in ref. 13 are incorrect, since they do not sum up to 100%. The large MC-TST/CTSR result of ΓCH2 = 94% is explained by the fact that the vast majority of the lowest energy TSs correspond to the ˙OH attack at the –CH2 group. Of the 54 TSs obtained via the CTSR procedure, the 22 lowest energy ones correspond to an attack of the OH radical to the –CH2 and –CHF2 groups. The lowest energy TSs corresponding to the ˙OH attack at the –CHF2 and –OH groups are 0.52 and 2.13 kcal mol−1 above TS0, respectively. The V‡ barrier height is 0.80 kcal mol−1 and concerns an hydrogen abstraction from the –CH2 group.
The fit to the Arrhenius–Kooij equation yields k(298.15 K) = (4.4 ± 1.7) × 10−13 cm3 molecule−1 s−1, while the experimental results85,95 gives an Arrhenius expression with k(T) = 1.31 × 10⁻¹²exp(−605/T) cm3 molecule−1 s−1 valid in the [263,358] K temperature interval. The experimental recommended rate constant at 298.15 K is k(298.15 K) = (1.85 ± 0.70) × 10−13 cm3 molecule−1 s−1, which leads to ρ ≈ 2.4. The kOH(calc) points calculated in the 230 ≤ T/K ≤ 320 temperature interval are shown in Fig. 2, together with the Arrhenius–Kooij fit to those points and the experimental Arrhenius fit given above.
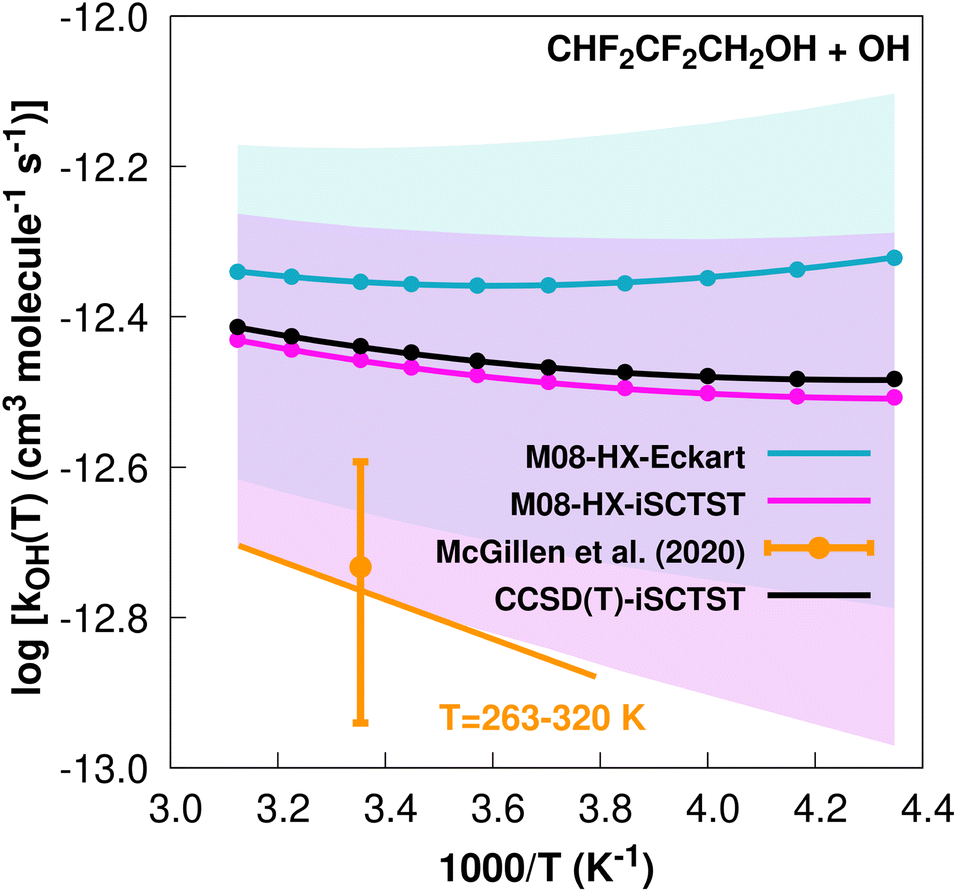 | ||
| Fig. 2
k
OH(calc) data points (solid blue, purple and black circles) and respective Arrhenius–Kooij fits (solid blue, purple and black lines) with σ error bars (shaded blue and purple areas) for the CHF2CF2CH2OH + ˙OH reaction in the Tcalc = [230, 320] K temperature interval. Standard Arrhenius fit (solid orange line) based on experimental data85 in the Tplotexp = [263,320] K temperature interval together with the recommended experimental rate coefficient at 298.15 K (color online). | ||
Fig. 1 and 2 show that the CHF2CF2CH2OH+˙OH reaction is significantly slower than the CF3CF2CH2OH + ˙OH reaction. Antiñolo et al.95 suggested that the difference between the rate constants may be due to an important role of hydrogen abstraction at the –CHF2 site or a long-range inductive effect of the extra F atom in CF3CF2CH2OH responsible for deactivating the hydrogen abstraction in the –CH2 group. Our results clearly point to the latter hypothesis for two reasons. First, our calculated value of ΓCHF2 = 5% indicates that the hydrogen abstraction at the –CHF2 group has only a minor contribution to the final rate constant. Second, our calculations show that the V‡ barrier height, which is a major factor determining the reactivity,30,32–34 is approximately 1 kcal mol−1 lower for the CHF2CF2CH2OH + ˙OH reaction. This strongly suggests that the chemical environment of the –CH2 group for both sets of reactants and TSs may in fact be different, for example involving intramolecular hydrogen bonds for reactants and TSs, where a bond critical point96 is likely to be found:97,98 C–H⋯F (reactants) and C–H⋯O, O–H⋯O and O–H⋯F (TSs). One can argue that the extra F atom in CF3CF2CH2OH increases the possibility of forming intramolecular hydrogen bonds which could lead to a larger difference in covalency (λ descriptor of ref. 34, linearly correlated with the size of the barrier heights) between these possible intramolecular hydrogen bonds in TS0 and OVOC0 of the CF3CF2CH2OH + ˙OH reaction with respect to the CHF2CF2CH2OH + ˙OH reaction, reflecting an increasing difficulty in breaking these bonds.
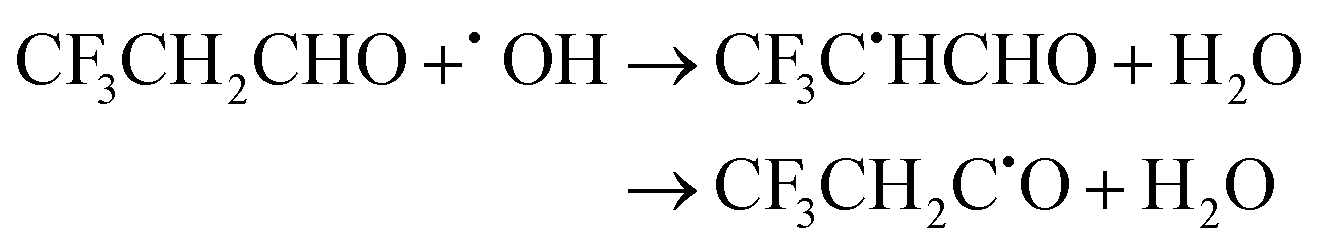
3.2 Hydrofluoroaldehydes
| CF3CF2CHO + ˙OH → CF3CF2C˙O + H2O | (21) |
The fit to the Arrhenius–Kooij equation yields k(298.15 K) = (6.8 ± 0.7) × 10−13 cm3 molecule−1 s−1, with the experimental results13,85 yielding an Arrhenius expression of k(T) = 2.05 × 10⁻¹²exp(−378/T) cm3 molecule−1 s−1 valid in the [252,373] K temperature interval. The experimental recommended rate constant at 298.15 K is k(298.15 K) = (5.8 ± 0.9) × 10−13 cm3 molecule−1 s−1, which leads to ρ ≈ 1.2. The kOH(calc) points calculated in the 230 ≤ T/K ≤ 320 temperature interval are shown in Fig. 3, together with the Arrhenius–Kooij fit to those points and the experimental Arrhenius fit given above.
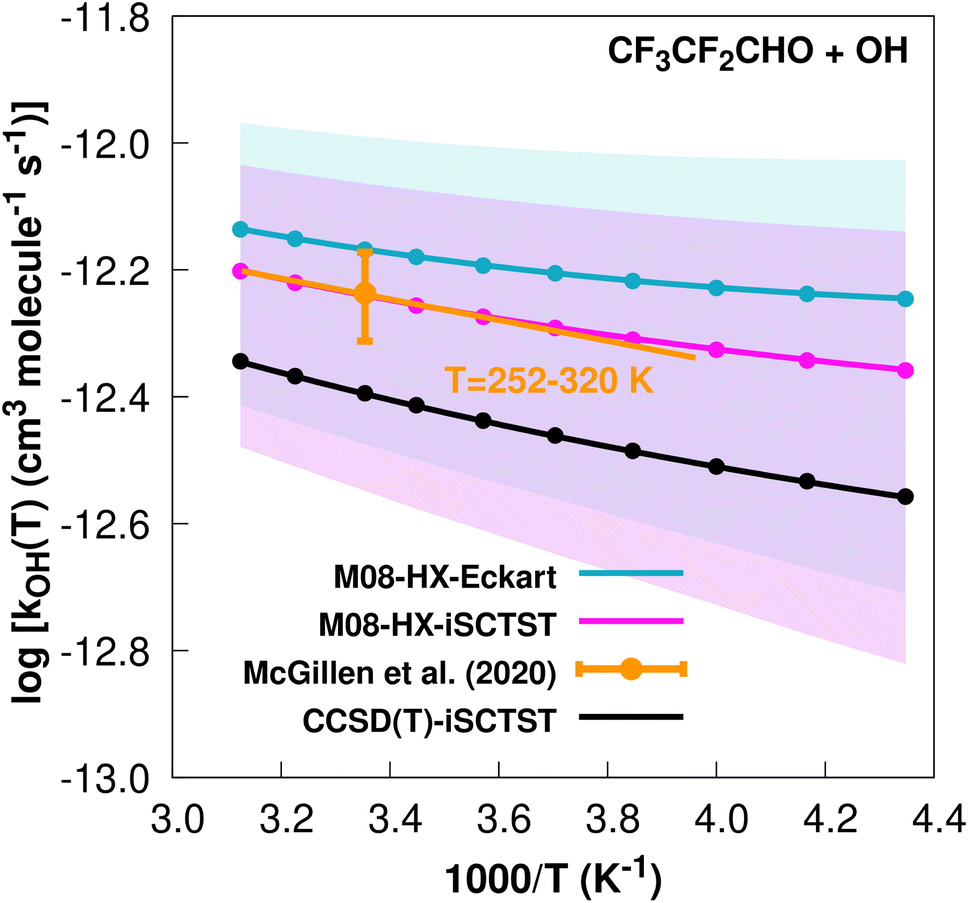 | ||
| Fig. 3
k
OH(calc) data points (solid blue, purple and black circles) and respective Arrhenius–Kooij fits (solid blue, purple and black lines) with σ error bars (shaded blue and purple areas) for the CF3CF2CHO + ˙OH reaction in the Tcalc = [230, 320] K temperature interval. Standard Arrhenius fit (solid orange line) based on experimental data85 in the Tplotexp = [252,320] K temperature interval together with the recommended experimental rate coefficient at 298.15 K (color online). | ||
 | (22) |
The calculated branching ratios for the two abstraction sites are: ΓCH2 = 0% and ΓCHO = 100%, which agree with the SAR predictions. Our MC-TST/CTSR results for these branching ratios arise from the fact that the six lowest TSs refer to hydrogen abstractions at the –CHO group within the energy interval of 0 ≤ ΔETSi ≤ 0.54 kcal mol−1, while the remaining six TSs correspond to hydrogen abstractions at the –CH2 group in the energy interval of 4.56 ≤ ΔETSi ≤ 5.46 kcal mol−1. The V‡ barrier height is −0.38 kcal mol−1, but the fact that it is slightly submerged below the reactants should not constitute a problem, since this is a well defined TS with ZPE-corrected energies of 1.5 and 30 kcal mol−1 above the PRC and PC, respectively.
The fit to the Arrhenius–Kooij equation yields k(298.15 K) = (3.5 ± 0.4) × 10−12 cm3 molecule−1 s−1, while the experimental results85,94 yield an Arrhenius expression of k(T) = 8.34 × 10⁻¹²exp(−334/T) cm3 molecule−1 s−1 valid in the [263,371] K temperature interval. The experimental recommended rate constant at 298.15 K is k(298.15 K) = (2.7 ± 1.4) × 10−12 cm3 molecule−1 s−1, which leads to ρ ≈ 1.3. The kOH(calc) points calculated in the 230 ≤ T/K ≤ 320 temperature interval are shown in Fig. 4, together with the Arrhenius–Kooij fit to those points and the experimental Arrhenius fit given above.
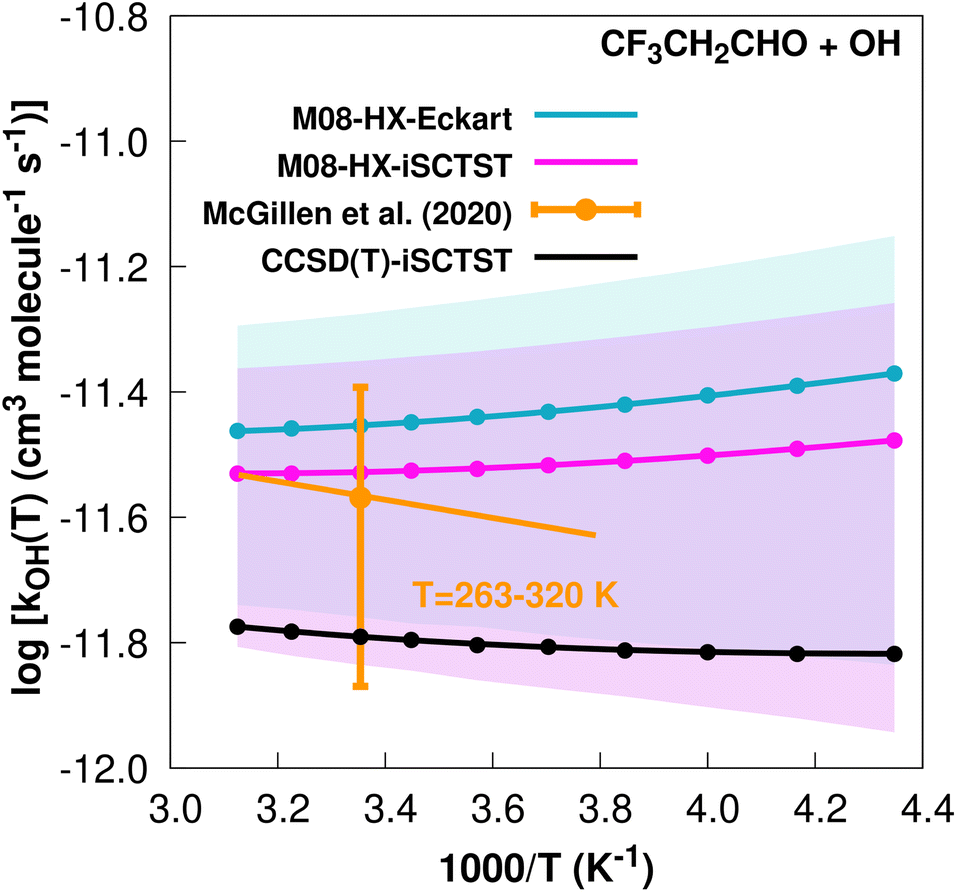 | ||
| Fig. 4
k
OH(calc) data points (solid blue, purple and black circles) and respective Arrhenius–Kooij fits (solid blue, purple and black lines) with σ error bars (shaded blue and purple areas) for the CF3CH2CHO + ˙OH reaction in the Tcalc = [230, 320] K temperature interval. Standard Arrhenius fit (solid orange line) based on experimental data85 in the Tplotexp = [263,320] K temperature interval together with the recommended experimental rate coefficient at 298.15 K (color online). | ||
It is worthwhile mentioning that the higher value of the rate constant for the CF3CH2CHO + ˙OH reaction with respect to the CF3CF2CHO + ˙OH reaction originates mainly in the different values of V‡, with the former reaction having a V‡ value 0.93 kcal mol−1 lower than the latter CF3CF2CHO+˙OH reaction. Similarly to the two hydrofluoroalcohols above, such behaviour suggests the existence of a different chemical environment at the corresponding –CHO groups, where the common explanation considers a long range destabilizing inductive effect of the –CF2 group in these TSs, thereby decreasing the reactivity towards the OH radical in the CF3CF2CHO hydrofluoroaldehyde. More generally, and as suggested above, the two extra F atoms in this system increase the number of possible intramolecular hydrogen bonds, which could be increasing the λ descriptor34 and therefore, according to this model, would explain a higher value of V‡ for the CF3CF2CHO + ˙OH reaction.
3.3 Hydrofluoroesters
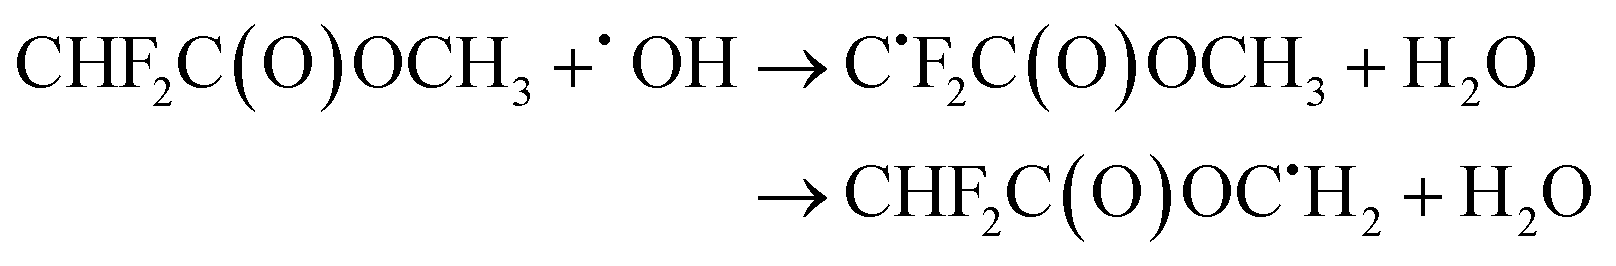 | (23) |
The calculated branching ratios for the two abstraction sites are: ΓCHF2 = 64% and ΓCH3 = 36%, which are considerably different from the SAR predictions of ΓCHF2 = 15% and ΓCH3 = 85%. This is an interesting result, considering that 13 out of the 20 TSs found with the CTSR method concern OH radical attacks at the CH3 group and that they account for the four lowest energy TSs. The next seven TSs correspond to reactions at the CHF2 group, with the associated higher-valued partition functions compensating for their lower Boltzmann factors, thus generating a higher value for ΓCHF2. The lowest energy TS corresponding to the ˙OH attack at the –CHF2 group is 0.40 kcal mol−1 above TS0. The V‡ barrier height is 1.68 kcal mol−1.
The fit to the Arrhenius–Kooij equation yields k(298.15 K) = (4.7 ± 1.4) × 10−14 cm3 molecule−1 s−1, but the only available experimental result13,85 is the rate coefficient at 298.15 K: k(298.15 K) = (1.33 ± 0.33) × 10−13 cm3 molecule−1 s−1, which leads to ρ ≈ 2.8. The kOH(calc) points calculated in the 230 ≤ T/K ≤ 320 temperature interval are shown in Fig. 5, together with the Arrhenius–Kooij fit to those points and the experimental rate constant at 298.15 K.
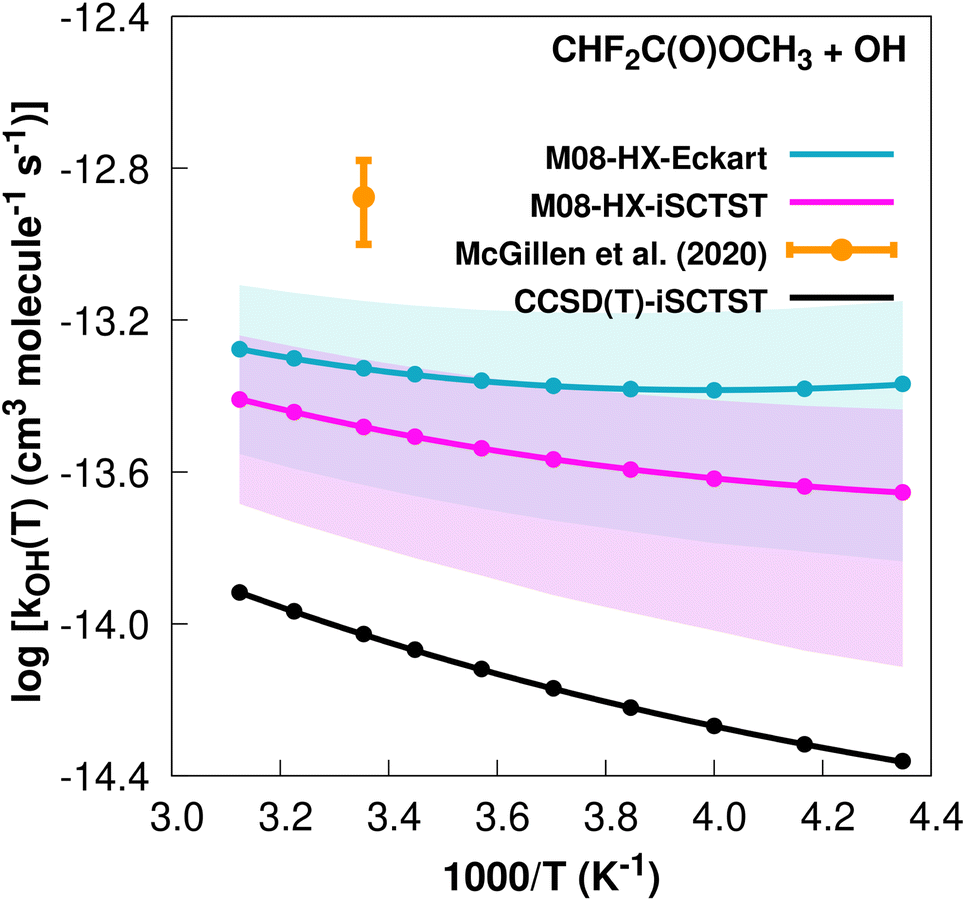 | ||
| Fig. 5 k OH(calc) data points (solid blue, purple and black circles) and respective Arrhenius–Kooij fits (solid blue, purple and black lines) with σ error bars (shaded blue and purple areas) for the CHF2C(O)OCH3 + ˙OH reaction in the Tcalc = [230, 320] K temperature interval. Solid orange circle shows the recommended value85 for the rate constant at 298.15 K (color online). | ||
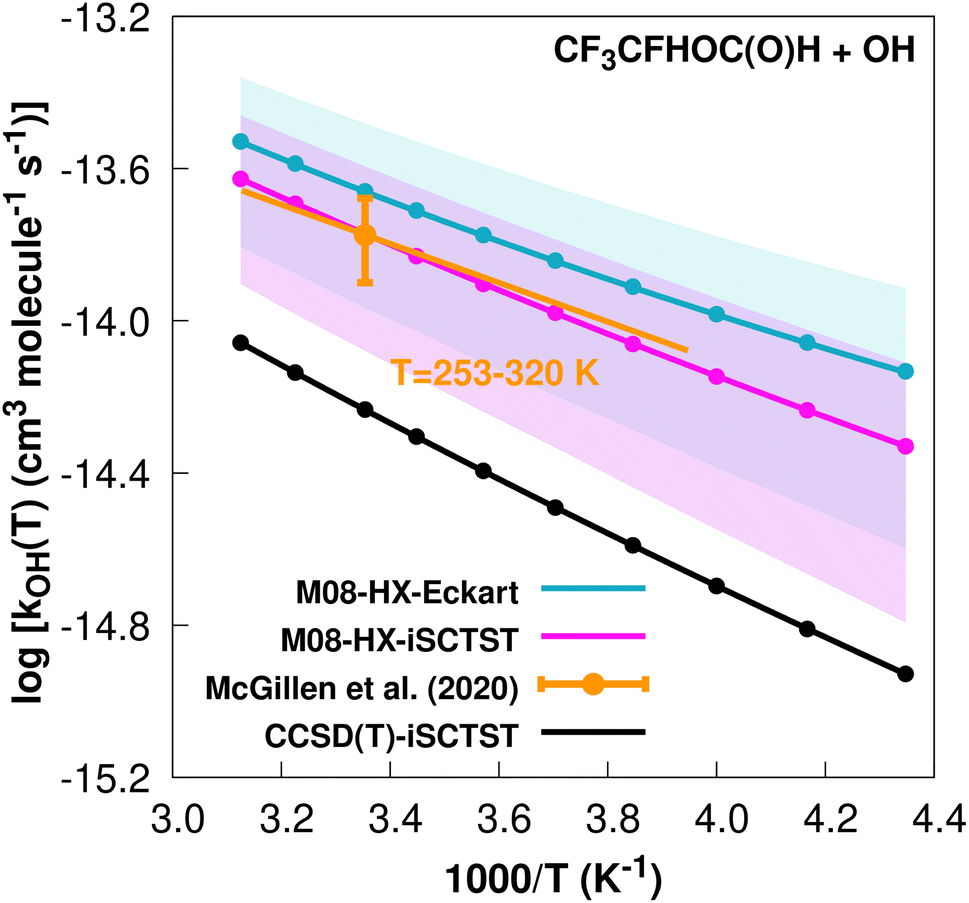
 | (24) |
The calculated branching ratios for the two abstraction sites are ΓCFH = 5% and ΓOC(O)H = 95% are similar to the SAR predictions of ΓCFH = 29% and ΓOC(O)H = 71%. The V‡ barrier height is 2.79 kcal mol−1 and corresponds to a hydrogen abstraction from the OC(O)H group. Interestingly, within the four lowest energy TSs, the second lowest corresponds to an OH radical attacking the –CFH group with its energy being only 0.04 kcal mol−1 above TS0. However, its partition function is one order of magnitude below the ones associated to the other three TSs, which is the main factor behind the difference in the branching ratios.
The fit to the Arrhenius–Kooij equation yields k(298.15 K) = (2.2 ± 0.6) × 10−14 cm3 molecule−1 s−1, while the experimental results13,85 yield an Arrhenius expression of k(T) = 8.84 × 10⁻¹³exp(−1181/T) cm3 molecule−1 s−1 valid in the [253,328] K temperature interval. The experimental recommended rate constant at 298.15 K is given by k(298.15 K) = (1.68 ± 0.42) × 10−14 cm3 molecule−1 s−1, which leads to ρ ≈ 1.3. The kOH(calc) points calculated in the 230 ≤ T/K ≤ 320 temperature interval are shown in Fig. 6, together with the Arrhenius–Kooij fit to those points and the experimental Arrhenius fit given above.
 | ||
| Fig. 6
k
OH(calc) data points (solid blue, purple and black circles) and respective Arrhenius–Kooij fits (solid blue, purple and black lines) with σ error bars (shaded blue and purple areas) for the CF3CFHOC(O)H + ˙OH reaction in the Tcalc = [230, 320] K temperature interval. Standard Arrhenius fit (solid orange line) based on experimental data85 in the Tplotexp = [253,320] K temperature interval together with the recommended experimental rate coefficient at 298.15 K (color online). | ||
3.4 Hydrofluoroethers
 | (25) |
The calculated branching ratios for the two abstraction sites are: ΓCH2 = 65% and ΓCHF2 = 35%, which are almost identical to the SAR predictions of ΓCH2 = 60% and ΓCHF2 = 40%. The higher predominance of ΓCH2 in this case arises from the seven lowest energy TSs corresponding to OH radical attack on the –CH2 group, with the V‡ barrier height having a value of 3.37 kcal mol−1. The lowest energy TS corresponding to the ˙OH attack at the –CHF2 group is 0.55 kcal mol−1 above TS0.
The fit to the Arrhenius–Kooij equation yields k(298.15 K) = (2.5 ± 1.2) × 10−14 cm3 molecule−1 s−1, while the experimental results85,99 yield an Arrhenius expression of k(T) = 2.90 × 10⁻¹²exp(−1660/T) cm3 molecule−1 s−1 valid in the [253,460] K temperature interval. The experimental recommended rate constant at 298.15 K is given by k(298.15 K) = (1.1 ± 0.2) × 10−14 cm3 molecule−1 s−1, which leads to ρ ≈ 2.3. The kOH(calc) points calculated in the 230 ≤ T/K ≤ 320 temperature interval are shown in Fig. 7, together with the Arrhenius–Kooij fit to those points and the experimental Arrhenius fit given above.
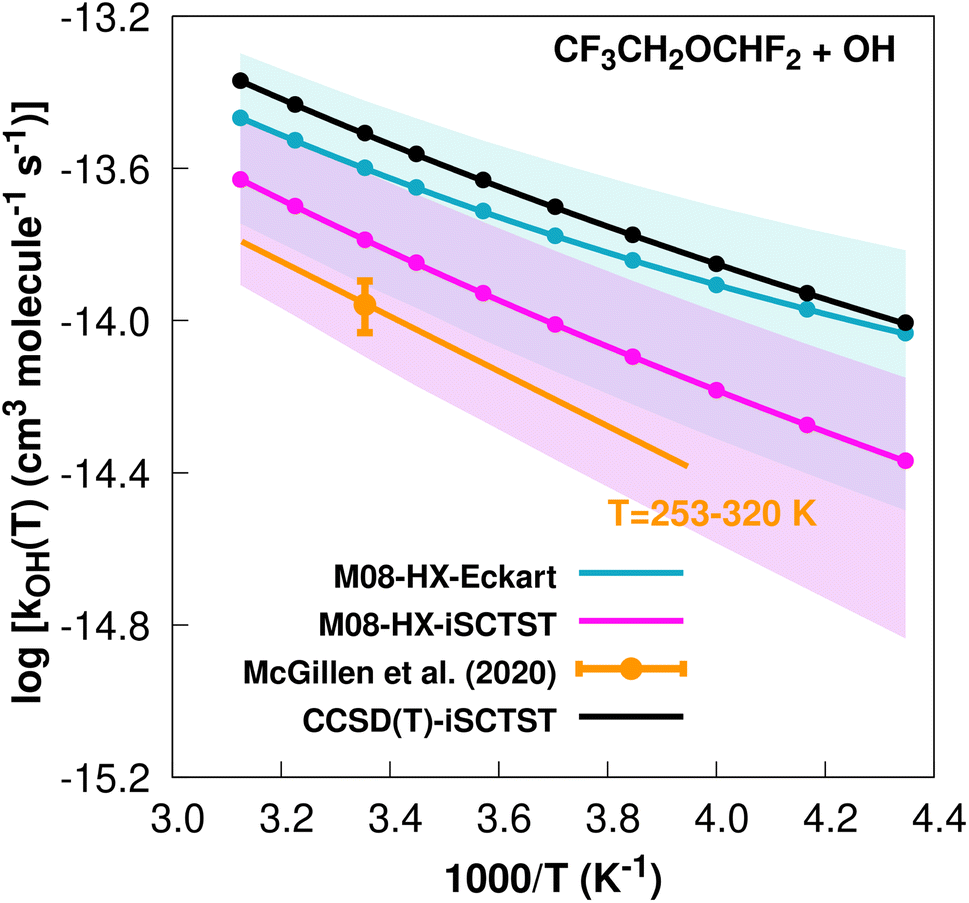 | ||
| Fig. 7
k
OH(calc) data points (solid blue, purple and black circles) and respective Arrhenius–Kooij fits (solid blue, purple and black lines) with σ error bars (shaded blue and purple areas) for the CF3CH2OCHF2 + ˙OH reaction in the Tcalc = [230, 320] K temperature interval. Standard Arrhenius fit (solid orange line) based on experimental data85 in the Tplotexp = [253,320] K temperature interval together with the recommended experimental rate coefficient at 298.15 K (color online). | ||
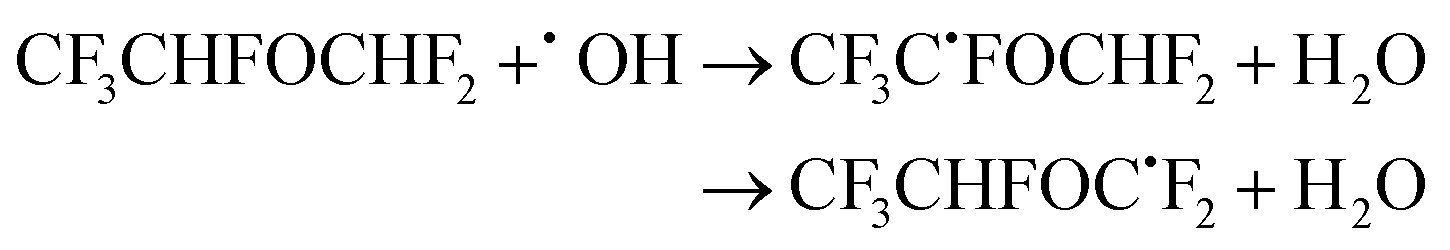 | (26) |
The calculated branching ratios for the two abstraction sites are: ΓCHF = 67% and ΓCHF2 = 33%, which almost coincide with the SAR predictions of ΓCHF = 60% and ΓCHF2 = 40%. A total of 13 TSs are found, of which four correspond to OH radical attack on the –CHF2 group, with two of these being the highest energy TSs. Because the 13 Boltzmann-weighted partition functions have the same order of magnitude, the nine vs. four TSs tip the balance in favour of ΓCHF The V‡ barrier height is 4.03 kcal mol−1 and concerns an hydrogen abstraction from the –CHF group.
The fit to the Arrhenius–Kooij equation yields k(298.15 K) = (4.4 ± 1.6) × 10−15 cm3 molecule−1 s−1, while the experimental results85,99 yield an Arrhenius expression of k(T) = 8.15 × 10⁻¹³exp(−1570/T) cm3 molecule−1 s−1 valid in the [241,298] K temperature interval. The experimental recommended rate constant at 298.15 K is given by k(298.15 K) = (4.2 ± 0.6) × 10−15 cm3 molecule−1 s−1, which leads to ρ ≈ 1.0. The kOH(calc) points calculated in the 230 ≤ T/K ≤ 320 temperature interval are shown in Fig. 8, together with the Arrhenius–Kooij fit to those points and the experimental Arrhenius fit given above.
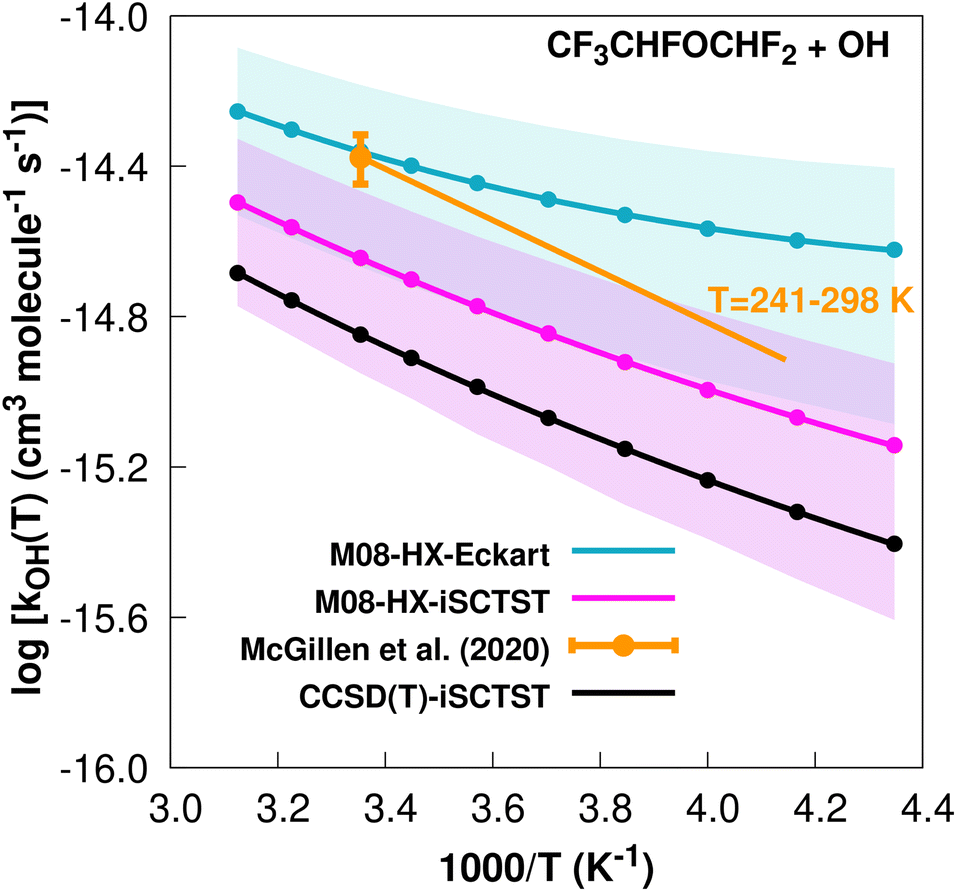 | ||
| Fig. 8
k
OH(calc) data points (solid blue, purple and black circles) and respective Arrhenius–Kooij fits (solid blue, purple and black lines) with σ error bars (shaded blue and purple areas) for the CF3CHFOCHF2 + ˙OH reaction in the Tcalc = [230, 320] K temperature interval. Standard Arrhenius fit (solid orange line) based on experimental data85 in the Tplotexp = [241,298] K temperature interval together with the recommended experimental rate coefficient at 298.15 K (color online). | ||
3.5 Hydrofluoroketones
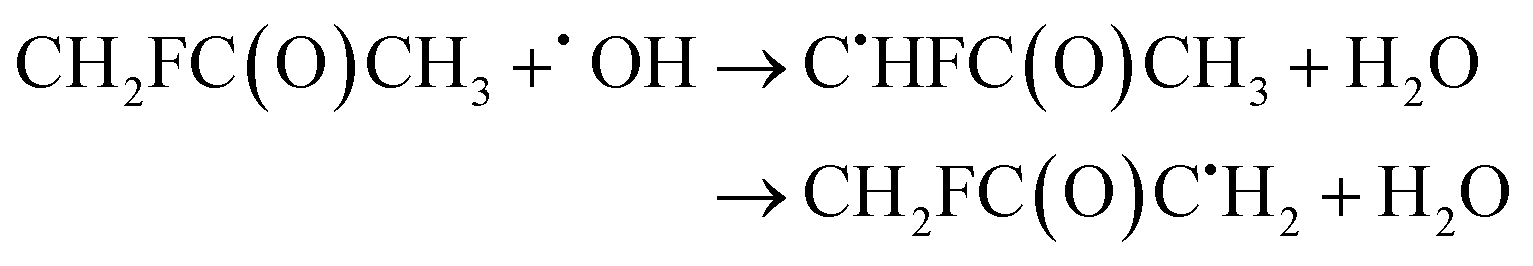
| CF3C(O)CH3 + ˙OH → CF3C(O)C˙H2 + H2O | (27) |
The fit to the Arrhenius–Kooij equation yields k(298.15 K) = (5.1 ± 2.2) × 10−15 cm3 molecule−1 s−1. The only available experimental10,85 rate coefficient is k(298.15 K) = (1.1 ± 0.6) × 10−14 cm3 molecule−1 s−1, which leads to ρ ≈ 2.2. Note that at the date that this manuscript was being written, the rate coefficient given in the online database85 was incorrect, since it was citing the value present in ref. 13, which is actually a typo. The correct value for the recommended rate constant is given in ref. 10. The kOH(calc) points calculated in the 230 ≤ T/K ≤ 320 temperature interval are shown in Fig. 9, together with the Arrhenius–Kooij fit to those points and the experimental rate coefficient at 298.15 K.
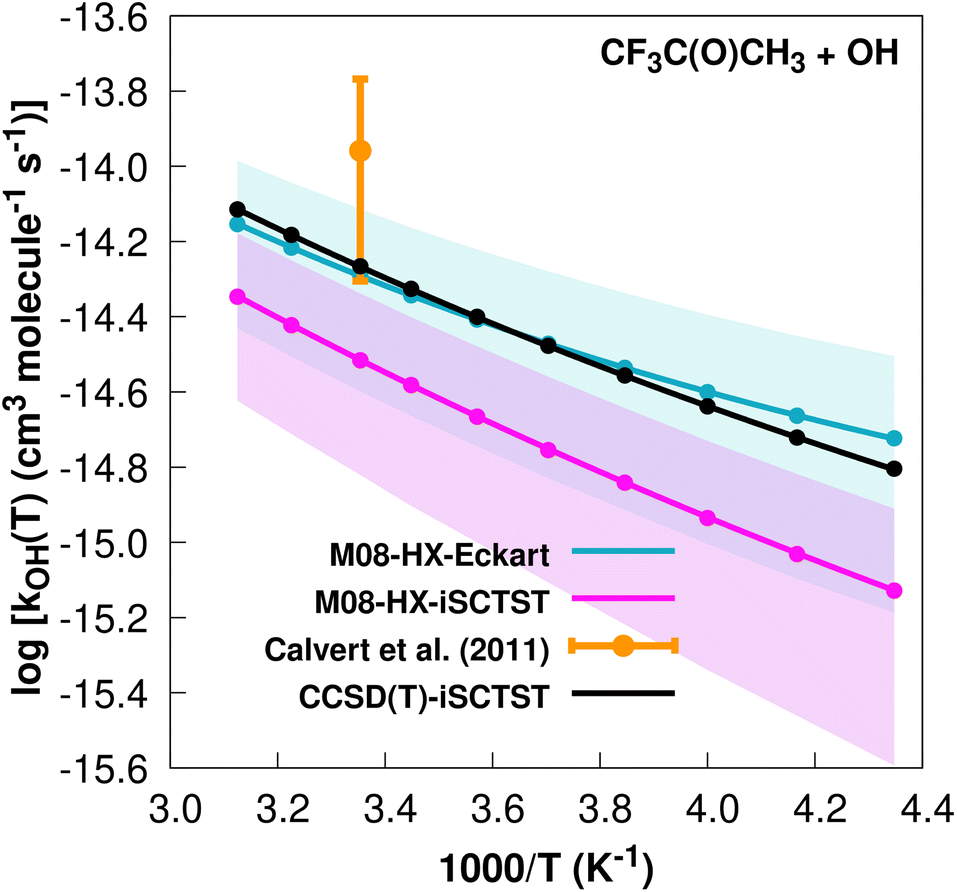 | ||
| Fig. 9 k OH(calc) data points (solid blue, purple and black circles) and respective Arrhenius–Kooij fits (solid blue, purple and black lines) with σ error bars (shaded blue and purple areas) for the CF3C(O)CH3 + ˙OH reaction in the Tcalc = [230, 320] K temperature interval. Solid orange circle shows the recommended value10 for the rate constant at 298.15 K (color online). | ||
 | (28) |
The calculated branching ratios for the two abstraction sites are: ΓCH2F = 80% and ΓCH3 = 20%, which are quite different from the SAR predictions of ΓCH2F = 39% and ΓCH3 = 61%. Note that the SAR predictions of ΓCH2F = 39% and ΓCH3 = 51% given in ref. 13 are incorrect, since they do not sum up to 100%. Our MC-TST/CTSR results show that of the six total found TSs, the two lowest energy ones refer to hydrogen abstractions at the –CH2F group with ΔETSi ≤ 1.2 kcal mol−1. The V‡ barrier height is 1.63 kcal mol−1. The remaining four TSs have energies above 1.35 kcal mol−1 and correspond to hydrogen abstractions at the –CH3 group.
The fit to the Arrhenius–Kooij equation yields k(298.15 K) = (1.4 ± 0.2) × 10−13 cm3 molecule−1 s−1. Again, no other experimental results13,85 are available besides the rate coefficient at 298.15 K: k(298.15 K) = (2.15 ± 0.54) × 10−13 cm3 molecule−1 s−1, which leads to ρ ≈ 1.5. The kOH(calc) points calculated in the 230 ≤ T/K ≤ 320 temperature interval are shown in Fig. 10, together with the Arrhenius–Kooij fit to those points and the experimental rate constant at 298.15 K.
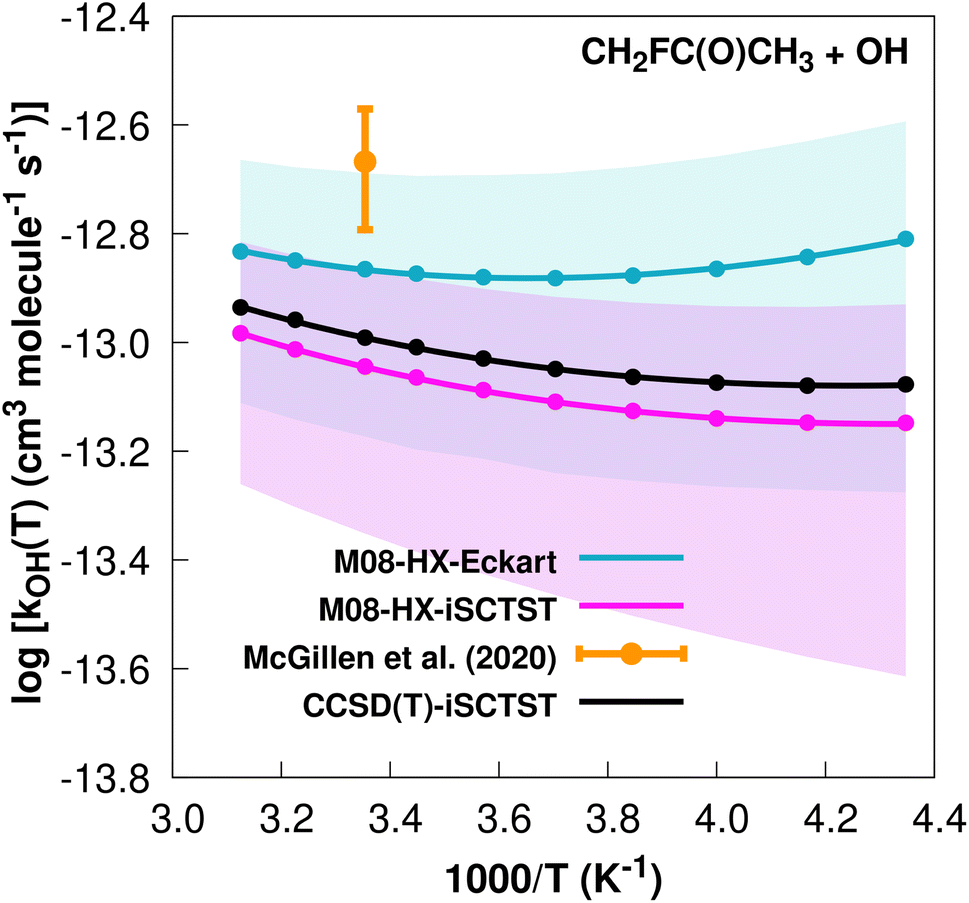 | ||
| Fig. 10 k OH(calc) data points (solid blue, purple and black circles) and respective Arrhenius–Kooij fits (solid blue, purple and black lines) with σ error bars (shaded blue and purple areas) for the CH2FC(O)CH3 + ˙OH reaction in the Tcalc = [230, 320] K temperature interval. Solid orange circle shows the recommended value85 for the rate constant at 298.15 K (color online). | ||
It should be noted that at 298.15 K, this rate constant is almost 30 times larger than the rate constant for the CF3C(O)CH3 + OH˙ reaction, and this is mainly due to the V‡ barriers differing by 2.44 kcal mol−1. We refer again to the possible interpretation that because CF3C(O)CH3 has two more F atoms than CH2FC(O)CH3, the former molecule will have more possibilities of forming intramolecular hydrogen bonds in the TSs, with a resulting increase in their degree of covalency and therefore resulting in a larger λ descriptor.34
3.6 A summary of the results
Fig. 11 summarizes the results at 298.15 K, where the MC-TST/CTSR and experimental rate constants are shown, along with the ρ value for each reaction.The rate constants span several orders of magnitude and there is an almost equal distribution (60–40%) of MC-TST/CTSR rate coefficients that overestimate or underestimate the experimental values. The average ρ factor by which our M08-HX-Eckart calculations deviate from the experimental results is calculated to be 〈ρ〉 = 1.7, with six cases having ρ < 2 and four cases having 2 < ρ < 3. The remaining two batches of calculations, M08-HX-iSCTST and CCSD(T)-iSCTST, yield 〈ρ〉 values of 2.0 and 3.4, respectively.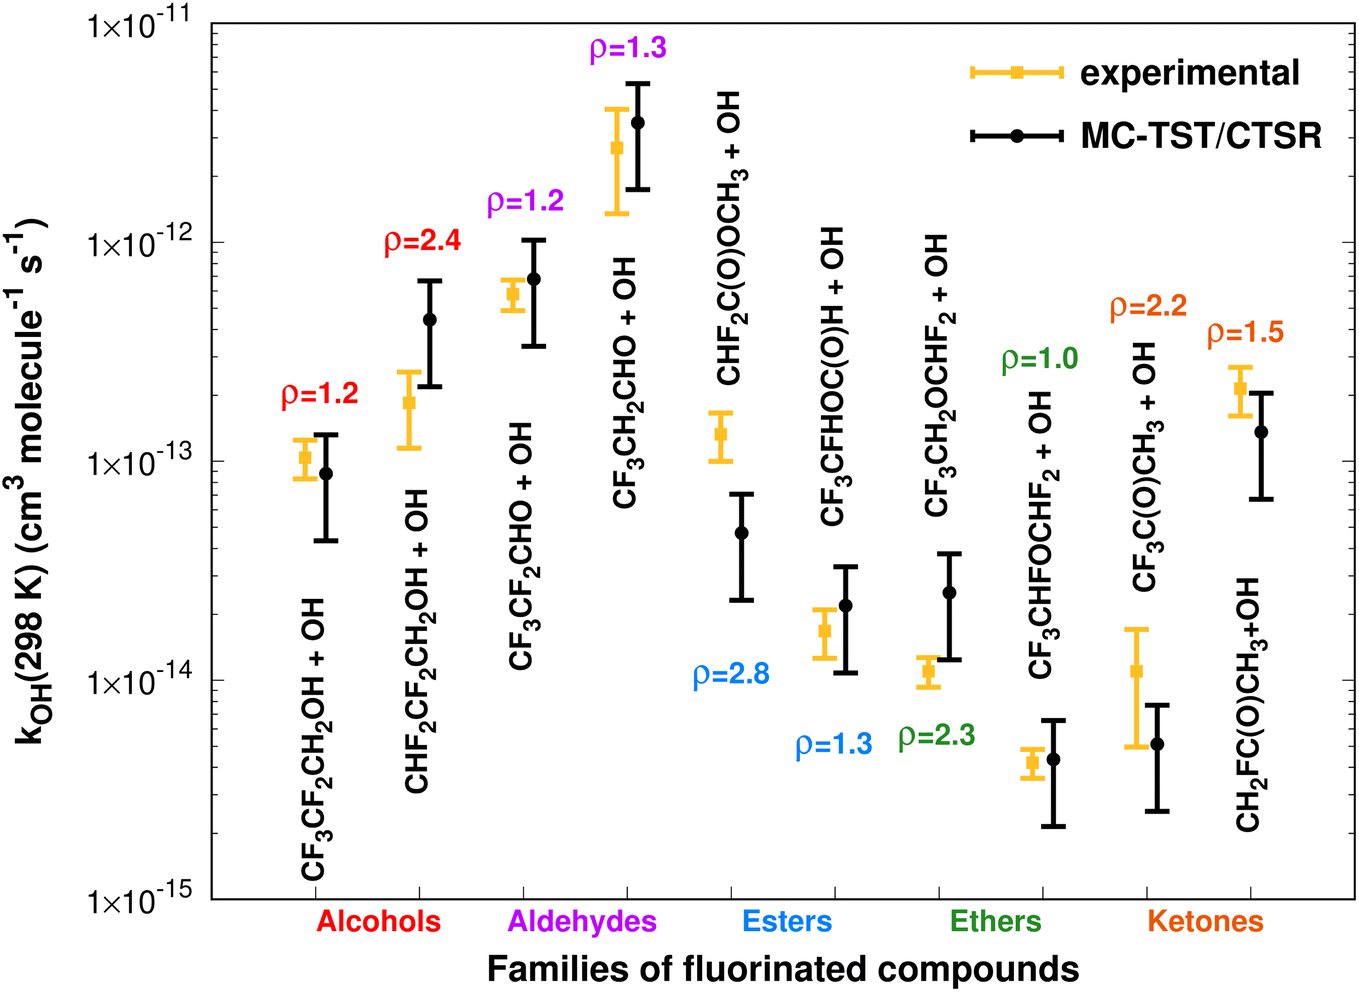 | ||
| Fig. 11 Comparison between 10 (recommended) experimental and theoretical (this work, eqn (8) and (10)) rate constants at 298.15 K spanning five different families of OVOCs. | ||
For each reaction we have also performed a comparison between the values of sOVOC for the three sets of curves. Not surprisingly, the Arrhenius–Kooij curves obtained with the iSCTST tunneling factor represent the maximum value of sOVOC for six (three cases for each -iSCTST type of curve) of the seven analyzed reactions, as the iSCTST tunneling factor should better describe the lower temperature region of the [230,320] K interval in comparison with the Eckart tunneling factor. The only reaction for which an M08-HX-Eckart Arrhenius–Kooij curve represents the highest sOVOC value is the CF3CFHOC(O)H+˙OH reaction (Fig. 6), although the respective M08-HX-iSCTST curve displays an incredible agreement with the experimental Arrhenius curve, which illustrates what the sOVOC metric really describes. We have therefore considered the M08-HX-iSCTST Arrhenius–Kooij curves as the better choice to describe the trends associated to the temperature dependence of these rate constants. Such a choice is supported by the values of sOVOC for the M08-HX-iSCTST curves, which are always larger than the sOVOC values for the M08-HX-Eckart curves, except the already mentioned exception. This improvement of the M08-HX-iSCTST curves with respect to the M08-HX-Eckart ones is also visually evident in some cases: for example in Fig. 1, 2, 8 and 10. Of the seven possible comparisons between our M08-HX-iSCTST MC-TST/CTSR Arrhenius–Kooij fits and the experimental recommended Arrhenius curves, two of them show values of sOVOC clearly above the remaining five, indicating a higher similarity between kexp and kAK: the value for the CF3CF2CH2OH + ˙OH reaction with s = 48 (Fig. 1) and also for the CF3CF2CHO + ˙OH reaction with s = 57 (Fig. 3). Even though the other five cases have lower values of sOVOC in the interval 8 ≤ sOVOC ≤ 15, they nevertheless exhibit a good similarity between kexp and kAK, especially if it is taken into consideration that the missing error bars from kexp may help to mitigate the gap between the two curves. The exception is the CF3CH2CHO + ˙OH reaction, where both M08-HX curves yield an incorrect trend when compared with the experimental curve. Here, only the CCSD(T)-iSCTST curve shows an acceptable behaviour, with an Arrhenius–Kooij curve given by kAK(T) = 3.17 × 10⁻¹³exp(486/T)(T/298)2.10 cm3 molecule−1 s−1. Table 1 shows the fitted parameters for all Arrhenius–Kooij fits along with the corresponding values of the relative residual standard deviation (RRSD).100
| OVOC | A | B | n | RRSD | V ‡M08-HX | V ‡CCSD(T) | k OH(calc) | k MC-TSTOH | k exp | k LC-TSTOH(calc) |
|---|---|---|---|---|---|---|---|---|---|---|
| a DFT and coupled-cluster barrier heights (V‡DFT and V‡CCSD(T)) and theoretical (kOH(calc), kMC-TSTOH and kLC-TSTOH(calc), see text) and experimental (kexp) rate constants. A, kOH(calc), kMC-TSTOH, kexp and kLC-TSTOH(calc) are in units of cm3 molecule−1 s−1, B is in kelvin, RRSD is in % and the V‡ barrier heights are written in kcal mol−1. | ||||||||||
| CF3CF2CH2OH | 4.69 × 10⁻¹⁵ | −794 | 5.27 | 0.15 | 1.82 | 1.93 | 8.8 × 10⁻¹⁴ | 8.8 × 10⁻¹⁴ | 1.0 × 10⁻¹³ | 2.6 × 10⁻¹⁴ |
| CHF2CF2CH2OH | 2.66 × 10⁻¹⁴ | −766 | 3.38 | 0.10 | 0.80 | 0.77 | 4.4 × 10⁻¹³ | 4.5 × 10⁻¹³ | 1.8 × 10⁻¹³ | 1.1 × 10⁻¹³ |
| CF3CF2CHO | 1.39 × 10⁻¹³ | −423 | 2.66 | 0.08 | 0.55 | 0.76 | 6.8 × 10⁻¹³ | 7.0 × 10⁻¹³ | 5.8 × 10⁻¹³ | 1.7 × 10⁻¹³ |
| CF3CH2CHO | 3.44 × 10⁻¹³ | −642 | 2.01 | 0.08 | −0.38 | 0.01 | 3.5 × 10⁻¹² | 4.1 × 10⁻¹² | 2.7 × 10⁻¹² | 8.4 × 10⁻¹³ |
| CHF2C(O)OCH3 | 2.48 × 10⁻¹⁶ | −1457 | 7.11 | 0.16 | 1.68 | 2.43 | 4.7 × 10⁻¹⁴ | 4.7 × 10⁻¹⁴ | 1.3 × 10⁻¹³ | 1.8 × 10⁻¹⁴ |
| CF3CFHOC(O)H | 6.57 × 10⁻¹⁴ | 405 | 3.40 | 0.30 | 2.79 | 3.42 | 2.2 × 10⁻¹⁴ | 2.2 × 10⁻¹⁴ | 1.7 × 10⁻¹⁴ | 8.0 × 10⁻¹⁵ |
| CF3CH2OCHF2 | 1.52 × 10⁻¹⁴ | −20 | 5.24 | 0.20 | 3.37 | 2.99 | 2.5 × 10⁻¹⁴ | 2.5 × 10⁻¹⁴ | 1.1 × 10⁻¹⁴ | 2.5 × 10⁻¹⁵ |
| CF3CHFOCHF2 | 1.62 × 10⁻¹⁶ | −785 | 7.43 | 0.39 | 4.03 | 4.30 | 4.4 × 10⁻¹⁵ | 4.4 × 10⁻¹⁵ | 4.2 × 10⁻¹⁵ | 6.7 × 10⁻¹⁶ |
| CF3C(O)CH3 | 1.67 × 10⁻¹⁵ | −179 | 6.12 | 0.25 | 4.07 | 3.73 | 5.1 × 10⁻¹⁵ | 5.1 × 10⁻¹⁵ | 1.1 × 10⁻¹⁴ | 8.1 × 10⁻¹⁶ |
| CH2FC(O)CH3 | 1.80 × 10⁻¹⁶ | −1852 | 8.02 | 0.20 | 1.63 | 1.55 | 1.4 × 10⁻¹³ | 1.4 × 10⁻¹³ | 2.2 × 10⁻¹³ | 7.9 × 10⁻¹⁴ |
Our procedure also improves the branching ratios at 298.15 K relative to those obtained via SARs. This is particularly evident in the case of the hydrofluoroalcohols, where the SAR values for ΓOH are clearly overestimated, since hydrogen-atom abstraction at the –OH group is well-known to be associated with higher barrier heights than hydrogen-atom abstraction at alkyl groups.101–104
Moreover, Table 1 also shows the values for the V‡ barrier heights calculated at the M08-HX and CCSD(T) levels, which were used estimate σ‡V as the value of the MUE92
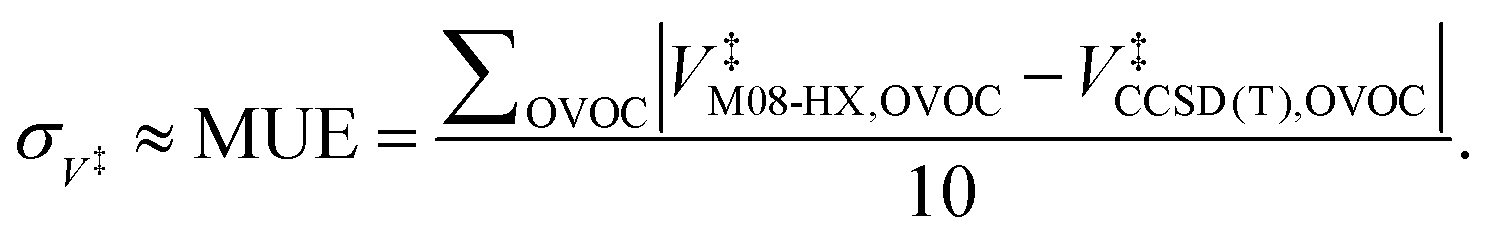 | (29) |
This equation yields a value of σ‡V ≈ 0.3 kcal mol−1. However, we should stress that each value for V‡CCSD(T) is an approximation to the true CCSD(T) barrier height, since the CCSD(T)/cc-pVTZ single-point energy calculations were performed at M08-HX/pcseg-2 optimized geometries, not on geometries optimized at the coupled-cluster level of theory. The use of such a methodology is therefore likely to introduce an error of unknown magnitude,105 considering that the CCSD(T) calculations are performed in a topological unknown region of the coupled-cluster PES. In other words, the coupled-cluster calculations involved in obtaining V‡ trade the certainty of being in the correct region of the PES with a M08-HX energy value for a higher accurate CCSD(T) energy value in an unknown topological region of the coupled-cluster PES, which may not even be a stationary point. With these limitations in mind, we then proceeded to propagate the σ‡V uncertainty in the fitted Arrhenius–Kooij equations. The σ‡V = 0.3 kcal mol−1 value translates into σB = 151 K and the uncertainty associated with the Arrhenius–Kooij equations is calculated as106
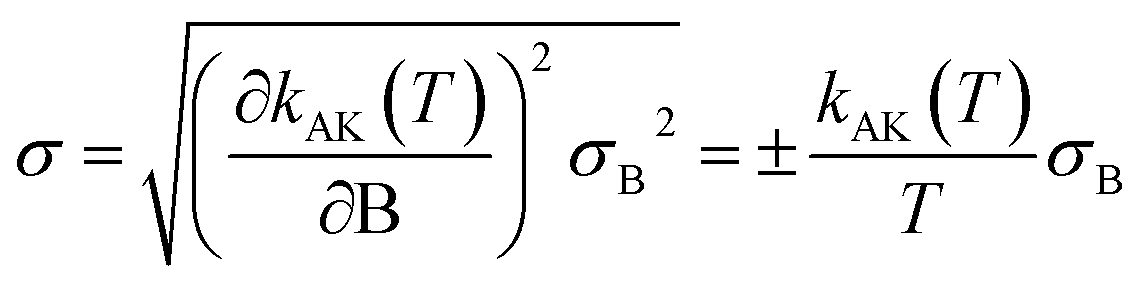 | (30) |
Finally, Table 1 includes the values for kOH(calc), kMC-TSTOH, kexp and kLC-TSTOH(calc). Several observations can be made by looking at these four sets of values. The first one is that for cases where kMC-TSTOH ≪ k1, kOH(calc) ≈ kMC-TSTOH. This is expected just by analyzing eqn (8). The second observation is that when the condition kMC-TSTOH ≪ k1 does not hold, kOH(calc) is always closer to the kexp experimental rate constant value than the kMC-TSTOH result. This improvement in the rate constant was already observed by Petit and Harvey40 and it should be acknowledged even though we are making an approximation by using the same k1 value for all studied reactions. The third one refers to the kOH(calc) values based on lowest-conformer TST (LC-TST),37,42 which take into account only the lowest energy reactant and TS conformer for each reaction. These calculations therefore ignore the conformational complexity present in all reactions and show the importance of performing the necessary conformational sampling: a quick inspection of the values present in the last column in Table 1 clearly indicates that the values of kLC-TSTOH(calc) are considerably less accurate than the kOH(calc) values, which is confirmed by calculating the average ρ factor for these values: 〈ρ〉 = 4.9.
4 Conclusions
In this work we have tested our cost-effective MC-TST/CTSR protocol for the calculation of bimolecular rate constants by investigating reactions between ˙OH and 10 fluorinated OVOCs belonging to five different families: hydrofluoroalcohols, hydrofluoroaldehydes, hydrofluoroesters, hydrofluoroethers and hydrofluoroketones. Our calculated M08-HX-Eckart based rate coefficients agree with the recommended experimental values, on average, to within better a factor of two (〈ρ〉 = 1.7). Given the cost-effective nature of this computational protocol and the diversity of studied systems, this is a promising set of results that builds on the successful implementation of a previous version of our protocol,31 where the rate constants of reactions between ˙OH and several hydrofluoropolyethers were reported to be in good agreement (ρ < 5).Furthermore, the fitted Arrhenius–Kooij curves based on the iSCTST tunneling correction show a good agreement with the recommended experimental Arrhenius fits while being a considerable improvement to the M08-HX-Eckart based curves. This implies that MC-TST/CTSR temperature-dependent data can be used to model reactions in the atmosphere in situations where experimental information is not available. The MC-TST/CTSR branching ratios can also offer insight into the underlying mechanisms for why reactions are favored at a particular site.
The present work quantifies the accuracy of the MC-TST/CTSR protocol for predicting reaction rates. Theoretically predicted rate constants may be useful for estimating lifetimes for OVOCs that have not yet been experimentally studied and pave the way for designing saturated OVOCs with short atmospheric lifetimes. The theoretical calculation of rate coefficients for the OH-oxidation of larger fluorinated OVOCs (Cn, n > 3) is currently underway.
Author contributions
LPV: conceptualization, formal analysis, investigation, methodology, visualization, writing. FJ: analysis, writing, resources.Conflicts of interest
There are no conflicts of interest to declare.Acknowledgements
The Coimbra Chemistry Centre – Institute of Molecular Sciences (CQC-IMS) is supported by the Portuguese Foundation for Science and Technology (FCT) through projects UIDB/QUI/0313/2020, UIDP/QUI/0313/2020 and LA/P/0056/2020 (national funds). L. P. V. acknowledges FCT for an Assistant Researcher grant. The numerical results presented in this work were obtained at the Centre for Scientific Computing, Aarhus https://phys.au.dk/forskning/faciliteter/cscaa/.Notes and references
- M. J. Molina and F. S. Rowland, Stratospheric Sink for Chlorofluoromethanes: Chlorine Atom-Catalysed Destruction of Ozone, Nature, 1974, 249, 810–812 CrossRef CAS.
- J. D. Farman, B. G. Gardiner and J. D. Shanklin, Large Losses of Total Ozone in Antarctica Reveal Seasonal ClOx/NOx Interaction, Nature, 1985, 315, 207–210 CrossRef CAS.
- United Nations, Montreal Protocol on Substances that Deplete the Ozone Layer – Adjustments and Amendment, Int. Leg. Mater., 1993, 32, 874–887 CrossRef.
- B. P. McGivern, Conference of the Parties to the Framework Convention on Climate Change: Kyoto Protocol, Int. Leg. Mater., 1998, 37, 22–43 CrossRef.
- E. A. Heath, Amendment to the Montreal Protocol on Substances that Deplete the Ozone Layer (Kigali Amendment), Int. Leg. Mater., 2017, 56, 193–205 CrossRef.
- UNEP, HFCs: A Critical Link in Protecting Climate and the Ozone Layer, United Nations Environment Programme (UNEP), 2011, p. 36, available online: https://www.unep.org/resources/report/hfcs-critical-link-protecting-climate-and-ozone-layer, accessed on 2 November 2022 Search PubMed.
- Ø. Hodnebrog, M. Etminan, J. S. Fuglestvedt, G. Marston, G. Myhre, C. J. Nielsen, K. P. Shine and T. J. Wallington, Global Warming Potentials and Radiative Efficiencies of Halocarbons and Related Compounds: A Comprehensive Review, Rev. Geophys., 2013, 51, 300–378 CrossRef.
- T. J. Wallington, M. P. S. Andersen and O. J. Nielsen, in Advances in Atmospheric Chemistry, ch. Atmospheric Chemistry of Halogenated Organic Compounds, ed. J. R. Barker, A. L. Steiner and T. J. Wallington, World Scientific, 2017, vol. 1, pp. 305–402 Search PubMed.
- A. Mellouki, G. Le Bras and H. Sidebottom, Kinetics and Mechanisms of the Oxidation of Oxygenated Organic Compounds in the Gas Phase, Chem. Rev., 2003, 103, 5077–5096 CrossRef CAS PubMed.
- J. G. Calvert, A. Mellouki, J. J. Orlando, M. J. Pilling and T. J. Wallington, The Mechanisms of Atmospheric Oxidation of the Oxygenates, Oxford University Press, New York, New York, 1st edn, 2011 Search PubMed.
- A. Mellouki, T. J. Wallington and J. Chen, Atmospheric Chemistry of Oxygenated Volatile Organic Compounds: Impacts on Air Quality and Climate, Chem. Rev., 2015, 115, 3984–4014 CrossRef CAS PubMed.
- B. J. Finlayson-Pitts and J. N. Pitts Jr, Chemistry of the Upper and Lower Atmosphere: Theory, Experiments, and Applications, Academic Press, San Diego, California, 1st edn, 2000 Search PubMed.
- J. G. Calvert, J. J. Orlando, W. R. Stockwell and T. J. Wallington, The Mechanisms of Reactions Influencing Atmospheric Ozone, Oxford University Press, New York, New York, 1st edn, 2015 Search PubMed.
- M. J. Kurylo and V. L. Orkin, Determination of Atmospheric Lifetimes via the Measurement of OH Radical Kinetics, Chem. Rev., 2003, 103, 5049–5076 CrossRef CAS PubMed.
- B. Bolin and H. Rodhe, A Note on the Concepts of Age Distribution and Transit Time in Natural Reservoirs, Tellus, 1973, 25, 58–62 CrossRef.
- Y. Díaz-de-Mera, A. Aranda, A. Notario, A. Rodríguez, D. Rodríguez and I. Bravo, Photolysis Study of Fluorinated Ketones Under Natural Sunlight Conditions, Phys. Chem. Chem. Phys., 2015, 17, 22991–22998 RSC.
- Y. Ren, F. Bernard, V. Daële and A. Mellouki, Atmospheric Fate and Impact of Perfluorinated Butanone and Pentanone, Environ. Sci. Technol., 2019, 53, 8862–8871 CrossRef CAS PubMed.
- M. S. Chiappero, F. E. Malanca, G. A. Argüello, S. T. Woolridge, M. D. Hurley, J. C. Ball, T. J. Wallington, R. L. Waterland and R. C. Buck, Atmospheric Chemistry of Perfluoroaldehydes (CxF2x+1CHO) and Fluorotelomer Aldehydes (CxF2x+1CH2CHO): Quantification of the Important Role of Photolysis, J. Phys. Chem. A, 2006, 110, 11944–11953 CrossRef CAS PubMed.
- L. Vereecken and J. S. Francisco, Theoretical Studies of Atmospheric Reaction Mechanisms in the Troposphere, Chem. Soc. Rev., 2012, 41, 6259–6293 RSC.
- L. Vereecken, D. R. Glowacki and M. J. Pilling, Theoretical Chemical Kinetics in Tropospheric Chemistry: Methodologies and Applications, Chem. Rev., 2015, 115, 4063–4114 CrossRef CAS PubMed.
- L. Vereecken, B. Aumont, I. Barnes, J. W. Bozzelli, M. J. Goldman, W. H. Green, S. Madronich, M. R. McGillen, A. Mellouki, J. J. Orlando, B. Picquet-Varrault, A. R. Rickard, W. R. Stockwell, T. J. Wallington and W. P. L. Carter, Perspective on Mechanism Development and Structure-Activity Relationships for Gas-Phase Atmospheric Chemistry, Int. J. Chem. Kinet., 2018, 50, 435–469 CrossRef CAS.
- P. T. Anastas and J. C. Warner, Green Chemistry: Theory and Practice, Oxford University Press, Oxford, Great Britain, 1998 Search PubMed.
- H. C. Erythropel, J. B. Zimmerman, T. M. de Winter, L. Petitjean, F. Melnikov, C. H. Lam, A. W. Lounsbury, K. E. Mellor, N. Z. Janković, Q. Tu, L. N. Pincus, M. M. Falinski, W. Shi, P. Coish, D. L. Plata and P. T. Anastas, The Green ChemisTREE: 20 Years After Taking Root With the 12 Principles, Green Chem., 2018, 20, 1929–1961 RSC.
- T. Yu, J. Zheng and D. G. Truhlar, Multi-Structural Variational Transition State Theory. Kinetics of the 1,4-Hydrogen Shift Isomerization of the Pentyl Radical With Torsional Anharmonicity, Chem. Sci., 2011, 2, 2199–2213 RSC.
- T. Yu, J. Zheng and D. G. Truhlar, Multipath Variational Transition State Theory: Rate Constant of the 1,4-Hydrogen Shift Isomerization of the 2-Cyclohexylethyl Radical, J. Phys. Chem. A, 2012, 116, 297–308 CrossRef CAS PubMed.
- R. Meana-Pañeda and A. Fernández-Ramos, Accounting for Conformational Flexibility and Torsional Anharmonicity in the H + CH3CH2OH Hydrogen Abstraction Reactions: A Multi-Path Variational Transition State Theory Study, J. Chem. Phys., 2014, 140, 174303 CrossRef PubMed.
- J. L. Bao, R. Meana-Pañeda and D. G. Truhlar, Multi-Path Variational Transition State Theory for Chiral Molecules: the Site-Dependent Kinetics for Abstraction of Hydrogen from 2-Butanol by Hydroperoxyl Radical, Analysis of Hydrogen Bonding in the Transition State, and Dramatic Temperature Dependence of the Activation Energy, Chem. Sci., 2015, 6, 5866–5881 RSC.
- J. L. Bao and D. G. Truhlar, Variational Transition State Theory: Theoretical Framework and Recent Developments, Chem. Soc. Rev., 2017, 46, 7548–7596 RSC.
- D. Ferro-Costas, E. Martínez-Núñez, J. Rodríguez-Otero, E. Cabaleiro-Lago, C. M. Estévez, B. Fernández, A. Fernández-Ramos and S. A. Vázquez, Influence of Multiple Conformations and Paths on Rate Constants and Product Branching Ratios. Thermal Decomposition of 1-Propanol Radicals, J. Phys. Chem. A, 2018, 122, 4790–4800 CrossRef CAS PubMed.
- L. P. Viegas, Exploring the Reactivity of Hydrofluoropolyethers toward OH Through a Cost-Effective Protocol for Calculating Multiconformer Transition State Theory Rate Constants, J. Phys. Chem. A, 2018, 122, 9721–9732 CrossRef CAS PubMed.
- L. P. Viegas, Simplified Protocol for the Calculation of Multiconformer Transition State Theory Rate Constants Applied to Tropospheric OH-Initiated Oxidation Reactions, J. Phys. Chem. A, 2021, 125, 4499–4512 CrossRef CAS PubMed.
- L. P. Viegas, Multiconformer Transition State Theory Rate Constants for the Reaction Between OH and α, ω-Dimethoxyfluoropolyethers, Int. J. Chem. Kinet., 2019, 51, 358–366 CrossRef CAS.
- L. P. Viegas, Theoretical Determination of the OH-initiated Oxidation Rate Constants of α,ω-Dialkoxyfluoropolyethers, Theor. Chem. Acc., 2019, 138, 65 Search PubMed.
- L. P. Viegas and F. Jensen, Reactivity of α, ω-Dihydrofluoropolyethers toward OH Predicted by Multiconformer Transition State Theory and the Interacting Quantum Atoms Approach, J. Phys. Chem. A, 2020, 124, 3460–3470 CrossRef CAS PubMed.
- L. P. Viegas, Atmospheric Degradation of Two Hydrofluoroketones: Theoretical Rate Constants for the Gas-Phase OH-Oxidation of HFK-447mcc and HFK-465mc, Atmosphere, 2022, 13, 1256 CrossRef CAS.
- L. P. Viegas, Multiconformer Transition State Theory Rate Constant and Branching Ratios for the OH-Initiated Reaction of CH3OCF2CHF2 and its Primary Product, HC(O)OCF2CHF2, J. Phys. Org. Chem., 2023, 36, e4470 CrossRef CAS.
- L. P. Viegas, Gas-Phase OH-Oxidation of 2-Butanethiol: Multiconformer Transition State Theory Rate Constant with Constrained Transition State Randomization, Chem. Phys. Lett., 2022, 803, 139829 CrossRef CAS.
- L. Vereecken and J. Peeters, The 1,5-H-Shift in 1-Butoxy: A Case Study in the Rigorous Implementation of Transition State Theory for a Multirotamer System, J. Chem. Phys., 2003, 119, 5159–5170 CrossRef CAS.
- A. Fernández-Ramos, B. A. Ellingson, R. Meana-Pañeda, J. M. C. Marques and D. G. Truhlar, Symmetry Numbers and Chemical Reaction Rates, Theor. Chem. Acc., 2007, 118, 813–826 Search PubMed.
- A. S. Petit and J. N. Harvey, Atmospheric Hydrocarbon Activation by the Hydroxyl Radical: A Simple yet Accurate Computational Protocol for Calculating Rate Coefficients, Phys. Chem. Chem. Phys., 2012, 14, 184–191 RSC.
- M. P. Rissanen, T. Kurtén, M. Sipilä, J. A. Thornton, J. Kangasluoma, N. Sarnela, H. Junninen, S. Jørgensen, S. Schallhart, M. K. Kajos, R. Taipale, M. Springer, T. F. Mentel, T. Ruuskanen, T. Petäjä, D. R. Worsnop, H. G. Kjaergaard and M. Ehn, The Formation of Highly Oxidized Multifunctional Products in the Ozonolysis of Cyclohexene, J. Am. Chem. Soc., 2014, 136, 15596–15606 CrossRef CAS PubMed.
- K. H. Møller, R. V. Otkjaer, N. Hyttinen, T. Kurtén and H. G. Kjaergaard, Cost-Effective Implementation of Multiconformer Transition State Theory for Peroxy Radical Hydrogen Shift Reactions, J. Phys. Chem. A, 2016, 120, 10072–10087 CrossRef PubMed.
- A. Novelli, L. Vereecken, B. Bohn, H. Dorn, G. L. Gkatzelis, A. Hofzumahaus, F. Holland, D. Reimer, F. Rohrer, S. Rosanka, D. Taraborrelli, R. Tillmann, R. Wegener, Z. Yu, A. Kiendler-Scharr, A. Wahner and H. Fuchs, Importance of Isomerization Reactions for OH Radical Regeneration from the Photo-Oxidation of Isoprene Investigated in the Atmospheric Simulation Chamber SAPHIR, Atmos. Chem. Phys., 2020, 20, 3333–3355 CrossRef CAS.
- L. Vereecken and B. Nozière, H Migration in Peroxy Radicals Under Atmospheric Conditions, Atmos. Chem. Phys., 2020, 20, 7429–7458 CrossRef CAS.
- J. C. Hansen and J. S. Francisco, Radical-Molecule Complexes: Changing Our Perspective on the Molecular Mechanisms of Radical-Molecule Reactions and Their Impact on Atmospheric Chemistry, ChemPhysChem, 2002, 3, 833–840 CrossRef CAS PubMed.
- R. T. Raines and D. E. Hansen, An Intuitive Approach to Steady-State Kinetics, J. Chem. Educ., 1988, 65, 757–759 CrossRef CAS.
- F. Xiao, X. Sun, Z. Li and X. Li, Theoretical Study of Radical-Molecule Reactions with Negative Activation Energies in Combustion: Hydroxyl Radical Addition to Alkenes, ACS Omega, 2020, 5, 12777–12788 CrossRef CAS PubMed.
- D. L. Singleton and R. J. Cvetanović, Temperature Dependence of the Reaction of Oxygen Atoms with Olefins, J. Am. Chem. Soc., 1976, 98, 6812–6819 CrossRef CAS.
- J. R. Alvarez-Idaboy, N. Mora-Diez and A. Vivier-Bunge, A Quantum Chemical and Classical Transition State Theory Explanation of Negative Activation Energies in OH Addition To Substituted Ethenes, J. Am. Chem. Soc., 2000, 122, 3715–3720 CrossRef CAS.
- A. Galano, J. R. Alvarez-Idaboy, G. Bravo-Pérez and M. E. Ruiz-Santoyo, Gas Phase Reactions of C1 − C4 Alcohols with the OH Radical: A Quantum Mechanical Approach, Phys. Chem. Chem. Phys., 2002, 4, 4648–4662 RSC.
- A. Cruz-Torres and A. Galano, On the Mechanism of Gas-Phase Reaction of C1 − C3 Aliphatic Thiols + OH Radicals, J. Phys. Chem. A, 2007, 111, 1523–1529 CrossRef CAS PubMed.
- I. W. M. Smith, Collisional Energy Transfer, Intramolecular Vibrational Relaxation and Unimolecular Reactions, J. Chem. Soc., Faraday Trans., 1997, 93, 3741–3750 RSC.
- I. W. M. Smith and A. R. Ravishankara, Role of Hydrogen-Bonded Intermediates in the Bimolecular Reactions of the Hydroxyl Radical, J. Phys. Chem. A, 2002, 106, 4798–4807 CrossRef CAS.
- D. C. McCabe, S. S. Brown, M. K. Gilles, R. K. Talukdar, I. W. M. Smith and A. R. Ravishankara, Kinetics of the Removal of OH(v = 1) and OD(v = 1) by HNO3 and DNO3 from 253 to 383 K, J. Phys. Chem. A, 2003, 107, 7762–7769 CrossRef CAS.
- R. K. Talukdar, T. Gierczak, D. C. McCabe and A. R. Ravishankara, Reaction of Hydroxyl Radical with Acetone. 2. Products and Reaction Mechanism, J. Phys. Chem. A, 2003, 107, 5021–5032 CrossRef CAS.
- C. Eckart, The Penetration of a Potential Barrier by Electrons, Phys. Rev., 1930, 35, 1303–1309 CrossRef CAS.
- D. G. Truhlar, A. D. Isaacson, R. T. Skodje and B. C. Garret, Incorporation of Quantum Effects in Generalized-Transition-State Theory, J. Phys. Chem., 1982, 86, 2252–2261 CrossRef CAS.
- T. N. Truong and D. G. Truhlar, Ab initio Transition State Theory Calculations of the Reaction Rate for OH + CH4 → H2O + CH3, J. Chem. Phys., 1990, 93, 1761–1769 CrossRef CAS.
- T. N. Truong, Thermal Rates of Hydrogen Exchange of Methane with Zeolite: A Direct ab Initio Dynamics Study on the Importance of Quantum Tunneling, Effects, 1997, 101, 2750–2752 CAS.
- T. N. Truong, W. T. Duncan and M. Tirtowidjojo, A Reaction Class Approach for Modeling Gas Phase Reaction Rates, Phys. Chem. Chem. Phys., 1999, 1, 1061–1065 RSC.
- J. Pfaendtner and L. J. Broadbelt, Elucidation of Structure-Reactivity Relationships in Hindered Phenols via Quantum Chemistry and Transition State Theory, Chem. Eng. Sci., 2007, 62, 5232–5239 CrossRef CAS.
- T. L. Nguyen, J. F. Stanton and J. R. Barker, Ab Initio Reaction Rate Constants Computed Using Semiclassical Transition-State Theory: HO + H2 → H2O + H and Isotopologues, J. Phys. Chem. A, 2011, 115, 5118–5126 CrossRef CAS PubMed.
- B. Sirjean, E. Dames, H. Wang and W. Tsang, Tunneling in Hydrogen-Transfer Isomerization of n-Alkyl Radicals, J. Phys. Chem. A, 2012, 116, 319–332 CrossRef CAS PubMed.
- W. H. Miller, Semiclassical Limit of Quantum Mechanical Transition State Theory for Nonseparable Systems, J. Chem. Phys., 1975, 64, 1899–1906 CrossRef.
- W. H. Miller, Semi-Classical Theory for Non-Separable Systems: Construction of ‘Good’ Action-Angle Variables for Reaction Rate Constants, Faraday Discuss. Chem. Soc., 1977, 62, 40–46 RSC.
- W. H. Miller, R. Hernandez, N. C. Handy, D. Jayatilaka and A. Willetts, Ab Initio Calculation of Anharmonic Constants for a Transition State, with Application to Semiclassical Transition State Tunneling Probabilities, Chem. Phys. Lett., 1990, 172, 62–69 CrossRef CAS.
- R. Hernandez and W. H. Miller, Semiclassical Transition State Theory. A New Perspective, Chem. Phys. Lett., 1993, 214, 129–136 CrossRef CAS.
- A. F. Wagner, Improved Multidimensional Semiclassical Tunneling Theory, J. Phys. Chem. A, 2014, 116, 13089–13100 Search PubMed.
- M. J. Cohen, N. C. Handy, R. Hernandez and W. H. Miller, Cumulative Reaction Probabilities for H + H2 → H2 + H from a Knowledge of the Anharmonic Force Field, Chem. Phys. Lett., 1992, 192, 407–416 CrossRef CAS.
- V. Barone, Anharmonic Vibrational Properties by a Fully Automated Second-Order Perturbative Approach, J. Chem. Phys., 2005, 122, 014108 CrossRef PubMed.
- M. J. Frisch, G. W. Trucks, H. B. Schlegel, G. E. Scuseria, M. A. Robb, J. R. Cheeseman, G. Scalmani, V. Barone, G. A. Petersson, H. Nakatsuji, X. Li, M. Caricato, A. V. Marenich, J. Bloino, B. G. Janesko, R. Gomperts, B. Mennucci, H. P. Hratchian, J. V. Ortiz, A. F. Izmaylov, J. L. Sonnenberg, D. Williams-Young, F. Ding, F. Lipparini, F. Egidi, J. Goings, B. Peng, A. Petrone, T. Henderson, D. Ranasinghe, V. G. Zakrzewski, J. Gao, N. Rega, G. Zheng, W. Liang, M. Hada, M. Ehara, K. Toyota, R. Fukuda, J. Hasegawa, M. Ishida, T. Nakajima, Y. Honda, O. Kitao, H. Nakai, T. Vreven, K. Throssell, J. A. Montgomery Jr, J. E. Peralta, F. Ogliaro, M. J. Bearpark, J. J. Heyd, E. N. Brothers, K. N. Kudin, V. N. Staroverov, T. A. Keith, R. Kobayashi, J. Normand, K. Raghavachari, A. P. Rendell, J. C. Burant, S. S. Iyengar, J. Tomasi, M. Cossi, J. M. Millam, M. Klene, C. Adamo, R. Cammi, J. W. Ochterski, R. L. Martin, K. Morokuma, O. Farkas, J. B. Foresman and D. J. Fox, Gaussian16 Revision B.01, Gaussian Inc, Wallingford CT, 2016 Search PubMed.
- S. M. Greene, X. Shan and D. C. Clary, Rate Constants of Chemical Reactions from Semiclassical Transition State Theory in Full and One Dimension, J. Chem. Phys., 2016, 144, 244116 CrossRef PubMed.
- T. A. H. Burd, X. Shan and D. C. Clary, Hydrogen Tunnelling in the Rearrangements of Carbenes: The Role of Dynamical Calculations, Phys. Chem. Chem. Phys., 2020, 22, 962–965 RSC.
- M. W. Schmidt, K. K. Baldridge, J. A. Boatz, S. T. Elbert, M. S. Gordon, J. H. Jensen, S. Koseki, N. Matsunaga, K. A. Nguyen, S. Su, T. L. Windus, M. Dupuis and J. A. Montgomery Jr, General Atomic and Molecular Electronic Structure System, J. Comput. Chem., 1993, 14, 1347–1363 CrossRef CAS.
- Y. Zhao and D. G. Truhlar, Exploring the Limit of Accuracy of the Global Hybrid Meta Density Functional for Main-Group Thermochemistry, Kinetics, and Noncovalent Interactions, J. Chem. Theory Comput., 2008, 4, 1849–1868 CrossRef CAS PubMed.
- F. Jensen, Unifying General and Segmented Contracted Basis Sets. Segmented Polarization Consistent Basis Sets, J. Chem. Theory Comput., 2014, 10, 1074–1085 CrossRef CAS PubMed.
- N. M. O'Boyle, T. Vandermeersch, C. J. Flynn, A. R. Maguire and G. R. Hutchison, Confab – Systematic Generation of Diverse Low-Energy Conformers, J. Cheminf., 2011, 3, 8 Search PubMed.
- J.-P. Ebejer, G. M. Morris and C. M. Deane, Freely Available Conformer Generation Methods: How Good Are They?, J. Chem. Inf. Model., 2012, 52, 1146–1158 CrossRef CAS PubMed.
- I. Y. Kanal, J. A. Keith and G. R. Hutchison, A Sobering Assessment of Small-Molecule Force Field Methods for Low Energy Conformer Predictions, J. Chem. Inf. Model., 2018, 118, e25512 Search PubMed.
- D. Ferro-Costas and A. Fernández-Ramos, A Combined Systematic-Stochastic Algorithm for the Conformational Search in Flexible Acyclic Molecules, Front. Chem., 2020, 8, 16 CrossRef CAS PubMed.
- D. Ferro-Costas, I. Mosquera-Lois and A. Fernández-Ramos, TorsiFlex: An Automatic Generator of Torsional Conformers. Application to the Twenty Proteinogenic Amino Acids, J. Cheminf., 2021, 13, 100 Search PubMed.
- J. Espinosa-García, E. A. Ojalvo and J. C. Corchado, Theoretical Rate Constants: On the Error Cancellation Using Conventional Transition-State Theory and Wigner's Tunnelling Correction, J. Mol. Struct.: THEOCHEM, 1994, 303, 131–139 CrossRef.
- P. J. Lewis, K. A. Bennet and J. N. Harvey, A Computational Study of the Atmospheric Oxidation of Nopinone, Phys. Chem. Chem. Phys., 2005, 7, 1643–1649 RSC.
- G. Piccini, M. Alessio and J. Sauer, Ab Initio Calculation of Rate Constants for Molecule-Surface Reactions with Chemical Accuracy, Angew. Chem., Int. Ed., 2016, 55, 5235–5237 CrossRef CAS PubMed.
- M. R. McGillen, W. P. L. Carter, A. Mellouki, J. J. Orlando, B. Picquet-Varrault and T. J. Wallington, Database for the Kinetics of the Gas-Phase Atmospheric Reactions of Organic Compounds, Earth Syst. Sci. Data, 2020, 12, 1203–1216 CrossRef.
- A. G. Vandeputte, M. K. Sabbe, M.-F. Reyniers, V. V. Speybroeck, M. Waroquier and G. B. Marin, Theoretical Study of the Thermodynamics and Kinetics of Hydrogen Abstractions from Hydrocarbons, J. Phys. Chem. A, 2007, 111, 11771–11786 CrossRef CAS PubMed.
- M. Altarawneh, A Closer Look Into the Contribution of Atmospheric Gas-Phase Pathways in the Formation of Perfluorocarboxylic Acids, Atmospheric Pollut. Res., 2021, 12, 101255 CrossRef CAS.
- D. M. Kooij, Über die Zersetzung des Gasförmigen Phosphorwasserstoffs, Z. Phys. Chem., 1893, 12, 155–161 CrossRef.
- K. J. Laidler, The Development of the Arrhenius Equation, J. Chem. Educ., 1984, 61, 494–498 CrossRef CAS.
- W. C. Gardiner Jr, Temperature Dependence of Bimolecular Gas Reaction Rates, Acc. Chem. Res., 1977, 111, 326–331 CrossRef.
- J. Zhen, Y. Zhao and D. G. Truhlar, The DBH24/08 Database and Its Use to Assess Electronic Structure Model Chemistries for Chemical Reaction Barrier Heights, J. Chem. Theory Comput., 2009, 5, 808 CrossRef PubMed.
- C. J. Willmott and K. Matsuura, Advantages of the mean absolute error (MAE) over the root mean square error (RMSE) in assessing average model performance, Clim. Res., 2005, 30, 79–82 CrossRef.
- E. S. C. Kwok and R. Atkinson, Estimation of Hydroxyl Radical Reaction Rate Constants for Gas-Phase Organic Compounds Using a Structure-Reactivity Relationship: An Update, Atmos. Environ., 1995, 29, 1685–1695 CrossRef CAS.
- IUPAC Task Group on Atmospheric Chemical Kinetic Data Evaluation, http://iupac.pole-ether.fr.
- M. Antiñolo, S. González, B. Ballesteros, J. Albaladejo and E. Jiménez, Laboratory Studies of CHF2CF2CH2OH and CF3CF2CH2OH: UV and IR Absorption Cross Sections and OH Rate Coefficients between 263 and 358 K, J. Phys. Chem. A, 2012, 116, 6041–6050 CrossRef PubMed.
- R. F. W. Bader, Atoms in Molecules. A Quantum Theory, Oxford University Press, Oxford, Great Britain, 1990 Search PubMed.
- C. R. Wick and T. Clark, On Bond-Critical Points in QTAIM and Weak Interactions, J. Mol. Model., 2018, 24, 142–150 CrossRef PubMed.
- S. Shahbazian, Why Bond Critical Points Are Not Bond Critical Points, Chem.–Eur. J., 2018, 24, 5401–5405 CrossRef CAS PubMed.
- J. B. Burkholder, S. P. Sander, J. Abbatt, J. R. Barker, C. Cappa, J. D. Crounse, T. S. Dibble, R. E. Huie, C. E. Kolb, M. J. Kurylo, V. L. Orkin, C. J. Percival, D. M. Wilmouth and P. H. Wine, Chemical Kinetics and Photochemical Data for Use in Atmospheric Studies, Evaluation No. 19, JPL Publication 19-5, Jet Propulsion Laboratory, Pasadena, 2019, http://jpldataeval.jpl.nasa.gov Search PubMed.
- V. L. Orkin, V. G. Khamaganov, L. E. Martynova and M. J. Kurylo, High-Accuracy Measurements of OH˙ Reaction Rate Constants and IR and UV Absorption Spectra: Ethanol and Partially Fluorinated Ethyl Alcohols, J. Phys. Chem. A, 2011, 115, 8656–8668 CrossRef CAS PubMed.
- R. J. Shannon, M. A. Blitz, A. Goddard and D. E. Heard, Accelerated Chemistry in the Reaction Between the Hydroxyl Radical and Methanol at Interstellar Temperatures Facilitated by Tunnelling, Nat. Chem., 2013, 5, 745 CrossRef CAS PubMed.
- P. Seal, G. A. Oyedepo and D. G. Truhlar, Kinetics of the Hydrogen Atom Abstraction Reactions from 1-Butanol by Hydroxyl Radical: Theory Matches Experiment and More, J. Phys. Chem. A, 2013, 117, 275–282 CrossRef CAS PubMed.
- J. Zheng, R. Meana-Pañeda and D. G. Truhlar, Prediction of Experimentally Unavailable Product Branching Ratios for Biofuel Combustion: The Role of Anharmonicity in the Reaction of Isobutanol with OH, J. Am. Chem. Soc., 2014, 136, 5150–5160 CrossRef CAS PubMed.
- J. Zheng, G. A. Oyedepo and D. G. Truhlar, Kinetics of the Hydrogen Abstraction Reaction From 2-Butanol by OH Radical, J. Phys. Chem. A, 2015, 119, 12182–12192 CrossRef CAS PubMed.
- L. P. Viegas and A. J. C. Varandas, Coupled-Cluster Reaction Barriers of HO2 + H2O + O3: An Application of the Coupled-Cluster//Kohn-Sham Density Functional Theory Model Chemistry, J. Comput. Chem., 2014, 35, 507–517 CrossRef CAS PubMed.
- J. Tellinghuisen, Statistical Error Propagation, J. Phys. Chem. A, 2001, 105, 3917–3921 CrossRef CAS.
Footnote |
| † Electronic supplementary information (ESI) available. See DOI: https://doi.org/10.1039/d2ea00164k |
| This journal is © The Royal Society of Chemistry 2023 |