
 Open Access Article
 This Open Access Article is licensed under a Creative Commons Attribution-Non Commercial 3.0 Unported Licence
Optical properties of biomass burning aerosol during the 2021 Oregon fire season: comparison between wild and prescribed fires†
Andrey
Marsavin‡
a,
Ralph
van Gageldonk
b,
Noah
Bernays
c,
Nathaniel W.
May
c,
Daniel A.
Jaffe
*cd and
Juliane L.
Fry
 *ab
*ab
aDepartment of Chemistry and Environmental Studies Program, Reed College, Portland, OR, USA
bMeteorology and Air Quality Group, Environmental Sciences, Wageningen University, Wageningen, The Netherlands. E-mail: juliane.fry@wur.nl
cSchool of Science, Technology, Engineering, and Mathematics, University of Washington Bothell, Bothell, WA, USA. E-mail: djaffe@uw.edu
dDepartment of Atmospheric Science, University of Washington, Seattle, WA, USA
First published on 15th February 2023
Abstract
The Mt. Bachelor Observatory (MBO, 2.76 km a.s.l.) was frequently impacted by biomass burning (BB) smoke in 2021, an extreme forest fire year in the state of Oregon. We used measurements of fine particulate matter (PM1) and dry aerosol scattering and absorption coefficients (σscat and σabs) to determine intensive aerosol optical properties for 27 BB events observed at MBO from April to September 2021. Measurements of carbon monoxide (CO), carbon dioxide (CO2), and total oxidized nitrogen (NOy) were also made during the study period. Four BB events originated from prescribed fires (PFs) between April and May, and 23 events originated from wildfires (WFs) between June and September. On average, the ΔPM1/ΔCO normalized enhancement ratio (NER) was higher for the PF events, which we propose is due to more efficient organic aerosol condensation during quick plume dilution at colder ambient temperatures. At the same time, the PF events exhibited significantly higher Δσabs/ΔCO NERs at 652 nm, indicating a larger black carbon component. We attribute this to more efficient combustion, as supported by higher modified combustion efficiency (MCE) as well as higher ΔNOy/ΔCO NERs for the PF events. Median mass scattering efficiencies (MSE; σscat/PM1) ranged from 3.3 to 7.4 m2 g−1 (at 530 nm) across all biomass burning events, with no significant difference between WF and PF events. We found MSE to be positively correlated with plume concentration (ΔPM1) and negatively correlated with the scattering Ångström exponent, suggesting that fast coagulation in dense smoke drives size distributions towards larger particles with greater scattering efficiency.
Environmental significancePrescribed burning is a forest management technique that decreases fuel loads in forests, thereby limiting future area burned by wildfire. Typically conducted outside of the summer wildfire season under controlled conditions, smoke from prescribed fires can have different air quality impacts than wildfire smoke. This study characterizes the optical properties of biomass burning aerosol in both wild and prescribed fire smoke observed at the Mt. Bachelor Observatory in central Oregon. We find that smoke from prescribed fires was more absorbing, indicating a larger black carbon component that likely resulted from more efficient combustion. Further, we show a dependence of mass scattering efficiency on smoke plume concentration, which can aid data interpretation from aerosol light scattering instruments during extreme smoke events. |
1 Introduction
Aerosols emitted from biomass burning (BB) have a significant impact on air quality1,2 and global climate.3 BB aerosols can scatter and absorb sunlight, which alters Earth's radiation balance.4,5 These radiative effects can be significant both from dense, freshly emitted smoke and from aged smoke diluted into the background troposphere.6 In the western US, several factors, including climate-driven fuel aridity and high fuel loading from historical fire suppression, have led to increased wildfire activity in recent years.7 Wildfires and associated aerosol emission are projected to intensify under future climate change,8,9 although this trend can be slowed by proactive measures such as prescribed fire or other forest management activities.10 Prescribed fire types include understory (the fire consumes surface fuels but not large trees), pile (burning of previously gathered biomass piles resulting from logging or other fuel management activities), and broadcast (burning in areas with little to no canopy present). Fuel availability is substantially reduced in areas treated with prescribed fire, resulting in slower spread and less damage from future wildfires.11,12Over the past two decades, area burned by wildfire in the western US exceeded the area treated with prescribed fire by over an order of magnitude.13 This contrasts with the southeastern US, where the majority of BB is prescribed.1,14 Though necessary for restoring fire-adapted ecosystems, deployment of prescribed fire in the western US is often faced with resource and risk-related barriers. Prescribed burning is usually done outside of the summer wildfire season, when fuel moisture is high enough to prevent uncontrolled fire activity. Wind speeds and direction are also taken into account to minimize smoke intrusion into populated areas.15 In this study, we analyze observations of BB aerosol from wild and prescribed fires in the state of Oregon, US, in 2021. Prescribed fires in Oregon are regularly ignited from October to May, with an average of ∼700 km2 ignited per year between 2010 and 2020.16 The Pacific Northwest region of the US experienced an extreme heat wave event in late June 2021, setting all-time high temperature records and worsening drought conditions in many parts of Oregon.17 The ensuing 2021 wildfire season burned 3354 km2 in Oregon, compared to the 2011–2020 average of 2677 km2 burned per year,18 contributing to significant regional aerosol pollution.
BB aerosol mass is mostly organic, with smaller contributions from black carbon (BC) and inorganic material (e.g., nitrate, sulfate, ammonium, chloride).19–21 BC is the main absorptive component of BB aerosol, although a portion of organic carbon (OC) known as brown carbon (BrC) also has absorptive properties. BC exhibits mostly uniform absorption in the visible spectrum, while BrC absorption is more significant at shorter wavelengths.22,23 The BC/OC emission ratio varies widely based on combustion conditions, commonly described using the modified combustion efficiency (MCE), the ratio of CO2 enhancement to the sum of CO and CO2 enhancements in smoke (see Section 2.5). MCE typically spans the range of 0.7–1.0, with higher values implying flaming combustion that efficiently converts fuel to CO2.24,25 Smoldering combustion (MCE < 0.9) emits less BC and more OC relative to flaming combustion (MCE > 0.9).26,27
Secondary chemical transformations have competing effects on BB aerosol absorption following emission. Absorption by BC can be enhanced via internal mixing with OC, which forms organic coatings that refract light into the BC particle core (sometimes referred to as the lensing effect).28,29 The BrC fraction of OC can also grow after emission through the photooxidation (via OH radical) of aromatic volatile organics and the addition of absorbing carbonyl functional groups to non-aromatic compounds.22,30 Simultaneous fragmentation reactions and photobleaching (via prolonged solar irradiation), however, can lead to a net decrease in BrC absorption as smoke ages.31,32 In the absence of sunlight, oxidation by the nitrate radical at night or in dense smoke forms absorbing nitroaromatics and organonitrates, which enhance BrC absorption during dark aging.33–36
Gas/aerosol repartitioning can also significantly affect the optical properties of BB aerosol in the hours after emission.37,38 Evaporation during plume dilution decreases total aerosol mass, although evaporated semi-volatile compounds can re-condense onto existing particles or facilitate new particle formation via oxidation. Primary gas-phase compounds emitted from combustion can also condense into the aerosol phase, forming secondary organic aerosol (SOA). These processes happen simultaneously, and often balance one another out, leading to little to no net change in aerosol mass over the first ∼24 h of aging.39 In contrast, evaporation-driven mass loss dominates in older smoke.40 Condensation and coagulation processes can shift aerosol size distributions towards larger particles, which have higher scattering efficiencies. During the first day of aging, enhancement in scattering with time has a more significant effect on total light extinction than simultaneous enhancement in absorption through BC coating and secondary BrC formation.38 The loss rate of absorbing aerosol through photobleaching, volatilization, cloud processing, and other processes varies on time scales from days to weeks, and the resulting changes in optical properties of aged smoke are poorly constrained in global and regional models.41
Ground-based studies often sample BB smoke opportunistically, such that the sampled plumes have undergone varying extents of dilution and aging prior to measurement. Dilution extent can be accounted for by normalizing any change in a measured property by a non-reactive co-emitted species like CO. This method, however, does not account for dilution-driven changes in gas-particle equilibrium. Denser plumes from larger fires have slower dilution rates which favor coagulation and condensation, while less concentrated smoke from smaller fires is expected to have faster rates of dilution and evaporation, producing more SOA precursors.42–44
This study examines aerosol optical properties of BB plumes with varied dilution extents during transport to the Mt. Bachelor Observatory, a remote, high-altitude site in central Oregon. Our goals are to evaluate enhancements in submicron particulate matter (PM1) and its intensive optical properties (Ångström exponents, single scattering albedo, mass scattering and absorption efficiencies) in the context of fire type (wild vs. prescribed), ecoregion, and post-emission smoke processing. We find that BB aerosol was generally more absorbing (at all visible wavelengths) when MBO was impacted by prescribed fire smoke compared to wildfire smoke, which we attribute to more efficient combustion (i.e., more flaming than smoldering). We evaluate multiple methods for estimating combustion conditions to support our findings. Given the large range of aerosol mass loadings measured at MBO, we stress the importance of considering plume concentration when examining intensive properties of BB aerosol.
2 Methods
2.1 Mt. Bachelor Observatory
The Mt. Bachelor Observatory (MBO) is located on the summit of an isolated volcanic peak in central Oregon (43.98°N, 121.69°W, 2.76 km a.s.l.). Near-continuous measurements of aerosol scattering and absorption coefficients, CO, and CO2 have been in operation since 2004. In 2021, we added PM1 mass concentration and total oxidized reactive nitrogen (NOy) to the suite of measurements. Located within the Deschutes National Forest and 31 km east of Bend, Oregon (population: 100![[thin space (1/6-em)]](https://www.rsc.org/images/entities/char_2009.gif) 000), MBO has proven to be well situated to observe locally emitted and long-range transported smoke plumes.21,40,45–49 Mt. Bachelor is home to a ski resort with all electric lifts, and the only emissions at the summit come from occasional passes of snow-grooming equipment. These emissions are easily identified by short (<10 min) spikes in all measured species during the winter-spring ski season, and the affected periods have been removed from the data used in this analysis.
000), MBO has proven to be well situated to observe locally emitted and long-range transported smoke plumes.21,40,45–49 Mt. Bachelor is home to a ski resort with all electric lifts, and the only emissions at the summit come from occasional passes of snow-grooming equipment. These emissions are easily identified by short (<10 min) spikes in all measured species during the winter-spring ski season, and the affected periods have been removed from the data used in this analysis.
2.2 CO, CO2, meteorology, and NOy
CO and CO2 were measured with a Picarro G2302 cavity ring-down spectrometer. Calibrations were performed every 8 h using three different National Oceanographic and Atmospheric Administration (NOAA) calibration gas standards, which are referenced to the World Meteorological Organization's mole fraction calibration scale.50 Total uncertainty based on the precision of calibrations was ±4% for CO and ±2% for CO2. Basic meteorological parameters (temperature, pressure, relative humidity (RH), and wind speed) were also measured continuously as detailed by Ambrose et al.51NOy was measured using a commercial trace-level chemiluminescence detector (Thermo 42iQTL) with a custom molybdenum converter inlet. The inlet converter was reclaimed from another NOx instrument (Thermo 17i) and heated to 350 °C by an Omega CN616A temperature controller. This technique has been previously shown to reduce various NOy species to NO with near-unit efficiency (e.g., peroxy acyl nitrate, ethyl nitrate, N2O5, and HONO).52–54 The NOy sample did not pass through a filter before conversion so that particulate nitrate species would also be converted.55 Certain NOy species with greater thermal stability (e.g., HNO3) may be converted less effectively, leading to an underestimate of total NOy. We assume that this bias is small given that PAN and other organic nitrates account for the majority of NOy in aged wildfire smoke,46,56,57 and these species are readily reduced over heated molybdenum. We calibrated the NO chemiluminescence detector twice during the campaign using a multipoint standard addition method with an NO gas standard (4.52 ppmv from Airgas, Tooele, UT). Total uncertainty based on accuracy and precision errors was ±20%. Precision uncertainty between BB events was ±15%, as estimated from the standard deviation of NOy measurements when the instrument was sampling zero air (generated by a Sabio Model 1001 zero air generator) over a 60 min period.
2.3 Aerosol measurements and derived optical properties
Dry (RH < 35%) submicron aerosol scattering coefficients (σscat), absorption coefficients (σabs), and mass concentration (PM1) were measured using similar instruments and inlet configuration as described by Laing et al.48 An in-line 1 μm impactor was located upstream of all aerosol instruments, which were housed in an instrument room that was temperature-controlled at 20 ± 3 °C, typically 5–10 °C warmer than the ambient temperature. Because the last ∼2.5 m of the inlet line was also located in the instrument room, the ambient RH of the sample airstream was reduced to <35% (measured by the nephelometer) before reaching the aerosol instruments.PM1 mass concentrations were measured with a Grimm 1.109 optical particle counter (OPC). The OPC counts particles down to an optical diameter of 0.25 μm in 31 size bins, 11 of which are under the 1 μm size cut. A lognormal distribution of particle count is assumed based on the measured size distribution, which corrects for the unmeasured fraction of particles smaller than 0.25 μm. After assuming spherical particles, the volume distribution is converted to mass concentration using a constant density factor chosen by the manufacturer by reference to gravimetric PM measurements. The Grimm OPC has been designated as a US EPA federal equivalent method (FEM) for measuring PM2.5 mass concentrations. We note, however, that this conversion to mass concentration does not account for potential changes in BB aerosol density and refractive index. While these properties show little variation across replicate laboratory burns,58 there is evidence that both aerosol density and refractive index can change with smoke age.59 The OPC was factory-calibrated prior to deployment with polydisperse dolomite dust. Uncertainty based on flow rate and accuracy errors is estimated by the manufacturer at ±5%, although the true uncertainty of our PM1 measurement is likely larger considering the above approximations. We acknowledge that these assumptions cause our calculations involving OPC data to be difficult to directly compare to other studies which employed filter-based or laser-induced incandescence methods to measure mass concentration.
A TSI 3563 integrating nephelometer measured σscat at 450, 550, and 700 nm. Data reduction and uncertainty analysis for the nephelometer was conducted per Anderson and Ogren.60 Total uncertainty for σscat measurements was ±15–20% during BB events. A continuous light absorption photometer (CLAP) measured σabs at 467, 528, and 652 nm. The CLAP is a NOAA-built instrument that is based on the design of the 3λ particle soot absorption photometer (PSAP). Both the CLAP and the PSAP use the same 47 mm diameter glass-fiber filters, except the CLAP consecutively samples on eight spots of one filter compared to the single-spot sampling method of the PSAP, allowing the instrument to run unattended for longer periods before the filter needs manual replacement.61 Correction factors for aerosol scattering and filter loading derived by Bond et al.62 were applied to CLAP data. Uncertainty calculations were based on those used in a previous study at MBO for measurements with a PSAP.63 Combining sources of uncertainties62,64–66 yielded a total uncertainty of ±30–40% for σabs during BB events. Precision uncertainty for σscat and σabs between BB events, as estimated from the standard deviation of measurements over a 60 min window with no smoke influence at MBO, was <10%. We use the precision uncertainty when comparing individual BB events analyzed in this study, whereas total uncertainty is more appropriate for comparing our results with other studies that used different measurement methods.64 All aerosol data (σscat, σabs, and PM1) were averaged at 5 min intervals and corrected to standard temperature and pressure (STP; T = 273.15, P = 101.325 kPa).
For filter-based absorption photometers like the CLAP or the PSAP, instrument noise varies with filter transmittance (Tr), the ratio of light intensity measured through a loaded filter vs. through a clean filter. For this study, the CLAP was programmed to rotate to the next sampling spot once the Tr of the previous spot dropped to 0.4. If the instrument had rotated through the eight available spots of a single filter, sampling continued on the last spot until the filter was manually replaced. Due to the remote location of MBO, filters were not always replaced immediately after a major BB event, so in some cases, Tr dropped below 0.4 during several smoke-impacted periods. We base our treatment of σabs data collected with low Tr on the analysis of Luoma et al.,67 who found that PSAP response remained linear even with Tr < 0.4 when the Bond et al.62 correction scheme was applied (see Table 3 and Fig. 5 in Louma et al.67). We therefore chose to include CLAP data with low Tr in our analysis while noting that the total σabs uncertainty may be as high as ±60% during these periods due to scattering and loading artifacts beyond those accounted for by the correction scheme.68–70 Because of this high uncertainty, the absorption Ångström exponent (eqn (4)) was not calculated for five wildfire (WF) events during which minimum Tr dropped below 0.1 (see Table S1†). We emphasize that these events occurred during a limited interval (August 18–September 5, 2021) of the full six-month study period (April–September), and Tr remained well above 0.4 during most of the remaining BB events.
Single-scattering albedo (SSA) is defined as
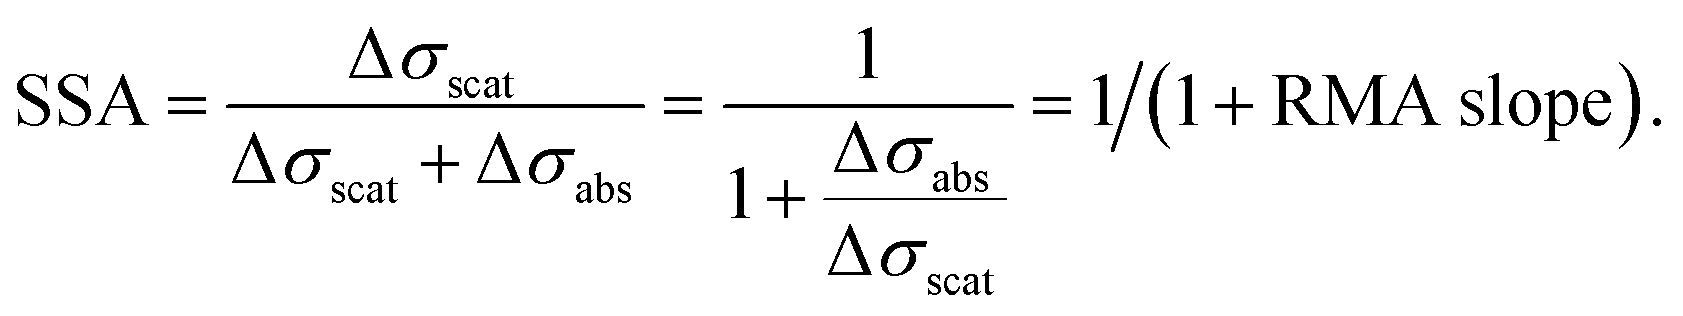 | (1) |
We calculated the SSA at 528 nm for each BB event by inserting the slope of the reduced major axis (RMA) regression of σabsvs. σscat into the right-hand side of eqn (1). R2 values between σabs and σscat were >0.80 for all events. We adjusted the 550 nm σscat value to 528 nm by assuming a power law relationship between scattering and wavelength:
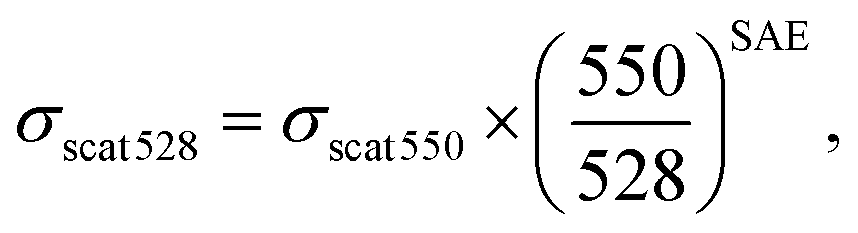 | (2) |
 | (3) |
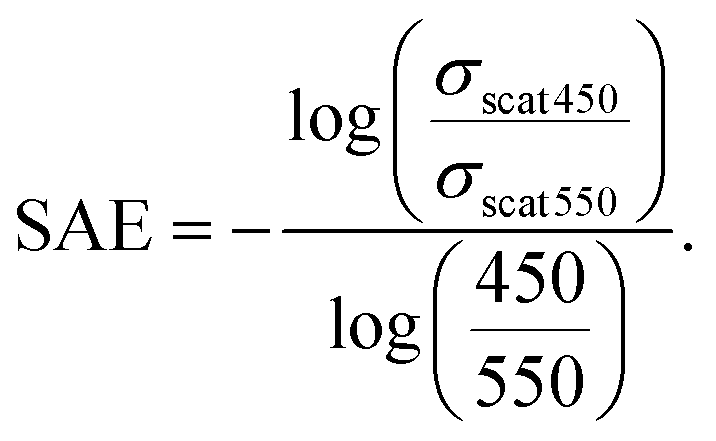
We calculated the absorption Ångström exponent (AAE) with the 467–652 nm σabs pair:
 | (4) |
We use the median 5 min value calculated for the BB event time range rather than the mean when comparing Ångström exponents between events to minimize the influence of outlier values, which can result from measurement error associated with a low absorption signal.71
Mass scattering efficiency (MSE) was calculated as the ratio of σscat at 550 nm to PM1 mass concentration at every 5 min data point, with the median value being used to compare across BB events. Analogously, the mass absorption efficiency (MAE) was calculated as the ratio of σabs at 528 nm to PM1. Uncertainties in Ångström exponents, MSE, and MAE were calculated by adding the uncertainties of each measurement used in the respective calculation in quadrature. Uncertainty in SSA was calculated by adding in quadrature the uncertainties in σscat, σabs, and the standard deviation of the slope of the RMA regression of σabsvs. σscat. Precision and total uncertainties in aerosol optical properties for each BB event are listed in Table S1.†
2.4 Biomass burning event identification
Previous studies at MBO have developed a set of criteria to identify smoke-impacted periods. Laing et al.48 identified periods with σscat (at 550 nm) ≥ 20 Mm−1 and CO ≥ 150 ppbv for at least 1 h as BB events, if back trajectory analysis also indicated transport from known fires. Wigder et al.45 and Baylon et al.46 used similar criteria with data collected at MBO. For this analysis, we modified these criteria given that 2021 was an extremely active fire year for the region: 23% of 1 h-averaged data met the criteria used by Laing et al.48 from April to September, and 46% from July to September alone. Considering the variability in background concentrations during smoke-impacted periods (peaks in σscat and CO in the July–September period often coincided with already elevated background σscat and CO), we identified BB events as periods when σscat550 and CO rose by 50 Mm−1 and 50 ppbv, respectively, above the local background and stayed above these thresholds for at least 1 h. We excluded several “smoky periods” where these thresholds were exceeded for more than 20 h, as these events were influenced by multiple sources with large variability in transport times to MBO, and hence less relevant for comparison with shorter duration events. We also required σscat to remain strongly correlated with CO (R2 ≥ 0.70) for the duration of each event.We used the NOAA Hybrid Single-Particle Lagrangian Integrated Trajectory (HYSPLIT) model72 accessed from AirNow-Tech Navigator73 to determine the source of each BB event and to estimate transport time to MBO. Back trajectories were calculated in reference to meters above model ground level (a.m.g.l.) using 12 km resolution meteorological data from the North American Mesoscale Forecast System (NAM). The summit of Mt. Bachelor is ∼1500 m above the surrounding terrain, so trajectories were initiated at a starting height of 1500 a.m.g.l. with a new trajectory generated every hour for the duration of each event. In cases where the source fire could not be clearly identified, additional trajectories were initiated at 500 m a.m.g.l. to reflect daytime upslope transport to MBO. We referred to the NOAA Hazard Mapping System (HMS) Fire and Smoke Product74 and the NASA Fire Information for Resource Management System75 to locate active fires in regions under the back trajectory path. Events were identified as prescribed fires (PFs) if the hotspot location and timing matched the information listed on US Forest Service regional fire agencies' webpages: Central Oregon Fire76 for PFs in the Deschutes National Forest, and South Central Oregon Fire Management Partnership77 for PFs in the Fremont-Winema National Forest. Locations of wildfire events were confirmed using the US Forest Service Incident Information System.78
2.5 Normalized enhancement ratios and modified combustion efficiency
Normalized enhancement ratios (NER; ΔX/ΔY) for each event were calculated as the slope of the RMA regression of species X vs. species Y at 5 min averages. Changes in background concentrations during plume transport can impact NERs calculated with the RMA slope (or a different regression method), particularly when a plume rises from the boundary layer and dilutes in the free troposphere.79 Uncertainty associated with a changing background is reduced when the species of interest are significantly enhanced above the local background, and when the correlation between the two species is strong.21,47 Given that our criteria for BB events required σscat and CO to be elevated above the local background by at least 50 Mm−1 and 50 ppbv, respectively, we use the RMA method to calculate all NERs. NERs were not calculated when the R2 value between the two species X and Y was less than 0.50.Modified combustion efficiency (MCE) is defined as:
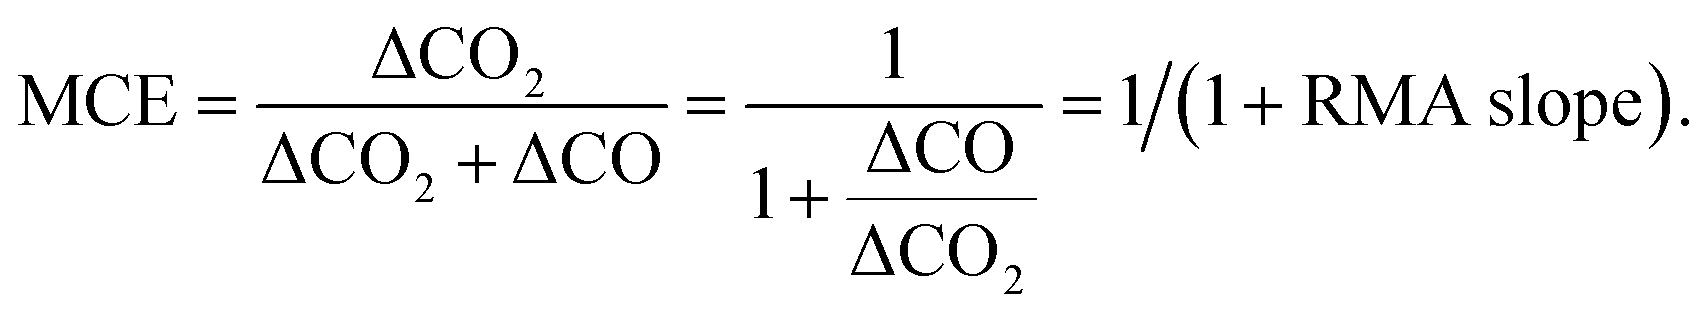 | (5) |
Like SSA, MCE was calculated by inserting the slope of the RMA regression of CO vs. CO2 into the right-hand side of eqn (5), only for events where CO and CO2 were well-correlated (R2 ≥ 0.50). Calculating the MCE with aged smoke is prone to additional uncertainties given that CO2 is not always clearly enhanced during BB events and there are significant variations in background CO2 due to upslope/downslope winds at MBO.47,80 We discuss these uncertainties and compare MCE to other proxies of combustion conditions (Δσabs/ΔCO, ΔNOy/ΔCO) in Section 3.2. Uncertainties for all NERs and MCE were estimated in the same way as for SSA: each measurement uncertainty was added in quadrature with the standard deviation of the slope of the RMA regression of the two species in question.
2.6 Hourly fire radiative power product
Fire radiative power (FRP), defined as the rate at which an active fire is emitting radiative energy, is a remote sensing metric proportional to the rates of fuel consumption and smoke emission.81,82 In this study we use hourly 3 km gridded FRP from the Regional ABI and VIIRS Fire Emissions (RAVE) product.83 RAVE fuses observations from the Advanced Baseline Imager (ABI) aboard the Geostationary Operational Environmental Satellite R Series (GOES-R) with Visible Infrared Imaging Radiometer Suite (VIIRS) observations aboard the Suomi National Polar-Orbiting Partnership (S-NPP) and NOAA-20 satellites. A dynamic cloud correction is applied to prevent both the underestimation of FRP under partial cloud cover and the overestimation of FRP in grids with high cloud fractions, as burning conditions under clear vs. cloudy skies are not the same (see details in Li et al.83). We use the RAVE FRP product to contextualize MBO observations by identifying the source fire for each BB event (Section 2.4) and summing FRP observations across the fire area for each hour that the fire was active (i.e., FRP > 0). We then calculate the mean and median FRP (in MW) across the entire fire lifecycle (Table S2†). We also estimate an area-weighted FRP density (in MW km2) by dividing FRP observations by the total area with FRP > 0 for a given fire. Given that several events were influenced by multiple fires with variable transport times (Table 1), we use FRP to examine broad differences in fire intensity between fire type (prescribed vs. wild) and ecoregion (Section 3.1) rather than comparing the FRP of individual events.| Event number | Date and time (local time, UTC-8) | Duration (h) | Type | East/West slope of Oregon Cascades? | Forest type | Estimated transport time (h) | ΔPM1 (μg m−3) |
|---|---|---|---|---|---|---|---|
| 1 | 4/14/21 13:30–4/14/21 17:15 | 3.75 | PF | East | Ponderosa pine | 1 ± 1 | 156 |
| 2 | 4/21/21 12:30–4/21/21 15:30 | 3 | PF | East | Ponderosa pine | 2 ± 1 | 106 |
| 3 | 4/28/21 18:00–4/28/21 21:15 | 3.25 | PF | East | Ponderosa pine | 5 ± 1 | 32 |
| 4 | 5/5/21 16:00–5/5/21 20:45 | 4.75 | PF | East | Ponderosa pine | 7 ± 1 | 80 |
| 5 | 6/20/21 7:45–6/20/21 22:30 | 14.75 | WF | East | Ponderosa pine | 19 ± 9 | 58 |
| 6 | 7/5/21 20:45–7/5/21 22:45 | 2 | WF | West | Douglas-fir | 5 ± 1 | 123 |
| 7 | 7/6/21 9:45–7/7/21 00:45 | 15 | WF | West | Douglas-fir | 17 ± 6 | 38 |
| 8 | 7/9/21 18:45–7/9/21 23:15 | 4.5 | WF | West | Douglas-fir | 4 ± 1 | 194 |
| 9 | 7/10/21 18:45–7/10/21 21:45 | 3 | WF | West | Douglas-fir | 5 ± 1 | 111 |
| 10 | 7/13/21 15:45–7/13/21 20:45 | 5 | WF | East | Ponderosa pine | 7 ± 1 | 53 |
| 11 | 7/17/21 16:30–7/17/21 19:00 | 2.5 | WF | West | Douglas-fir | 4 ± 1 | 16 |
| 12 | 8/15/21 10:30–8/15/21 23:45 | 13.25 | WF | West | Douglas-fir | 6 ± 3 | 173 |
| 13 | 8/18/21 23:15–8/19/21 01:30 | 2.25 | WF | West | Douglas-fir | 3 ± 1 | 448 |
| 14 | 8/20/21 9:45–8/20/21 15:00 | 5.25 | WF | West | Douglas-fir | 7 ± 1 | 51 |
| 15 | 8/22/21 13:15–8/22/21 19:00 | 5.75 | WF | West | Douglas-fir | 3 ± 1 | 184 |
| 16 | 8/25/21 2:45–8/25/21 22:30 | 19.75 | WF | West | Douglas-fir | 6 ± 3 | 268 |
| 17 | 8/26/21 12:00–8/26/21 20:15 | 8.25 | WF | West | Douglas-fir | 2 ± 1 | 172 |
| 18 | 8/29/21 19:00–8/29/21 20:45 | 1.75 | WF | West | Douglas-fir | 6 ± 1 | 276 |
| 19 | 8/30/21 10:30–8/30/21 19:00 | 8.5 | WF | West | Douglas-fir | 2 ± 1 | 124 |
| 20 | 9/3/21 9:00–9/3/21 11:15 | 2.25 | WF | West | Douglas-fir | 11 ± 6 | 96 |
| 21 | 9/3/21 14:00–9/4/21 09:00 | 19 | WF | West | Douglas-fir | 6 ± 6 | 347 |
| 22 | 9/4/21 9:45–9/4/21 22:45 | 13 | WF | West | Douglas-fir | 4 ± 3 | 353 |
| 23 | 9/5/21 7:45–9/5/21 23:45 | 16 | WF | West | Douglas-fir | 3 ± 1 | 447 |
| 24 | 9/11/21 22:15–9/12/21 06:30 | 8.25 | WF | West | Douglas-fir | 6 ± 3 | 74 |
| 25 | 9/12/21 13:00–9/12/21 18:30 | 5.5 | WF | West | Douglas-fir | 3 ± 1 | 43 |
| 26 | 9/17/21 1:30–9/17/21 06:00 | 4.5 | WF | West | Douglas-fir | 2 ± 1 | 147 |
| 27 | 9/17/21 13:45–9/17/21 22:45 | 9 | WF | West | Douglas-fir | 3 ± 1 | 128 |
| PF mean ± standard deviation | 3.7 ± 0.8 | 3.8 ± 2.8 | 94 ± 52 | ||||
| WF mean ± standard deviation | 8.2 ± 5.7 | 5.8 ± 4.4 | 170 ± 128 |
3 Results and discussion
3.1 Overview of 2021 biomass burning events
Table 1 shows a summary of the 27 BB events identified between April and September 2021. Time series of data collected at MBO during this study period are shown in Fig. 1, and the suspected source fire locations are shown in Fig. 2. Events 1–4 were associated with prescribed fires (PFs) that burned in ponderosa pine-dominated forests on the eastern slopes of the Oregon Cascades mountain range in April and May. HYSPLIT back trajectories show that Events 1 and 2 originated southwest of Sisters, OR, 30 km northeast of MBO. Event 3 originated 70 km south of MBO. The sources of Events 1–3 were within the Deschutes National Forest. Event 4 originated near Chiloquin OR, 140 km south of MBO, with a longer estimated plume transport time of ∼7 h compared to 1 h for Event 1, 2 h for Event 2, and 5 h for Event 3. The source of this event started as the North 2 PF in the Fremont–Winema National Forest on May 4, before being converted to wildfire status (renamed the Meadow Fire) the next day when fire behavior escalated beyond what was planned for. Conversion to wildfire status was done to bring in fire suppression aircraft, and the fire never breached the original perimeter intended for prescribed burning.77 In this study we consider Event 4 as a PF event given that it originated from the eastern Oregon Cascades and outside of the summer wildfire season, making this event similar to Events 1–3 in seasonality and ecoregion. | ||
| Fig. 1 Time series of 5 min CO, CO2, NOy, PM1, σscat (550 nm), and σabs (528 nm) measurements from MBO during the April and September 2021 study period. The periods shaded in blue and red show periods when MBO was impacted by PF and WF smoke, respectively. NOy data was not collected between May 2 and July 21. PM1, σscat, and σabs data were not collected between July 31 and August 13. No σabs data was collected between September 6 and September 15. | ||
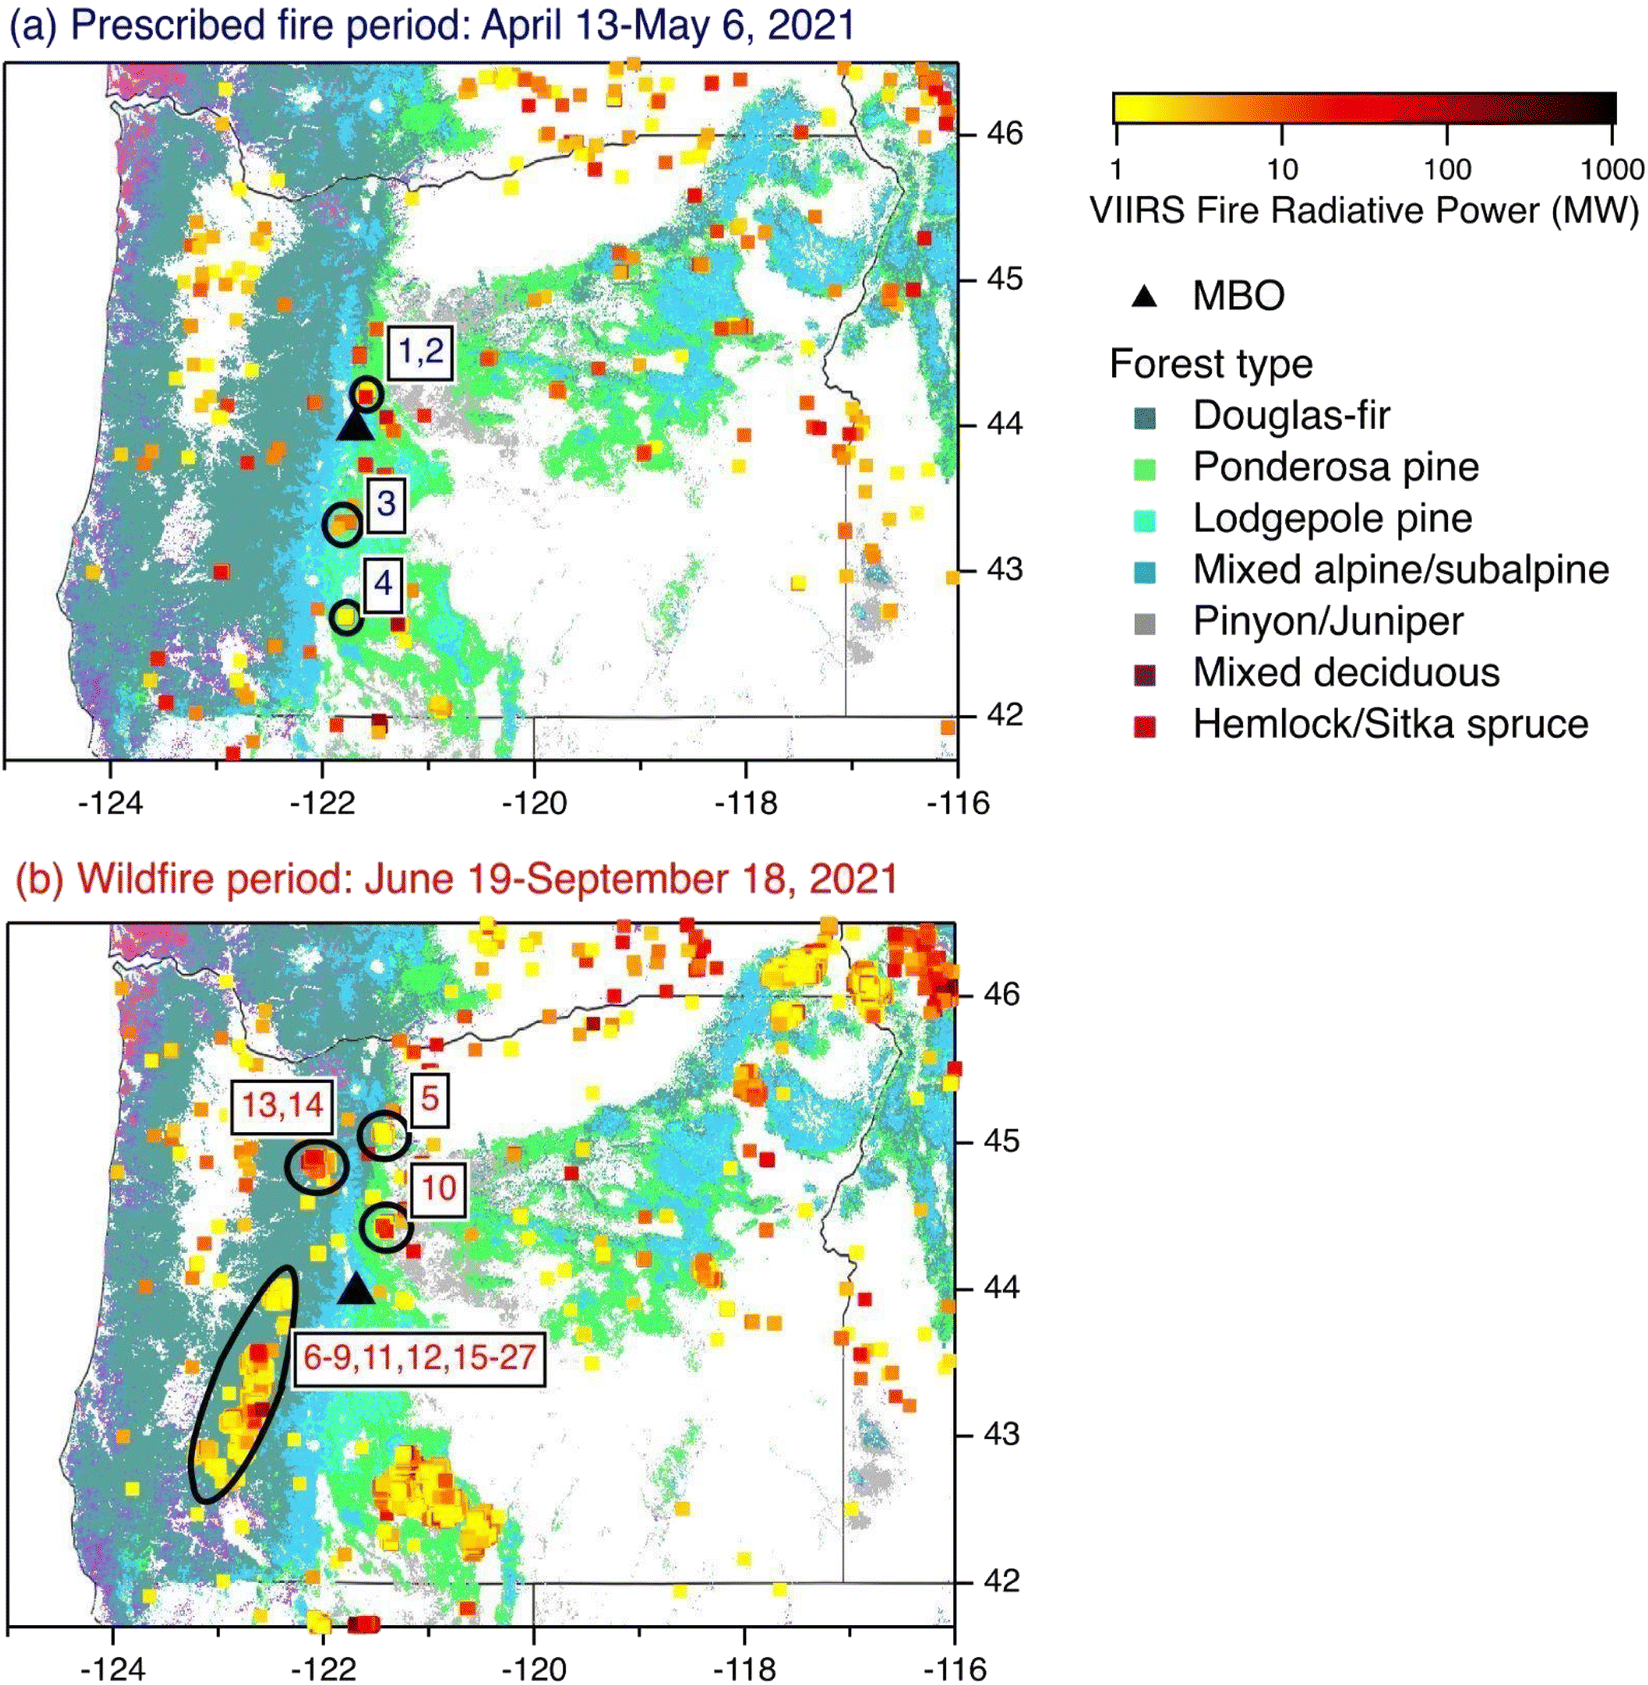 | ||
| Fig. 2 Fire hotspots in Oregon between (a) April 13 and May 6, 2021, and (b) June 19 and September 18, 2021, colored by their VIIRS fire radiative power (FRP). Note the log scale of the FRP coloring. Suspected source fires are circled and labeled by event number. Note that the circles sometimes include more than one fire. The black triangle shows the location of MBO. Forest type data from the US Forest Service National Forest Type Dataset.85 | ||
The remaining events originated from wildfires (WFs) between June and September. Two WF events originated from the eastern Cascades: Event 5 (S-503 fire, Warm Springs Reservation, 120 km north of MBO) and Event 10 (Grandview fire, Deschutes National Forest/Crooked River National Grassland, 50 km northeast of MBO). The remaining WFs originated from fires in Douglas-fir-dominated forests of the western Cascades, including the Jack fire (Umpqua National Forest, ∼100 km southwest of MBO, source of Events 6–9, and 11) and the Bull Complex fire (Mt. Hood National Forest, ∼100 km northwest of MBO, source of Events 13 and 14). Events 12, 15–27 were influenced by multiple fires in southwestern Oregon, namely the Middle Fork Complex (∼60 km west of MBO), Rough Patch Complex (∼90 km southwest of MBO), Devils Knob Complex (∼130 km southwest of MBO), and Skyline Ridge Complex fires (∼170 km southwest of MBO). We note that other large wildfires burned in eastern Oregon in 2021 (e.g., the 1674 km2 Bootleg fire),84 but persistent westerly wind during the summer resulted in the majority of WF events at MBO to originate from southwestern Oregon. Based on HYSPLIT back trajectories, the mean (±standard deviation) estimated transport time for the WF events was 5.8 ± 4.4 h, compared to 3.8 ± 2.8 h for PF events (Table 1). Several WF events had significantly longer transport times, namely Event 5 (19 ± 9 h), Event 7 (17 ± 6 h), and Event 20 (11 ± 6 h). One WF event that originated from Northern California on June 30, 2021, was excluded from this analysis given that its longer transport time (∼48 h) deemed it less comparable to the Oregon BB events, which were all transported to MBO in approximately 24 h or less. HYSPLIT back trajectory plots for each event are included in the ESI.†
The hourly RAVE FRP product (Section 2.6) revealed substantial differences in the duration and intensity of the sampled fires. Notably, there was active FRP data for 3 days for PFs 1 and 4, and just 1 day for PFs 2 and 3, while the WFs remained active for an average of 30 days (maximum 51 days for the Middle Fork Complex). FRP statistics derived from the RAVE product are listed in Table S2.† The longer duration and larger area of the WFs resulted in much larger total fire radiative energy (FRE; the time-integral of FRP), and consequently much larger total emissions than the PFs. We constructed diurnal cycles of FRP for each sampled fire based on the average FRP at each hour that the fire was active (Fig. S1†). The diurnal cycles show that the PFs were active only during the day, while both eastern and western Cascades WFs remained active at night with peak FRP occurring in the afternoon. Despite the smaller absolute FRP of the PFs, medians of area-weighted FRP density revealed that the PFs burned at comparable intensity to the western Cascades fires (8.84 ± 1.78 vs. 9.13 ± 2.23 MW km−2). The two eastern Cascades WFs (S-503 and Grandview fires) burned at the highest median and mean FRP density (Table S2†), which underscores the importance of ecoregion on fire behavior. We discuss the potential causes of these differences in fire behavior (and resulting smoke properties observed at MBO) in Section 3.2.
3.2 Influence of combustion conditions on aerosol absorption
We tested the statistical significance of differences in PF and WF event properties using one-way analysis of variance (ANOVA) (Table 2). At the 95% confidence level, the Δσabs/ΔCO normalized enhancement ratio (NER) at all three of the measured σabs wavelengths was significantly higher for PF events, especially at 652 nm (Δσabs652/ΔCO; P = 0.008). Considering that brown carbon (BrC) mostly absorbs at shorter wavelengths, the Δσabs652/ΔCO NER can be used as a surrogate for the black carbon (BC) NER, assuming minimal contribution from BrC species that also absorb in the red and near-infrared.86,87 Higher mean Δσabs652/ΔCO during PF events suggests greater emission of BC (relative to fuel burned) compared to the WF events, which is also supported by observed differences in mass absorption efficiency (MAE; σabs/PM1) and the absorption Ångström exponent (AAE; eqn (4)). The AAE describes the wavelength dependence of absorption, with BC exhibiting an AAE of ∼1 due to nearly uniform absorption in the 0.4–1 μm wavelength range, while BrC exhibiting an AAE > 2 due to greater absorption at shorter wavelengths.28,71,88 The PF events had significantly lower mean AAE (1.93 ± 0.28) than WF events (2.71 ± 0.63) (P = 0.029), indicating a larger BC component (Fig. 3).| Prescribed fire (PF) events | Wildfire (WF) events | P value | |
|---|---|---|---|
| Number of events | 4 | 23 | |
| Estimated transport time (h) | 3.8 ± 2.8 | 5.8 ± 4.4 | 0.373 |
| ΔPM1 (μg m−3) | 94 ± 52 | 170 ± 128 | 0.254 |
| MCE | 0.92 ± 0.05 | 0.89 ± 0.03 | 0.159 |
| ΔNOy/ΔCO (pptv ppbv−1) | 6.90 ± 3.20 | 4.18 ± 2.56 | 0.087 |
| ΔPM1/ΔCO (μg m−3 ppbv−1) | 0.30 ± 0.10 | 0.16 ± 0.04 | <0.001 |
| Δσscat550/ΔCO (Mm−1 ppbv−1) | 1.44 ± 0.40 | 1.17 ± 0.33 | 0.160 |
| Δσabs467/ΔCO (Mm−1 ppbv−1) | 0.19 ± 0.07 | 0.11 ± 0.06 | 0.031 |
| Δσabs528/ΔCO (Mm−1 ppbv−1) | 0.15 ± 0.06 | 0.08 ± 0.05 | 0.018 |
| Δσabs652/ΔCO (Mm−1 ppbv−1) | 0.10 ± 0.04 | 0.05 ± 0.03 | 0.008 |
| SSA528 | 0.94 ± 0.03 | 0.91 ± 0.04 | 0.052 |
| AAE467–652 | 1.93 ± 0.28 | 2.71 ± 0.63 | 0.029 |
| SAE450–550 | 1.82 ± 0.08 | 1.84 ± 0.28 | 0.905 |
| MSE550 (m2 g−1) | 3.86 ± 0.38 | 4.91 ± 1.10 | 0.075 |
| MAE528 (m2 g−1) | 0.40 ± 0.12 | 0.30 ± 0.07 | 0.043 |
 | ||
| Fig. 3 Median absorption Ångström exponents (AAE) and scattering Ångström exponents (SAE) for 2021 BB events at MBO, with classification categories from Cappa et al.71 Each point corresponds to a single BB event and is colored by the Δσabs652/ΔCO NER. Error bars show the precision uncertainty of the medians. Triangles are prescribed fire (PF) events. Square points are wildfire (WF) events that originated from the western Oregon Cascades. The two diamond-shaped points correspond to WF events 5 and 10, which originated from the eastern Cascades. | ||
Higher Δσabs652/ΔCO NERs, higher MAE, and lower AAE in the PF events we sampled suggests more flaming combustion with enhanced BC emission. The modified combustion efficiency (MCE; eqn (5)) was indeed higher for PF events (0.92 ± 0.05) vs. WF events (0.89 ± 0.03), however, this difference was not significant at the 95% confidence level (P = 0.159) (Table 2). MCE may be a compromised metric of combustion conditions at MBO due to its large uncertainty in aged smoke. MBO experiences a strong diurnal variation in CO2, with varying free tropospheric and boundary layer influence (Fig. S2†), which can lead to an underestimation of the true ΔCO2 since a portion of the CO2 emitted by a fire is lost via boundary layer transport and mixing.47,79,80 Given the well documented relationship between combustion efficiency and BC emission for a variety of biomass types,89–92 the Δσabs652/ΔCO NER may be better suited for evaluating the influence of combustion efficiency on aerosol properties observed at MBO than MCE.
We also tested the ΔNOy/ΔCO enhancement ratio as a proxy for combustion conditions, given that more nitrogen oxides (NOx) are emitted from flaming combustion relative to smoldering.93–95 NOx emitted from BB is efficiently converted into other forms of NOy such as peroxy acyl nitrates and other organic nitrates within hours after emission,57 so the total ΔNOy/ΔCO ratio is expected to be conserved over the first day of aging, decreasing slightly with the formation and deposition of nitric acid (HNO3) and particulate nitrate.56 The PF events had higher mean ΔNOy/ΔCO than WF events (Table 2), but, like MCE, this difference was not significant (P = 0.087). ΔNOy/ΔCO NERs were, however, well-correlated with Δσabs652/ΔCO (Pearson's correlation coefficient r = 0.86; Fig. S3†), confirming that more oxidized nitrogen is emitted alongside BC during flaming combustion.
Fig. 4 shows event-averaged single scattering albedo (SSA; eqn (1)) at 528 nm plotted against our three proxies of combustion conditions: MCE, Δσabs652/ΔCO, and ΔNOy/ΔCO. The SSA is a key intensive optical property used to calculate the net radiative effect of BB aerosol,5 and laboratory studies have observed a sharp drop in the SSA of primary BB particles produced from high MCE fires.26,27,92,96 While the SSA measured during laboratory burns can range from 0.2 to 1, ambient BB smoke typically has a much narrower SSA range (0.8–1) due to photochemical processing and mixing.97 Previous field measurements and laboratory aging experiments have found SSA to increase rapidly with smoke age due to OA condensation/SOA formation, which leads to larger particles with higher scattering efficiency.37,38,98,99 The range of event-averaged SSA in our study was relatively tight (0.86–0.97), indicating that substantial secondary processing has occurred during transport to MBO. That said, negative correlations were still observed between SSA and our three proxies for combustion conditions, the strongest being the correlation between SSA and Δσabs652/ΔCO (r = −0.82), which shows that some degree of variation in SSA can be explained by combustion conditions even in smoke sampled several hours after emission. Both MCE and ΔNOy/ΔCO had similarly strong correlations with SSA (r = −0.71).
 | ||
| Fig. 4 Single-scattering albedo (SSA) at 528 nm plotted as a function of (a) modified combustion efficiency (MCE), (b) Δσabs652/ΔCO, and (c) ΔNOy/ΔCO NERs. Error bars show precision uncertainty. Pearson's correlation coefficient (r) is included for each relationship. Data are fit with reduced major axis (RMA) regressions with shading representing the 95% confidence interval of the fits. Events are shaped according to their origin in the same way as in Fig. 3. | ||
More flaming combustion during the PFs vs. WFs—as reflected by higher average MCE, Δσabs652/ΔCO, and ΔNOy/ΔCO—can be attributed to differences in seasonality and fuel type. Summertime WFs can have a high intensity flaming front, but residual smoldering continues well after their perimeter has been contained. This results in a lower average combustion efficiency compared to shorter duration spring/fall PFs that are extinguished completely after the desired perimeter has burned.100 Environmental conditions during the western United States WF season are more favorable for low MCE fires due to the lower moisture content of coarse ground layer fuels (dead wood) and duff that burn primarily by smoldering.101,102 Conversely, PFs outside of the WF season occur when fuel moisture is high, favoring the consumption of finer fuels (grasses, foliage, and fine woody debris) which burn mostly by flaming combustion.103 Indeed, PFs in central Oregon are only ignited if fuel moisture is above a predetermined threshold.15 Specific prescribed burning practices can also impact MCE: Zhang et al.104 observed lower organic carbon/elemental carbon emission ratios (indicative of more flaming combustion) in pile burning vs. understory prescribed burning near Lake Tahoe, CA. These conditions suggest that PFs are prone to emit more BC relative to fuel burned compared to WFs, although this is highly dependent on the ecoregion in which PFs are occurring. May et al.90 reported a mean BC emission ratio relative to CO of 6.5 ng m−3 ppbv−1 from two PFs in coniferous forests of the California Sierra Nevada mountains, which is almost double the mean BC emission ratio from four California WFs (3.3 ng m−3 ppbv−1) measured by Sahu et al.105 Pratt et al.106 reported BC emission ratios of up to 18 ng m−3 ppbv−1 for a sagebrush PF in Wyoming.
The PF events analyzed in this study burned in ponderosa pine-dominated forests of the eastern Oregon Cascades, while most WF events originated from Douglas-fir-dominated forests of the western Cascades (Fig. 2). Forests of the eastern Cascades have more open canopies and less fuel moisture averaged across all seasons compared to forests of the western Cascades, where fuels are dry enough to burn only during the summer wildfire season.107 In a laboratory study, Turn et al.108 found that the PM carbon fraction from combustion of dried ponderosa pine slash contained ∼15% more BC than from dried Douglas-fir slash. The two WF events in our study that originated from the eastern Cascades (Events 5 and 10) were clustered in a similarly low AAE range as the PF events (Fig. 3) and had higher Δσabs652/ΔCO and lower SSA than most western cascades WF events (Fig. 4) (MCE and ΔNOy/ΔCO data were not available for Events 5 and 10). As mentioned in Section 3.1, the source fires of Events 5 and 10 also exhibited the highest mean and median FRP density out of all fires sampled (Table S2†). When the 27 BB events are separated by ecoregion (the four PF events and two eastern Cascades WF events vs. 21 western Cascades WF events), the SSA is significantly lower (P < 0.001) for the eastern Cascades events (Table S3†). This indicates that the observed differences in aerosol properties between PF and WF events are likely driven by a combination of burning practices as well as the characteristic fuel type unique to the two ecoregions from which the BB events originated.
3.3 Normalized ΔPM1/ΔCO enhancement ratios were larger for prescribed fires than wildfires
Observed smoke concentration ranged from relatively dilute (absolute PM1 enhancement (ΔPM1) < 50 μg m−3) to extremely dense (ΔPM1 > 400 μg m−3) across the 27 BB events (Table 1). ΔPM1 was calculated as the difference between the 5 min maximum and minimum PM1 value during the event time range. While ΔPM1 was generally lower for PF events (mean ± 1σ: 94 ± 52 μg m−3) than WF events (170 ± 128 μg m−3), the mean ΔPM1/ΔCO NERs for PF events were significantly higher (0.30 ± 0.10 μg m−3 ppbv−1) than WF events (0.16 ± 0.04 μg m−3 ppbv−1) (P < 0.001; Table 2). The ΔPM1/ΔCO NER is driven by both combustion conditions and post-emission processing. A well-established relationship exists between total PM emission and MCE, such that smoldering combustion emits more PM (relative to fuel burned) than flaming combustion.109–111 Since we observed higher average MCE in PFs than WFs, as well as other metrics that indicate a greater degree of flaming combustion in these fires (Section 3.2), ΔPM1/ΔCO NERs for PFs may be biased high relative to WFs due to a smaller CO/CO2 emission ratio, however, no relationship was observed between ΔPM1/ΔCO and MCE. This suggests that the higher observed ΔPM1/ΔCO for PFs is likely due to efficient secondary chemistry conducive to PM mass gain.Following emission, PM mass gain through organic aerosol (OA) condensation is expected to largely balance mass loss through evaporation at least over the first day of aging.39 Our result can be compared to that of Selimovic et al.,112 who reported a ∼35% higher ΔPM2.5/ΔCO NER from a PF event compared to WF events sampled in Montana during summer 2018. PM1 typically accounts for more than 80% of PM2.5 in BB smoke.113 Smoke from the PF sampled by Selimovic et al.112 was aged ∼3 h compared to the more dilute, aged WF smoke (up to several days old), so the larger ΔPM2.5/ΔCO NER was likely driven by less evaporative mass loss compared to older WF smoke. In our study, the sources of PF events were similarly distant from MBO compared to WF events (Fig. 2), and smoke during PF events was, on average, only ∼2 h younger than WF smoke (Table 1). This suggests that PM mass loss through evaporation is unlikely to be the dominant driver of the observed differences in ΔPM1/ΔCO.
Ambient temperature may affect the ΔPM1/ΔCO NER given that warmer temperatures can slow OA condensation and enhance evaporation.114 As discussed by Selimovic et al.112 and Jaffe et al.,115 ΔPM/ΔCO NERs derived from ground-based measurements of smoke are typically lower than those from smoke sampled at higher altitudes from aircraft or mountain-top sites like MBO. The 4 PF events analyzed in our study were sampled in April–May 2021, when the average ambient temperature at MBO was lower (3.7 ± 6.6 °C during PF events) compared to summertime WF events (11 ± 4.0 °C). Fig. 5 shows the relationship between ΔPM1/ΔCO and temperature for all 27 BB events. Event 1 was by far the coldest (−6.0 °C) and considered an outlier in terms of temperature, while also having the largest observed ΔPM1/ΔCO NER (0.40 μg m−3 ppbv−1). Event 2 arrived at MBO one week after Event 1 (Table 1), and, despite also being a PF from the same area (Fig. 2), displayed a more moderate ΔPM1/ΔCO of 0.28 μg m−3 ppbv−1. Other aerosol properties, including σscat and σabs NERs and Ångström exponents, were very similar between the two events (Table S1†), yet the average temperature during Event 2 was ∼12 °C warmer. This suggests that more pronounced evaporative PM1 mass loss has occurred during the warmer event despite comparable primary emissions.
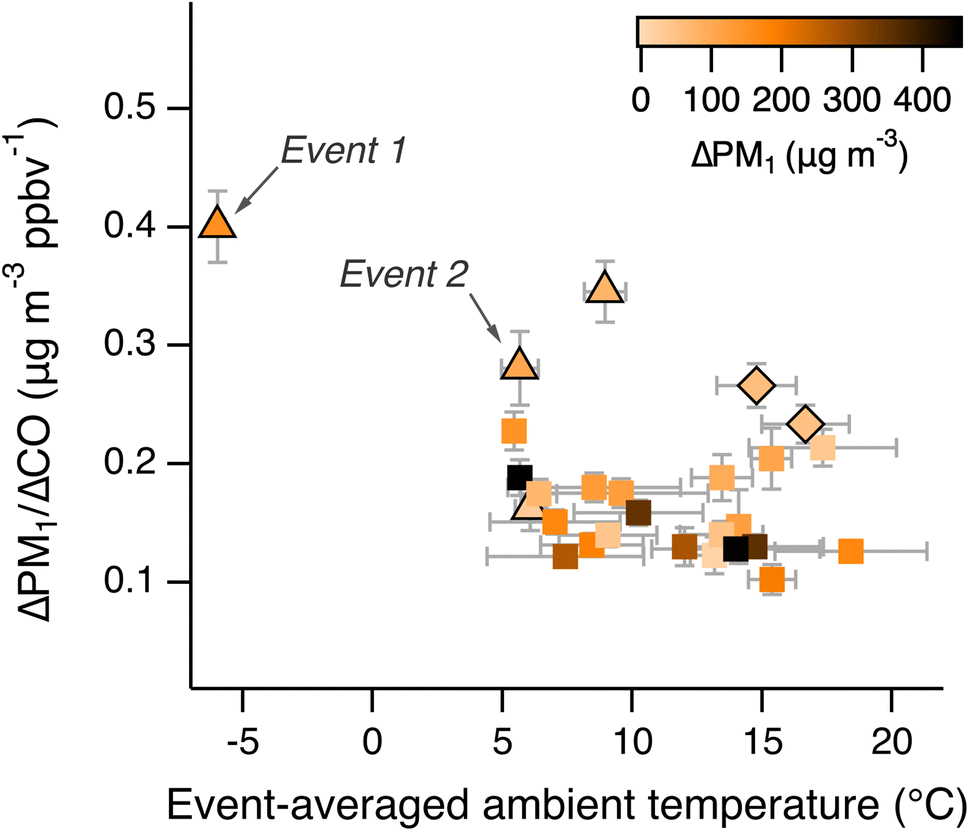 | ||
| Fig. 5 Relationship between ΔPM1/ΔCO (±precision uncertainty) and average ambient temperature (±standard deviation) for BB events observed in 2021. Each point corresponds to a single BB event and is colored by the absolute PM1 enhancement (ΔPM1). Events are shaped according to their origin in the same way as in Fig. 3. | ||
Differences in plume concentration may have also influenced the normalized PM1 enhancement. Hodshire et al.116 sorted smoke data from the 2013 BBOP aircraft campaign by percentiles of ΔCO and showed that the less concentrated plume edges had higher rates of evaporation and photochemistry, and slower rates of coagulation than the denser plume cores. This result is similar to the observations of Garofalo et al.,19 as well as the ground-based study of Lee et al.117 It follows that more efficient SOA formation is expected in dilute vs. concentrated plumes since evaporated compounds can act as SOA precursors and recondense.118 Given that the mean ΔPM1 was lower in PF vs. WF events, the PF events can be thought of as smaller, quicker-diluting plumes that are prone to faster secondary chemistry and hence, a more efficient increase in secondary PM mass. Chemical changes indicative of SOA formation have been observed within the first several hours after emission,38 which is consistent with our observations of relatively fresh (<24 h transport time) plumes.
The mean Δσscat550/ΔCO NER was also higher in PF events (1.44 ± 0.40 Mm−1 ppbv−1) compared to WF events (1.17 ± 0.33 Mm−1 ppbv−1) (Table 2). Though not significantly different (P = 0.160), this supports our interpretation that smoke from PFs experienced more efficient SOA formation during transport to MBO due to the temperature and dilution effects discussed above, since σscat of BB aerosol increases as particles get more oxidized.22,98,119 Like ΔPM1/ΔCO, no relationship was observed between Δσscat550/ΔCO and MCE, indicating that the scattering component, and hence the majority of the normalized PM1 enhancement, is more strongly driven by secondary processes rather than combustion conditions. Our observation of “smokier” (=higher ΔPM1/ΔCO) plumes from PFs is perhaps surprising given the more efficient combustion of these fires. We stress, however, that this result does not necessarily contradict the findings of Liu et al.96 and May et al.,90 who reported lower PM emission factors from both southeastern US and western US montane PFs compared to western US WFs. Instead, our results underscore the effects of post-emission processing on the observed ΔPM1/ΔCO NER in smoke lofted to the high altitude of MBO (2.76 km a.s.l.), which can mask the fuel and combustion efficiency-driven differences in initial PM emission. Total PM emission from WFs is still much larger than from PFs given more area burned and higher rates of fuel consumption.1
3.4 Drivers of mass scattering efficiency
The mass scattering efficiency (MSE; σscat/PM1) is a function of particle size, shape, density, and refractive index.120 Median MSE values ranged from 3.3 to 7.4 m2 g−1 across the 27 BB events, with no significant difference between PFs and WFs at the 95% confidence level (Table 2). This range is higher than previous observations of MSE at MBO (2.5–4.8 m2 g−1),47,48 although MSEs > 6 m2 g−1 at visible wavelengths have also been observed in BB smoke elsewhere.59,120–122 Because of the uncertainties and assumptions associated with using OPC data to estimate MSE (see Section 2.3), we caution against making direct comparisons between our MSE estimates and those made with more accurate mass concentration measurements or calculated using Mie theory. That said, we found robust relationships that explain some of the observed variability in MSE, which is important to understand given that this property is used to convert remote sensing observations of aerosol optical properties to mass concentrations,123 as well as a correction factor for ground-based light scattering instruments, including low-cost sensors.124Mie theory predicts that MSE will increase as mean particle diameter grows towards the measurement wavelength, and decrease if the particles continue to grow further.125Fig. 6 shows MSE (at 550 nm) plotted as a function of SSA and the scattering Ångström exponent (SAE). We observed a positive relationship (r = 0.56) between MSE and SSA, though there is a lot of variance in MSE within the 0.93–0.97 SSA range of most BB events. A positive relationship is expected given that higher SSA means more SOA accumulation, leading to larger particles that are more efficient scatterers. This can happen rapidly after emission: Kleinmann et al.38 observed an increase in MSE by over 50% in ambient BB plumes within 2 h after emission, despite minimal net change in PM1 mass. A similarly rapid increase in MSE was observed in FIREX-AQ data.59
 | ||
| Fig. 6 Mass scattering efficiency (MSE; σscat/PM1) at 550 nm plotted as a function of (a) single scattering albedo (SSA) at 528 nm, and (b) the scattering Ångström exponent (SAE). Each event is colored by the absolute PM1 enhancement (ΔPM1). Error bars show precision uncertainty. Data are fit with reduced major axis (RMA) regressions with shading representing the 95% confidence interval of the fits. Events are shaped according to their origin in the same way as in Fig. 3. Pearson's correlation coefficients (r) are shown for the plotted relationships. The r values for MSE vs. ΔPM1 and SAE vs. ΔPM1 are 0.69 and −0.44, respectively. | ||
We also observed a negative correlation between MSE and SAE (r = −0.73). The SAE describes the wavelength dependence of scattering and is inversely related to particle size.71 The mean SAE of PF events (1.82 ± 0.08) was very similar to the mean SAE of WF events (1.84 ± 0.02), suggesting that any effects of different combustion conditions on particle size are overshadowed by post-emission processing.27,126 Lower SAE and higher MSE was generally observed in denser plumes (ΔPM1 coloring in Fig. 6), which suggests that plume concentration may be a key driver of particle size, and by extension, MSE. Previous studies have concluded that coagulation has a larger effect on particle growth than OA evaporation/SOA formation, and coagulation rates are faster in denser plumes compared to more dilute plumes.43,44,127 Using data from a scanning mobility particle sizer (SMPS) deployed at MBO during summer 2015, Laing et al.48 found both MSE and geometric mean particle diameter to be strongly correlated with plume concentration. Our results suggest that about 50% of the observed variability in MSE is explained by particle size (based on the R2 between SAE and MSE), and that particle growth towards the measurement wavelength of 550 nm is more efficient in denser plumes. Additional potential drivers of MSE include changes in refractive index and aerosol density,59 which we are unable to quantify in the current study but warrant further investigation.
While we did not collect SMPS data in 2021, the relatively low SAE of several events are indicative of larger particles. The median SAE was less than 1.5 for two WFs (Events 12 and 22), which suggests a mixture of BC, BrC, and dust per the AAE/SAE classification scheme suggested by Cappa et al.71 (Fig. 3). Intense pyro-convective winds can uplift fine mineral dust that mixes with fire emissions,128 and several field studies of aerosol composition reported mixed dust/smoke transport from western US coniferous forest fires.129–131 It is therefore possible that some dust may have been mixed with smoke during several WFs observed in our study, which would result in higher MSE, although this cannot be confirmed without aerosol composition measurements. The lowest median SAE value (1.35 for Event 20) lies on the higher end of SAE previously reported for dust mixtures,71 so the events with lower SAE may as well have been influenced by larger BrC/BC particles rather than fine dust. While we use SAE as a surrogate for particle size, it is important to note that SAE is not a direct measure of particle size and can be influenced by other factors such as BC coating thickness.132
4 Conclusions
We characterized intensive aerosol optical properties during 27 BB events observed at the Mt. Bachelor Observatory (MBO) in 2021. Four of the 27 events originated from springtime (April–May) prescribed fires (PFs) in central and south-central Oregon. The remaining 23 events originated from summertime (June–September) Oregon wildfires (WFs). Δσabs/ΔCO normalized enhancement ratios (NERs) were, on average, significantly larger for the PF events, especially at 652 nm, which indicates a larger BC component in PF smoke. This is attributed to more efficient combustion (i.e., more flaming vs. smoldering), as supported by higher average modified combustion efficiency (MCE) and higher average ΔNOy/ΔCO NERs for the PF events. While most WF events originated from Douglas-fir-dominated forests of the western Oregon Cascades, the four PF events and two of the WF events originated from ponderosa pine-dominated forests of the eastern Oregon Cascades. Similarities in aerosol properties between the PFs and the eastern Cascades WFs show that regional fuel differences greatly influence combustion conditions and resulting BB aerosol absorption, and these fuel-related differences remain discernible even after several hours of photochemical processing. While the PFs burned at higher MCE, the mean ΔPM1/ΔCO NER was significantly larger for the four PF events compared to the 23 WF events. Given that the transport times to MBO of all 27 events were less than 1 day, this suggests that more efficient OA condensation/SOA formation enhanced the ΔPM1/ΔCO NER during the PF events, as enabled by colder ambient temperatures and lower plume concentrations compared to WF events. Despite the higher mean ΔPM1/ΔCO NERs, PFs had much lower fuel combustion rates than WFs as indicated by lower FRP, resulting in lower total PM emissions. Should prescribed burning become more frequent in ponderosa pine-dominated forests of the Pacific Northwest, regional models and air quality forecasts should consider greater BC emission per unit of fuel burned relative to summertime wildfires in Douglas-fir-dominated forests.Plume concentrations played a role in the observed range of mass scattering efficiencies (MSEs), with extremely concentrated WF events (ΔPM1 > 400 μg m−3) exhibiting MSEs upwards of 6 m2 g−1, mostly likely driven by efficient particle coagulation. The large range of MSEs observed in our study of regional smoke highlights the complex effects of rapid secondary processing on particle light extinction, which is relevant for predicting and validating air quality forecasts for smoke events. Oregon's Department of Environmental Quality (DEQ) currently estimates PM levels across the state by applying an empirical conversion to light scattering measurements.15,133 This method can introduce significant bias to the PM mass concentration estimate given that the MSE can vary substantially during moderate vs. extreme smoke events. To fully assess the variability of MSE, analyses of future fire seasons at MBO would benefit from measurements of mass concentration that do not rely on assumptions of constant density and refractive index, as well as additional observations of aerosol size distributions and composition.
Data availability
Data collected at the Mt. Bachelor Observatory are stored at the University of Washington ResearchWorks Archive. More information on data availability can be found at: https://blogs.uw.edu/djaffe/data/.Author contributions
AM, NB, NWM, DJ, and JLF carried out the field study. NB compiled and quality-controlled the dataset. AM, RvG, and NB performed the analysis. AM wrote the paper with contributions from all co-authors.Conflicts of interest
The authors declare that they have no conflict of interest.Acknowledgements
The Mt. Bachelor Observatory is supported by the National Science Foundation (grant #AGS-1447832) and the National Oceanic and Atmospheric Administration (contract #RA-133R-16-SE-0758). A. Marsavin and J. L. Fry acknowledge additional support from the Dreyfus Foundation, the Paul K. Richter and Evalyn Elizabeth Cook Richter Memorial Fund, and the Reed College Class of ‘21 award. The authors gratefully acknowledge S. Kondragunta, F. Li, and C. Xu for providing the reprocessed RAVE FRP product, as well as the NOAA Air Resources Laboratory (ARL) for providing the HYSPLIT transport model used in this publication. We thank J. Ewing for help with construction of the external converter for our NOy instrument. We thank the staff of the Mt. Bachelor Ski Area for their support.References
- D. A. Jaffe, S. M. O'Neill, N. K. Larkin, A. L. Holder, D. L. Peterson, J. E. Halofsky and A. G. Rappold, Wildfire and prescribed burning impacts on air quality in the United States, J. Air Waste Manage. Assoc., 2020, 70, 583–615 CrossRef CAS.
- K. O’Dell, K. Bilsback, B. Ford, S. E. Martenies, S. Magzamen, E. V. Fischer and J. R. Pierce, Estimated Mortality and Morbidity Attributable to Smoke Plumes in the United States: Not Just a Western US Problem, Geohealth, 2021, 5(9), e2021GH000457 CrossRef.
- J. T. Fasullo, N. Rosenbloom, R. R. Buchholz, G. Danabasoglu, D. M. Lawrence and J. -F. Lamarque, Coupled Climate Responses to Recent Australian Wildfire and COVID-19 Emissions Anomalies Estimated in CESM2, Geophys. Res. Lett., 2021, 48(5), e2021GL093841 CAS.
- T. C. Bond, S. J. Doherty, D. W. Fahey, P. M. Forster, T. Berntsen, B. J. DeAngelo, M. G. Flanner, S. Ghan, B. Kärcher, D. Koch, S. Kinne, Y. Kondo, P. K. Quinn, M. C. Sarofim, M. G. Schultz, M. Schulz, C. Venkataraman, H. Zhang, S. Zhang, N. Bellouin, S. K. Guttikunda, P. K. Hopke, M. Z. Jacobson, J. W. Kaiser, Z. Klimont, U. Lohmann, J. P. Schwarz, D. Shindell, T. Storelvmo, S. G. Warren and C. S. Zender, Bounding the role of black carbon in the climate system: a scientific assessment, J. Geophys. Res.: Atmos., 2013, 118, 5380–5552 CrossRef CAS.
- H. Brown, X. Liu, R. Pokhrel, S. Murphy, Z. Lu, R. Saleh, T. Mielonen, H. Kokkola, T. Bergman, G. Myhre, R. B. Skeie, D. Watson-Paris, P. Stier, B. Johnson, N. Bellouin, M. Schulz, V. Vakkari, J. P. Beukes, P. G. van Zyl, S. Liu and D. Chand, Biomass burning aerosols in most climate models are too absorbing, Nat. Commun., 2021, 12, 277 CrossRef CAS.
- G. P. Schill, K. D. Froyd, H. Bian, A. Kupc, C. Williamson, C. A. Brock, E. Ray, R. S. Hornbrook, A. J. Hills, E. C. Apel, M. Chin, P. R. Colarco and D. M. Murphy, Widespread biomass burning smoke throughout the remote troposphere, Nat. Geosci., 2020, 13, 422–427 CrossRef CAS.
- J. T. Abatzoglou and A. P. Williams, Impact of anthropogenic climate change on wildfire across western US forests, Proc. Natl. Acad. Sci. U. S. A., 2016, 113, 11770–11775 CrossRef CAS.
- Y. Li, L. J. Mickley, P. Liu and J. O. Kaplan, Trends and spatial shifts in lightning fires and smoke concentrations in response to 21st century climate over the national forests and parks of the western United States, Atmos. Chem. Phys., 2020, 20, 8827–8838 CrossRef CAS.
- Y. Xie, M. Lin, B. Decharme, C. Delire, L. W. Horowitz, D. M. Lawrence, F. Li and R. Séférian, Tripling of western US particulate pollution from wildfires in a warming climate, Proc. Natl. Acad. Sci. U. S. A., 2022, 119, e2111372119 CrossRef CAS.
- J. T. Abatzoglou, D. S. Battisti, A. P. Williams, W. D. Hansen, B. J. Harvey and C. A. Kolden, Projected increases in western US forest fire despite growing fuel constraints, Communications Earth & Environment, 2021, 2, 227 Search PubMed.
- N. M. Vaillant, J. Fites-Kaufman, A. L. Reiner, E. K. Noonan-Wright and S. N. Dailey, Effect of Fuel Treatments on Fuels and Potential Fire Behavior in California, USA, National Forests, Fire Ecol., 2009, 5, 14–29 CrossRef.
- P. M. Fernandes, Empirical Support for the Use of Prescribed Burning as a Fuel Treatment, Current Forestry Reports, 2015, 1, 118–127 CrossRef.
- C. Kolden, We're Not Doing Enough Prescribed Fire in the Western United States to Mitigate Wildfire Risk, Fire, 2019, 2, 30 CrossRef.
- S. L. Stephens, Forest fire causes and extent on United States Forest Service lands, Int. J. Wildland Fire, 2005, 14, 213 CrossRef.
- C. Miller, S. O'Neill, M. Rorig and E. Alvarado, Air-Quality Challenges of Prescribed Fire in the Complex Terrain and Wildland Urban Interface Surrounding Bend, Oregon, Atmosphere, 2019, 10, 515 CrossRef.
- Fire Protection Division, Oregon Depratment of Forestry, Oregon Smoke Management Annual Report, 2020 Search PubMed.
- R. White, S. Anderson, J. Booth, G. Braich, C. Draeger, C. Fei, C. Harley, S. Henderson, M. Jakob, C.-A. Lau, L. M. Admasu, V. Narinesingh, C. Rodell, E. Roocroft, K. Weinberger and G. West, The Unprecedented Pacific Northwest Heatwave of June 2021, Research Square, 2022 DOI:10.21203/rs.3.rs-1520351/v1.
- Statistics, https://www.nifc.gov/fire-information/statistics, accessed 31 August 2022.
- L. A. Garofalo, M. A. Pothier, E. J. T. Levin, T. Campos, S. M. Kreidenweis and D. K. Farmer, Emission and Evolution of Submicron Organic Aerosol in Smoke from Wildfires in the Western United States, ACS Earth Space Chem., 2019, 3, 1237–1247 CrossRef CAS.
- X. Liu, L. G. Huey, R. J. Yokelson, V. Selimovic, I. J. Simpson, M. Müller, J. L. Jimenez, P. Campuzano-Jost, A. J. Beyersdorf, D. R. Blake, Z. Butterfield, Y. Choi, J. D. Crounse, D. A. Day, G. S. Diskin, M. K. Dubey, E. Fortner, T. F. Hanisco, W. Hu, L. E. King, L. Kleinman, S. Meinardi, T. Mikoviny, T. B. Onasch, B. B. Palm, J. Peischl, I. B. Pollack, T. B. Ryerson, G. W. Sachse, A. J. Sedlacek, J. E. Shilling, S. Springston, J. M. S. Clair, D. J. Tanner, A. P. Teng, P. O. Wennberg, A. Wisthaler and G. M. Wolfe, Airborne measurements of western U.S. wildfire emissions: comparison with prescribed burning and air quality implications, J. Geophys. Res.: Atmos., 2017, 122, 6108–6129 CrossRef CAS.
- S. Collier, S. Zhou, T. B. Onasch, D. A. Jaffe, L. Kleinman, A. J. Sedlacek, N. L. Briggs, J. Hee, E. Fortner, J. E. Shilling, D. Worsnop, R. J. Yokelson, C. Parworth, X. Ge, J. Xu, Z. Butterfield, D. Chand, M. K. Dubey, M. S. Pekour, S. Springston and Q. Zhang, Regional Influence of Aerosol Emissions from Wildfires Driven by Combustion Efficiency: Insights from the BBOP Campaign, Environ. Sci. Technol., 2016, 50, 8613–8622 CrossRef CAS PubMed.
- R. Saleh, C. J. Hennigan, G. R. McMeeking, W. K. Chuang, E. S. Robinson, H. Coe, N. M. Donahue and A. L. Robinson, Absorptivity of brown carbon in fresh and photo-chemically aged biomass-burning emissions, Atmos. Chem. Phys., 2013, 13, 7683–7693 CrossRef.
- A. Laskin, J. Laskin and S. A. Nizkorodov, Chemistry of Atmospheric Brown Carbon, Chem. Rev., 2015, 115, 4335–4382 CrossRef CAS PubMed.
- D. E. Ward and L. F. Radke, Emissions Measurements from Vegetation Fires: A Comparative Evaluation of Methods and Results, in Fire in the Environment: The Ecological, Atmospheric and Chemical Importance of Vegetation Fires, ed. P. J. Crutzen and J. G. Goldhammer, John Wiley & Sons, New York, 1993 Search PubMed.
- R. J. Yokelson, D. W. T. Griffith and D. E. Ward, Open-Path Fourier Transform Infrared Studies of Large-Scale Laboratory Biomass Fires, J. Geophys. Res.: Atmos., 1996, 101, 21067–21080 CrossRef CAS.
- R. P. Pokhrel, N. L. Wagner, J. M. Langridge, D. A. Lack, T. Jayarathne, E. A. Stone, C. E. Stockwell, R. J. Yokelson and S. M. Murphy, Parameterization of single-scattering albedo (SSA) and absorption Ångströmexponent (AAE) with EC/OC for aerosol emissions from biomass burning, Atmos. Chem. Phys., 2016, 16, 9549–9561 CrossRef CAS.
- C. D. McClure, C. Y. Lim, D. H. Hagan, J. H. Kroll and C. D. Cappa, Biomass-burning-derived particles from a wide variety of fuels – part 1: properties of primary particles, Atmos. Chem. Phys., 2020, 20, 1531–1547 CrossRef CAS.
- D. A. Lack and J. M. Langridge, On the attribution of black and brown carbon light absorption using the Ångström exponent, Atmos. Chem. Phys., 2013, 13, 10535–10543 CrossRef.
- R. P. Pokhrel, E. R. Beamesderfer, N. L. Wagner, J. M. Langridge, D. A. Lack, T. Jayarathne, E. A. Stone, C. E. Stockwell, R. J. Yokelson and S. M. Murphy, Relative importance of black carbon, brown carbon, and absorption enhancement from clear coatings in biomass burning emissions, Atmos. Chem. Phys., 2017, 17, 5063–5078 CrossRef CAS.
- A. T. Lambe, C. D. Cappa, P. Massoli, T. B. Onasch, S. D. Forestieri, A. T. Martin, M. J. Cummings, D. R. Croasdale, W. H. Brune, D. R. Worsnop and P. Davidovits, Relationship between Oxidation Level and Optical Properties of Secondary Organic Aerosol, Environ. Sci. Technol., 2013, 47, 6349–6357 CrossRef CAS.
- H. J. (Julie) Lee, P. K. Aiona, A. Laskin, J. Laskin and S. A. Nizkorodov, Effect of Solar Radiation on the Optical Properties and Molecular Composition of Laboratory Proxies of Atmospheric Brown Carbon, Environ. Sci. Technol., 2014, 48, 10217–10226 CrossRef.
- B. J. Sumlin, A. Pandey, M. J. Walker, R. S. Pattison, B. J. Williams and R. K. Chakrabarty, Atmospheric Photooxidation Diminishes Light Absorption by Primary Brown Carbon Aerosol from Biomass Burning, Environ. Sci. Technol. Lett., 2017, 4, 540–545 CrossRef CAS.
- B. B. Palm, Q. Peng, C. D. Fredrickson, B. H. Lee, L. A. Garofalo, M. A. Pothier, S. M. Kreidenweis, D. K. Farmer, R. P. Pokhrel, Y. Shen, S. M. Murphy, W. Permar, L. Hu, T. L. Campos, S. R. Hall, K. Ullmann, X. Zhang, F. Flocke, E. V. Fischer and J. A. Thornton, Quantification of organic aerosol and brown carbon evolution in fresh wildfire plumes, Proc. Natl. Acad. Sci. U. S. A., 2020, 117, 29469–29477 CrossRef CAS.
- C. Li, Q. He, Z. Fang, S. S. Brown, A. Laskin, S. R. Cohen and Y. Rudich, Laboratory Insights into the Diel Cycle of Optical and Chemical Transformations of Biomass Burning Brown Carbon Aerosols, Environ. Sci. Technol., 2020, 54, 11827–11837 CrossRef.
- C. Li, Q. He, A. P. S. Hettiyadura, U. Käfer, G. Shmul, D. Meidan, R. Zimmermann, S. S. Brown, C. George, A. Laskin and Y. Rudich, Formation of Secondary Brown Carbon in Biomass Burning Aerosol Proxies through NO3 Radical Reactions, Environ. Sci. Technol., 2020, 54, 1395–1405 CrossRef CAS.
- B. Sumlin, E. Fortner, A. Lambe, N. Shetty, C. Daube, P. Liu, F. Majluf, S. Herndon and R. K. Chakrabarty, Diel Cycle Impacts on the Chemical and Light Absorption Properties of Organic Carbon Aerosol from Wildfires in the Western United States, Atmos. Chem. Phys., 2021, 21, 11843–11856 CrossRef CAS.
- V. Vakkari, V. Kerminen, J. P. Beukes, P. Tiitta, P. G. Zyl, M. Josipovic, A. D. Venter, K. Jaars, D. R. Worsnop, M. Kulmala and L. Laakso, Rapid changes in biomass burning aerosols by atmospheric oxidation, Geophys. Res. Lett., 2014, 41, 2644–2651 CrossRef CAS.
- L. I. Kleinman, A. J. Sedlacek III, K. Adachi, P. R. Buseck, S. Collier, M. K. Dubey, A. L. Hodshire, E. Lewis, T. B. Onasch, J. R. Pierce, J. Shilling, S. R. Springston, J. Wang, Q. Zhang, S. Zhou and R. J. Yokelson, Rapid evolution of aerosol particles and their optical properties downwind of wildfires in the western US, Atmos. Chem. Phys., 2020, 20, 13319–13341 CrossRef CAS.
- A. L. Hodshire, A. Akherati, M. J. Alvarado, B. Brown-Steiner, S. H. Jathar, J. L. Jimenez, S. M. Kreidenweis, C. R. Lonsdale, T. B. Onasch, A. M. Ortega and J. R. Pierce, Aging Effects on Biomass Burning Aerosol Mass and Composition: A Critical Review of Field and Laboratory Studies, Environ. Sci. Technol., 2019, 53, 10007–10022 CrossRef CAS.
- R. Farley, N. Bernays, D. A. Jaffe, D. Ketcherside, L. Hu, S. Zhou, S. Collier and Q. Zhang, Persistent Influence of Wildfire Emissions in the Western United States and Characteristics of Aged Biomass Burning Organic Aerosols under Clean Air Conditions, Environ. Sci. Technol., 2022, 56, 3645–3657 CrossRef CAS.
- A. J. Sedlacek, E. R. Lewis, T. B. Onasch, P. Zuidema, J. Redemann, D. Jaffe and L. I. Kleinman, Using the Black Carbon Particle Mixing State to Characterize the Lifecycle of Biomass Burning Aerosols, Environ. Sci. Technol., 2022, 56, 14315–14325 CrossRef.
- Q. Bian, S. H. Jathar, J. K. Kodros, K. C. Barsanti, L. E. Hatch, A. A. May, S. M. Kreidenweis and J. R. Pierce, Secondary organic aerosol formation in biomass-burning plumes: theoretical analysis of lab studies and ambient plumes, Atmos. Chem. Phys., 2017, 17, 5459–5475 CrossRef CAS.
- A. L. Hodshire, Q. Bian, E. Ramnarine, C. R. Lonsdale, M. J. Alvarado, S. M. Kreidenweis, S. H. Jathar and J. R. Pierce, More Than Emissions and Chemistry: Fire Size, Dilution, and Background Aerosol Also Greatly Influence Near-Field Biomass Burning Aerosol Aging, J. Geophys. Res.: Atmos., 2019, 124, 5589–5611 CrossRef CAS.
- N. A. June, A. L. Hodshire, E. B. Wiggins, E. L. Winstead, C. E. Robinson, K. L. Thornhill, K. J. Sanchez, R. H. Moore, D. Pagonis, H. Guo, P. Campuzano-Jost, J. L. Jimenez, M. M. Coggon, J. M. Dean-Day, T. P. Bui, J. Peischl, R. J. Yokelson, M. J. Alvarado, S. M. Kreidenweis, S. H. Jathar and J. R. Pierce, Aerosol size distribution changes in FIREX-AQ biomass burning plumes: the impact of plume concentration on coagulation and OA condensation/evaporation, Atmospheric Chemistry and Physics Discussions, 2022, 1–35 Search PubMed.
- N. L. Wigder, D. A. Jaffe and F. A. Saketa, Ozone and particulate matter enhancements from regional wildfires observed at Mount Bachelor during 2004–2011, Atmos. Environ., 2013, 75, 24–31 CrossRef CAS.
- P. Baylon, D. A. Jaffe, N. L. Wigder, H. Gao and J. Hee, Ozone enhancement in western US wildfire plumes at the Mt. Bachelor Observatory: the role of NOx, Atmos. Environ., 2015, 109, 297–304 CrossRef CAS.
- N. L. Briggs, D. A. Jaffe, H. Gao, J. R. Hee, P. M. Baylon, Q. Zhang, S. Zhou, S. C. Collier, P. D. Sampson and R. A. Cary, Particulate Matter, Ozone, and Nitrogen Species in Aged Wildfire Plumes Observed at the Mount Bachelor Observatory, Aerosol Air Qual. Res., 2017, 16, 3075–3087 CrossRef.
- J. R. Laing, D. A. Jaffe and J. R. Hee, Physical and optical properties of aged biomass burning aerosol from wildfires in Siberia and the Western USA at the Mt. Bachelor Observatory, Atmos. Chem. Phys., 2016, 16, 15185–15197 CrossRef CAS.
- S. Zhou, S. Collier, D. A. Jaffe, N. L. Briggs, J. Hee, A. J. Sedlacek III, L. Kleinman, T. B. Onasch and Q. Zhang, Regional influence of wildfires on aerosol chemistry in the western US and insights into atmospheric aging of biomass burning organic aerosol, Atmos. Chem. Phys., 2017, 17, 2477–2493 CrossRef CAS.
- L. E. Gratz, D. A. Jaffe and J. R. Hee, Causes of increasing ozone and decreasing carbon monoxide in springtime at the Mt. Bachelor Observatory from 2004 to 2013, Atmos. Environ., 2015, 109, 323–330 CrossRef CAS.
- J. L. Ambrose, D. R. Reidmiller and D. A. Jaffe, Causes of high O3 in the lower free troposphere over the Pacific Northwest as observed at the Mt. Bachelor Observatory, Atmos. Environ., 2011, 45, 5302–5315 CrossRef CAS.
- A. M. Winer, J. W. Peters, J. P. Smith and J. N. Pitts, Response of commercial chemiluminescent nitric oxide-nitrogen dioxide analyzers to other nitrogen-containing compounds, Environ. Sci. Technol., 1974, 8, 1118–1121 CrossRef CAS.
- D. Grosjean and J. Harrison, Response of chemiluminescence NOx analyzers and ultraviolet ozone analyzers to organic air pollutants, Environ. Sci. Technol., 1985, 19, 862–865 CrossRef CAS.
- A. Febo, C. Perrino, M. Gherardi and R. Sparapani, Evaluation of a High-Purity and High-Stability Continuous Generation System for Nitrous Acid, Environ. Sci. Technol., 1995, 29, 2390–2395 CrossRef CAS.
- C. E. Stockwell, A. Kupc, B. Witkowski, R. K. Talukdar, Y. Liu, V. Selimovic, K. J. Zarzana, K. Sekimoto, C. Warneke, R. A. Washenfelder, R. J. Yokelson, A. M. Middlebrook and J. M. Roberts, Characterization of a catalyst-based conversion technique to measure total particulate nitrogen and organic carbon and comparison to a particle mass measurement instrument, Atmos. Meas. Tech., 2018, 11, 2749–2768 CrossRef CAS.
- M. J. Alvarado, J. A. Logan, J. Mao, E. Apel, D. Riemer, D. Blake, R. C. Cohen, K.-E. Min, A. E. Perring, E. C. Browne, P. J. Wooldridge, G. S. Diskin, G. W. Sachse, H. Fuelberg, W. R. Sessions, D. L. Harrigan, G. Huey, J. Liao, A. Case-Hanks, J. L. Jimenez, M. J. Cubison, S. A. Vay, A. J. Weinheimer, D. J. Knapp, D. D. Montzka, F. M. Flocke, I. B. Pollack, P. O. Wennberg, A. Kurten, J. Crounse, J. M. S. Clair, A. Wisthaler, T. Mikoviny, R. M. Yantosca, C. C. Carouge and P. Le Sager, Nitrogen oxides and PAN in plumes from boreal fires during ARCTAS-B and their impact on ozone: an integrated analysis of aircraft and satellite observations, Atmos. Chem. Phys., 2010, 10, 9739–9760 CrossRef CAS.
- J. F. Juncosa Calahorrano, J. Lindaas, K. O’Dell, B. B. Palm, Q. Peng, F. Flocke, I. B. Pollack, L. A. Garofalo, D. K. Farmer, J. R. Pierce, J. L. Collett, A. Weinheimer, T. Campos, R. S. Hornbrook, S. R. Hall, K. Ullmann, M. A. Pothier, E. C. Apel, W. Permar, L. Hu, A. J. Hills, D. Montzka, G. Tyndall, J. A. Thornton and E. V. Fischer, Daytime Oxidized Reactive Nitrogen Partitioning in Western U.S. Wildfire Smoke Plumes, J. Geophys. Res.: Atmos., 2020, 126(4), e2020JD033484 Search PubMed.
- E. J. T. Levin, G. R. McMeeking, C. M. Carrico, L. E. Mack, S. M. Kreidenweis, C. E. Wold, H. Moosmüller, W. P. Arnott, W. M. Hao, J. L. Collett and W. C. Malm, Biomass burning smoke aerosol properties measured during Fire Laboratory at Missoula Experiments (FLAME), J. Geophys. Res., 2010, 115, D18210 CrossRef.
- P. E. Saide, L. H. Thapa, X. Ye, D. Pagonis, P. Campuzano-Jost, H. Guo, M. L. Schuneman, J. Jimenez, R. Moore, E. Wiggins, E. Winstead, C. Robinson, L. Thornhill, K. Sanchez, N. L. Wagner, A. Ahern, J. M. Katich, A. E. Perring, J. P. Schwarz, M. Lyu, C. D. Holmes, J. W. Hair, M. A. Fenn and T. J. Shingler, Understanding the Evolution of Smoke Mass Extinction Efficiency Using Field Campaign Measurements, Geophys. Res. Lett., 2022, 49(18), e2022GL099175 CrossRef.
- T. L. Anderson and J. A. Ogren, Determining Aerosol Radiative Properties Using the TSI 3563 Integrating Nephelometer, Aerosol Sci. Technol., 1998, 29, 57–69 CrossRef CAS.
- J. A. Ogren, J. Wendell, E. Andrews and P. J. Sheridan, Continuous light absorption photometer for long-term studies, Atmos. Meas. Tech., 2017, 10, 4805–4818 CrossRef.
- T. C. Bond, T. L. Anderson and D. Campbell, Calibration and Intercomparison of Filter-Based Measurements of Visible Light Absorption by Aerosols, Aerosol Sci. Technol., 1999, 30, 582–600 CrossRef CAS.
- E. V. Fischer, D. A. Jaffe, N. A. Marley, J. S. Gaffney and A. Marchany-Rivera, Optical properties of aged Asian aerosols observed over the U.S. Pacific Northwest, J. Geophys. Res., 2010, 115, D20209 CrossRef.
- T. L. Anderson, D. S. Covert, J. D. Wheeler, J. M. Harris, K. D. Perry, B. E. Trost, D. J. Jaffe and J. A. Ogren, Aerosol backscatter fraction and single scattering albedo: measured values and uncertainties at a coastal station in the Pacific Northwest, J. Geophys. Res., 1999, 104, 26793–26807 CrossRef CAS.
- T. L. Anderson, Variability of aerosol optical properties derived from in situ aircraft measurements during ACE-Asia, J. Geophys. Res., 2003, 108, ACE15-1–ACE15-19 Search PubMed.
- A. Virkkula, N. C. Ahlquist, D. S. Covert, W. P. Arnott, P. J. Sheridan, P. K. Quinn and D. J. Coffman, Modification, Calibration and a Field Test of an Instrument for Measuring Light Absorption by Particles, Aerosol Sci. Technol., 2005, 39, 68–83 CrossRef CAS.
- K. Luoma, A. Virkkula, P. Aalto, K. Lehtipalo, T. Petäjä and M. Kulmala, Effects of different correction algorithms on absorption coefficient – a comparison of three optical absorption photometers at a boreal forest site, Atmos. Meas. Tech., 2021, 14, 6419–6441 CrossRef CAS.
- R. Subramanian, C. A. Roden, P. Boparai and T. C. Bond, Yellow Beads and Missing Particles: Trouble Ahead for Filter-Based Absorption Measurements, Aerosol Sci. Technol., 2007, 41, 630–637 CrossRef CAS.
- D. A. Lack, C. D. Cappa, D. S. Covert, T. Baynard, P. Massoli, B. Sierau, T. S. Bates, P. K. Quinn, E. R. Lovejoy and A. R. Ravishankara, Bias in Filter-Based Aerosol Light Absorption Measurements Due to Organic Aerosol Loading: Evidence from Ambient Measurements, Aerosol Sci. Technol., 2008, 42, 1033–1041 CrossRef CAS.
- J. R. Laing, D. A. Jaffe and A. J. Sedlacek III, Comparison of Filter-Based Absorption Measurements of Biomass Burning Aerosol and Background Aerosol at the Mt. Bachelor Observatory, Aerosol Air Qual. Res., 2020, 20, 663–678 CrossRef CAS.
- C. D. Cappa, K. R. Kolesar, X. Zhang, D. B. Atkinson, M. S. Pekour, R. A. Zaveri, A. Zelenyuk and Q. Zhang, Understanding the optical properties of ambient sub- and supermicron particulate matter: results from the CARES 2010 field study in northern California, Atmos. Chem. Phys., 2016, 16, 6511–6535 CrossRef CAS.
- A. F. Stein, R. R. Draxler, G. D. Rolph, B. J. B. Stunder, M. D. Cohen and F. Ngan, NOAA's HYSPLIT Atmospheric Transport and Dispersion Modeling System, Bull. Am. Meteorol. Soc., 2015, 96, 2059–2077 CrossRef.
- AirNowTech Navigator, https://www.airnowtech.org/index.cfm?page=login.
- Office of Satellite and Product Operations – Hazard Mapping System, https://www.ospo.noaa.gov/Products/land/hms.html, accessed 31 August 2022.
- NASA-FIRMS, https://firms.modaps.eosdis.nasa.gov/map/, accessed 31 August 2022.
- Central Oregon Fire Information | Wildfire Updates | Air Quality, https://www.centraloregonfire.org/, accessed 31 August 2022.
- South Central Oregon Fire Management Partnership, https://www.scofmp.org/, accessed 31 August 2022.
- InciWeb the Incident Information System, https://inciweb.nwcg.gov/, accessed 31 August 2022.
- R. J. Yokelson, M. O. Andreae and S. K. Akagi, Pitfalls with the use of enhancement ratios or normalized excess mixing ratios measured in plumes to characterize pollution sources and aging, Atmos. Meas. Tech., 2013, 6, 2155–2158 CrossRef.
- C. D. McClure, D. A. Jaffe and H. Gao, Carbon Dioxide in the Free Troposphere and Boundary Layer at the Mt. Bachelor Observatory, Aerosol Air Qual. Res., 2016, 16, 717–728 CrossRef CAS.
- C. Ichoku and L. Ellison, Global top-down smoke-aerosol emissions estimation using satellite fire radiative power measurements, Atmos. Chem. Phys., 2014, 14, 6643–6667 CrossRef.
- J. W. Kaiser, A. Heil, M. O. Andreae, A. Benedetti, N. Chubarova, L. Jones, J.-J. Morcrette, M. Razinger, M. G. Schultz, M. Suttie and G. R. van der Werf, Biomass burning emissions estimated with a global fire assimilation system based on observed fire radiative power, Biogeosciences, 2012, 9, 527–554 CrossRef CAS.
- F. Li, X. Zhang, S. Kondragunta, X. Lu, I. Csiszar and C. C. Schmidt, Hourly biomass burning emissions product from blended geostationary and polar-orbiting satellites for air quality forecasting applications, Remote Sensing of Environment, 2022, 281, 113237 CrossRef.
- Bootleg Fire Information – InciWeb the Incident Information System, https://inciweb.nwcg.gov/incident/7609/, accessed 31 August 2022.
- USDA Forest Service FSGeodata Clearinghouse – National Forest Type Dataset, https://data.fs.usda.gov/geodata/rastergateway/forest_type/, accessed 31 August 2022.
- A. Hoffer, Á. Tóth, M. Pósfai, C. E. Chung and A. Gelencsér, Brown carbon absorption in the red and near-infrared spectral region, Atmos. Meas. Tech., 2017, 10, 2353–2359 CrossRef CAS.
- A. J. Sedlacek III, P. R. Buseck, K. Adachi, T. B. Onasch, S. R. Springston and L. Kleinman, Formation and evolution of tar balls from northwestern US wildfires, Atmos. Chem. Phys., 2018, 18, 11289–11301 CrossRef.
- C. Liu, C. E. Chung, Y. Yin and M. Schnaiter, The absorption Ångström exponent of black carbon: from numerical aspects, Atmos. Chem. Phys., 2018, 18, 6259–6273 CrossRef CAS.
- G. R. McMeeking, S. M. Kreidenweis, S. Baker, C. M. Carrico, J. C. Chow, J. L. Collett, W. M. Hao, A. S. Holden, T. W. Kirchstetter, W. C. Malm, H. Moosmüller, A. P. Sullivan and C. E. Wold, Emissions of trace gases and aerosols during the open combustion of biomass in the laboratory, J. Geophys. Res., 2009, 114, D19210 CrossRef.
- A. A. May, G. R. McMeeking, T. Lee, J. W. Taylor, J. S. Craven, I. Burling, A. P. Sullivan, S. Akagi, J. L. Collett, M. Flynn, H. Coe, S. P. Urbanski, J. H. Seinfeld, R. J. Yokelson and S. M. Kreidenweis, Aerosol emissions from prescribed fires in the United States: a synthesis of laboratory and aircraft measurements: aerosols from US prescribed fires, J. Geophys. Res.: Atmos., 2014, 119, 11826–11849 CrossRef CAS.
- X. Pan, Y. Kanaya, F. Taketani, T. Miyakawa, S. Inomata, Y. Komazaki, H. Tanimoto, Z. Wang, I. Uno and Z. Wang, Emission characteristics of refractory black carbon aerosols from fresh biomass burning: a perspective from laboratory experiments, Atmos. Chem. Phys., 2017, 17, 13001–13016 CrossRef CAS.
- V. Selimovic, R. J. Yokelson, C. Warneke, J. M. Roberts, J. de Gouw, J. Reardon and D. W. T. Griffith, Aerosol optical properties and trace gas emissions by PAX and OP-FTIR for laboratory-simulated western US wildfires during FIREX, Atmos. Chem. Phys., 2018, 18, 2929–2948 CrossRef CAS.
- J. M. Lobert, D. H. Scharffe, W. M. Hao and P. J. Crutzen, Importance of biomass burning in the atmospheric budgets of nitrogen-containing gases, Nature, 1990, 346, 552–554 CrossRef CAS.
- J. M. Roberts, C. E. Stockwell, R. J. Yokelson, J. de Gouw, Y. Liu, V. Selimovic, A. R. Koss, K. Sekimoto, M. M. Coggon, B. Yuan, K. J. Zarzana, S. S. Brown, C. Santin, S. H. Doerr and C. Warneke, The nitrogen budget of laboratory-simulated western US wildfires during the FIREX 2016 Fire Lab study, Atmos. Chem. Phys., 2020, 20, 8807–8826 CrossRef CAS.
- J. Lindaas, I. B. Pollack, L. A. Garofalo, M. A. Pothier, D. K. Farmer, S. M. Kreidenweis, T. L. Campos, F. Flocke, A. J. Weinheimer, D. D. Montzka, G. S. Tyndall, B. B. Palm, Q. Peng, J. A. Thornton, W. Permar, C. Wielgasz, L. Hu, R. D. Ottmar, J. C. Restaino, A. T. Hudak, I. Ku, Y. Zhou, B. C. Sive, A. Sullivan, J. L. Collett and E. V. Fischer, Emissions of Reactive Nitrogen from Western U.S. Wildfires during Summer 2018, J. Geophys. Res.: Atmos., 2021, 126(2), e2020JD032657 CAS.
- S. Liu, A. C. Aiken, C. Arata, M. K. Dubey, C. E. Stockwell, R. J. Yokelson, E. A. Stone, T. Jayarathne, A. L. Robinson, P. J. DeMott and S. M. Kreidenweis, Aerosol single scattering albedo dependence on biomass combustion efficiency: laboratory and field studies: single scattering albedo of BB aerosol, Geophys. Res. Lett., 2014, 41, 742–748 CrossRef.
- D. E. Romonosky, S. L. Gomez, J. Lam, C. M. Carrico, A. C. Aiken, P. Chylek and M. K. Dubey, Optical Properties of Laboratory and Ambient Biomass Burning Aerosols: Elucidating Black, Brown, and Organic Carbon Components and Mixing Regimes, J. Geophys. Res.: Atmos., 2019, 124, 5088–5105 CrossRef CAS.
- C. D. Cappa, C. Y. Lim, D. H. Hagan, M. Coggon, A. Koss, K. Sekimoto, J. de Gouw, T. B. Onasch, C. Warneke and J. H. Kroll, Biomass-burning-derived particles from a wide variety of fuels – part 2: effects of photochemical aging on particle optical and chemical properties, Atmos. Chem. Phys., 2020, 20, 8511–8532 CrossRef CAS.
- I. B. Konovalov, N. A. Golovushkin, M. Beekmann and M. O. Andreae, Insights into the aging of biomass burning aerosol from satellite observations and 3D atmospheric modeling: evolution of the aerosol optical properties in Siberian wildfire plumes, Atmos. Chem. Phys., 2021, 21, 357–392 CrossRef CAS.
- S. P. Urbanski, W. M. Hao and S. Baker, in Developments in Environmental Science, Elsevier, 2008, vol. 8, pp. 79–107 Search PubMed.
- S. P. Urbanski, Combustion efficiency and emission factors for wildfire-season fires in mixed conifer forests of the northern Rocky Mountains, US, Atmos. Chem. Phys., 2013, 13, 7241–7262 CrossRef.
- K. Lapina, R. E. Honrath, R. C. Owen, M. Val Martín, E. J. Hyer and P. Fialho, Late summer changes in burning conditions in the boreal regions and their implications for NOx and CO emissions from boreal fires, J. Geophys. Res., 2008, 113, D11304 CrossRef.
- D. Sandberg, R. D. Ottmar, J. Peterson and J. Core, Wildland fire on ecosystems: effects of fire on air, United States Department of Agriculture, 2002 Search PubMed.
- Y. Zhang, D. Obrist, B. Zielinska and A. Gertler, Particulate emissions from different types of biomass burning, Atmos. Environ., 2013, 72, 27–35 CrossRef CAS.
- L. K. Sahu, Y. Kondo, N. Moteki, N. Takegawa, Y. Zhao, M. J. Cubison, J. L. Jimenez, S. Vay, G. S. Diskin, A. Wisthaler, T. Mikoviny, L. G. Huey, A. J. Weinheimer and D. J. Knapp, Emission characteristics of black carbon in anthropogenic and biomass burning plumes over California during ARCTAS-CARB 2008: observations of BC in California, J. Geophys. Res.: Atmos., 2012, 117(D16), 16302 CrossRef.
- K. A. Pratt, S. M. Murphy, R. Subramanian, P. J. DeMott, G. L. Kok, T. Campos, D. C. Rogers, A. J. Prenni, A. J. Heymsfield, J. H. Seinfeld and K. A. Prather, Flight-based chemical characterization of biomass burning aerosols within two prescribed burn smoke plumes, Atmos. Chem. Phys., 2011, 11, 12549–12565 CrossRef CAS.
- A. G. Merschel, E. K. Heyerdahl, T. A. Spies and R. A. Loehman, Influence of landscape structure, topography, and forest type on spatial variation in historical fire regimes, Central Oregon, USA, Landscape Ecol., 2018, 33, 1195–1209 CrossRef.
- S. Q. Turn, B. M. Jenkins, J. C. Chow, L. C. Pritchett, D. Campbell, T. Cahill and S. A. Whalen, Elemental characterization of particulate matter emitted from biomass burning: wind tunnel derived source profiles for herbaceous and wood fuels, J. Geophys. Res., 1997, 102, 3683–3699 CrossRef CAS.
- R. J. Yokelson, I. R. Burling, J. B. Gilman, C. Warneke, C. E. Stockwell, J. de Gouw, S. K. Akagi, S. P. Urbanski, P. Veres, J. M. Roberts, W. C. Kuster, J. Reardon, D. W. T. Griffith, T. J. Johnson, S. Hosseini, J. W. Miller, D. R. Cocker III, H. Jung and D. R. Weise, Coupling field and laboratory measurements to estimate the emission factors of identified and unidentified trace gases for prescribed fires, Atmos. Chem. Phys., 2013, 13, 89–116 CrossRef.
- C. N. Jen, L. E. Hatch, V. Selimovic, R. J. Yokelson, R. Weber, A. E. Fernandez, N. M. Kreisberg, K. C. Barsanti and A. H. Goldstein, Speciated and total emission factors of particulate organics from burning western US wildland fuels and their dependence on combustion efficiency, Atmos. Chem. Phys., 2019, 19, 1013–1026 CrossRef CAS.
- S. J. Prichard, S. M. O'Neill, P. Eagle, A. G. Andreu, B. Drye, J. Dubowy, S. Urbanski and T. M. Strand, Wildland fire emission factors in North America: synthesis of existing data, measurement needs and management applications, Int. J. Wildland Fire, 2020, 29, 132 CrossRef.
- V. Selimovic, R. J. Yokelson, G. R. McMeeking and S. Coefield, Aerosol Mass and Optical Properties, Smoke Influence on O3, and High NO3 Production Rates in a Western U.S. City Impacted by Wildfires, J. Geophys. Res.: Atmos., 2020, 125(16), e2020JD032791 CAS.
- J. S. Reid, R. Koppmann, T. F. Eck and D. P. Eleuterio, A review of biomass burning emissions part II: intensive physical properties of biomass burning particles, Atmos. Chem. Phys., 2005, 27 Search PubMed.
- Y. Li and M. Shiraiwa, Timescales of secondary organic aerosols to reach equilibrium at various temperatures and relative humidities, Atmos. Chem. Phys., 2019, 19, 5959–5971 CrossRef CAS.
- D. Jaffe, B. Schnieder and D. Inouye, Technical note: use of PM2.5 to CO ratio as a tracer of wildfire smoke in urban areas, Atmospheric Chemistry and Physics Discussions, 2022, 1–15 Search PubMed.
- A. L. Hodshire, E. Ramnarine, A. Akherati, M. L. Alvarado, D. K. Farmer, S. H. Jathar, S. M. Kreidenweis, C. R. Lonsdale, T. B. Onasch, S. R. Springston, J. Wang, Y. Wang, L. I. Kleinman, A. J. Sedlacek III and J. R. Pierce, Dilution impacts on smoke aging: evidence in Biomass Burning Observation Project (BBOP) data, Atmos. Chem. Phys., 2021, 21, 6839–6855 CrossRef CAS.
- J. E. Lee, M. K. Dubey, A. C. Aiken, P. Chylek and C. M. Carrico, Optical and Chemical Analysis of Absorption Enhancement by Mixed Carbonaceous Aerosols in the 2019 Woodbury, AZ, Fire Plume, J. Geophys. Res.: Atmos., 2020, 125(15), e2020JD032399 CAS.
- Y. Liang, C. Stamatis, E. C. Fortner, R. A. Wernis, P. Van Rooy, F. Majluf, T. I. Yacovitch, C. Daube, S. C. Herndon, N. M. Kreisberg, K. C. Barsanti and A. H. Goldstein, Emissions of organic compounds from western US wildfires and their near-fire transformations, Atmos. Chem. Phys., 2022, 22, 9877–9893 CrossRef CAS.
- T. Moise, J. M. Flores and Y. Rudich, Optical Properties of Secondary Organic Aerosols and Their Changes by Chemical Processes, Chem. Rev., 2015, 115, 4400–4439 CrossRef CAS PubMed.
- J. L. Hand and W. C. Malm, Review of aerosol mass scattering efficiencies from ground-based measurements since 1990, J. Geophys. Res., 2007, 112, D16203 CrossRef.
- G. R. McMeeking, S. M. Kreidenweis, C. M. Carrico, J. L. Collett, D. E. Day and W. C. Malm, Observations of smoke-influenced aerosol during the Yosemite Aerosol Characterization Study: 2. Aerosol scattering and absorbing properties, J. Geophys. Res., 2005, 110, D18209 CrossRef.
- P. K. Quinn, D. J. Coffman, T. S. Bates, T. L. Miller, J. E. Johnson, K. Voss, E. J. Welton and C. Neusüss, Dominant aerosol chemical components and their contribution to extinction during the Aerosols99 cruise across the Atlantic, J. Geophys. Res., 2001, 106, 20783–20809 CrossRef CAS.
- E. B. Wiggins, B. E. Anderson, M. D. Brown, P. Campuzano-Jost, G. Chen, J. Crawford, E. C. Crosbie, J. Dibb, J. P. DiGangi, G. S. Diskin, M. Fenn, F. Gallo, E. M. Gargulinski, H. Guo, J. W. Hair, H. S. Halliday, C. Ichoku, J. L. Jimenez, C. E. Jordan, J. M. Katich, J. B. Nowak, A. E. Perring, C. E. Robinson, K. J. Sanchez, M. Schueneman, J. P. Schwarz, T. J. Shingler, M. A. Shook, A. J. Soja, C. E. Stockwell, K. L. Thornhill, K. R. Travis, C. Warneke, E. L. Winstead, L. D. Ziemba and R. H. Moore, Reconciling Assumptions in Bottom-Up and Top-Down Approaches for Estimating Aerosol Emission Rates from Wildland Fires Using Observations From FIREX-AQ, J. Geophys. Res.: Atmos., 2021, 126(24), e2021JD035692 CAS.
- J. R. Ouimette, W. C. Malm, B. A. Schichtel, P. J. Sheridan, E. Andrews, J. A. Ogren and W. P. Arnott, Evaluating the PurpleAir monitor as an aerosol light scattering instrument, Atmos. Meas. Tech., 2022, 15, 655–676 CrossRef.
- J. H. Seinfeld and S. N. Pandis, Atmospheric Chemistry and Physics: From Air Pollution to Climate, John Wiley & Sons, Hoboken, New Jersey, 2nd edn, 2006 Search PubMed.
- S. Hosseini, Q. Li, D. Cocker, D. Weise, A. Miller, M. Shrivastava, J. W. Miller, S. Mahalingam, M. Princevac and H. Jung, Particle size distributions from laboratory-scale biomass fires using fast response instruments, Atmos. Chem. Phys., 2010, 10, 8065–8076 CrossRef CAS.
- K. M. Sakamoto, J. R. Laing, R. G. Stevens, D. A. Jaffe and J. R. Pierce, The evolution of biomass-burning aerosol size distributions due to coagulation: dependence on fire and meteorological details and parameterization, Atmos. Chem. Phys., 2016, 16, 7709–7724 CrossRef CAS.
- R. Wagner, M. Jähn and K. Schepanski, Wildfires as a source of airborne mineral dust – revisiting a conceptual model using large-eddy simulation (LES), Atmos. Chem. Phys., 2018, 18, 11863–11884 CrossRef CAS.
- J. M. Creamean, P. J. Neiman, T. Coleman, C. J. Senff, G. Kirgis, R. J. Alvarez and A. Yamamoto, Colorado air quality impacted by long-range-transported aerosol: a set of case studies during the 2015 Pacific Northwest fires, Atmos. Chem. Phys., 2016, 16, 12329–12345 CrossRef CAS.
- L. C. Maudlin, Z. Wang, H. H. Jonsson and A. Sorooshian, Impact of wildfires on size-resolved aerosol composition at a coastal California site, Atmos. Environ., 2015, 119, 59–68 CrossRef CAS.
- J. S. Schlosser, R. A. Braun, T. Bradley, H. Dadashazar, A. B. MacDonald, A. A. Aldhaif, M. A. Aghdam, A. H. Mardi, P. Xian and A. Sorooshian, Analysis of aerosol composition data for western United States wildfires between 2005 and 2015: dust emissions, chloride depletion, and most enhanced aerosol constituents, J. Geophys. Res.: Atmos., 2017, 122, 8951–8966 CrossRef CAS PubMed.
- X. Zhang, M. Mao, H. Chen and S. Tang, Theoretical study of scattering Angstrom exponent of coated black carbon aerosols: the effect of microphysical configurations, J. Quant. Spectrosc. Radiat. Transfer, 2020, 256, 107302 CrossRef CAS.
- Oregon Department of Environmental Quality, 2022 Oregon Annual Ambient Criteria Pollutant Air Monitoring Network Plan, 2022 Search PubMed.
Footnotes |
| † Electronic supplementary information (ESI) available. See DOI: https://doi.org/10.1039/d2ea00118g |
| ‡ Current address: Department of Atmospheric Science, Colorado State University, Fort Collins, CO, USA. |
| This journal is © The Royal Society of Chemistry 2023 |