
 Open Access Article
 This Open Access Article is licensed under a
 Creative Commons Attribution 3.0 Unported Licence
In vivo and in vitro studies of [M(η6-pseudoerlotinib)2]+ sandwich complexes (M = Re, 99mTc)†
Federica
Battistin
 *a,
Célia
Fernandes
b,
Paula. D.
Raposinho
b,
Olivier
Blacque
a,
António
Paulo
*b and
Roger
Alberto
a
*a,
Célia
Fernandes
b,
Paula. D.
Raposinho
b,
Olivier
Blacque
a,
António
Paulo
*b and
Roger
Alberto
a
aDepartment of Chemistry, University of Zurich, Winterthurerstr. 190, 8057 Zurich, Switzerland. E-mail: federica.battistin@chem.uzh.ch
bCentro de Ciências e Tecnologias Nucleares, Instituto Superior Técnico, Universidade de Lisboa, Campus Tecnológico e Nuclear, Bobadela, Portugal. E-mail: apaulo@ctn.tecnico.ulisboa.pt
First published on 12th October 2023
Abstract
The pursuit of molecular imaging for tumors has led to endeavors focused on targeting epidermal growth factor receptors (EGFR) through monoclonal antibodies or radionuclide-labelled EGF analogs with 99mTc, 111In, or 131I. In this context, various 99mTc-labeled EGFR inhibitors using quinazoline structures have been reported based on the so-called pendant approach and on two types of complexes and labelling strategies: “4 + 1” mixed ligand complexes and fac-tricarbonyl complexes. Apart from this approach, which alters lead structures by linking pharmacophores to chelator frameworks through different connectors, the integrated incorporation of topoisomerase and tyrosine kinase inhibitors into Re and 99mTc complexes has not been explored. Here we present [M(η6-inhibitor)2]+ (M = Re, 99mTc) and [Re(η6-bz)(η6-inhibitor)]+ complexes, where the core structure of an EGFR tyrosine kinase inhibitor binds directly to the metal center. These complexes exhibit potential for tumor imaging: initial biological investigations highlight the influence of one versus two bound inhibitors on the metal center.
Introduction
DNA topoisomerases are nuclear enzymes that catalyze the introduction of topological changes to the DNA strand. They are essential for proliferating cells since they release the tension of DNA during replication and transcription by formation of transient single-stranded (i.e. type I topoisomerases) or double-stranded (i.e. type II topoisomerases) breaks in the DNA double helix.1,2 An effective target in the treatment of a large number of cancers is human topoisomerase II (topo II).3,4 The epidermal growth factor receptor (EGFR) is another relevant target for cancer therapy, being overexpressed in many cancers such as ovary, breast and lung cancer and having a regulatory role in their growth.5–7 Moreover, high levels of EGFR have been shown to be linked to the development of resistance of cancer cells to topo II inhibitors.8 Therefore, a simultaneous inhibition of topo II and EGFR might be an effective strategy for anticancer treatment. Several classes of EGFR tyrosine kinase inhibitors have been reported and,9 among them, the most potent, selective and approved for clinical use are Iressa®/Gefitinib and Tarceva®/Erlotinib (Fig. 1) which are quinazoline-type EGFR inhibitors and also act on topoisomerases.8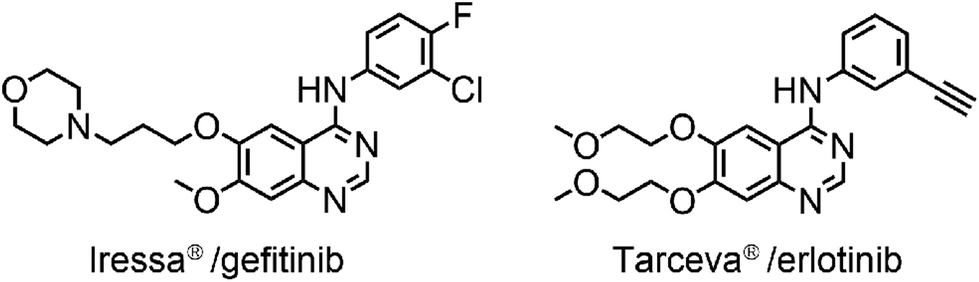 | ||
| Fig. 1 Two examples of FDA approved quinazoline-type drugs, acting as EGFR and topoisomerase inhibitors. | ||
Efforts have been made to achieve molecular imaging of tumor based on the targeting of EGFR receptors with monoclonal antibodies or EGF analogues labeled with radionuclides such as 99mTc, 111In, or 131I.10 For this purpose, radioprobes that utilize tyrosine kinase inhibitors (TKI) as targeting vectors are an attractive alternative, namely to identify patients who would benefit from TKI therapy and for monitoring their response to personalized cancer treatment.10–16
Several 99mTc labelled quinazoline type EGFR inhibitors have been reported in the literature, based on the so-called pendant approach and on two types of complexes and labelling strategies: “4 + 1” mixed ligand complexes and fac-tricarbonyl complexes (Fig. 2).17–20 Many of these 99mTc complexes and their Re congeners showed promising results and essentially retained the inhibitory activity of the respective free inhibitors, i.e. the parent pharmaceuticals.
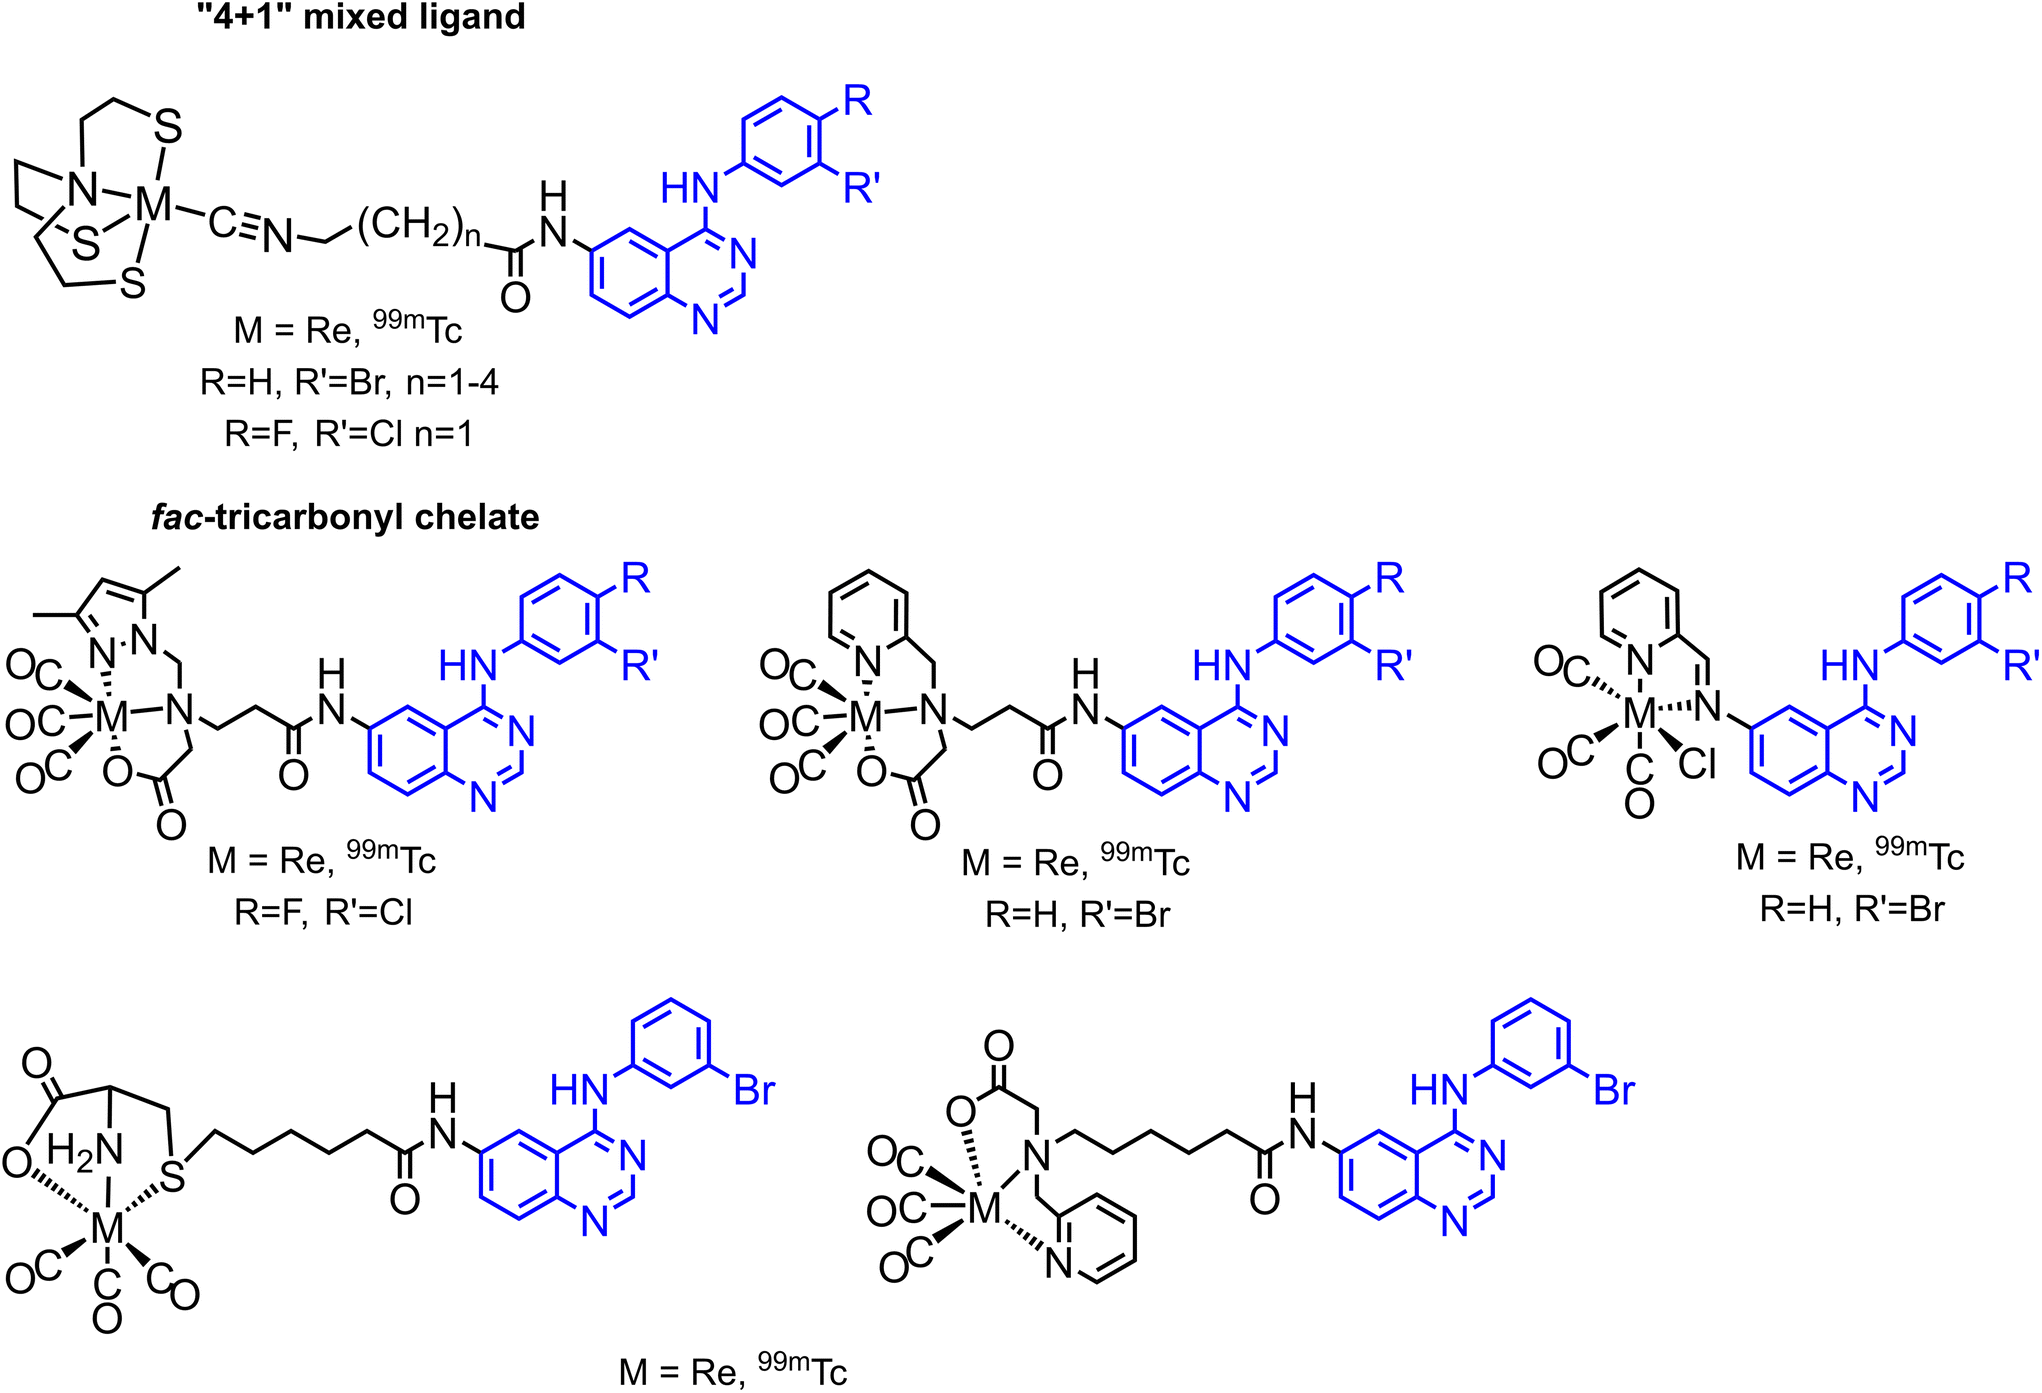 | ||
| Fig. 2 Literature known 99mTc labelled quinazoline type EGFR inhibitors.17–20 | ||
Besides the above-mentioned complexes obtained through the pendant approach, which involves the attachment of the pharmacophores to the chelator framework through different linkers leading to altered lead structures, there are no examples of an integrated incorporation of topoisomerases – and tyrosine kinase inhibitors in the structures of Re and 99mTc complexes. We have recently reported on the direct incorporation of arene-based pharmaceuticals into rhenium complexes by exchanging naphthalene (napht) in [Re(η6-napht)2]+ and [Re(η6-bz)(η6-napht)]+ (bz = benzene) with highly functionalized arenes, which allows to explore the so-called integrated approach. Naphthalene is weaker bound to rhenium as compared to benzene because of its more extended π-system.21 This allows its exchange with different functionalized arenes and arene-based pharmaceuticals. The substitution can take place either in pure arenes using a large excess of the arene, or in dioxane with N-methyl-pyrrolidone (NMP) as a catalyst and fewer equivalents of the arenes, as shown in Scheme 1.22,23
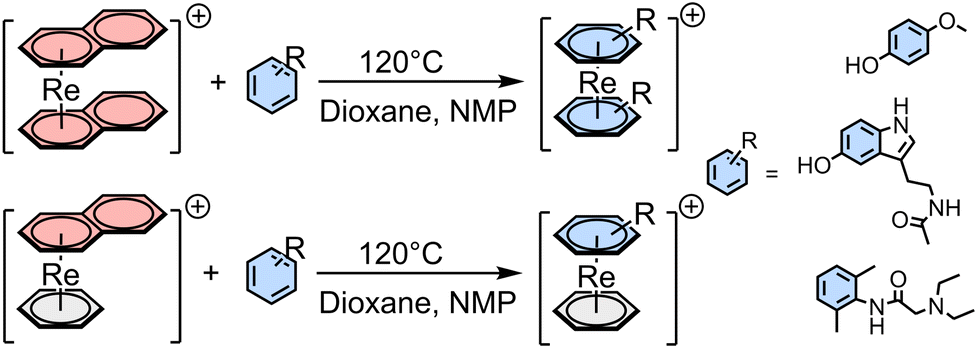 | ||
| Scheme 1 General pathway for the synthesis of [Re(η6-arene)2]+ and [Re(η6-bz)(η6-arene)]+ with arene = mequinol, melatonin, lidocaine and others.22,23 | ||
In water, functionalized arenes can be labeled directly to form [99mTc(η6-arene)2]+ complexes in a single step starting from [99mTcO4]−.22,23 This is possible due to the high dilution of 99mTc. However, the same procedure cannot be replicated for the rhenium homologues. In both Re and 99mTc sandwich complexes, the functional groups and one face of the pharmaceutical are left unchanged.
Following a similar approach, we present herein the preparation of [M(η6-inhibitor)2]+ (M = Re, 99mTc) and [Re(η6-bz)(η6-inhibitor)]+ in which the parent structure of an EGFR tyrosine kinase inhibitor is directly coordinated to the metal. We selected quinazoline-type EGFR inhibitors, structurally similar to the approved drug erlotinib. We also report the first biological studies of these sandwich complexes to assess the influence of having one or two inhibitors bound to a metal center in comparison with the free drug.
Results and discussion
Rhenium complexes
The syntheses of various [Re(η6-pharm)2]+ complexes with arene-based pharmaceuticals (pharm) have been previously reported by us. Synthetically, naphthalene in [Re(η6-napht)2]+ was exchanged with the respective pharmaceutical as ligands, comprising an available phenyl group, in the presence of N-methyl-pyrrolidone (NMP).23 Erlotinib has two rings that could eventually replace naphthalene, a quinazoline moiety and an ethynyl aniline (Fig. 1). To selectively synthesize the complex with the rhenium sandwiched by the aniline rings, we started from [Re(η6-aniline)2]+.22,24 Conjugation of the fragment L1 (see Scheme 2) would give a ‘pseudoerlotinib’ rhenium sandwich through a two steps reaction: (i) synthesis of [Re(η6-aniline)2]+; (ii) nucleophilic aromatic substitution to form [Re(η6-pseudoerlotinib)2]+, thereby modifying a procedure reported in literature for the synthesis of the free erlotinib.25 | ||
| Scheme 2 Two steps synthesis of [Re(η6-pseudoerlotinib)2]+ (1): (i) 120 °C, dioxane, 5 eq. NMP; (ii) 0.5 M HCl, 70 °C. | ||
[Re(η6-aniline)2]+ was prepared by exchange of naphthalene with aniline in [Re(η6-napht)2]+.24 [Re(η6-aniline)2]+ was then reacted with L1 in 0.5 M HCl solution at 70 °C for 24 h, forming [Re(η6-pseudoerlotinib)2]+ (1) in 77% yield (Scheme 2). The 1H NMR spectrum of 1 in acetone-d6 displays three resonances for the aniline ring at 7.30 (Ho), 6.19 (Hm) and 5.87 (Hp) ppm respectively, which are upfield shifted as compared to the signals of the [Re(η6-aniline)2]+. The strongest shifted signals are the protons ortho to the NH functional group (Δ = 1.42 ppm), followed by meta (Δ = 0.49 ppm) and para (Δ = 0.36 ppm). The aromatic region of the spectrum shows also three singlets of the quinazoline protons at 8.46, 6.97 and 6.77 ppm respectively. Between 4.5 and 3.7 ppm there are four multiplets of the methylene bridges of L1 and, finally, two close singlets (3.48 and 3.45 ppm respectively) of the two methoxy functional groups (ESI).
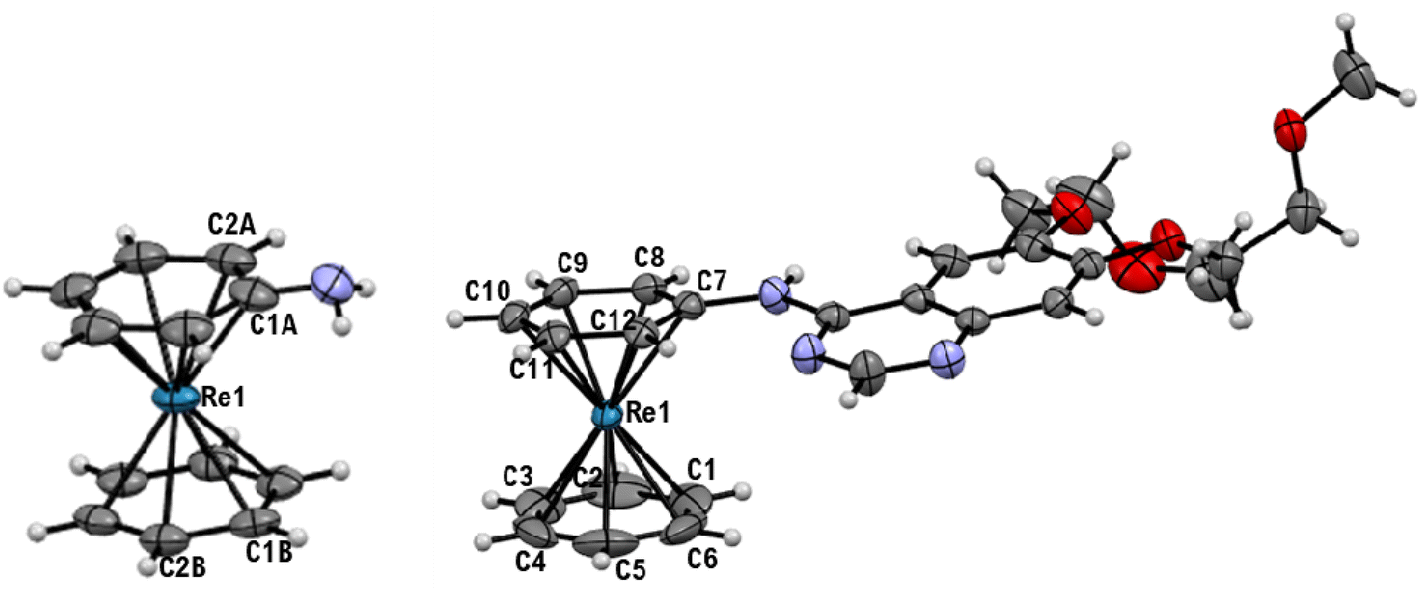
Single crystal X-ray diffraction analysis confirmed the structure of the complex (Fig. 3). Since the crystals spontaneously formed in the reaction mixture (acidic conditions), both ligands are protonated at one of the nitrogen atoms from the quinazoline moiety as clearly visible in the crystal structure, and the overall charge of the complex is 3+.
 | ||
| Fig. 3 Ellipsoid displacement plots of protonated [Re(η6-pseudoerlotinib)2]3+ (1). Ellipsoids are drawn at 50% probability. [PF6]− and 2[Cl]− anions are omitted for clarity. Coordination distances in Ångström (Å): Re1–C1 = 2.259(3), Re1–C2 = 2.250(3), Re1–C3 = 2.241(3), Re1C4 = 2.238(3), Re1C5 = 2.244(3), Re1–C6 = 2.242(3), Re1–C21 = 2.264(3), Re1–C22 = 2.244(3), Re1–C23 = 2.247(3), Re1C24 = 2.244(3), Re1C25 = 2.239(3), Re1–C26 = 2.244(3). | ||
To compare the biological behavior of Re(I) complexes containing one or two erlotinib analogues, we prepared the mixed complex [Re(η6-bz)(η6-pseudoerlotinib)]+ adopting the same approach. The reaction between [Re(η6-bz)(η6-naph)]+ and aniline led to [Re(η6-bz)(η6-aniline)]+ (2) in 76% yield (Scheme 3). In the 1H NMR spectrum in acetone-d6 there is a singlet at 5.76 ppm for the six aromatic protons of benzene and three more multiplets at 6.25(Ho), 6.08 (Hm), 5.82 (Hp) ppm respectively for the protons of aniline. The structure was confirmed by single crystals X-ray diffraction analysis (Fig. 4).
 | ||
| Scheme 3 Two steps synthesis of [Re(η6-bz)(η6-pseudoerlotinib)]+ (1): (i) 120 °C, dioxane, 2.5 eq. NMP (2); (ii) 0.5 M HCl, 70 °C. | ||
 | ||
| Fig. 4 Ellipsoid displacement plots of [Re(η6-bz)(η6-aniline)]+ (2, left) and [Re(η6-bz)(η6-pseudoerlotinib)]+ (3, right). Ellipsoids are drawn at 50% probability. [PF6]− anions are omitted for clarity. Coordination distances in Ångström (Å) for 2: Re1–C1A = 2.249(4), Re1–C2A = 2.235(4), Re1–C1B = 2.240(3), Re1C2B = 2.200(3). Coordination distances in Ångström (Å) for 3: Re1–C1 = 2.214(4), Re1–C2 = 2.206(4), Re1–C3 = 2.222(4), Re1–C4 = 2.222(4), Re1–C5 = 2.226(4), Re1–C6 = 2.227(4), Re1–C7 = 2.305(3), Re1–C8 = 2.239(3), Re1–C9 = 2.235(4), Re1–C10 = 2.241(3), Re1–C11 = 2.229(3), Re1–C12 = 2.248(3). | ||
As for the synthesis of 1, a nucleophilic aromatic substitution between 2 and L1 led to [Re(η6-bz)(η6-pseudoerlotinib)]+ (3) in 75% yield (Scheme 3). The 1H NMR spectrum of 2 in acetone-d6 is very similar to 1: also in this case the signals of the aniline and benzene are upfield shifted compared to 2, with a smaller delta: 0.94 for Ho, 0.24 for Hm, 0.23 for Hp which is overlapping with the singlet of the benzene protons (Δ = 0.04 ppm).
X-ray diffraction performed on single crystals of 3 allowed us to confirm the geometry of the complex (Fig. 4).
Finally, we also prepared the ‘pseudoerlotinib’ (L2) analogue, corresponding to the arene ligands coordinated to rhenium in complex 1 and 3, to compare the activities of the free molecule with the ones being coordinated to the rhenium complexes, following a literature procedure.25
99mTc sandwich complexes
We reported earlier the direct labelling of arene-containing pharmaceuticals with 99mTc in water.23 Since erlotinib has two different arene rings principally accessible for η6-coordination, a one pot labeling could potentially yield a mixture of labeled compounds: (i) 99mTc between both aniline rings; (ii) 99mTc between both quinazoline rings; (iii) mixed compound in which 99mTc is between aniline and quinazoline rings (Fig. 5). To avoid the formation of this mixture, which would be difficult to separate in radio-HPLC, we followed the two steps synthesis as in the case of Re for the preparation of [99mTc(η6-pseudoerlotinib)2]+. | ||
| Fig. 5 All possible [99mTc(η6-pseudoerlotinib)2]+ complexes that could form with one pot labeling of pseudoerlotinib. | ||
As for the rhenium complexes, we first labeled aniline by mixing [99mTc][TcO4]− as eluted from a 99Mo/99mTc generator with aniline in water, using Zn° as reducing agent under acidic conditions to yield [99mTc(η6-aniline)2]+in 63% radiochemical yield (RCY), following a procedure already reported by us.22 After HPLC purification, nucleophilic aromatic substitution between [99mTc(η6-aniline)2]+ and L1 led to [99mTc(η6-pseudoerlotinib)2]+ ([99mTc]1) in 62% RCY over two steps of reaction (Scheme 4).
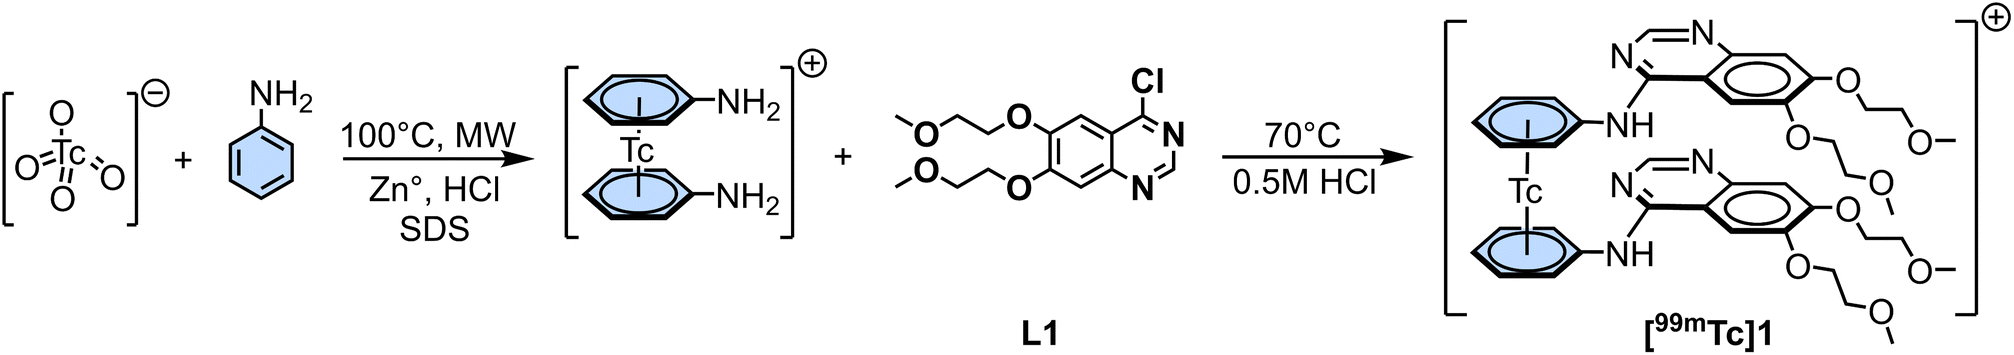 | ||
| Scheme 4 Two steps synthesis of [99mTc(η6-pseudoerlotinib)2]+ ([99mTc]1): (i) synthesis of [99mTc(η6-aniline)2]+; (ii) nucleophilic aromatic substitution between [99mTc(η6-aniline)2]+ and L1 to form [99mTc]1.26 | ||
Corroboration of the structure of the 99mTc complex was performed by comparative HPLC analysis with the homologous Re complex 1. Fig. 6 shows the co-injection run of 1 and [99mTc]1.
 | ||
| Fig. 6 Co-injection of 1 (top) together with the homologue [99mTc]1 (bottom). | ||
Following the same approach, we attempted to prepare the mixed complex [99mTc(η6-bz)(η6-aniline)]+, precursor for the synthesis of [99mTc(η6-bz)(η6-pseudoerlotinib)]+, by reaction of [99mTc][TcO4]− with aniline and benzene in water. Due to the insolubility of benzene in water, the mixed complex was not obtained but only the [99mTc][Tc(η6-aniline)2]+ complex.
Finally, we have studied the in vitro stability of [99mTc]1 in phosphate-buffered saline (PBS) and cell culture medium at 37 °C for 24 h. The radiocomplex remained stable under the tested conditions, as shown by HPLC analysis of the resulting solutions (Fig. S13, ESI†), which prompted its use in the intended biological studies described below.
Biological studies
| Compound | IC50![[thin space (1/6-em)]](https://www.rsc.org/images/entities/char_2009.gif) a (μM) a (μM) |
|---|---|
| a Dose–response curves were determined at 0.01, 0.05, 0.1, 0.5, 1, 5, 10, 20, 50, 100 concentrations. The IC50 values are the concentration (μM) needed to inhibit cell growth by 50%. IC50 values for each derivative were obtained from six independent experiments and are represented as mean ± standard deviation. | |
| 1 | 55.72 ± 14.11 |
| 3 | 688.7 ± 6.01 |
| L2 | 23.23 ± 4.16 |
| Erlotinib | 8.31 ± 1.96 |
Compared with erlotinib and the reported Re quinazoline type EGFR inhibitors,17–201 and L2 showed lower cell growth inhibition towards A431 cell lines. Despite the moderate cytotoxic activity found for 1, the first Re sandwich complex that directly incorporates an EGFR and a tyrosine kinase inhibitor, it serves as a proof of concept for this type of approach.
After incubation of the cells with the complexes for 24 h, cell extracts were collected and the intracellular accumulation of Re was measured with inductively coupled plasma mass spectrometry (ICP-MS). The normalized results of the cellular uptake studies are presented in Fig. 7. Complex 1 shows an accumulation which is double compared with compound 3. This result is in line with the cytotoxicity studies and with the lower IC50 values of 1 compared to 3. The reasons for the different cellular uptake of complexes 1 and 3 are not clear. It eventually reflects the presence of a larger number of polar ether groups that favor the interaction with outer parts of the cell membrane, followed by diffusion through the cell membrane as specific mechanisms of uptake are not expected for this class of complexes.
 | ||
| Fig. 7 Cell accumulation of rhenium in A431 cells after exposure to [Re(η6-pseudoerlotinib)2]+ and [Re(η6-bz)(η6-pseudoerlotinib)]+ (50 μM, 24 h of incubation). The rhenium content is normalized to the cell number and it is represented as mean ± SD (n = 3). | ||
D = 2.48). Nevertheless, there is a small contribution of excretion through the urinary tract (2.4 ± 0.1% ID per g kidney, at 1 h post injection, which increases to 2.6 ± 0.2% ID per g kidney at 4 h). At 4 h post injection, there is no noteworthy radioactivity retention in any other organ, except those involved in the excretory route (predominantly intestines). Finally, stomach values after 4 h were low (0.52 ± 0.34% ID per g) indicating minimal in vivo reoxidation to 99mTcO4−.
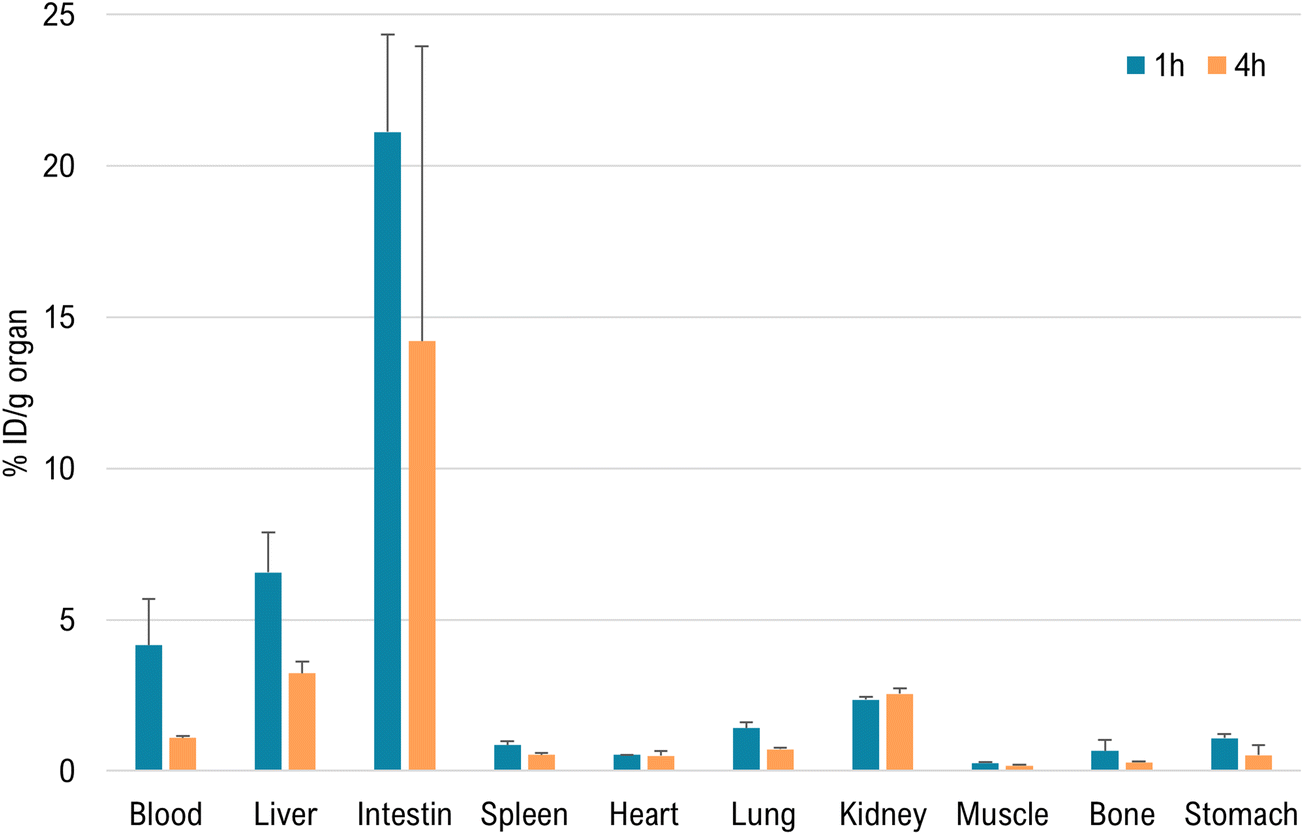 | ||
| Fig. 8 Biodistribution data expressed as % ID per g organ for [99mTc]1 at 1 and 4 h after administration in CD-1 mice (n = 3). | ||
Conclusions
We have successfully directly incorporated a topoisomerase and tyrosine kinase inhibitor, an erlotinib analogue, in both Re and 99mTc complexes with minimal alteration of the analogue's molecular structure. We also report the biological studies of the resulting rhenium and 99mTc sandwich complexes, bearing an almost unmodified drug. Interestingly, only [Re(η6-pseudoerlotinib)2]+ showed the ability to inhibit cell growth, while [Re(η6-bz)(η6-pseudoerlotinib)]+ is almost inactive. In fact, the presence of two moieties of erlotinib seems to have a beneficial effect since the IC50 values of 1 are more than ten times smaller than 3. This different behavior might reflect the better ability of 1 to enter the tumor cells and induce cell death. Finally, [99mTc(η6-pseudoerlotinib)2]+ proved to be highly stable both in vitro and in vivo, being cleared through the hepatobiliary tract.The synthetic concept proposed in this work is broadly applicable and serves as a general procedure towards other quinazoline-type EGFR and topoisomerase inhibitors such as Gefitinib and Vatalanib.
Experimental part
Materials and methods
Unless otherwise stated, all chemicals were of reagent grade or higher, obtained from commercial sources and used without further purification. Solvents for reactions were of p.a. grade or distilled prior to their use; H2O was bi-distilled. Deuterated NMR-solvents were purchased from Armar Chemicals or Cambridge Isotope Laboratories, Inc. (UK). Reactions were carried out using standard Schlenk techniques in oven-dried (150 °C) glass equipment and monitored for completion by analyzing a small sample (after suitable workup) by UPLC-ESI-MS. Evaporation of the solvents in vacuo was done with the rotary evaporator. Microwave assisted reactions were carried out in a Biotage Initiator microwave. [Re(η6-(aniline)2)]PF6 and L1 were synthesized according to a literature procedure.24,25:1, MeOH/H2O 1:1, DMSO/H2O 1:10, or H2O at ca. 50 μg mL−1; injection of 1 μLon-flow with an XRS auto-sampler (CTC, Zwingen, Switzerland)(mobile phase: MeOH + 0.1% HCOOH or CH3CN/H2O (2:8) + 0.1% HCOOH; flow rate 120 μL mL−1); ion source parameters: sprayvoltage 3.0 kV, capillary temperature 280 °C, sheath gas 30 L min−1, s-lens RF level 55.0; aux gas temperature 250 °C; full scan MS in alternating (+)/(−)-ESI mode; mass ranges 80–1200, 133–2000, or 200–3000 amu; resolution (full width half-maximum) 70000; automatic gain control(AGC) target 3.00 × 10⁶; maximum allowed ion transfer time(IT) 30 ms; mass calibration < 2 ppm accuracy for m/z 130.06619–1621.96509 in (+)-ESI with Pierce® ESI calibration solutions (Thermo Fisher Scientific, Rockford, USA); lock masses: ubiquitous erucamide (m/z 338.34174,(+)-ESI).
Gradient for [Re(η6-bz)(η6-aniline)]+ (2) (G2): detection at 260 nm, 0–5 min: 75% A (25% B); 5–40 min: linear gradient from 75% A (25% B) to 60% A (40% B); 40–45 min: 60% A (40% B) to 0% A (100% B); 45–55 min: 100% B.
Na[99mTcO4] in 0.9% saline was eluted from a 99Mo/99mTc Ultratechnekow® FM generator purchased from b.e. imaging AG (Switzerland).
Syntheses
Method B: Zn (20 mg turnings), SDS (4 mg), aniline (20 μL, 0.2 mmol), 3N HCl (50 μL), were added into the vial. The vial was sealed and flushed with N2 for 1 min. Na[99mTcO4] (1 mL) was added, the vial was wasflushed with N2 for 1 min, and heated at 80–85 °C (sonicator) for 1 h. The solution was neutralized by addition of NaOH 1 M (∼10 drops) and washed with Et2O (1 mL × 8).
![[thin space (1/6-em)]](https://www.rsc.org/images/entities/b_char_2009.gif) D measurement.
Octanol/water partition coefficient were evaluated such that analytes were added in aqueous solution to an equal volume of n-octanol. After vigorous mixing, the phases were separated, and the radioactivity of each phase was evaluated. Under the assumption that the radioactivity determined in each phase correlated directly with the concentration within it, eqn (1) was used to evaluate KOW where [O]eq was the radioactivity recorded in the n-octanol phase at equilibrium and [W]eq the respective water radioactivity. The remaining activity of empty containers was subtracted from the total activity. Each KOW value was indicated as an average of three sets of measurements, recorded on the same day and from the same labeling experiment.
D measurement.
Octanol/water partition coefficient were evaluated such that analytes were added in aqueous solution to an equal volume of n-octanol. After vigorous mixing, the phases were separated, and the radioactivity of each phase was evaluated. Under the assumption that the radioactivity determined in each phase correlated directly with the concentration within it, eqn (1) was used to evaluate KOW where [O]eq was the radioactivity recorded in the n-octanol phase at equilibrium and [W]eq the respective water radioactivity. The remaining activity of empty containers was subtracted from the total activity. Each KOW value was indicated as an average of three sets of measurements, recorded on the same day and from the same labeling experiment. | (1) |
Cellular studies
Author contributions
F. B. conceptualized the project, performed the experiments, data acquisition and analysis, wrote and edited the manuscript; C. F. and P. D. R. performed the biological experiments; O. B. performed all crystallographic measurements; A. P. conceptualized the biological experiments; R. A. conceptualized the project and edited the manuscript. Additional edits and proof reading were conducted by all authors. All authors have read and agreed to the published version of the manuscript.Abbreviations
| Bz | Benzene |
| DCM | Dichloromethane |
| DMEM | Dulbecco's modified Eagle's medium |
| DMSO | Dimethyl sulfoxide |
| FBS | Fetal bovine serum |
| GFR | Epidermal growth factor receptor |
| ESI | Electrospray ionization |
| Et2O | Diethyl ether |
| IC50 | Half maximal inhibitory concentration |
| ICP-MS | Inductively coupled plasma mass spectrometry |
| HPLC | High-performance liquid chromatography |
| HR | High-resolution |
| MS | Mass spectrometry |
| napht | Naphthalene |
| MTT | [1-(4,5-Dimethylthiazol-2-yl)-2,5-diphenyl tetrazolium] |
| NMP | N-Methyl-2-pyrrolidone |
| NMR | Nuclear magnetic resonance |
| PBS | Phosphate-buffered saline |
| SDS | Sodium dodecyl sulfate |
| TFA | Trifluoroacetic acid |
| TKI | Tyrosine kinase inhibitor. |
Conflicts of interest
There are no conflicts to declare.Acknowledgements
We thank the University of Zurich for financial support.References
- J. L. Nitiss, Nat. Rev. Cancer, 2009, 9, 327–337 CrossRef CAS PubMed.
- J. C. Wang, Nat. Rev. Mol. Cell Biol., 2002, 3, 430–440 CrossRef CAS PubMed.
- J. L. Nitiss, Nat. Rev. Cancer, 2009, 9, 338–350 CrossRef CAS PubMed.
- J. V. Walker and J. L. Nitiss, Cancer Invest., 2002, 20, 570–589 CrossRef CAS PubMed.
- D. S. Krause and R. A. Van Etten, Eur. J. Cancer, 2005, 38, 172–187 Search PubMed.
- R. I. Nicholson, J. M. W. Gee and M. E. Harper, Eur. J. Cancer, 2001, 37, 9 CrossRef PubMed.
- S. V. Sharma, D. W. Bell, J. Settleman and D. A. Haber, Nat. Rev. Cancer, 2007, 7, 169–181 CrossRef CAS PubMed.
- M. Chauhan, G. Sharma, G. Joshi and R. Kumar, Curr. Pharm. Des., 2016, 22, 3226–3236 CrossRef CAS PubMed.
- Ž. Skok, N. Zidar, D. Kikelj and J. Ilaš, J. Med. Chem., 2020, 63, 884–904 CrossRef PubMed.
- W. Cai, G. Niu and X. Chen, Eur. J. Nucl. Med. Mol. Imaging, 2008, 35, 186–208 CrossRef PubMed.
- C. Arteaga, Semin. Oncol., 2003, 30, 3–14 CrossRef CAS PubMed.
- R. D. Mass, Int. J. Radiat. Oncol., Biol., Phys., 2004, 58, 932–940 CrossRef CAS PubMed.
- J. Albanell and P. Gascón, Curr. Drug Targets, 2005, 6, 259–274 CrossRef CAS PubMed.
- D. Vallböhmer and H. J. Lenz, Clin. Colorectal Cancer, 2005, 5, S19–S27 CrossRef.
- D. N. Tran, A. Zhdanko, S. Barroso, P. Nieste, R. Rahmani, J. Holan, R. Hoefnagels, P. Reniers, F. Vermoortele, S. Duguid, L. Cazanave, M. Figlus, C. Muir, A. Elliott, P. Zhao, W. Paden, C. H. Diaz, S. J. Bell, A. Hashimoto, A. Phadke, J. A. Wiles, I. Vogels and V. Farina, Org. Process Res. Dev., 2022, 26, 832–848 CrossRef CAS.
- E. B. Corcoran and R. N. Hanson, Med. Res. Rev., 2014, 34, 596–643 CrossRef PubMed.
- A. Bourkoula, M. Paravatou-Petsotas, A. Papadopoulos, I. Santos, H. J. Pietzsch, E. Livaniou, M. Pelecanou, M. Papadopoulos and I. Pirmettis, Eur. J. Med. Chem., 2009, 44, 4021–4027 CrossRef CAS PubMed.
- C. Fernandes, I. C. Santos, I. Santos, H. J. Pietzsch, J. U. Kunstler, W. Kraus, A. Rey, N. Margaritis, A. Bourkoula, A. Chiotellis, M. Paravatou-Petsotas and I. Pirmettis, Dalton Trans., 2008, 3215–3225 RSC.
- C. Kiritsis, A. Shegani, K. Makrypidi, I. Roupa, A. Lazopoulos, A. Panagiotopoulou, S. Triantopoulou, M. Paravatou-Petsotas, H. J. Pietzsch, M. Pelecanou, M. Papadopoulos and I. Pirmettis, Bioorg. Med. Chem., 2022, 73, 117012 CrossRef CAS PubMed.
- K. Makrypidi, C. Kiritsis, I. Roupa, S. Triantopoulou, A. Shegani, M. Paravatou-Petsotas, A. Chiotellis, M. Pelecanou, M. Papadopoulos and I. Pirmettis, Molecules, 2023, 28, 1–15 CrossRef PubMed.
- E. P. Kündig, C. Perret, S. Spichiger and G. Bernardinelli, J. Organomet. Chem., 1985, 286, 183–200 CrossRef.
- Q. Nadeem, G. Meola, H. Braband, R. Bolliger, O. Blacque, D. Hernández-Valdés and R. Alberto, Angew. Chem., Int. Ed., 2020, 59, 1197–1200 CrossRef CAS PubMed.
- Q. Nadeem, F. Battistin, O. Blacque and R. Alberto, Chem. – Eur. J., 2022, 28, 1213–1216 CrossRef PubMed.
- J. Csucker, D. K. Jo, Q. Nadeem, O. Blacque, T. Fox, H. Braband and R. Alberto, Dalton Trans., 2022, 51, 9591–9595 RSC.
- L. Barghi, A. Aghanejad, H. Valizadeh, J. Barar and D. Asgari, Adv. Pharm. Bull., 2012, 2, 119–122 Search PubMed.
- F. Azmian Moghadam, M. Evazalipour, H. Kefayati and S. Ghasemi, Pharm. Sci., 2021, 27, 209–218 CrossRef.
Footnote |
| † Electronic supplementary information (ESI) available: NMR and HR-ESI-MS spectral data, γ-traces and crystallographic details of new compounds. CCDC 2293185–2293187. For ESI and crystallographic data in CIF or other electronic format see DOI: https://doi.org/10.1039/d3dt03011c |
| This journal is © The Royal Society of Chemistry 2023 |