
 Open Access Article
 This Open Access Article is licensed under a
 Creative Commons Attribution 3.0 Unported Licence
Generation of Ru(III)-hypochlorite with resemblance to the heme-dependent haloperoxidase enzyme†
Rakesh
Kumar
a,
Faiza
Ahsan
 b,
Ayushi
Awasthi
a,
Marcel
Swart
*bc and
Apparao
Draksharapu
*a
b,
Ayushi
Awasthi
a,
Marcel
Swart
*bc and
Apparao
Draksharapu
*a
aSouthern Laboratories - 208A, Department of Chemistry, Indian Institute of Technology Kanpur, Kanpur-208016, India. E-mail: appud@iitk.ac.in
bIQCC & Departament de Química, Universitat de Girona, 17003 Girona, Spain
cICREA, 08010, Barcelona, Spain. E-mail: marcel.swart@gmail.com
First published on 9th August 2023
Abstract
The reaction of [(Me/BnTPEN)RuII(NCCH3)]2+ (BnTPEN = N1-benzyl-N1,N2,N2-tris(pyridine-2-ylmethyl)ethane-1,2-diamine and MeTPEN = N1-methyl-N1,N2,N2-tris(pyridine-2-ylmethyl)ethane-1,2-diamine) with mCPBA in the presence of chloride ions in CH3CN![[thin space (1/6-em)]](https://www.rsc.org/images/entities/char_2009.gif) :H2O generated a novel (Me/BnTPEN)RuIII–OCl species at room temperature. This hypochlorite adduct could also be obtained by the direct reaction of NaOCl and HClO4 with (L)RuII complexes. The current study mimics the synthesis of a metal hypochlorite adduct in a similar fashion as in the heme-dependent haloperoxidase enzyme. As an electrophilic oxidant, the ruthenium hypochlorite adduct catalyzes hydrogen atom abstraction reactions of phenols and their derivatives.
:H2O generated a novel (Me/BnTPEN)RuIII–OCl species at room temperature. This hypochlorite adduct could also be obtained by the direct reaction of NaOCl and HClO4 with (L)RuII complexes. The current study mimics the synthesis of a metal hypochlorite adduct in a similar fashion as in the heme-dependent haloperoxidase enzyme. As an electrophilic oxidant, the ruthenium hypochlorite adduct catalyzes hydrogen atom abstraction reactions of phenols and their derivatives.
Introduction
Halogenated compounds are essential motifs in synthetic organic chemistry and the pharmaceutical industry. For example, 18F radiolabeled compounds are crucial for positron emission tomography imaging in medicine divisions such as cardiology, oncology, and neuroscience.1–6 In addition, many halocarbons in marine natural products exhibit antimicrobial, antiviral, and antifungal activities.7–11 Nature has machinery enzymes such as halogenases and haloperoxidases to perform the halogenation of substrates with excellent selectivity and efficiency.12,13 Vanadium and heme-dependent haloperoxidases catalyze the halogenation of substrates through VV–OX and FeIII–OX intermediates, respectively (Scheme 1).14–16 In the vanadium-dependent haloperoxidase enzyme, a vanadium peroxo species reacts with a halide (X−) ion to produce VV–OX, responsible for substrate halogenation.17 However, in the case of heme-dependent haloperoxidase, the high valent (Porph˙+)FeIV![[double bond, length as m-dash]](https://www.rsc.org/images/entities/char_e001.gif) O (Cpd-I) species reacts with a halide ion (X−) to form the reactive (Porph)FeIII–OX intermediate.12 Therefore, the biomimetic synthesis and spectroscopic characterization of hypohalite adducts of metal complexes are of significant importance due to their relevance to biological systems.
O (Cpd-I) species reacts with a halide ion (X−) to form the reactive (Porph)FeIII–OX intermediate.12 Therefore, the biomimetic synthesis and spectroscopic characterization of hypohalite adducts of metal complexes are of significant importance due to their relevance to biological systems.
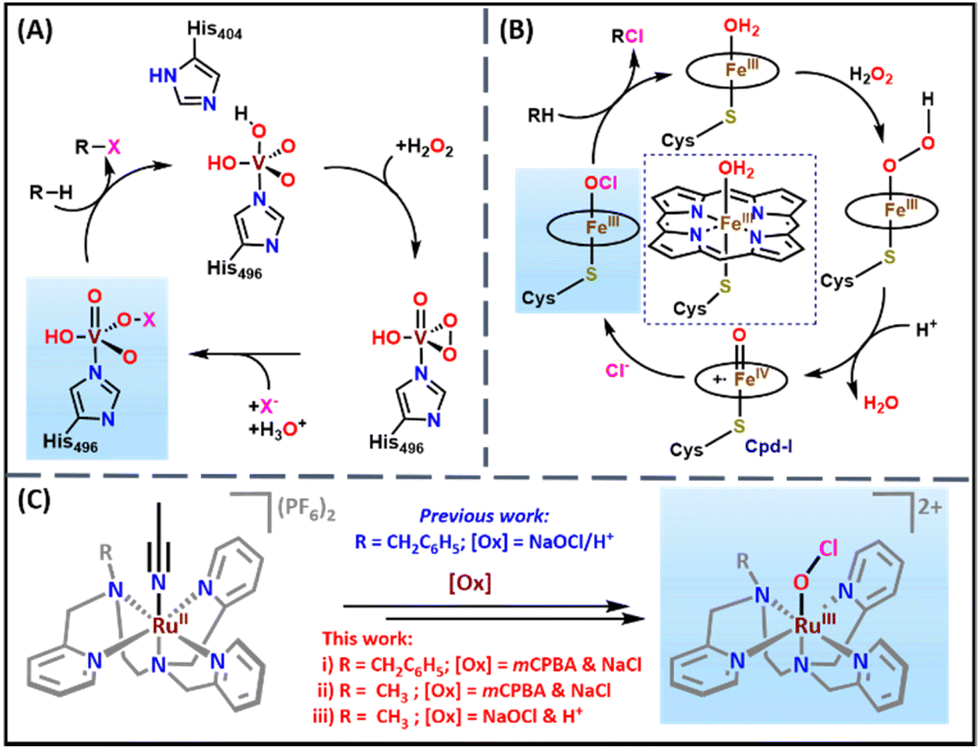 | ||
| Scheme 1 (A) The proposed mechanism for the formation of VV–OX in vanadium dependent haloperoxidase enzymes.15 (B) The proposed mechanism for the formation of FeIII–OCl from the reaction of Cpd-I and chloride ion in heme-dependent chloroperoxidase.16 For clarity, the side chains of the heme have been removed. (C) Generation of RuIII–OCl (2 and 5) species with NaOCl & HClO4 and mCPBA & NaCl in acetonitrile:water (3:1 v/v) at room temperature. | ||
Inspired by vanadium and heme-dependent haloperoxidases, several research groups around the globe determined to develop the structural and functional mimics of these enzymatic systems. Various biomimetic metal hypochlorite intermediates such as heme and non-heme FeIII–OCl,18,19 MnIV–(OCl)2,20 NiII–OCl,21 and NiIV–OCl22 species were reported from these efforts. The heme and non-heme FeIII–OCl species were generated by the reaction of hypochlorite with the corresponding (phorph)FeIII and non-heme (L)FeII precursor complexes, respectively.18,19 The Cl− ligand exchange in the (salen)MnIV–(Cl)2 species with the OCl− ion resulted in the formation of the (salen)MnIV–(OCl)2 complex that was characterized by various spectroscopic techniques.20 (L)NiII–OCl and (L)NiIV–OCl species were prepared by reacting the corresponding (L)NiII complexes with hypochlorite in the presence of triflic or acetic acid.21,22 From these studies, it was clear that all the reported metal hypochlorite adducts were synthesized by the direct reaction of OCl− with metal precursor complexes. To the best of our knowledge, none of the reports discussed the synthesis of metal hypochlorite adducts by the reaction of a halide ion with the high valent metal oxo species as is done in heme-dependent haloperoxidases.
Towards these efforts, our group recently communicated the synthesis and spectroscopic characterization of a transient [(BnTPEN)RuIII(OCl)]2+ (BnTPEN = N1-benzyl-N1,N2,N2-tris(pyridine-2-ylmethyl)ethane-1,2-diamine) species at room temperature.23 The reaction of [(BnTPEN)RuII(NCCH3)]2+ (1) with HClO4 and NaOCl resulted in a purple-colored [(BnTPEN)RuIII(OCl)]2+ species (2), which was thoroughly characterized by various spectroscopic techniques and ESI-MS.23 In the current work, we have instead generated 2 by the reaction of mCPBA with 1 in the presence of chloride ions. We propose that the reaction of a putative [(BnTPEN)RuV(O)]3+ species (3) with Cl− leads to the formation of the observed [(BnTPEN)RuIII(OCl)]2+ species (2). A similar mechanism has also been realized with a new complex, namely [(MeTPEN)RuII(NCCH3)]2+ (4, MeTPEN = N1-methyl-N1,N2,N2-tris(pyridine-2-ylmethyl)ethane-1,2-diamine), where the benzyl group is replaced with a methyl substituent. The present study is the first of its kind that mimics the synthesis of a metal hypochlorite in the same way that nature employs for heme-dependent chloroperoxidases where high valent Cpd-I reacts with the chloride ion (Cl−) to form the FeIII–OCl species.16
Results and discussion
Recently, we reported the synthesis and spectroscopic characterization of a haloperoxidase model complex, [(BnTPEN)RuIII(OCl)]2+ (2), that is capable of catalyzing hydrogen atom abstraction (HAA) of various phenols at room temperature. The reaction of 1 with HClO4 and NaOCl in the 3:1 acetonitrile:water system led to the formation of a transient species 2 that persists for 5 h. Unlike the [(MeN4Py)FeIII(OCl)]2+ species,182 is relatively stable and does not convert into the high valent [(L)RuIVO]2+ species through O–Cl bond homolytic cleavage.23 With the aim of synthesizing high valent RuIV/VO species, we tested the reactivity of 1 with other oxidants such as meta-chloroperoxybenzoic acid (mCPBA). Treatment of 1 with 20 eq. of mCPBA in the MeCN:H2O 3:1 (v/v) system did not result in any evident UV/Vis absorption spectral changes (Fig. S1†). To our surprise, when we performed the same reaction in the presence of 140 eq. of NaCl, it resulted in the formation of a purple-colored species with an absorption band at 550 nm characteristic of the [(BnTPEN)RuIII(OCl)]2+ (2) species (Fig. 1A, B, and S1†). Further optimization with various mCPBA concentrations was conducted with 140 eq. of NaCl to improve the yield and stability of 2. 20 eq. of mCPBA were found to be adequate to produce 2 in a good yield (Fig. S2A†). Next, NaCl equivalents were optimized using 20 eq. of mCPBA (Fig. S2B†) and 140 eq. of NaCl were found to be sufficient to achieve 2 in the maximum yield. The mass analysis of 2 indicated a major peak at m/z 680.14 corresponding to {[(BnTPEN)RuIII(OCl)(HCOO)]·CH3CN·H2O}+ and that at m/z 560.12 corresponding to [(BnTPEN)RuII(Cl)]+ (Fig. S3†).
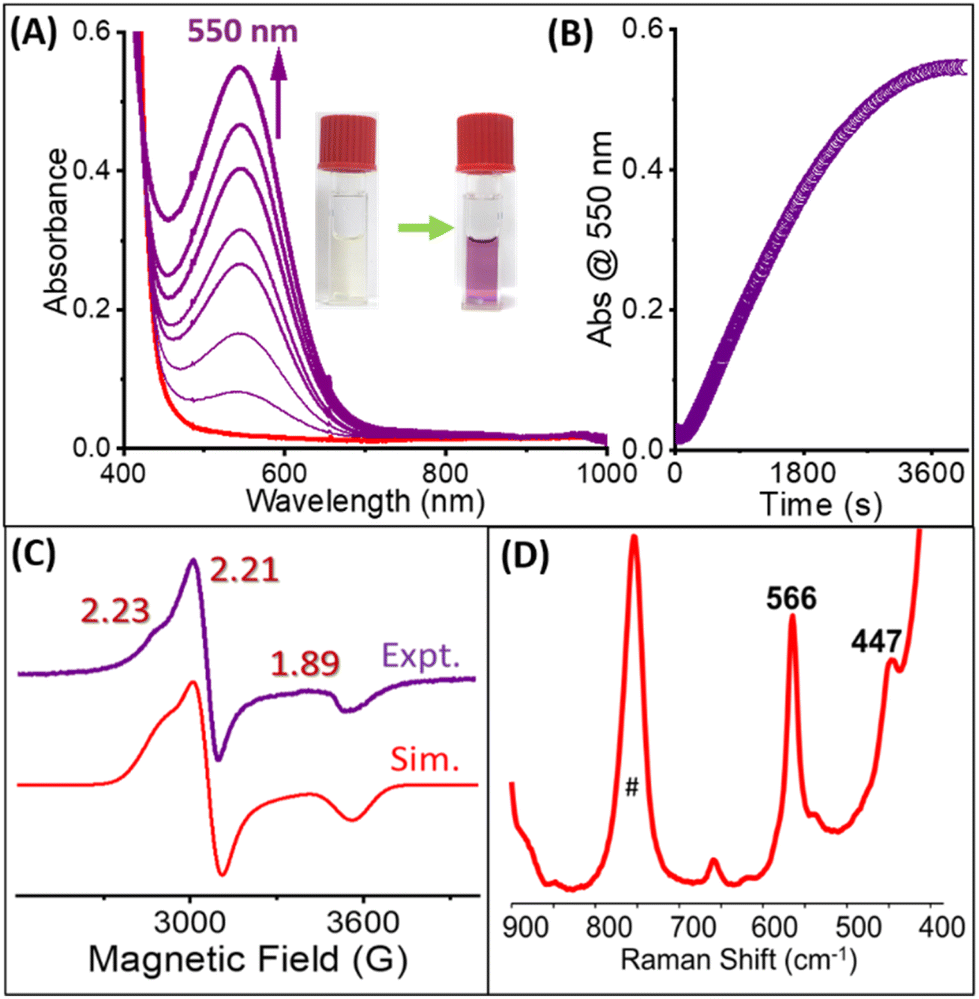 | ||
| Fig. 1 (A) Generation of 2 followed by UV/Vis absorption spectroscopy. Conditions: 0.5 mM 1 in MeCN:H2O (3:1 v/v) + 20 eq. mCPBA + 140 eq. aqueous NaCl at RT. (B) The corresponding absorption changes at 550 nm. (C) X-band EPR (9.45 GHz) spectrum of 2 (gz = 2.33, gy = 2.21 and gx = 1.89) measured at 120 K; modulation amplitude of 5 G; modulation frequency of 100 kHz, and attenuation of 10 dB. (D) Resonance Raman spectrum of 2 in MeCN:H2O (3:1 v/v) obtained at λexc 561 nm. # Indicate solvent band. | ||
To verify whether the band at 550 nm originated from a RuIII–OCl species, we performed EPR (Fig. 1C) and resonance Raman spectroscopic studies (Fig. 1D). An EPR spectrum of the 550 nm species exhibited an S = 1/2 signal with g values of 2.33, 2.21, and 1.89, which is typical of a RuIII–OCl species.23 The resonance Raman (RR) spectrum of the 550 nm species revealed two resonantly enhanced bands at 566 cm−1 and 447 cm−1 that are virtually the same as those of the reported [(BnTPEN)RuIII(OCl)]2+ (2) complex.23 The time-dependent resonance Raman spectrum of 2 at 561 nm was also obtained, and its formation and decay profile matched well with the one observed from UV/Vis absorption spectroscopy (Fig. S4†). Hence, the similarities in the UV/Vis absorption spectrum together with the same EPR and resonance Raman signals strongly suggest that the species generated with mCPBA and NaCl is, in fact, a [(BnTPEN)RuIII(OCl)]2+ species. One may think that mCPBA and NaCl generate NaOCl in situ, which upon reacting with 1 generates a RuIII–OCl complex. However, mCPBA and NaCl on their own did not form NaOCl under the conditions employed (Fig. S5†). Moreover, the formation of 2 from 1 with NaOCl requires the presence of HClO4, which is absent in the present case.23
To verify the versatility of the formation of the transient RuIII–OCl species in the ways described before, we have synthesized a [(MeTPEN)RuII(NCCH3)](PF6)2 (4) complex. The synthesis of 4 was carried out according to the procedure reported for 1.23 Similar to 1, 4 exhibited an intense absorption band at 360 nm (ε360 nm = 9830 M−1 cm−1) and 455 nm (ε455 nm = 1450 M−1 cm−1) in acetonitrile at room temperature (Fig. S8†). The resonantly enhanced bands due to the MeTPEN ligand appeared in the resonance Raman spectrum of 4 in acetonitrile with the excitation at 405 nm and 473 nm (Fig. S9†).24 Hence, the 360 nm absorption of 4 could be assigned to a ruthenium to pyridyl ligand charge transfer (MLCT). The mass analysis of 4 indicated two major peaks for [(MeTPEN)RuII(NCCH3)(PF6)]+ (m/z: 635.11) and [(MeTPEN)RuII(F)]+ (m/z: 468.11), suggesting the presence of a RuII species in solution (Fig. S10†).
Crystallographic studies of 4 unravelled a distorted octahedral RuII centre where the equatorial plane is occupied by three nitrogens of the pyridine rings in the ligand (the bond lengths to N3, N4, and N5 from Ru are 2.051(6), 2.066(6), and 2.068(6) Å, respectively). While the two amine nitrogens are present at the equatorial and axial sites with Ru–N1 and Ru–N2 bond lengths of 2.087(6) and 2.079(6) Å, respectively. The solvent CH3CN occupies the sixth coordination site with a Ru–N6 bond length of 2.041(6) Å (Fig. 2A, S11 and Tables S1, S2†). The average Ru–N bond distance of 2.066 Å illustrates a RuII low spin complex.23,25,26 The 1H NMR spectrum of 4 recorded in CD3CN revealed signals in the 1–10 ppm range, confirming the low spin nature of the RuII centre in the solution (Fig. S12 and S13†).23,27 A vibrational band at 2270 cm−1 in the IR spectrum (Fig. S14A†) affirms the bound acetonitrile ligand at the sixth site which fits well with the computationally optimised structure (Fig. S14B†).25 The potential values for the corresponding RuIII/RuII(CH3CN) and RuIII/RuII(OH2) redox couple for 4 were recorded in CH3CN (Fig. 2B) and H2O:CH3CN at room temperature (Fig. S15 and S16†). The values are in accordance with 1 reported in our previous studies (Fig. 2B).
 | ||
| Fig. 2 (A) X-ray crystal structure of 4 (with 50% ellipsoid probability level). Hydrogen atoms and PF6− counter ions are removed for clarity. The selected bond lengths are given in the right. CCDC 2259821.† (B) Table for redox potentials of 2 and 4 in 3:1 v/v H2O:CH3CN and CH3CN at room temperature. Potential values (V) were referenced vs. Ag/AgCl. | ||
Treatment of 4 with 10 eq. of NaOCl and 10 eq. of HClO4 in MeCN:H2O 3:1 (v/v) resulted in the formation of a band at 540 nm that closely resembles 2 (Fig. S17A†). This 540 nm intermediate persisted for 4.5 h under the conditions employed (Fig. S17B†). Further optimization experiments by varying the equivalents of NaOCl and HClO4 revealed that 50 eq. of NaOCl and 50 eq. of HClO4 produce the 540 nm species in a good yield which corresponds to ε540 nm of 1600 M−1 cm−1 (Fig. S18†). The newly generated 540 nm species exhibits an S = 1/2 species with g values of 2.32, 2.22, and 1.86 characteristic of the RuIII–OCl species (Fig. S19†).23 The resonance Raman spectrum of the 540 nm species at λexc 561 nm shows two resonantly enhanced bands at 564 and 450 cm−1, again in the range of the RuIII–OCl species (Fig. S20†). Its formation and decay profile was also monitored through resonance Raman spectroscopy that was in accordance with the UV/Vis absorption spectroscopy (Fig. S21†). The UV/Vis absorption, EPR, and resonance Raman spectroscopic studies indicate the assignment of the 540 nm band to the [(MeTPEN)RuIII(OCl)]2+ (5) species (Table 1).
| λ max, nm (ε M−1 cm−1) | τ 1/2 (h) | g values | υ Ru–O & υO–Cl (cm−1) | ||
|---|---|---|---|---|---|
|
a (L)RuIII–OCl generated with 10 eq. NaOCl + 10 eq. HClO4 in 3:1 v/v MeCN:H2O at room temperature.
b (L)RuIII–OCl generated with 20 eq. mCPBA + 140 eq. NaCl in 3:1 v/v MeCN:H2O at room temperature.
|
|||||
| 2 | 550 (1800) | 2.5a | 2.75b | 2.33, 2.2, 1.88a23 |
566, 447 |
| 2.33, 2.21, 1.89b | |||||
| 5 | 540 (1600) | 3.5a | 1.15b | 2.32, 2.22, 1.86a | 564, 450 |
| 2.29, 2.22, 1.90b | |||||
We further explored the feasibility of forming 5 with mCPBA & NaCl in MeCN:H2O 3:1 (v/v). Like 1, the treatment of mCPBA with 4 did not change its absorption spectrum (Fig. S22†). However, the reaction in the presence of chloride ions generates the absorption band at 540 nm of 5 (Fig. 3A and B). The ESI-MS analysis of 5 indicated two major peaks corresponding to {[(MeTPEN)RuIII(OCl)(HCOO)]·CH3CN·H2O}+ (m/z = 604.11) and [(MeTPEN)RuII(Cl)]+ (m/z = 484.08) (Fig. S23†). Optimization experiments revealed that 20 eq. of mCPBA and 140 eq. of NaCl were adequate to provide a good yield of 5 (Fig. S24†). It is worth mentioning that the stability of 5 is low compared to its generation with NaOCl & HClO4, which could also be seen on comparing the rate of its formation and decay obtained through resonance Raman and UV/Vis spectroscopy (Fig. S25 and S26†). The EPR and Raman spectroscopic characterization of 5 generated by mCPBA & NaCl and NaOCl & HClO4 are essentially indistinguishable (Fig. 3, S17–S20† and Table 1).
 | ||
| Fig. 3 (A) Generation of 5 followed by UV/Vis absorption spectroscopy. Conditions: 0.5 mM 4 in MeCN:H2O (3:1 v/v) + 20 eq. of mCPBA + 140 eq. of aqueous NaCl at RT. (B) The corresponding absorption changes at 540 nm. (C) X-band EPR (9.45 GHz) spectrum of 5 (gz = 2.29, gy = 2.22 and gx = 1.90) measured at 120 K; modulation amplitude of 5 G; modulation frequency of 100 kHz, and attenuation of 10 dB. (D) The resonance Raman spectrum of 5 in MeCN:H2O (3:1 v/v) obtained at λexc 561 nm. # Indicate solvent band. | ||
We hypothesized that the formation of the RuIII–OCl species from the reaction of (L)RuII (1 and 4) with mCPBA and NaCl is mediated by a putative high-valent RuVO intermediate (vide infra). However, our spectroscopic attempts to capture the transient (L)RuVO species have been unsuccessful so far. We utilized DFT calculations to verify the feasibility of the proposed hypothesis. DFT calculations were carried out at the S12g/TZ2P level of theory with the COSMO28–30 dielectric continuum model (acetonitrile parameters), and relativistic corrections were included self-consistently.31,32 We optimized the structures of 1–6 (see the methodology of DFT in the ESI†), which included the [(BnTPEN)RuV(O)]3+ (3) and [(MeTPEN)RuV(O)]3+ (6) species, to calculate the relative energy difference between ruthenium-oxo species and their corresponding –OCl species. Fig. 4 shows the energy profile diagram with the relevant energy (kcal mol−1) of all species 1–6. It is evident that the formation of 3 and 6 from 1 and 4, respectively, requires sufficient amounts of energy. In contrast, the formation of 2 and 5 is a barrierless process from 3 and 6, with reaction energies of −83.7 and −85.9 kcal mol−1, respectively. Hence, computational results correspond well with the experimental results that the addition of Cl− to mCPBA with RuII readily produces RuIII–OCl.
 | ||
| Fig. 4 The energy (kcal mol−1) profile diagram for the formation of [(L)RuIII–OCl]2+ species from [(L)RuII]2+ through the [(L)RuVO]3+ intermediate (where L = BnTPEN and MeTPEN). The optimized structures are provided for the BnTPEN variant for clarity. | ||
Furthermore, computational spectroscopic (IR and UV/Vis) analyses were performed for the validation of the results. The UV/Vis absorption spectrum of 2 shows a peak with λmax at 610 nm with two weaker peaks at 475 and 543 nm (Fig. S27†). On the other hand, we observed a strong peak at 470 nm along with two weaker peaks at 575 and 625 nm for 5 (Fig. S28†). Hence, the calculated spectra for both species resemble the experiments quite well. The tentatively assigned characteristic λmax for 5 is 625 nm due to its closeness with that of 2. The computed Ru–O vibration for 2 and 5 is observed at 588 and 595 cm−1, respectively, in excellent agreement with the experimental values of 566 and 564 cm−1, respectively (Fig. S29 and S30†). Interestingly, however, the true O–Cl stretching vibrations are observed below 400 cm−1, although the O–Cl atoms are involved in angle bending modes at ca. 430 cm−1 for 2 and 5, respectively (Fig. S29 and S30†). Hence, these latter peaks are assigned to the peaks observed in the experimental resonance Raman results.
The reactivity of complex 5 was tested for hydrogen atom abstraction (HAA) reactivity (Fig. 4). Pseudo-first-order rate constants (kobs) were obtained by reacting 5 with various concentrations of substituted phenols as substrates. The slope of the plots of kobsvs. [substrate] gave rise to second-order rate constants (k2). The reaction of 5 with phenol showed a k2 value of 0.93 M−1 s−1 at room temperature (Fig. S31†). However, a strong electron donating group at the para position, i.e., 4-methoxyphenol (k2 = 7.54 M−1 s−1), increases the rate more than 8 times (Fig. S32†). On the same line, p-cresol (k2 = 1.9 M−1 s−1) and 4-(tert-butyl)phenol (k2 = 1.36 M−1 s−1) also have faster rates with respect to phenol (Fig. S33 and S34†). 4-Chlorophenol has comparable bond dissociation energy (BDEO–H), and hence a similar k2 value (72 × 10−2 M−1 s−1) to that of phenol (Fig. S35†). On the other hand, upon introducing at the para position, electron-withdrawing groups like cyano and nitro lower the k2 value significantly as BDEO–H increases. 4-Hydroxybenzonitrile (23.7 × 10⁻² M−1 s−1) and 4-nitrophenol (84.5 × 10⁻³ M−1 s−1) fit well on this line (Fig. S36 and S37†). The plot of log(k2) vs. BDE of O–H gives a linear fit, indicating an increasing reaction rate with decreasing BDE (Fig. 5). The respective radical coupled bisphenols and their derivatives were observed as the major products in the catalytic reactions (Fig. S38–44†). This reactivity pattern with phenol and its derivatives suggests that 5 is electrophilic, like 2.23
 | ||
| Fig. 5 A plot of BDEO–Hvs. logk2 for the reaction of 5 (generated by the reaction of 4 with 20 eq. mCPBA + 140 eq. NaCl in MeCN:H2O 3:1 (v/v)) with various phenols. | ||
A proposed mechanism for the formation of the RuIII–OCl species (2 and 5) from the reaction of the RuII precursor complexes (1 and 4) with mCPBA and NaCl is shown in Scheme 2. The reaction of mCPBA with RuII complexes resulted in the formation of a putative RuVO species (3 and 6). Interestingly, in the present case, this reaction is facilitated only by the presence of chloride ions. The nucleophilic attack of the Cl− ion on high valent electrophilic RuVO generates a RuIII–OCl species supported by our DFT studies as this conversion was found to be barrierless. The generated RuIII–OCl species was thoroughly characterized using various spectroscopic techniques and was found to be capable of oxidizing various phenols and their derivatives.
 | ||
| Scheme 2 The proposed reaction mechanism for forming [(L)RuIII–OCl]2+ through the [(L)RuVO]3+ species. | ||
Conclusions
The reported [(L)RuIII–OCl]2+ species serves as the structural model for haloperoxidases.23 However, in the present case with two (L)RuII complexes 1 and 4, it was interesting to witness the generation of a [(L)RuIII–OCl]2+ species carried out by modeling naturally occurring heme-dependent haloperoxidases. The appealing part of the mechanism has been the influence of the Cl− ion in the reaction of mCPBA with (L)RuII to form a [(L)RuIII–OCl]2+ species eventually. The formed ruthenium hypochlorite adduct, being an electrophilic oxidant, catalyzed HAA reactions.Experimental section
Materials and methods
All chemicals and reagents were obtained from commercial sources and were used as received. HPLC grade H2O and CH3CN from Merck were used in spectroscopic studies. Elemental analysis (C, H, N) of 4 was performed using a PerkinElmer CHNS/O 2400 series II analyser. The FT-IR (KBr, 4000–500 cm−1) spectrum of 4 was acquired on a PerkinElmer Spectrum Two spectrometer. An Agilent 8453 diode-array spectrophotometer was used to record UV/Vis absorption spectra and conduct kinetic experiments spectrophotometrically using 1 cm quartz cells (λ = 200–1000 nm range). ESI-MS was recorded on an Agilent 6546 LC/Q-TOF instrument in the positive ion mode. Product analyses were performed using atmospheric pressure chemical ionization mass spectrometry (APCI-MS) on an Agilent 7890A gas chromatograph equipped with an Agilent 6230 LC/TOF system. A Bruker EMX 1444 spectrometer with a temperature controller was employed to record the X-band EPR data at 120 K. Simulation of the EPR spectrum of 2 and 5 were carried out using Bruker WINEPR SimFonia software. The spectrometer was calibrated using 3-bisdiphenylene-2-phenylallyl (BDPA) as the X-Band EPR standard. 1H NMR spectra were obtained using JEOL JNM LA 500 (500 MHz) and JEOL JNM LA 400 (400 MHz) NMR spectrometers.Cyclic Voltammetry experiments were carried out at room temperature using a CH instruments electrochemical analyzer M-600B series. A three-electrode system was used where a glassy carbon was used as the working electrode, Pt wire as the auxiliary electrode, and aqueous Ag/AgCl (3 M aq. KCl solution) as the reference electrode. The solutions used were 1 mM 4 and 100 mM supporting electrolyte tetra-n-butylammonium hexafluorophosphate (TBAPF6) in acetonitrile and sodium perchlorate in water.
Resonance Raman spectra of 4 were obtained at 405 nm (40 mW, Cobolt lasers, HÜBNER Photonics) and 473 nm (50 mW, Cobolt lasers, HÜBNER Photonics) excitation wavelengths and that of 2, and 5 were carried out at 561 nm excitation wavelength (100 mW, Cobolt lasers, HÜBNER Photonics) using a Kymera 328i motorized Czerny-Turner spectrograph (Andor Technology) equipped with a DU 420A-BEX2-DD camera (iDus 420 CCD, Andor Technology). The CCD camera was cooled to −80 °C. The spectral slit width of the instrument was set to 100 μm. The spectral calibration was performed using a 1:1 CH3CN:toluene (v/v) solvent mixture.33
X-ray crystallography
Single-crystals of suitable dimensions were used for data collection. Diffraction intensities were collected on a Bruker APEX-II CCD diffractometer, with graphite-monochromated Mo Kα (0.71073 Å) radiation at 100(2) K. Data were corrected for Lorentz and polarization effects; empirical absorption corrections (SADABS v 2.10) were applied. Using Olex2,34 the structures were solved with ShelXT35 structure solution program using Intrinsic Phasing and refined with the ShelXL36 refinement package using Least Squares minimization. The non-hydrogen atoms were refined anisotropically, whereas the H atoms fixed to their geometrically ideal positions were refined isotropically. All non-hydrogen atoms were refined with anisotropic thermal parameters using full-matrix least-squares procedures on F2. CCDC 2259821 contains the supplementary crystallographic data for 4.†Catalytic reaction conditions for APCI-MS analyses
To a solution of 4 (2 mM in 3:1 v/v CH3CN:H2O), 20 eq. of mCPBA and 140 eq. of aqueous NaCl was added to generate 5 at room temperature. Upon maximum accumulation of 5 (typically takes 15 min), 50 eq. substrate, i.e., 4-methoxyphenol, p-cresol, 4-(tert-butyl)phenol, phenol, 4-chlorophenol, 4-hydroxybenzonitrile and 4-nitrophenol were added. Conditions: 1:20:140:50 (4:mCPBA:NaCl:substrate). After stirring the reaction overnight at room temperature, ethyl acetate was poured into the reaction mixture and passed through a silica column (to eliminate metallic species). The eluted solution was concentrated over a rotatory evaporator using which APCI-MS data was recorded.
Reaction of phenol and its derivatives with mCPBA and NaCl followed by UV/Vis absorption spectroscopy
To a solution of 0.04 mM mCPBA and 0.28 mM aqueous NaCl in 3:1 v/v CH3CN:H2O, 0.1 mM substrate (4-methoxyphenol, p-cresol, 4-(tert-butyl)phenol, phenol, 4-chlorophenol, 4-hydroxybenzonitrile and 4-nitrophenol) was added. (Conditions: 0:20:140:50; 4:mCPBA:NaCl:substrate.) UV/Vis absorption spectroscopy was used to monitor these reactions for changes in the absorption of the substrate. Over the course of 30 minutes, there was no change in the absorption of phenolic substrates.
Synthesis of N1-methyl-N1,N2,N2-tris(pyridin-2-ylmethyl)ethane-1,2-diamine (MeTPEN)
Synthesis of the MeTPEN ligand was carried out using a modified literature procedure.23,37,38 Picolylchloride hydrochloride salt (3.3 g, 20.24 mmol) was dissolved in 15 mL H2O followed by the addition of N1-methylethane-1,2-diamine (500 mg, 6.74 mmol) in a 50 mL round-bottom flask equipped with a magnetic stirring bar. Aqueous NaOH solution (2.2 g in 10 mL) was added dropwise over a period of an hour and the reaction was stirred at room temperature for 7 days. After 7 days, the reaction mixture was extracted with methylene chloride (3 × 25 mL). The combined organic phases were dried over Na2SO4 followed by the solvent evaporation under reduced pressure. Brown-red oil was passed through a silica column using CHCl3:MeOH as the eluting solution. The pure ligand was collected using 4% MeOH from the CHCl3 fraction as a yellow oil. Yield: 1.38 g, 60%. Characterization (Fig. S6 and S7†): 1H NMR (CDCl3, 400 MHz): δ (ppm) 2.18 (s, 3H), 2.62 (t, J = 6.3 Hz, 2H), 2.74 (t, J = 6.3 Hz, 2H), 3.60 (s, 2H), 3.82 (s, 4H), 7.10 (m, 3H), 7.34 (d, J = 7.8 Hz, 1H), 7.49 (d, J = 7.8 Hz, 2H), 7.62–7.53 (m, 3H), 8.48 (m, 3H). 13C NMR (CDCl3, 100 MHz): δ (ppm) 42.9 (CH3–N), 52.3 (CH2–N), 55.8 (CH2–N), 60.9 (2 × CH2–Py), 64.3 (CH2–Py), 121.9 (3 × CH), 122.9 (2 × CH), 123.1 (CH), 136.4 (3 × CH), 149.1 (3 × CH), 159.6(CH), 159.9 (2 × CH).
Synthesis of [RuII(MeTPEN)(NCCH3)](PF6)2 (4)
Synthesis of 4 was carried out following a literature procedure for [RuII(BnTPEN)(NCCH3)](PF6)2.39 A mixture of MeTPEN (450 mg, 1.29 mmol), ruthenium(III) chloride hydrate (RuCl3·xH2O) (591 mg, 2.85 mmol), and L-ascorbic acid (456.17 mg, 2.59 mmol) were heated under reflux overnight in a 20 mL of EtOH and 30 mL of H2O mixture. Next day the reaction mixture was cooled to room temperature. The solvent was completely removed under vacuum. The crude product was purified by column chromatography on neutral alumina, eluting with CH3CN to yield the [RuII(MeTPEN)(Cl)](Cl) complex. Saturated aqueous potassium hexafluorophosphate (KPF6) was added to [RuII(MeTPEN)(Cl)](Cl) in water which afforded [RuII(MeTPEN)(Cl)](PF6) as a yellowish red solid. This red solid was left to dry overnight under high vacuum following which it was redissolved in 30 mL of acetonitrile and 3 mL of water. This mixture was heated overnight at 60 °C. The reaction was then cooled to room temperature and the solvent was reduced to 4–5 mL under vacuum. A few drops of saturated aqueous KPF6 were subsequently added to the solution to yield 4 as a red solid (350 mg, 35%). Single crystals suitable for X-ray analysis were obtained by the slow vapour diffusion of diethyl ether into the acetonitrile solution of 4 at room temperature. 1H NMR (500 MHz, CD3CN): δ (ppm) 8.92 (d, 1H, J = 5.0 Hz), 8.08 (d, 1H, J = 5.5 Hz), 7.99 (td, 1H, J = 7.80 Hz, 1.45 Hz), 7.86 (qd, 2H, J = 7.8 Hz, 1.5 Hz), 7.60 (q, 2H, J = 6.6 Hz), 7.52 (m, 3H), 7.30 (t, 1H, J = 6.60 Hz), 7.25 (t, 1H, J = 6.50 Hz), 4.89 (m, 2H), 4.64 (d, 1H, J = 15.65 Hz), 4.17 (d, 1H, J = 15.5 Hz), 3.98 (d, 1H, J = 15.65 Hz), 3.68 (dd, 1H, J = 14.60 Hz, 3.60 Hz), 3.33 (td, 1H, J = 14.0 Hz, 3.2 Hz), 2.73 (dd, 1H, J = 13.40 Hz, 4.10 Hz), 2.66 (dd, 1H, J = 13.9 Hz, 3.60 Hz), 2.51 (d, 1H, J = 5.55 Hz), 2.25 (s, 3H), 2.16 (s, 3H). 13C NMR (125 MHz, CD3CN): δ (ppm) 166.40, 164.75, 163.80, 155.00, 154.29, 152.30, 138.52, 138.41, 137.68, 126.46, 125.99, 125.68, 125.39, 124.07, 122.65, 69.37, 69.14, 67.46, 66.13, 60.28, 47.30, 4.72. ESI-MS: m/z 635.11 [RuII(MeTPEN)(NCCH3)(PF6)]+. Elemental analysis for C23H28F12N6P2Ru: C 35.44; H 3.62; N 10.78. Found: C 34.72; H 3.33; N 10.57.DFT based optimized structures of 1–6
A data set collection of computational results is available in the ioChem-BD repository40 and can be accessed viahttps://doi.org/10.19061/iochem-bd-4-60 to facilitate data exchange and dissemination, according to the FAIR41 principles of OpenData sharing.Conflicts of interest
There are no conflicts to declare.Acknowledgements
The work presented here is financially supported by SERB (CRG/2019/003058), CSIR (01(3050)/21/EMR-II), AEI/MCIN (PID2020-114548GB-I00), and GenCat (2021 SGR 00487, 2022 FI_B 00118). Software for Chemistry & Materials (SCM) is acknowledged for a generous developer's license to MS. RK and AA are grateful to IIT Kanpur for their institute fellowships.References
- M. M. Alauddin, Am. J. Nucl. Med. Mol. Imaging, 2012, 2, 55–76 CAS.
- E. Miele, G. P. Spinelli, F. Tomao, A. Zullo, F. De Marinis, G. Pasciuti, L. Rossi, F. Zoratto and S. Tomao, J. Exp. Clin. Cancer Res., 2008, 27, 1–10 CrossRef PubMed.
- U. Mukhopadhyay, S. Soghomonyan, H. H. Yeh, L. G. Flores, A. Shavrin, A. Y. Volgin, J. G. Gelovani and M. M. Alauddin, Nucl. Med. Biol., 2008, 35, 697–705 CrossRef CAS PubMed.
- S. G. Nerella, P. Singh, T. Sanam and C. S. Digwal, Front. Med., 2022, 9, 1–23 Search PubMed.
- A. F. Shields, J. R. Grierson, B. M. Dohmen, H. J. Machulla, J. C. Stayanoff, J. M. Lawhorn-Crews, J. E. Obradovich, O. Muzik and T. J. Mangner, Nat. Med., 1998, 4, 1334–1336 CrossRef CAS PubMed.
- J. R. Spermon, L. F. De Geus-Oei, L. A. L. M. Kiemeney, J. A. Witjes and W. J. G. Oyen, BJU Int., 2002, 89, 549–556 CrossRef CAS PubMed.
- H. Meng and K. Kumar, J. Am. Chem. Soc., 2007, 129, 15615–15622 CrossRef CAS PubMed.
- J. M. S. Ponte, A. M. L. Seca and M. C. Barreto, Molecules, 2022, 27, 1–29 Search PubMed.
- J. W. Blunt, B. R. Copp, W. Hu, M. H. G. Munro and T. Northcote, Nat. Prod. Rep., 2009, 26, 170–244 RSC.
- C. Paul and G. Pohnert, Nat. Prod. Rep., 2011, 28, 186–195 RSC.
- M. Voss, S. H. Malca and R. Buller, Chem. – Eur. J., 2020, 26, 7336–7345 CrossRef CAS PubMed.
- A. Butler and M. Sandy, Nature, 2009, 460, 848–854 CrossRef CAS PubMed.
- L. C. Blasiak and C. L. Drennan, Acc. Chem. Res., 2009, 42, 147–155 CrossRef CAS PubMed.
- C. C. Mclauchlan, H. A. Murakami, C. A. Wallace and D. C. Crans, J. Inorg. Biochem., 2018, 186, 267–279 CrossRef CAS PubMed.
- J. M. Winter and B. S. Moore, J. Biol. Chem., 2009, 284, 18577–18581 CrossRef CAS PubMed.
- A. Timmins and S. P. De Visser, Catalysts, 2018, 8, 314–338 CrossRef.
- Z. Chen, Coord. Chem. Rev., 2022, 457, 214404 CrossRef CAS.
- A. Draksharapu, D. Angelone, M. G. Quesne, S. K. Padamati, L. Gõmez, R. Hage, M. Costas, W. R. Browne and S. P. De Visser, Angew. Chem., Int. Ed., 2015, 54, 4357–4361 CrossRef CAS PubMed.
- Z. Cong, S. Yanagisawa, T. Kurahashi, T. Ogura, S. Nakashima and H. Fujii, J. Am. Chem. Soc., 2012, 134, 20617–20620 CrossRef CAS PubMed.
- I. Araki, K. Fukui and H. Fujii, Inorg. Chem., 2018, 57, 1685–1688 CrossRef CAS PubMed.
- A. Draksharapu, Z. Codola, L. Gómez, J. Lloret-fillol and W. R. Browne, Inorg. Chem., 2015, 54, 10656–10666 CrossRef CAS PubMed.
- T. Corona, A. Draksharapu, S. K. Padamati, I. Gamba, V. Martin-diaconescu, W. R. Browne and A. Company, J. Am. Chem. Soc., 2016, 138, 12987–12996 CrossRef CAS PubMed.
- R. Kumar, A. Awasthi, S. Gupta, R. Eerlapally and A. Draksharapu, Dalton Trans., 2022, 51, 12848–12854 RSC.
- S. F. Mcclanahan, R. F. Dallinger, F. J. Holler and J. R. Kincaid, J. Am. Chem. Soc., 1985, 107, 4853–4860 CrossRef CAS.
- S. Ohzu, T. Ishizuka, Y. Hirai, H. Jiang, M. Sakaguchi, T. Ogura, S. Fukuzumi and T. Kojima, Chem. Sci., 2012, 3, 3421–3431 RSC.
- R. Sharma, J. D. Knoll, P. D. Martin, I. Podgorski, C. Turro and J. J. Kodanko, Inorg. Chem., 2014, 53, 3272–3274 CrossRef CAS PubMed.
- V. Piccialli, Molecules, 2014, 19, 6534–6582 CrossRef PubMed.
- C. C. Pye and T. Ziegler, Theor. Chem. Acc., 1999, 396–408 Search PubMed.
- M. Swart, E. Rösler and F. M. Bickelhaupt, Eur. J. Inorg. Chem., 2007, 3646–3654 CrossRef CAS.
- A. Klamt and G. Schuurmann, J. Chem. Soc. Perkin Trans., 1993, 2, 799–805 RSC.
- M. Swart, Chem. Phys. Lett., 2013, 580, 166–171 CrossRef CAS.
- M. Swart and M. Gruden, Acc. Chem. Res., 2016, 49, 2690–2697 CrossRef CAS PubMed.
- Standard Guide for Raman Shift Standards for Spectrometer Calibration, 2007, vol. E1840-96, DOI:10.1520/E1840-96R07.
- O. V. Dolomanov, L. J. Bourhis, R. J. Gildea, J. A. K. Howard and H. Puschmann, J. Appl. Crystallogr., 2009, 42, 339–341 CrossRef CAS.
- G. M. Sheldrick, Acta Crystallogr., Sect. A: Found. Adv., 2015, 71, 3–8 CrossRef PubMed.
- G. M. Sheldrick, Acta Crystallogr., Sect. C: Struct. Chem., 2015, 71, 3–8 Search PubMed.
- S. S. Ramadan, M. Barlog, J. Roach, M. Al-Hashimi, H. S. Bazzi and K. Machaca, Bioorg. Chem., 2019, 87, 366–372 CrossRef PubMed.
- V. G. Snider, B. J. Pella and A. Mukherjee, Inorg. Chim. Acta, 2018, 469, 447–452 CrossRef CAS.
- D. Unjaroen, J. Chen, E. Otten and W. R. Browne, Inorg. Chem., 2017, 56, 900–907 CrossRef CAS PubMed.
- M. álvarez-Moreno, C. de Graaf, N. López, F. Maseras, J. M. Poblet and C. Bo, J. Chem. Inf. Model., 2015, 55, 95–103 CrossRef PubMed.
- M. D. Wilkinson, M. Dumontier, I. J. Aalbersberg, G. Appleton, M. Axton, A. Baak, N. Blomberg, J. W. Boiten, L. B. da Silva Santos, P. E. Bourne, J. Bouwman, A. J. Brookes, T. Clark, M. Crosas, I. Dillo, O. Dumon, S. Edmunds, C. T. Evelo, R. Finkers, A. Gonzalez-Beltran, A. J. G. Gray, P. Groth, C. Goble, J. S. Grethe, J. Heringa, P. A. C. t Hoen, R. Hooft, T. Kuhn, R. Kok, J. Kok, S. J. Lusher, M. E. Martone, A. Mons, A. L. Packer, B. Persson, P. Rocca-Serra, M. Roos, R. van Schaik, S. A. Sansone, E. Schultes, T. Sengstag, T. Slater, G. Strawn, M. A. Swertz, M. Thompson, J. Van Der Lei, E. Van Mulligen, J. Velterop, A. Waagmeester, P. Wittenburg, K. Wolstencroft, J. Zhao and B. Mons, Sci. Data, 2016, 3, 1–9 Search PubMed.
Footnote |
| † Electronic supplementary information (ESI) available: Detailed experimental and DFT procedures, characterization data of the ligand and metal complex. CCDC 2259821 for 4. For ESI and crystallographic data in CIF or other electronic format see DOI: https://doi.org/10.1039/d3dt02028b |
| This journal is © The Royal Society of Chemistry 2023 |