
 Open Access Article
 This Open Access Article is licensed under a
 Creative Commons Attribution 3.0 Unported Licence
Tetraphenylporphyrin electrocatalysts for the hydrogen evolution reaction: applicability of molecular volcano plots to experimental operating conditions†
Felicia
Zaar
 a,
C.
Moyses Araujo
bc,
Rikard
Emanuelsson
d,
Maria
Strømme
a and
Martin
Sjödin
*a
a,
C.
Moyses Araujo
bc,
Rikard
Emanuelsson
d,
Maria
Strømme
a and
Martin
Sjödin
*a
aDepartment of Materials Science and Engineering, Division of Nanotechnology and Functional Materials, Uppsala University, Box 35, SE-751 03 Uppsala, Sweden. E-mail: martin.sjodin@angstrom.uu.se
bMaterials Theory Division, Department of Physics and Astronomy, Ångström Laboratory, Uppsala University, Box 516, SE-751 20 Uppsala, Sweden
cDepartment of Engineering and Physics, Karlstad University, 651 88 Karlstad, Sweden
dDepartment of Chemistry – BMC, Uppsala University, Box 576, SE-751 23 Uppsala, Sweden
First published on 4th July 2023
Abstract
Recent years have seen an increasing interest in molecular electrocatalysts for the hydrogen evolution reaction (HER). Efficient hydrogen evolution would play an important role in a sustainable fuel economy, and molecular systems could serve as highly specific and tunable alternatives to traditional noble metal surface catalysts. However, molecular catalysts are currently mostly used in homogeneous setups, where quantitative evaluation of catalytic activity is non-standardized and cumbersome, in particular for multistep, multielectron processes. The molecular design community would therefore be well served by a straightforward model for prediction and comparison of the efficiency of molecular catalysts. Recent developments in this area include attempts at applying the Sabatier principle and the volcano plot concept – popular tools for comparing metal surface catalysts – to molecular catalysis. In this work, we evaluate the predictive power of these tools in the context of experimental operating conditions, by applying them to a series of tetraphenylporphyrins employed as molecular electrocatalysts of the HER. We show that the binding energy of H and the redox chemistry of the porphyrins depend solely on the electron withdrawing ability of the central metal ion, and that the thermodynamics of the catalytic cycle follow a simple linear free energy relation. We also find that the catalytic efficiency of the porphyrins is almost exclusively determined by reaction kinetics and therefore cannot be explained by thermodynamics alone. We conclude that the Sabatier principle, linear free energy relations and molecular volcano plots are insufficient tools for predicting and comparing activity of molecular catalysts, and that experimentally useful information of catalytic performance can still only be obtained through detailed knowledge of the catalytic pathway for each individual system.
1 Introduction
Production of H2 fuel through water electrolysis is one of many important steps towards a more sustainable society. This process requires robust redox catalysts to be economically and environmentally feasible. Pt has long been known as the state-of-the art catalyst of the hydrogen evolution reaction (HER), but as it is also scarce and expensive,1–3 much attention is turning towards homogeneous, molecular alternatives. Molecular catalysts can be produced from more earth-abundant elements,4 have well-defined catalytic sites5,6 and can be tuned towards high activity and selectivity through molecular design.4,5 Several molecular systems, such as water-soluble transition metal complexes,7 Ni(II) bi(diphosphine) complexes,8 and various porphyrins,9–14 have already been shown to be catalytically active towards the HER. However, molecular systems can currently rarely compete with heterogeneous, industrial catalysts in terms of stability and lifetime. In addition, complex reaction mechanisms and a lack of consensus on how to best evaluate reaction kinetics mean that development of improved molecular catalysts often requires cumbersome testing of individual designs. The study of molecular catalysis would therefore greatly benefit from a straightforward tool to predict and compare catalytic properties.In heterogeneous catalysis, the Sabatier principle is a recognized model for comparing and selecting catalytic materials.15 It states that if the substrate binds too weakly to the catalyst, there will be an energy barrier between the initial state and the following intermediate, and if the substrate binds too strongly, there will be an energy barrier between the intermediate and the next step or product. The Sabatier principle has been used to confirm and predict relative efficiencies of metal surfaces used for catalysis of the hydrogen evolution,16–18 oxygen reduction19,20 and oxygen evolution reactions.21,22 By plotting a measure of the catalytic activity against the binding energy of a particular intermediate, a so-called volcano plot can be produced, where the most efficient catalyst is located at the apex.
According to the Sabatier principle, the free-energy landscape of an ideal catalyst is flat at equilibrium, meaning that at equilibrium there are no energy barriers between the substrate, the reaction intermediates and the product. For hydrogen evolution on metal surfaces, construction of a volcano plot representing a flat energy landscape is straightforward, given that hydrogen bound to the surface is considered the only intermediate.15,17,23 The binding energy of hydrogen, ΔεH, is then a good descriptor of catalytic efficiency.17,18 For catalytic cycles involving more steps, the free energy change of one step is not necessarily independent of the free energy change of the others. For example, the binding energies of OH and OOH in the oxygen evolution reaction have been shown to be linearly related.20–22 In fact, assuming or identifying linear free energy dependencies between different intermediates gives rise to so-called scaling relations, which can be used to produce volcano plots and optimize energy barriers for a series of catalysts.15,20–22,24
In molecular homogeneous catalysis, scaling relations are often used to illustrate the trade-off between catalytic activity and overpotential.25–27 Recently, such relations have been used to produce molecular volcano plots.25,28,29 However, these plots have been realized for enzymes30 or in computational settings, and have not yet been fully connected to experimental studies of small molecular catalysts. In addition, the Sabatier analysis and volcano plots in both heterogeneous and homogeneous setups tend to focus on the thermodynamic aspects of catalysis. Indeed, free energy relations and so-called theoretical minimum overpotentials reveal nothing of the inevitable kinetic aspects of real-world catalysis, and it has been suggested on numerous occasions that thermodynamic profiles and/or linear free energy relations are not sufficient for accurate prediction of catalytic quality.26,31–38
In this work, we investigate the value of applying the Sabatier principle, linear scaling relations and the volcano plot concept to molecular catalysis in relation to experimental reaction kinetics. We report the electrochemistry and catalytic activity towards the HER for a series of tetraphenylporphyrins, and evaluate the applicability of the Sabatier principle by comparing the computationally derived ΔεH to various experimental electrochemical kinetic parameters. We show that ΔεH abides by a linear scaling relation between the initial steps of the catalytic reaction, and that it agrees with the thermodynamic profiles of the series. We also show that the binding energy is not sufficient to accurately predict reaction kinetics and catalytic activity. We conclude that while the Sabatier principle and the volcano plot concept may be transferrable to molecular catalysis in terms of pure thermodynamics, they cannot be used to determine which catalyst will perform best in a real-world setting. For successful application of molecular design, other tools must be developed.
2 Experimental section
2.1 General
The series of molecular catalysts used in this study consists of free base and metalated meso-tetraphenylporphyrins, referred to as MTPP. Unless otherwise stated, the metals are in oxidation state +II. NiTPP, CuTPP, CoTPP and ZnTPP were purchased from PorphyChem and used without further purification. Al(III)TPPCl, FeTPP, MgTPP and O![[double bond, length as m-dash]](https://www.rsc.org/images/entities/char_e001.gif) Ti(IV)TPP were synthesized through metalation of commercially available H2TPP as previously reported39 and AgTPP is also commercially available.
Ti(IV)TPP were synthesized through metalation of commercially available H2TPP as previously reported39 and AgTPP is also commercially available.
Dichloromethane (DCM, puriss. p.a., ACS reag., reag. ISO, GC, ≥99.9%, VWR chemicals) was used as the solvent for all electrochemical and spectroscopic studies. Tetrabutylammonium hexafluorophosphate (TBAPF6), purchased from Sigma-Aldrich, was used as received as the supporting electrolyte. Glassy carbon electrodes, reference electrodes and Pt wire electrodes were purchased from Bio-Logic.
2.2 Electrochemical characterization
Each porphyrin was dissolved in 0.1 M TBAPF6/DCM; H2TPP and ZnTPP to 2.5 mM and all other porphyrins to saturation. The solution was deoxygenated by purging with N2 gas. Cyclic and square wave voltammetry were then performed under N2 atmosphere in a three-electrode setup using an Autolab PGSTAT032N potentiostat from Metrohm AG. A glassy carbon disc electrode (3 mm diameter, 70 mm long) was used as the working electrode, a Pt wire as the counter electrode and the Ag/Ag+ couple as the reference electrode. The reference electrode was kept in a separate compartment connected to the bulk solution by a porous frit, and the Fc/Fc+ couple was used as an internal standard. Unless otherwise stated, all cyclic voltammograms were performed at 0.1 V s−1. Square wave voltammetry was performed at 15 Hz, using a 4 mV potential increment and an amplitude of 25 mV.2.3 UV/vis spectroscopy
UV/vis spectroscopy was performed using an Agilent 8453 UV-visible single beam spectrophotometer and a 1 mm thin layer spectroelectrochemical quartz cell. Each porphyrin was dissolved to 25 μM in DCM and the absorbance spectrum recorded between 190 and 1100 nm. For each porphyrin, a blank spectrum was recorded against porphyrin free solution and subtracted from the sample spectrum. Absorbance spectra were also recorded with 22 equivalents of benzoic acid (BzOH) added to both the blank and the sample spectrum.2.4 Catalysis of hydrogen evolution
The catalytic activity of the porphyrins towards the HER was evaluated using the same three-electrode setup as for cyclic voltammetry, but using a porphyrin concentration of 0.2 mM in 0.1 M TBAPF6/DCM. 0.1 M BzOH/DCM was used as the proton source, as BzOH is not strong enough to cause demetalation of the porphyrins.11 The amount of acid was stepwise increased by adding 1 equivalent at a time to 20 mL porphyrin solution. Cyclic voltammograms (CVs) were recorded at 1–10 equivalents of acid, and linear sweep voltammograms (LSVs) at 1–22 equivalents of acid. Linear sweep voltammetry was also performed at 1–22 equivalents of acid in porphyrin-free solution to exclude catalytic effects of the glassy carbon electrode, and cyclic voltammetry was conducted before and after each round of catalytic experiments to ensure adsorbed species did not contribute to the catalytic process.3 Computational details
All computations were performed using density functional theory (DFT) on the Tetralith cluster provided by the Swedish National Infrastructure for Computing (SNIC). Gaussview 6.1.1. was used to build the molecules, and their electronic structures were evaluated using the Becke, 3-parameter, Lee–Yang–Parr functional40 with Grimme's empirical dispersion correction41 (B3LYP-D3) as implemented in Gaussian 16. The geometry of each compound was optimized in gas phase using the 6-31++(d,p) basis set42,43 for all elements lighter than and including Ar, and using Stuttgart/Dresden effective core potentials44 on all elements heavier than Ar. Zero-point energies and thermal corrections to reaction free energies were obtained at 298.15 K and 1 atm through frequency calculations. To improve the accuracy of electronic and Gibb's free energies, single point calculations were performed using the 6-311++(d,p)42,45 basis set for elements lighter than and including Ar, and the def2-TZVP46 basis set for elements heavier than Ar. Atomic charges according to Charge Model 5 (CM5),47 as well as Mulliken spin densities, were obtained from the single point calculations. No solvation model was used, as the effects of solvation are expected to more or less cancel when calculating binding energies, meaning that solvation will have negligible effects on the trends presented here.As transition metals can occur in several spin states, each structure except the free base, AlTPP and MgTPP was optimized at its three lowest multiplicities (singlet, triplet and quintet, or doublet, quadruplet and sextet). Reaction free energies and other inferred quantitates were calculated using the multiplicity that resulted in the lowest energy including thermal corrections. Porphyrins that undergo metal reduction before ligand reduction, or metal oxidation before ligand oxidation, were optimized with a total molecular charge of −1 or +1, respectively.
4 Results and discussion
4.1 Electrochemical characterization
The porphyrins studied in this work are shown in Fig. 1. Electrochemical characterizations were obtained for AgTPP, Al(III)TPPCl, CoTPP, Co(III)TPPCl, CuTPP, FeTPP, H2TPP, MgTPP, NiTPP, OTi(IV)TPP and ZnTPP. Catalytic properties were evaluated experimentally for CoTPP, CuTPP, FeTPP, H2TPP, NiTPP and ZnTPP.
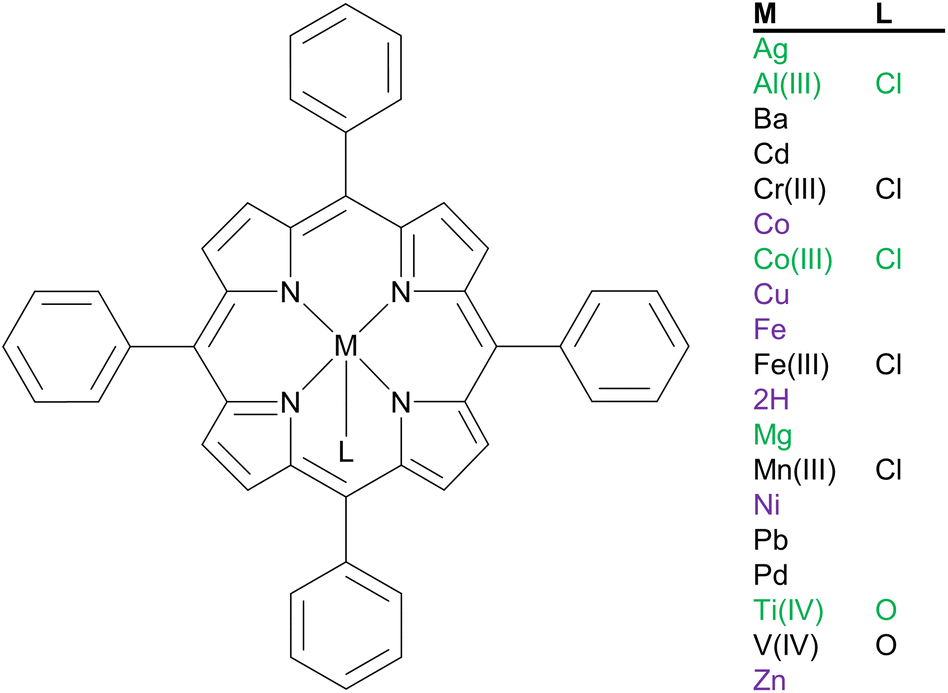 | ||
| Fig. 1 Structures used in this work. For compounds marked in purple, both the electrochemical and catalytic properties were studied experimentally. For compounds marked in green, only the electrochemistry was evaluated. Compounds marked in black have only been studied computationally. | ||
Fig. 2 shows the CVs of H2TPP, FeTPP, CoTPP, NiTPP, CuTPP and ZnTPP. All porphyrins have open circuit potentials around −0.3 V vs. Fc/Fc+ and in relation to this undergo 1–3 oxidations and 1–2 reductions in the solvent and potential window studied here. The redox transitions can occur either at the porphyrin ligand or at the metal center. Ligand-centered transitions will from here on be referred to as Lm/Ln for shifts between total charges m and n, and metal-centered reactions will be referred to as M(p)/M(q) for transitions between metal oxidation state p and metal oxidation state q.
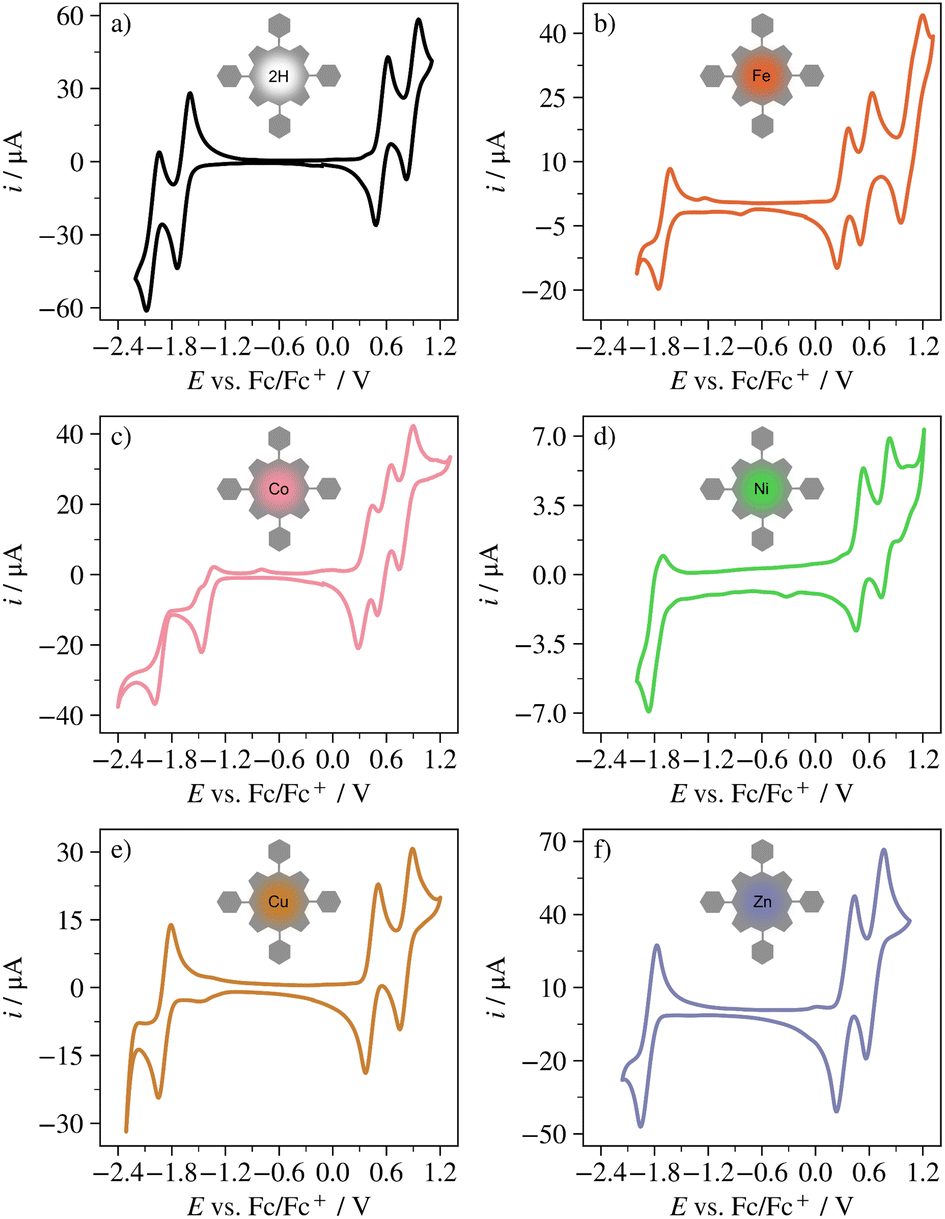 | ||
| Fig. 2 CV of (a) H2TPP, (b) FeTPP, (c) CoTPP, (d) NiTPP, (e) CuTPP, and (f) ZnTPP in 0.1 M TBAPF6/DCM at 0.1 V s−1. | ||
All compounds display the ligand-centered redox transitions L1+/L0 and L2+/L1+. H2TPP, CoTPP, NiTPP and ZnTPP also undergo the L0/L1− transition, whereas FeTPP only shows this transition in square wave voltammetry. For H2TPP the π-radical anion to dianion transition L1−/L2− is visible in the CV, and for CuTPP and FeTPP it is visible in square wave voltammetry (see Fig. S1†). CoTPP and FeTPP also undergo the metal centered transitions M(II)/M(I) and M(III)/M(II). All observed redox reactions are electrochemically quasi-reversible except the L0/L1− transition in CoTPP, which is irreversible. For this porphyrin, reoxidation from L1− to L0 appears to occur in two steps, at a small shoulder at approximately −1.46 V vs. Fc/Fc+ and at the anodic peak at −0.79 V vs. Fc/Fc+. These features are not present when the negative potential cutoff is set positive of the L0/L1− peak (see Fig. S2†).
NiTPP has previously been reported to be able to undergo the Ni(III)/Ni(II) transition,48–50 but this reaction occurs close to or even overlaps the L1+/L0 transition, and in some reports it is not included.51–53 Under the reaction conditions used here (room temperature, 0.1 M TBAPF6/DCM) the first redox conversion of NiTPP at oxidative potentials has been reported to correspond to the ligand-centered reaction L1+/L0.52 This is also true for e.g. ((p-Cl)TPP)Ni52 and Ni(II) meso-(4-fluoro-2,6-dimethylphenyl)porphyrin (NiTFP)11 studied under the same conditions. Given that the potential difference between the first redox transition at reductive potentials and the first transition at oxidative potentials is 2.31 V, in good agreement with both H2TPP (2.2 V), ZnTPP (2.21 V) and CuTPP (2.32 V) for which no metal transitions occur, Ni is here assumed to remain in oxidation state +II. The redox chemistry of H2TPP, FeTPP, CoTPP, NiTPP, CuTPP, and ZnTPP is summarized in Table 1. Further details, as well as the redox chemistry of AgTPP, Al(III)TPPCl, CoTPP in 0.1 TBAPF6/dimethylformamide, Co(III)TPPCl and MgTPP can be found in Fig. S3, S4 and Table S1.†
| Porphyrin | L1−/L2− | L0/L1− | M(II)/M(I) | M(III)/M(II) | L1+/L0 | L2+/L1+ | E +/− |
|---|---|---|---|---|---|---|---|
| H2TPP | −1.99 | −1.64 | 0.56 | 0.90 | 2.20 | ||
| FeTPP | −2.26 | −2.07 | −1.71 | 0.27 | 0.53 | 0.97 | 1.98 |
| CoTPP | −1.91 | −1.39 | 0.34 | 0.55 | 0.79 | 1.73 | |
| NiTPP | −1.82 | 0.49 | 0.78 | 2.31 | |||
| CuTPP | −2.32 | −1.88 | 0.44 | 0.82 | 2.32 | ||
| ZnTPP | −1.85 | 0.36 | 0.66 | 2.21 |
The half-wave potentials of the porphyrin redox transitions (as for many other compounds) vary with conditions such as solvent, electrolyte and temperature. A thorough summary of previously reported half-wave potentials of a large number of tetraphenylporphyrins studied in various solvents can be found in Fig. S5, S6 and Table S2.† Except for the Fe(III)/Fe(II) conversion,48,49,54–57 all half-wave potentials measured in this work occur within the range of previously reported values.48–77 Within the literature, minor disagreement remains regarding assignment of certain redox transitions. For example, the first redox transition at oxidative potentials in Al(III)TPPCl and AgTPP have been reported as both M(III)/M(II) and L1+/L0, and some reports include the M(II)/M(I) transition of AgTPP and Cr(III)TPPCl whereas others do not. These discrepancies have not been further investigated here.
It should be noted that half-wave potentials in the literature are originally often reported against the standard calomel electrode (SCE), or on occasion against Ag/AgCl or the saturated sodium chloride calomel electrode (SSCE). The standard potentials for these reference electrodes vary with conditions, meaning that translation and comparison between them will likely introduce systematic errors. In this work, we have calibrated the SCE vs. the Fc/Fc+ scale by comparing literature half-wave potentials vs. SCE of H2TPP (which are plentiful and in quite close agreement with each other across solvents and studies), with our own measured half-wave potentials of H2TPP vs. Fc/Fc+. The average of the differences in half-wave potentials results in an approximate standard potential  vs. Fc/Fc+, which falls well within the range of SCE standard potentials reported for various organic solvents.78–82 Given that
  vs. SHE,83 that
  vs. SHE84 and that and
  vs. SHE,85 we have also arrived at
  vs. Fc/Fc+, and
  vs. Fc/Fc+. These values should not be taken as universal, but only as a means to compare half-wave potentials on the same scale within this work.
From the CVs in Fig. 2, it is clear that the effect of the metal on the porphyrin redox chemistry in general manifests simply as a collective shift of all redox reactions towards more negative potentials compared to the half-wave potentials of the free base (the exception being FeTPP, for which the L2+/L1+ occurs at slightly more positive potentials than for H2TPP). This means that unless the metal itself is redox active, only its electron withdrawing abilities is affecting the redox chemistry of the ligand. Indeed, it has been showed that for a large number of octaethylporphyrins with metal centers remaining in oxidation state +II, the half-wave potential of the L1+/L0 transition is proportional to the electronegativity of the metal center.86 This holds true here as well, as shown in Fig. 3. It is also interesting to note that the difference in half-wave potentials between H2TPP and MTPP is larger for the L0/L1− transition than for the L1+/L0 transition. This indicates that the HOMO is more strongly affected by the presence of the metal than the LUMO.
 | ||
| Fig. 3 Half-wave potential of the L1+/L0 transition as a function of metal (or hydrogen) electronegativity. Ti(IV), O and V(IV), O correspond to OTi(IV)TPP and OV(IV)TPP, respectively. Filled markers indicate values obtained experimentally in this study, open markers indicate values obtained from literature and the bars represent all literature values obtained in solvents other than DCM. Faded colors show which metals are not in the +II oxidation state. | ||
4.2 Computational study
The catalytic cycle of the HER in porphyrins can be described as an overall four-step process involving two chemical protonations (P) and two reductive electron transfers (E). There are several possible reaction pathways, such as EEPP, EPEP, EPPE, PEEP, PEPE, and PPEE (outlined in Scheme S1†). Which one is favored may depend on e.g. the proton source,14,87,88 the ligand structure and the metal center.88 However, the EEPP13,87 and EPEP10,11,89 pathways dominate among previously reported mechanisms for porphyrins or porphyrin-like structures. As will be discussed in Section 5, these pathways are likely to be the applicable in this study as well. During catalysis of the HER by tetraphenylporphyrins, a key intermediate should therefore be H-MTPP with an overall charge of −1 (EEPP) or 0 (EPEP). Thus, the binding energy of H (ΔεH) can possibly be used as a descriptor of catalytic activity and as the foundation of a volcano plot for a series of MTPP catalysts.The binding energy of H relative a free MTPP porphyrin is given by
| ΔεH = εH–MTPP − εMTPP − ½εH2 | (1) |
The appropriateness of the level of theory of the computational study was confirmed by plotting the half-wave potential of the first redox transition at oxidative potentials against the calculated difference in free energy between MTPP0 and MTPP+, ΔG+/0. As can be seen in Fig. 4, the relationship is more or less linear (the linear fit was produced using the experimental half-wave potentials measured in this work). AlTPP, CoTPP, CrTPP, MnTPP and literature half-wave potentials of FeTPP do not fit in the trend (see Fig. S15†), possibly because the first oxidation occurs on the metal rather than on the ligand, and because this transition is associated with coordination of a Cl ion that is not represented here. AgTPP also undergoes metal oxidation, but is not associated with any axial ligands and fits into the trend. All electronic energies, zero-point energies, thermal corrections and the multiplicities used here can be found in Table S6,† and the coordinates of all optimized compounds are available in Appendix 1 of the ESI.†
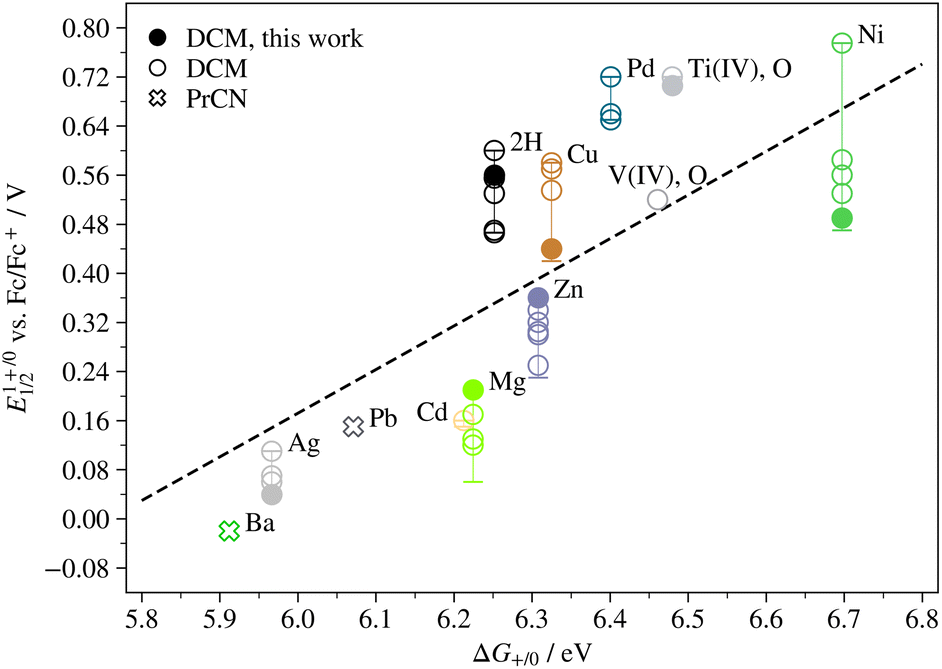 | ||
| Fig. 4 Half-wave potential of the first redox transition at oxidative potentials (M(III)/M(II) for AgTPP, L1+/L0 for all other compounds shown here) as a function of the difference in free energy between MTPP0 and MTPP+. Ti(IV), O corresponds to OTi(IV)TPP. Filled markers indicate values obtained experimentally in this study, open markers indicate values obtained from literature and the bars represent all literature values obtained in solvents other than DCM. | ||
As shown in Scheme 1, the four steps of the HER are associated with the changes in free energy ΔG1, ΔG2, ΔG3 and ΔG4, respectively (note that metal- and ligand centered reductions are not distinguished):
As discussed above, the electron withdrawing ability of the metal center, i.e. the charge density ratio between the metal and the ligand, determines the ease of ligand reduction. It should also affect the ease of protonation, as protons will be more likely to adsorb onto a charge-depleted metal center. If linear free energy relations apply, the free energy change to produce the adsorbed state, ΔGH, should be proportional to ΔG1 = −nFE0/−, where E0/− is the formal potential (here assumed to be equal to the half-wave potential) of the first porphyrin reduction involved in the catalytic cycle. The free energy change of the adsorbed state is given by
| ΔGH = ΔεH + ΔεZPE − TΔS | (2) |
 | ||
| Scheme 1 The EEPP and EPEP reaction pathways for MTPP. Charges in this scheme are total for the entire complex, and reductions may occur either on the metal or on the ligand. | ||
Eqn (2) indicates that if ΔGH is linearly related to ΔG1 and thereby to ΔE0/−, so is ΔεH. Indeed, for metals that are expected to remain in oxidation state +II, the binding energy is linearly related to the half-wave potential of the first ligand reduction (the linear fit was produced using the experimental half-wave potentials measured in this work). This is shown in Fig. 5a. As can be seen in Fig. 5b, there is also a linear trend between ΔεH and the half-wave potential of the first ligand oxidation. These results imply that the electron withdrawing ability of the central ion is the only determining parameter of the binding energy of H. They also imply that the binding energy of H agrees with the thermodynamics of the porphyrin redox reactions. This means that if the premise of the Sabatier principle holds true for porphyrins, i.e. that if their thermodynamic profiles are sufficient to predict their catalytic quality, the ΔεH should serve as a descriptor of catalytic activity for porphyrins just like it does for metal surface catalysts.
 | ||
| Fig. 5 Binding energy of H as a function of (a) the half-wave potential of the L0/L1− transition and (b) the L1+/L0 transition. Filled markers indicate values obtained experimentally in this study, open markers indicate values obtained from literature and the bars represent all literature values obtained in solvents other than DCM. Faded colors show which metals are not in the +II oxidation state. The M(II)/M(I) transition for AgTPP, CoTPP and FeTPP, and the M(III)/M(II) transition for AgTPP, CoTPP, FeTPP, and NiTPP (the latter not seen in all studies), are included for reference. The binding energy for Ag(II)TPP is plotted against both the half-wave potential of what is here assumed to be the Ag(II)/Ag(I) transition, and against what has been previously been reported as the L0/L1− transition.62 Similarly, the binding energy for Ni(II)TPP is plotted against both the half-wave potential of what is here assumed to be the L1+/L0 transition, and against what has elsewhere been reported as the Ni(III)/Ni(II) transition.48–50 | ||
It should be pointed out that the binding energies in this work do not represent a single step in the free energy landscape (as they are assumed to do for catalysis of the HER on metal surfaces), but rather as a sum of two or more steps. In addition, binding energies in experimental settings depend on local reaction conditions such as electrode surface charge,15 and the free energy landscape at realistic operating conditions may not be flat.31–37,90 The binding energies given here should therefore not be considered quantitative. Nonetheless, a few detailed features should be mentioned: firstly, CoTPP, which undergoes the Co(II)/Co(I) transition before the L0/L1− transition, does not fit into the trend in Fig. 5a. Interestingly, the half-wave potential of the Fe(II)/Fe(I) transition does. As will be discussed in Section 5, the Fe(II)/Fe(I) transition partakes in catalysis of the HER, whereas the Co(II)/Co(I) transition does not. Secondly, the binding energies calculated here are all larger than 0, meaning that all compounds are expected to display weak binding towards H under ideal thermodynamic conditions. Lastly, the free base porphyrin fits into the trends for both reduction and oxidation. This strengthens the argument that the binding energy is in fact independent of the identity of the central metal ion. Rather, it is determined exclusively by the electron density on the ligand.
4.3 Catalysis
The catalytic ability towards the HER was evaluated experimentally for H2TPP, FeTPP, CoTPP, NiTPP, CuTPP and ZnTPP. Fig. 6 shows the CVs of these porphyrins in 0.1 M TBAPF6/DCM containing 0–10 equivalents of BzOH. All compounds show an increase in cathodic current paralleled by a decrease in reversibility of porphyrin redox chemistry with increasing acid concentration, both indications of catalytic activity towards the HER. The response of CuTPP strongly resembles that of Cu(II) meso-(4-fluoro-2,6-dimethylphenyl)porphyrin (CuTFP), which was proven efficient for catalysis of the HER under the same reaction conditions.11 For FeTPP, adding BzOH to the solution results in a new quasireversible reaction at approximately −0.8 V vs. Fc/Fc+.‡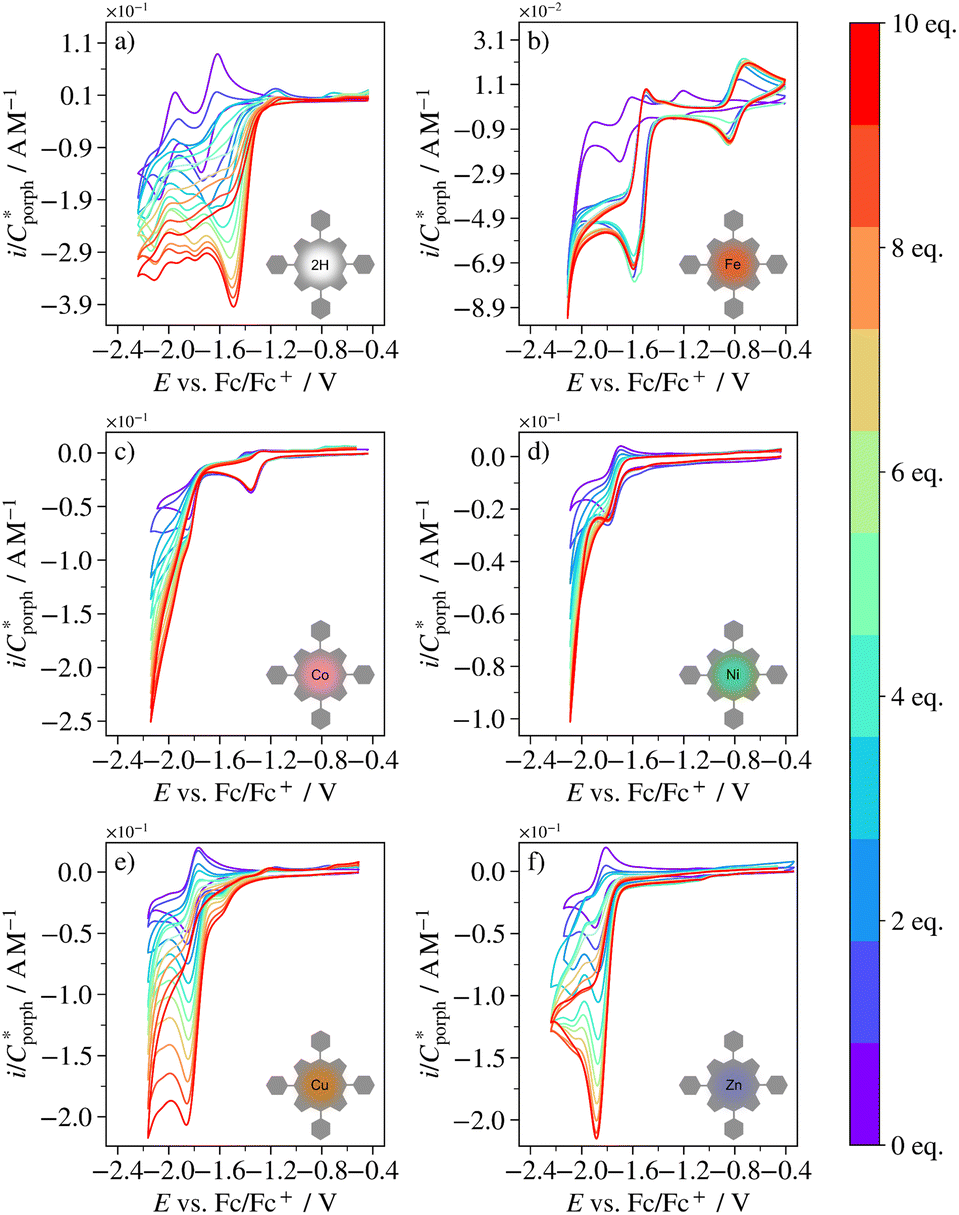 | ||
| Fig. 6 CVs at 0.1 V s−1 of (a) H2TPP, (b) FeTPP, (c) CoTPP, (d) NiTPP, (e) CuTPP and (f) ZnTPP in 0.1 M TBAPF6/DCM containing 0–10 equivalents of BzOH (indicated by colorbar). | ||
At 10 equivalents of BzOH, the catalytic waves of CoTPP and NiTPP approach the S-shape associated with scan rate independent, pure kinetic control of the catalytic reaction.11,91–94 For H2TPP, FeTPP, NiTPP and ZnTPP, the catalytic wave is peak shaped, indicative of mass-transport limitations,11,91–94 or more rarely catalyst deactivation or blocking of the electrode surface.95 Because the catalytic current never decreases with acid concentration for any of the porphyrins (see ref. 93), catalyst deactivation seems unlikely. Some electrode fouling was observed for CuTPP (see Fig. S16†), but as the adsorbed species did not give rise to any reduction waves and produced current magnitudes much smaller than those of the catalytic reaction, inhibition of the catalytic mechanism through blocking of the electrode surface was deemed negligible for all porphyrins.
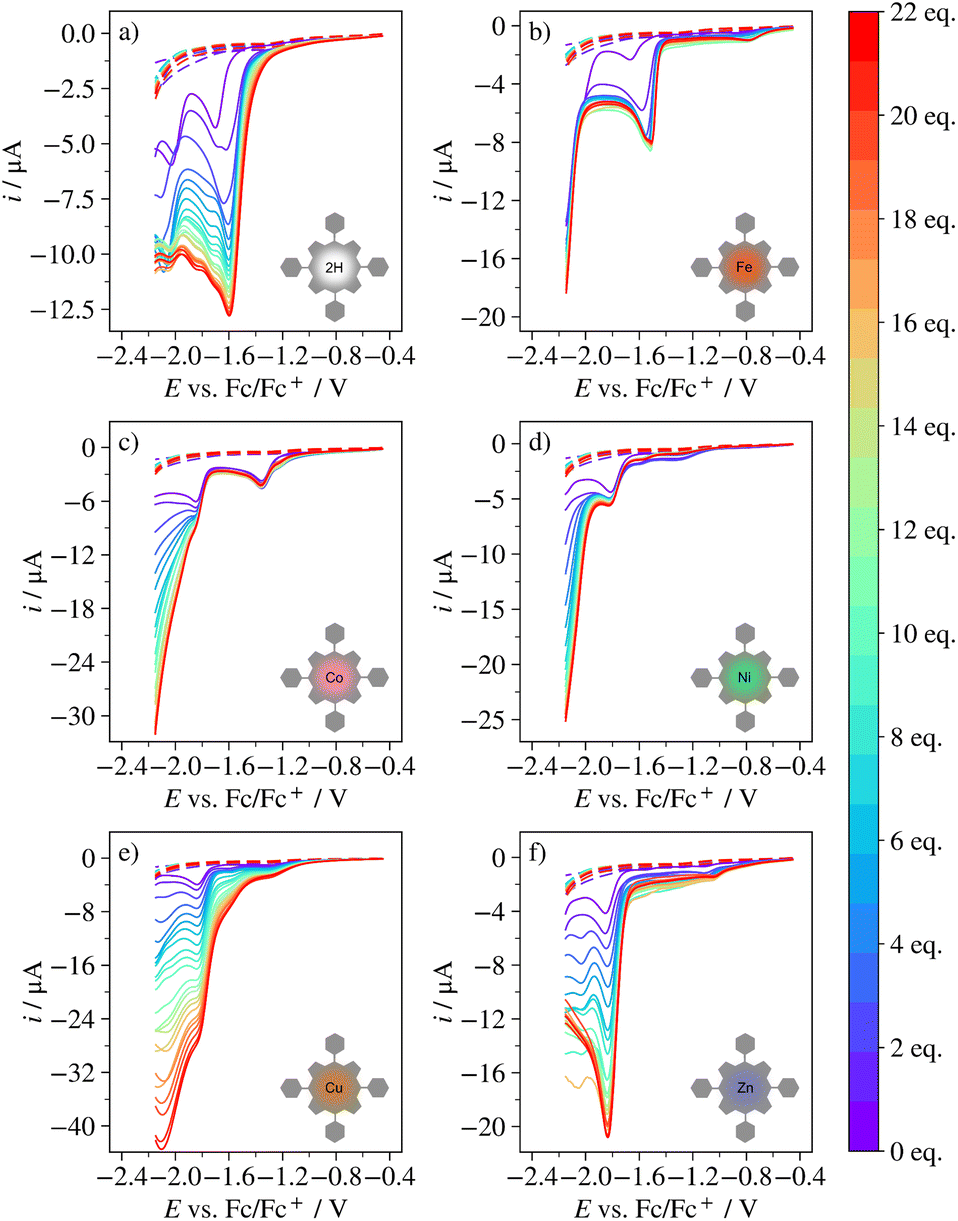 | ||
| Fig. 7 LSV at 0.1 V s−1 of (a) H2TPP, (b) FeTPP, (c) CoTPP, (d) NiTPP, (e) CuTPP and (f) ZnTPP in 0.1 M TBAPF6/DCM containing 0–22 equivalents of BzOH (indicated by colorbar). | ||
FeTPP behaves similarly to H2TPP between 1 and 5 equivalents of acid, in that the catalytic wave occurs in connection to the first reduction wave of the porphyrin (here the Fe(II)/Fe(I) transition) and in that the cathodic peak potential of this wave shifts towards less negative potentials. Like for H2TPP, the first two steps of the catalytic mechanism for FeTPP are thus likely to involve one reduction and one protonation, where the intermediate is stable. However, above 5 equivalents, a current plateau occurs where the reaction is independent of both acid concentration and potential until the potential is sufficiently negative that a second reductive wave occurs (likely part of the L0/L1− transition, given that this occurs approximately 0.4 V below the Fe(II)/Fe(I) transition). The behavior of FeTPP indicates that at more than 5 equivalents of acid, all catalytic units at the electrode surfaces are occupied by a bound proton and the catalytic mechanism cannot continue until a second reduction occurs and/or the driving force is increased dramatically. In fact, it has been shown before that the hydrogen evolution mechanism may change from EPEP to EEPP during a cathodic potential sweep for certain Ni-based catalytic complexes.96,97 It should be noted that the catalytic current response observed for FeTPP here is different from that observed for Fe(III)TPPCl in 0.1 M tetraethylammonium perchlorate/dimethylformamide in the presence of triethylamine hydrochlorate.12
For CoTPP, no catalysis occurs at the first reduction wave of the porphyrin, corresponding to the Co(II)/Co(I) transition. Rather, the catalytic wave begins only at the L0/L1− transition, where it approaches the characteristic S-shape at 4 equivalents of acid. No potential shift is observed, but the catalytic wave is convoluted by what may be the L2−/L1− transition. The half-wave potential of this transition has not been reported, but the background current generated by glassy carbon is negligible in the relevant potential region. Given that the metal peak is not involved in catalysis and that the ligand peak is unaffected in terms of potential, the first step of the catalytic mechanism may be reduction of the ligand, or protonation yielding a short-lived intermediate. CoTPP has previously been reported to catalyze the HER through the EEPP mechanism by undergoing the Co(II)/Co(I) transition followed by the Co(I)/Co(0) transition.13
The LSVs of NiTPP are similar to those of both FeTPP and CoTPP. There is a slight increase in the cathodic current at the L0/L1− transition, but at 3 equivalents of acid, a short current plateau appears. Like for FeTPP, this may indicate that the first two steps of catalysis involve one reduction and one protonation, producing an intermediate complex that is stable enough to impede catalysis until the driving force has been further increased. However, no potential shift is seen for NiTPP, suggesting the intermediate is slightly less stabilized by protonation for NiTPP than for FeTPP. This is corroborated by the fact that the second part of the catalytic wave occurs at less negative potentials for NiTPP than for FeTPP, and by the computational result indicating that the binding energy of H is stronger for FeTPP than for NiTPP.
For CuTPP and ZnTPP, the catalytic wave occurs at the L0/L1− transition, without peak shift and current plateau. This indicates that the first steps of the mechanism involve one reduction and possibly a protonation leading to a short-lived intermediate. At 11 equivalents, the current response of CuTPP approaches the canonical S-shape. For ZnTPP, the current response remains peak-shaped throughout all acid concentrations, but stops increasing in magnitude at 17 equivalents. Thus, the ZnTPP mechanism eventually “saturates” similarly to that of FeTPP and NiTPP. These observations suggest that the intermediate is slightly more stable for ZnTPP than for CuTPP, which agrees with their relative ΔεH.
From the CVs and LSVs, it is clear that the catalytic electrochemistry is different for all porphyrins. H2TPP and FeTPP produce substantial potential shifts, FeTPP and NiTPP display current plateaus after a certain amount of acid has been added, and the metal reduction of FeTPP is involved in catalysis but the one of CoTPP is not. CuTPP and ZnTPP show no potential shifts or sluggish initial steps of the catalytic mechanism, but as opposed to the one of CuTPP, the mechanism of ZnTPP is limited by mass-transport. The behaviors of the porphyrins can be linked to their binding energies, but only to the extent that the binding energies agree somewhat with the apparent sluggishness of the initial steps of the catalytic reaction and/or the stability of intermediates formed during these steps. The binding energy cannot fully explain the differences in catalytic mechanisms between the porphyrins. For example, both H2TPP and FeTPP display large potential shifts and have stronger binding than e.g. CuTPP and ZnTPP, but only FeTPP reaches “saturation”. Furthermore, CoTPP, FeTPP, and NiTPP all have stronger binding than CuTPP and ZnTPP and all require two reductions to be catalytic at most acid concentrations. However, ΔεH does not relate to the length of the current plateau, the number of acid equivalents needed to reach the plateau, or the potential at which the second reduction wave occurs.
The porphyrins behave similarly in that the first two steps of the catalytic mechanism seem to involve at least one reduction. Fig. 8 shows the UV/vis absorption spectra of all porphyrins in the presence of 0 and 22 equivalents of BzOH. The Soret and Q band peaks of the two spectra overlap exactly for all porphyrins, and the spectra with acid present are simply an overlay of the respective porphyrin spectrum and the acid spectrum (the spectrum of the same amount of acid without any porphyrin present is shown in Fig. S17†). These results show that no protonation occurs when no potential is applied, which together with the above observations suggests that reduction is the first step of the catalytic mechanism for all porphyrins. This is in agreement with previous studies on similar systems.10,11,13,87,89 However, it should be noted that protonation may still occur at potentials less negative than the half-wave potential of any porphyrin reduction, but more negative than the open circuit potential at which the porphyrin is in its L0 state.
 | ||
| Fig. 8 UV/vis absorption spectra of each porphyrin in the presence of 0 (full line) and 22 (dashed line) equivalents of BzOH. All spectra were recorded in DCM and normalized by the maximum absorption Absmax. | ||
A first qualitative evaluation of the reaction rates and limitations can be achieved by studying how the current varies with the concentration of acid at different potentials. The two protonations will be dependent on the concentration of protons (here equaled to the concentration of acid, as BzOH is not expected to dissociate in DCM) but not on the potential, and the opposite will be true for the two reductions. If the current is dependent on the acid concentration at a given potential, protonation and reduction proceed at similar rates; if the current is independent of the acid concentration, the electrochemistry and release of the product must be limiting as increasing the concentration of protons does not increase the turnover frequency. Thus, plotting the current as a function of acid concentrations at different overpotentials should show which redox event is triggering for the catalytic cycle and to what extent this redox event is limiting on the reaction rate.
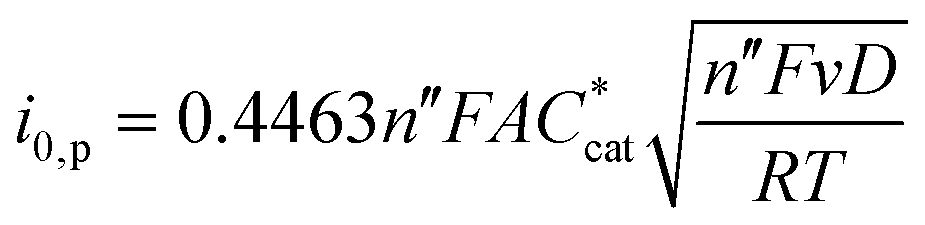
In heterogeneous catalysis, the current density at a given overpotential is a common measure of catalytic activity.91 However, in molecular catalysis, the concept of overpotential is not straightforward. The overpotential describes the additional potential required to drive a reaction at a certain rate compared to the standard potential of the reaction,91,98 but a molecular catalytic cycle is usually nonexistent until triggered by e.g. a redox event, after which the rate of the reaction is determined by a series of possibly both potential-independent chemical steps and potential-dependent electrochemical events.91 In addition, to determine the true overpotential, the standard potential of the reaction to be catalyzed (here the HER) must be known under the relevant reaction conditions. The standard potential and pKa of the HER in DCM using BzOH as a proton source have not yet been well defined. These values could be determined through e.g. open circuit potential measurements,99 but an accurate description of the behavior of BzOH in DCM is outside the scope of this study. For these reasons, we instead of true overpotentials and the standard potential of the HER, use a range of reference potentials, Eref, to represent different driving forces of the HER.
Fig. 9shows how the current generated by the catalytic reaction (estimated by subtracting the current response of the porphyrin without any acid present, i0, from all other currents) as a function of acid concentration at several Eref. At small Eref magtitudes, the currents are small and vary noisily over the acid concentrations. At Eref = −1.6 V vs. Fc/Fc+, H2TPP and FeTPP are most active. This is expected, considering that this reference potential is close to the half-wave potentials of the first reduction – the triggering event for catalysis – of these porphyrins. No activity is seen for CoTPP at this potential, which in agreement with the LSVs suggests that the reduction from Co(II) to Co(I) is not enough, or does not occur at negative enough potentials, to initiate the catalytic cycle. The activity of CuTPP, NiTPP and ZnTPP at Eref = −1.6 V vs. Fc/Fc+ is also negligible. This is also expected, as the first reduction wave of these porphyrins all occur below −1.8 V vs. Fc/Fc+, and as discussed above, a single reduction of NiTPP is not enough to drive the catalytic reaction at high acid concentrations. At Eref = −1.9 V vs. Fc/Fc+, the activity of CuTPP, CoTPP, NiTPP and ZnTPP increases, with the current being consistency highest for CuTPP. For H2TPP and FeTPP, the catalytic current reaches a plateau, or semi-plateau, at all reference potentials. This means that the catalytic cycle becomes independent of the acid concentration, suggesting that the catalytic turnover is too slow to accommodate more than a few equivalents of protons. From −2 V vs. Fc/Fc+, the current for all porphyrins except CuTPP reaches a plateau. This indicates that the catalytic turnover for CuTPP is faster than for the other porphyrins, such that regardless of acid concentration, there is no “saturation” or delay in conversion.
 | ||
| Fig. 9 Current responses as an estimate of reaction rates at different potentials, extracted from the results in Fig. 7. | ||
From these rates and their variation with the acid concentration, reaction orders in [BzOH] can be obtained. As shown in Fig. S18–S23,† the rate of the catalytic reaction for all porphyrins is linearly dependent on [BzOH] when [BzOH] is small, suggesting that the catalytic reaction is first order in acid concentration. At larger acid concentrations, all porphyrins approach zeroth order in acid concentration except CuTPP. It should be noted that the breaking point between first and zeroth order is not well defined for CoTPP, and to some extent NiTPP (see Fig. S20 and S21†). Rather, there is a breaking “arc” between the two regions. This suggests that the reaction cannot be accurately described by a steady-state approximation for these compounds.
As shown in Fig. S25,† the catalytic reaction is also first order in porphyrin concentration, indicating that the catalytic reaction is monomolecular. This means that approximate, global rate constants, kobs, can be obtained from:
 | (3) |
The potential dependence of the catalytic current and the rate of the catalytic reaction can also be estimated by applying the Butler–Volmer equation, which governs the current at the electrode surface for an n electron process:100
 | (4) |
Assuming that the back reaction is negligible, which should be true at high driving forces, the equation simplifies to the first term – the Tafel equation – and a rate can be obtained from a linear region of the logarithm of the current. Again, the current response of the porphyrin without any acid present can be subtracted to clarify the catalytic current response:
 | (5) |
 | (6) |
 is the bulk concentration of the catalyst, D is the diffusion coefficient and kobs is the observed global rate constant of the rate limiting step or a convolution of elementary steps94,101 (note that this rate constant will still vary with acid concentration). For an EEPP or EPEP process where both electron transfers occur at the electrode surface,
  , where
  is the bulk concentration of substrate and k1 is the rate constant associated with the first chemical step after the initial reduction(s). If this step is rate-limiting, k1 can be taken as the rate constant of the catalytic reaction, kcat.
The plateau current can be normalized by the peak current of a non-catalytic reaction, which is given by the Randles–Sevcik equation:91,92,101
 | (7) |
 | (8) |
Eqn (8) and the analysis that lead to it apply when the catalytic wave is S-shaped, i.e. when the plateau current is independent of the scan rate and substrate diffusion. As this is not the case for all porphyrins studied here, this method can at best produce qualitative results, in which ipl is approximated as the catalytic peak current.
Fig. 10(top) shows kobs as a function of [BzOH] for all porphyrins. These results reflect the observation that for FeTPP and NiTPP a single reduction is only sufficient to convert a small amount of substrate. CuTPP again appears to be able to convert the largest amount, followed by ZnTPP. For H2TPP, only a small increase in rate is observed for [BzOH] > 1 mM. The rate constants obtained through current plateau analysis agree with the calculated binding energies of H for H2TPP, FeTPP, ZnTPP and CuTPP; H2TPP has the strongest binding and is the slowest of these four porphyrins, and CuTPP shows the weakest binding and the fastest conversion. However, NiTPP and CoTPP do not fit into the trend and the correlation cannot be considered deterministic (see Fig. 10, bottom).
 | ||
| Fig. 10 Top: kobs obtained from plateau current analysis of the results in Fig. 7. Bottom: kobs obtained from current plateau analysis of the results in Fig. 7vs. the binding energy of H. The colorbar indicates [BzOH]. | ||
Like in the previous sections, kobs obtained through current plateau analysis was used to calculate the reaction order in terms of [BzOH]. These results are shown in Fig. S38–S40.† Here, the catalytic reaction appears to be second order in [BzOH] for CuTPP, at low concentrations for ZnTPP, and possibly at low concentrations of H2TPP. However, in this analysis, the catalytic response was divided rather than subtracted by i0. At low concentrations of acid, the pure porphyrin response still constitutes a notable portion of the current response (visible especially for ZnTPP and CuTPP, where the cathodic current increases but does not change shape compared to i0 at low acid concentrations). This means that both the catalyst concentration at the electrode surface and the acid concentration influence kobs. Given that the catalyst concentration at the electrode surface is likely not equal to the bulk concentration of porphyrin, as there is evidence of substrate consumption at low concentrations of acid, the result may be an apparent second order reaction with respect to [BzOH].
The rate constants obtained from current plateau analysis can be used to produce a so-called catalytic Tafel plot, where the turnover frequency (TOF) of the catalytic reaction is plotted as a function of the overpotential.94 For a Nernstian process, the TOF is given by91,94
 | (9) |
 | ||
| Fig. 11 Catalytic Tafel plots obtained through current plateau analysis of the results in Fig. 7. | ||
 | (10) |
A so called FOWA plot is obtained by plotting i/i0,pvs. the denominator of eqn (10). The rate constant can then be calculated from the slope of the linear section of this plot, which should occur close to the origin. This section corresponds to an idealization of the current response, and the resulting rate constant represents the rate of the reaction had the current response been ideal.
For a non-ideal catalytic response, the determination of Ecat/2 is not straightforward. Because the plateau current is not reached, it is not possible to exactly identify the potential of ipl/2. However, in the ideal case, this potential should occur at or close to the inflection point of the catalytic wave.98 As noted above, it can also be approximated as the formal potential of the catalyst couple. For the porphyrins discussed here, both Ecat/2 and the potential range of the foot of the wave are difficult to define. For example, for H2TPP and FeTPP, the potential of the catalytic peak changes with concentration of the acid, and CoTPP has a reduction peak that is catalytically inactive before the actual catalytic peak. For this reason, we have performed the analysis using several different approximations of Ecat/2 and extensions of the linear range in the FOWA plot. Details are available in the ESI, Section 3.7.1.† No relevant comparison between the porphyrins could be made using any of the approximations, and no trends could be seen between kobs obtained from FOWA and ΔεH. This is in line with all above discussions, which show that quantitative kinetic information and an experimentally relevant volcano plot are difficult to obtain, especially when the exact reaction mechanism is unknown.
In fact, none of the kinetic information obtained here is useful for anything else than a qualitative comparison between the porphyrins. The electrochemistry and thermodynamics of the compounds can be explained and follow simple trends, such as the dependence of the ligand redox chemistry and ΔεH on the electronegativity of the metal center, and the thermodynamic linear scaling relation between steps in the catalytic cycle. However, as soon as kinetics are factored into the catalytic quality, the simple relations break down and there is no clear predictive power to the thermodynamic properties of the systems. An appropriate descriptor of catalytic efficiency likely must include effects of diffusion, the electronic double layer and/or interactions between the catalysts and the electrode surface. This work shows that tuning of catalytic properties through predictive models such as volcano plots and thermodynamic linear scaling relations cannot be applied without deep experimental knowledge of the systems.
5 Conclusion
We have reinvestigated the redox chemistry of a large number of tetraphenylporphyrins and found that reported values of half-wave potentials vary between different studies and experimental conditions. Nonetheless, we have seen that the redox chemistry of the porphyrins studied experimentally in this work fall within the range of previously reported behaviors, and that the half-wave potentials of ligand redox conversions are determined only by the electronegativity of the central metal ion.We have also constructed a computational model to evaluate the applicability of Sabatier's principle and the volcano plot concept to experimental molecular catalysis of the HER. We have found that the binding energy of H correlates to the redox chemistry of the porphyrins, in that higher electronegativity of the central metal ion leads to stronger binding. This means that only the electron density of the ligand determines the longevity of what should be a key intermediate of the catalytic reaction, and that the first steps of the reaction are correlated by a linear scaling relation. However, under catalytic conditions the porphyrins studied here all behave differently and the catalytic mechanism cannot be clearly related to the redox chemistry of the porphyrins. Consequently, thermodynamics are not enough to accurately predict which molecular catalyst in a series will be most efficient and the binding energy of hydrogen is not a sufficient descriptor of experimental molecular catalysis.
The varying behaviors of the porphyrins under catalytic conditions also impedes proper comparison of kinetic parameters describing their catalytic cycles. All methods commonly applied to evaluate kinetic parameters of molecular catalysts, such as current plateau analysis or FOWA, require a high degree of ideality in the current responses and knowledge of the catalytic mechanism to be quantitatively accurate. For the series of porphyrins studied here, none of these methods could be used for more than a qualitative comparison of catalytic behavior. In summary, molecular design – often used as a selling point for molecular catalysis – is not straightforward. Construction of molecular volcano plots that are relevant to experimental operating conditions, prediction of catalytic properties and mechanisms, and fair comparison within a molecular series therefore remain strenuous tasks. Until reliable models have been developed, computational catalysis should focus on reaction mechanisms rather than thermodynamic data and scaling relations.
Author contributions
Felicia Zaar: methodology, formal analysis, investigation, writing – original draft, visualization. Moyses Araujo: conceptualization, methodology, writing – review & editing. Rikard Emanuelsson: conceptualization, writing – review & editing, supervision. Maria Strømme: resources, writing – review & editing, funding acquisition. Martin Sjödin: conceptualization, methodology, resources, writing – review & editing, supervision, project administration, funding acquisition.Conflicts of interest
There are no conflicts to declare.Acknowledgements
This study was funded by Formas – a Swedish Research Council for Sustainable Development (grant number: 2019-01285), the Åforsk foundation (19-352), the CMA Swedish Research Council (2020-05233), the Swedish Energy Agency (45420-1) and STandUP for Energy collaboration. The computational work was enabled by resources provided by the Swedish National Infrastructure for Computing (SNIC), partially funded by the Swedish Research Council through grant agreement no. 2018-05973.References
- M. Li, K. Duanmu, C. Wan, T. Cheng, L. Zhang, S. Dai, W. Chen, Z. Zhao, P. Li, H. Fei, Y. Zhu, R. Yu, J. Luo, K. Zang, Z. Lin, M. Ding, J. Huang, H. Sun, J. Guo, X. Pan, W. Goddard, P. Sautet, Y. Huang and X. Duan, Nat. Catal., 2019, 2, 495–503 CrossRef CAS.
- K. Li, Y. Li, Y. Wang, J. Ge, C. Liu and W. Xing, Energy Environ. Sci., 2018, 11, 1232–1239 RSC.
- A. Chen and C. Ostrom, Chem. Rev., 2015, 115, 11999–12044 CrossRef CAS PubMed.
- M. Kondo, H. Tatewaki and S. Masaoka, Chem. Soc. Rev., 2021, 50, 6790–6831 RSC.
- A. Corma and H. Garcia, Top. Catal., 2008, 48, 8–31 CrossRef CAS.
- J. Pelletier and J. Basset, Acc. Chem. Res., 2016, 49, 664–677 CrossRef CAS PubMed.
- S. Fukuzumi, T. Kobayashi and T. Suenobu, Angew. Chem., Int. Ed., 2011, 50, 728–731 CrossRef CAS PubMed.
- G. Bergamini and M. Natali, Dalton Trans., 2019, 48, 14653–14661 RSC.
- H. Lei, Y. Wang, Q. Zhang and R. Cao, J. Porphyrins Phthalocyanines, 2020, 24, 1361–1371 CrossRef CAS.
- Y. Wu, N. Rodríguez-López and D. Villagrán, in Chem. Sci., Royal Society of Chemistry, 2018, vol. 9, pp. 4689–4695 Search PubMed.
- P. Chou, L. Kim, S. Marzouk, R. Sun, A. Hartnett, D. Dogutan, S. Zheng and D. Nocera, ACS Omega, 2022, 7, 8988–8994 CrossRef CAS PubMed.
- I. Bhugun, D. Lexa and J.-M. Savéant, J. Am. Chem. Soc., 1996, 118, 3982–3983 CrossRef CAS.
- B. Beyene, S. Mane and C. Hung, J. Electrochem. Soc., 2018, 165, H481–H487 CrossRef CAS.
- B. Solis, A. Maher, D. Dogutan, D. Nocera and S. Hammes-Schiffer, Proc. Natl. Acad. Sci. U. S. A., 2016, 113, 485–492 CrossRef CAS PubMed.
- H. Ooka, J. Huang and K. Exner, Front. Energy Res., 2021, 9 Search PubMed.
- S. Trasatti, J. Electroanal. Chem., 1972, 39, 163–184 CrossRef CAS.
- J. Nørskov, T. Bligaard, A. Logadottir, J. Kitchin, J. Chen, S. Pandelov and U. Stimming, J. Electrochem. Soc., 2005, 152, J23–J26 CrossRef.
- J. Greeley, J. Nørskov, L. Kibler, A. El-Aziz and D. Kolb, ChemPhysChem, 2006, 7, 1032–1035 CrossRef CAS PubMed.
- J. Nørskov, J. Rossmeisl, A. Logadottir, L. Lindqvist, J. Kitchin, T. Bligaard and H. Jónsson, J. Phys. Chem. B, 2004, 108, 17886–17892 CrossRef.
- V. Viswanathan, H. Hansen, J. Rossmeisl and J. Nørskov, ACS Catal., 2012, 2, 1654–1660 CrossRef CAS.
- J. Rossmeisl, A. Logadottir and J. Nørskov, Chem. Phys., 2005, 319, 178–184 CrossRef CAS.
- I. Man, H. Y. Su, F. Calle-Vallejo, H. Hansen, J. Martínez, N. Inoglu, J. Kitchin, T. Jaramillo, J. Nørskov and J. Rossmeisl, ChemCatChem, 2011, 3, 1159–1165 CrossRef CAS.
- A. Laursen, A. Varela, F. Dionigi, H. Fanchiu, C. Miller, O. Trinhammer, J. Rossmeisl and S. Dahl, J. Chem. Educ., 2012, 89, 1595–1599 CrossRef CAS.
- G. Jones, T. Bligaard, F. Abild-Pedersen and J. Nørskov, J. Phys.: Condens. Matter, 2008, 20, 064239 CrossRef CAS PubMed.
- C. Costentin and J.-M. Savéant, J. Am. Chem. Soc., 2018, 140, 16669–16675 CrossRef CAS PubMed.
- M. Pegis, C. Wise, B. Koronkiewicz and J. Mayer, J. Am. Chem. Soc., 2017, 139, 11000–11003 CrossRef CAS PubMed.
- D. Martin, B. Mercado and J. Mayer, Sci. Adv., 2020, 6, 3318–3331 CrossRef PubMed.
- M. Wodrich, B. Sawatlon, M. Busch and C. Corminboeuf, ChemCatChem, 2018, 10, 1586–1591 CrossRef CAS.
- M. Wodrich, A. Fabrizio, B. Meyer and C. Corminboeuf, Chem. Sci., 2020, 11, 12070–12080 RSC.
- J. Kari, J. Olsen, K. Jensen, S. Badino, K. Krogh, K. Borch and P. Westh, ACS Catal., 2018, 8, 11966–11972 CrossRef CAS.
- K. Exner, ChemCatChem, 2019, 11, 3234–3241 CrossRef CAS.
- K. Exner, ACS Catal., 2019, 9, 5320–5329 CrossRef CAS.
- K. Exner, Curr. Opin. Electrochem., 2021, 26, 100673 CrossRef CAS.
- K. Exner, Int. J. Hydrogen Energy, 2020, 45, 27221–27229 CrossRef CAS.
- K. Exner, ChemElectroChem, 2020, 7, 1448–1455 CrossRef CAS.
- K. Exner, J. Phys. Chem. C, 2019, 123, 16921–16928 CrossRef CAS.
- K. Exner, Angew. Chem., Int. Ed., 2020, 59, 10236–10240 CrossRef CAS PubMed.
- Y. Zhou, J. L. Silva, J. Woods, J. Pondick, Q. Feng, Z. Liang, W. Liu, L. Lin, B. Deng, B. Brena, F. Xia, H. Peng, Z. Liu, H. Wang, C. M. Araujo and J. Cha, Adv. Mater., 2018, 30, 1706076 CrossRef PubMed.
- S. Olsson, C. Dahlstrand and A. Gogoll, Dalton Trans., 2018, 47, 11572–11585 RSC.
- A. Becke, J. Chem. Phys., 1993, 98, 5648–5652 CrossRef CAS.
- S. Grimme, J. Comput. Chem., 2006, 27, 1787–1799 CrossRef CAS PubMed.
- T. Clark, J. Chandrasekhar, G. Spitznagel and P. von Ragué Schleyer, J. Comput. Chem., 1983, 4, 294–301 CrossRef CAS.
- P. Hariharan and J. Pople, Theor. Chim. Acta, 1973, 28, 213–222 CrossRef CAS.
- D. Andrae, U. Iubermann, M. Dolg, H. Stoll and H. Preub, Theor. Chim. Acta, 1990, 77, 123–141 CrossRef CAS.
- R. Krishnan, J. S. Binkley, R. Seeger and J. A. Pople, J. Chem. Phys., 1980, 72, 650–654 CrossRef CAS.
- F. Weigend and R. Ahlrichs, Phys. Chem. Chem. Phys., 2005, 7, 3297–3305 RSC.
- A. Marenich, S. Jerome, C. Cramer and D. Truhlar, J. Chem. Theory Comput., 2012, 8, 527–541 CrossRef CAS PubMed.
- A. Wolberg, Isr. J. Chem., 1974, 12, 1031–1035 CrossRef CAS.
- A. Wolberg and J. Manassen, J. Am. Chem. Soc., 1970, 92, 2982–2991 CrossRef CAS PubMed.
- D. Dolphin, T. Niem, R. Felton and I. Fujita, J. Am. Chem. Soc., 1975, 97, 5288–5290 CrossRef CAS PubMed.
- A. Stanienda and G. Biebl, Z. Phys. Chem., 1967, 52, 254–275 CrossRef CAS.
- D. Chang, T. Malinski, A. Ulman and K. Kadish, Inorg. Chem., 1984, 23, 817–824 CrossRef CAS.
- A. Wahab, M. Bhattacharya, S. Ghosh, A. Samuelson and P. Das, J. Phys. Chem. B, 2008, 112, 2842–2847 CrossRef CAS PubMed.
- K. Kadish, G. Larson, D. Lexa and M. Momenteau, J. Am. Chem. Soc., 1975, 97, 282–288 CrossRef CAS PubMed.
- A. Giraudeau, H. Callot, J. Jordan, I. Ezhar and M. Gross, J. Am. Chem. Soc., 1979, 101, 3857–3862 CrossRef CAS.
- K. Kadish, M. Morrison, L. Constant, L. Dickens and D. Davis, J. Am. Chem. Soc., 1976, 98, 8387–8390 CrossRef CAS PubMed.
- M. Autret, Z. Ou, A. Antonini, T. Boschi, P. Tagliatesta and K. Kadish, J. Chem. Soc., Dalton Trans., 1996, 2793–2787 RSC.
- R. Guilard, A. Zrineh, A. Tabard, A. Endo, B. Han, C. Lecomte, M. Souhassou, A. Habbou, M. Ferhat and K. Kadish, Inorg. Chem., 1990, 29, 4476–4482 CrossRef CAS.
- T. Kohshin, K. Horino, T. Komura and K. Murata, Bull. Chem. Soc. Jpn., 1993, 66, 733–738 CrossRef.
- K. Kadish, X. Lin, J. Ding, Y. Wu and C. Araullo, Inorg. Chem., 1986, 25, 3236–3242 CrossRef CAS.
- A. Giraudeau, A. Louati, H. Callot and M. Gross, Inorg. Chem., 1981, 20, 769–772 CrossRef CAS.
- A. Antipas, D. Dolphin, M. Gouterman and E. Johnson, J. Am. Chem. Soc., 1978, 100, 7705–7709 CrossRef CAS.
- Y. Fang, F. Mandoj, L. Zeng, R. Pudi, M. Stefanelli, R. Paolesse and K. Kadish, J. Porphyrins Phthalocyanines, 2015, 19, 1–10 CrossRef.
- S. Jones and H. Po, Inorg. Chim. Acta, 1980, 42, 95–99 CrossRef CAS.
- L. Ye, Y. Fang, Z. Ou, S. Xue and K. Kadish, Inorg. Chem., 2017, 56, 13613–13626 CrossRef CAS PubMed.
- L. Truxillo and D. Davis, Anal. Chem., 1975, 47, 2260–2267 CrossRef CAS PubMed.
- A. Giraudeau, H. Callot and M. Gross, Inorg. Chem., 1979, 18, 201–206 CrossRef CAS.
- H. Callat, A. Giraudeau and M. Gross, J. Chem. Soc., Perkin Trans. 2, 1975, 1321–1324 RSC.
- R. Felton and G. Owen, Ann. N. Y. Acad. Sci., 1973, 206, 506–515 CrossRef PubMed.
- G. Brown, F. Hopf, J. Ferguson, T. Meyer and D. Whitten, J. Am. Chem. Soc., 1973, 95, 5939–5942 CrossRef CAS PubMed.
- C. Paliteiro and A. Sobral, Electrochim. Acta, 2005, 50, 2445–2451 CrossRef CAS.
- Y. Fang, P. Bhyrappa, Z. Ou and K. Kadish, Chem. – Eur. J., 2014, 20, 524–532 CrossRef CAS PubMed.
- H. Kageyama, M. Hidai and Y. Uchida, Bull. Chem. Soc. Jpn., 1972, 45, 2898–2902 CrossRef CAS.
- S. Schmidt and G. Schuster, J. Am. Chem. Soc., 1980, 102, 7100–7103 CrossRef CAS.
- A. Ghosh, S. Mobin, R. Fröhlich, R. Butcher, D. Maity and M. Ravikanth, Inorg. Chem., 2010, 49, 8287–8297 CrossRef CAS PubMed.
- T. Malinski, D. Chang, J.-M. Latour, J.-C. Marchon, M. Gross, A. Giraudeau and K. Kadish, Inorg. Chem., 1984, 23, 3947–3955 CrossRef CAS.
- D. Clack and N. Hush, J. Am. Chem. Soc., 1965, 87, 4238–4242 CrossRef CAS.
- V. Pavlishchuk and A. Addison, Inorg. Chim. Acta, 2000, 298, 97–102 CrossRef CAS.
- L. A. Galan, D. B. Cordes, A. M. Z. Slawin, D. Jacquemin, M. I. Ogden, M. Massi and E. Zysman-Colman, Eur. J. Inorg. Chem., 2019, 152–163 CrossRef CAS.
- H. X. Wang, Q. Wan, K. H. Low, C. Y. Zhou, J. S. Huang, J. L. Zhang and C. M. Che, Chem. Sci., 2020, 11, 2243–2259 RSC.
- B. E. Rennie, R. G. Eleftheriades and R. H. Morris, J. Am. Chem. Soc., 2020, 142, 17607–17629 CrossRef CAS PubMed.
- Q. Lin, G. Dawson and T. Diao, Synlett, 2021, 1606–1620 CAS.
- Q. Wang, X. Zhao, J. Zhang and X. Zhang, J. Electroanal. Chem., 2015, 755, 210–214 CrossRef CAS.
- T. Nam, S. Son, B. Koo, H. V. Hoa Tran, J. R. Kim, Y. Choi and S. P. Jung, Int. J. Hydrogen Energy, 2017, 42, 27677–27684 CrossRef CAS.
- V. Birss, K. Dang, J. E. Wong and R. P. C. Wong, J. Electroanal. Chem., 2003, 550–551, 67–79 CrossRef CAS.
- J.-H. Fuhrhop, K. Kadish and D. Davis, J. Am. Chem. Soc., 1973, 96, 5140–5147 CrossRef PubMed.
- Y. Han, H. Fang, H. Jing, H. Sun, H. Lei, W. Lai and R. Cao, Angew. Chem., 2016, 128, 5547–5552 CrossRef.
- H. Castro-Cruz and N. Macías-Ruvalcaba, Coord. Chem. Rev., 2022, 458 Search PubMed.
- A. Maher, G. Passard, D. Dogutan, R. Halbach, B. Anderson, C. Gagliardi, M. Taniguchi, J. Lindsey and D. Nocera, ACS Catal., 2017, 7, 3597–3606 CrossRef CAS.
- H. Ooka and R. Nakamura, J. Phys. Chem. Lett., 2019, 10, 6706–6713 CrossRef CAS PubMed.
- E. Rountree, B. McCarthy, T. Eisenhart and J. Dempsey, Inorg. Chem., 2014, 53, 9983–10002 CrossRef CAS PubMed.
- K. Lee, N. Elgrishi, B. Kandemir and J. Dempsey, Nat. Rev. Chem., 2017, 1, 0039 CrossRef CAS.
- J. Saveant and K. Su, J. Electroanal. Chem., 1984, 171, 341–349 CrossRef CAS.
- C. Costentin and J.-M. Savéant, ChemElectroChem, 2014, 1, 1226–1236 CrossRef CAS.
- C. Costentin, S. Drouet, M. Robert and J.-M. Savéant, J. Am. Chem. Soc., 2012, 134, 11235–11242 CrossRef CAS PubMed.
- E. Rountree and J. Dempsey, J. Am. Chem. Soc., 2015, 137, 13371–13380 CrossRef CAS PubMed.
- E. Wiedner, H. Brown and M. Helm, J. Am. Chem. Soc., 2016, 138, 604–616 CrossRef CAS PubMed.
- A. Appel and M. Helm, ACS Catal., 2014, 4, 630–633 CrossRef CAS.
- C. Wise, R. Agarwal and J. Mayer, J. Am. Chem. Soc., 2020, 142, 10681–10691 CrossRef CAS PubMed.
- A. Bard and L. Faulkner, Electrochemical Methods: Fundamentals and Applications, John Wiley & Sons, New York, 2nd edn, 2001 Search PubMed.
- N. Elgrishi, B. McCarthy, E. Rountree and J. Dempsey, ACS Catal., 2016, 6, 3644–3659 CrossRef CAS.
Footnotes |
| † Electronic supplementary information (ESI) available. See DOI: https://doi.org/10.1039/d3dt01250f |
| ‡ A possible explanation could have been that Fe leaves the ligand and interacts with BzOH. However, this scenario was ruled out by cycling Fe(III) trifluoromethanesulfonate under the same conditions as FeTPP. No new peaks occurred when BzOH was added to the solution, and the origin of the ones seen for FeTPP under catalytic conditions currently remains unexplained. |
| This journal is © The Royal Society of Chemistry 2023 |