DOI:
10.1039/D2DT04082D
(Paper)
Dalton Trans., 2023,
52, 4044-4057
Fluorine-based Zn salan complexes†
Received
21st December 2022
, Accepted 20th February 2023
First published on 24th February 2023
Abstract
We synthesised and characterised the racemic and chiral versions of two Zn salan fluorine-based complexes from commercially available materials. The complexes are susceptible to absorbing H2O from the atmosphere. In solution (DMSO–H2O) and at the millimolar level, experimental and theoretical studies identify that these complexes exist in a dimeric-monomeric equilibrium. We also investigated their ability to sense amines via19F NMR. In CDCl3 or d6-DMSO, strongly coordinating molecules (H2O or DMSO) are the limiting factor in using these easy-to-make complexes as chemosensory platforms since their exchange with analytes requires an extreme excess of the latter.
Introduction
A compound is considered chiral when it exists in two or more asymmetric forms with non-superimposable mirror images without changing its bond orders, atom–atom connections, and atomic compositions and these forms are called enantiomers.1 Nature is full of chiral components such as amino acids, saccharides, peptides, enzymes, and proteins,2 while many chiral compounds in the pharmaceutical industry and material sciences possess biological activity.3,4 The enantiomeric synthesis of asymmetric compounds has rapidly increased over the years,5 and more complicated and sophisticated systems have been developed.6 For example, enzymes are used as catalysts to promote organic transformations,7 chiral compounds are used in different stages of drug discovery8,9 and amino acids are used as building blocks for larger molecules i.e. protein, nucleic acid, and components of food and beverages.10
Enantiomers have the same physical properties in an achiral environment, but may possess different pharmacological and biological activities.11 Conventional high-performance liquid chromatography (HPLC) can separate the enantiomers,12 but this approach involves costly chiral columns. Thus, developing new methods for enantiomeric discrimination is highly interesting for industrial and biomedical applications and is subsequently vital for future discoveries.13 For example, circular dichroism (CD) and fluorescence,14–21 monitor absorbance intensity change(s) whereas Nuclear Magnetic Resonance (NMR) proceeds chemically shifted signals;22–25 these methods rely on host-guest interaction(s); therefore, thermodynamic and kinetic parameters and equipment's response time signify method applicability and limitation. In the latter case, methods incorporating chiral templates and 1H-NMR are popular,26–31 however, lately, emphasis is given to developing hetero nuclear-based methods i.e.31P![[thin space (1/6-em)]](https://www.rsc.org/images/entities/char_2009.gif) 24,32 or 19F.33–35 The latter method has the following two advantages: lack of background interference;33,34 thus applies to large molecules, such as proteins,35,36 and a broad detection window from −200 ppm to 200 ppm depending on the transducers, i.e. –CF3, –OCF3, –F and other groups.37 Pioneer works from Swager38,39 and Song40 establish the principles in using new or modifying already known chiral fluorine-based complexes for discriminating chiral amine-based methods. Both methods use non-labile, less abundant, toxic elements, work in non-coordinating solvents and rely on the host-guest interaction principle; thus, two different peaks (one for the complex and one for the complex + analyte in 1:1 ratio) appear in the 19F NMR spectrum. In the latter case,40 the method also applies to coordinating solvents, and its operational window is 0.21 ppm.
24,32 or 19F.33–35 The latter method has the following two advantages: lack of background interference;33,34 thus applies to large molecules, such as proteins,35,36 and a broad detection window from −200 ppm to 200 ppm depending on the transducers, i.e. –CF3, –OCF3, –F and other groups.37 Pioneer works from Swager38,39 and Song40 establish the principles in using new or modifying already known chiral fluorine-based complexes for discriminating chiral amine-based methods. Both methods use non-labile, less abundant, toxic elements, work in non-coordinating solvents and rely on the host-guest interaction principle; thus, two different peaks (one for the complex and one for the complex + analyte in 1:1 ratio) appear in the 19F NMR spectrum. In the latter case,40 the method also applies to coordinating solvents, and its operational window is 0.21 ppm.
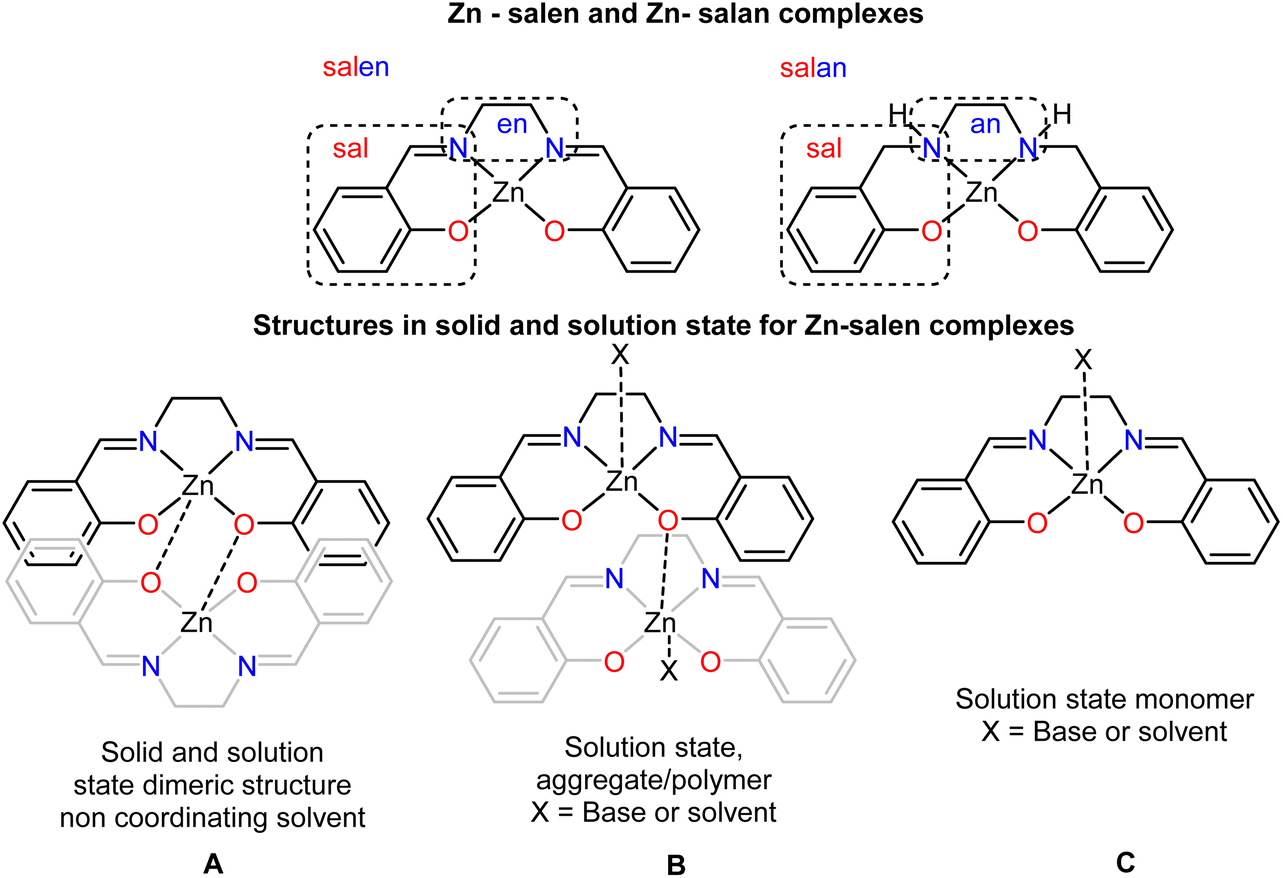
The condensation reaction of salicylic aldehyde and ethylenediamine yields the well-known versatile salen framework (Scheme 1, upper), which has been extensively used to produce complexes with applications in catalysis and sensing.41–55 From the synthetic perspective, the corresponding Zn complexes crystallise as dimers (Scheme 1, A); however, in solution, they either form monomers (Scheme 1, C) in coordinating solvents or the presence of a base or aggregates (Scheme 1, B), non-coordinating solvents. The former process is well and explicitly discussed and recently reviewed by Di Bella.52,56 In these reviews, the coordination number that the metal centre adopts depends on the solvent system and the presence (absence) of substrates, varying from four to six. Notably, the reduced version of salen, which means salan ligands (Scheme 1, upper right) and their corresponding Zn complexes, have been less investigated.57–64 These compounds are susceptible to oxidative dehydrogenation, depending on the solvent medium.65,66 Only 31 crystal structures have been deposited in the CSD.67 The sp3 carbon atoms of the salan framework impose flexibility and, consequently, possible alterations in the geometry of the metal centre, deviating from the dominant square planar and/or square pyramidal conformation.
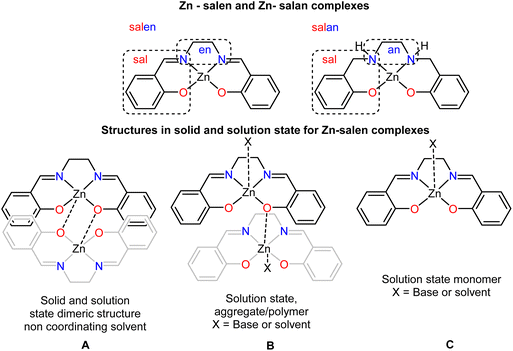 |
| | Scheme 1 (Upper) the differentiation of salen and salan framework (middle) possible structures in solid and solution (lower) possible species for sensing processes. | |
Previous studies identify the ability of Zn(II) complexes to sense biologically important small molecules68 such as amino acids,69,70 amines,71 saccharides72,73 and ribonucleosides.74 Recently, Zhao suggested that Zn(II) salen complexes, ideal models for catalysis, are inappropriate for sensing purposes because their structural changes (Scheme 2, species A′, B′ and C′) interfere chronically with the sensing process, thereby averaging the 19F NMR signals of the interconverting species.75 With all these in mind, we embarked on a project examining if the easy-to-make, low-cost, chiral Zn(II) salan complexes can be used as chemosensory platforms with 19F NMR. We detail our ligand-complex design criteria for this purpose (Scheme 2). The use of salan frameworks will increase the flexibility of the organic framework and consequently affect the coordination geometry of the metal centre. However, incorporating the rigid cyclohexane backbone instead of the en moiety will impede the flexible character. Next, we wanted to investigate the impact of the different transducers (F vs. OCF3) but also varying its position, adjacent or away from the sensing point (metal centre). Thirdly, we investigated if altering the chirality of the host will impact the sensing process. Lastly, we envisaged these complexes existing as dimers in the solid state and possibly in the solution state; therefore, we hypothesised that saturated analyte (complex: analyte ratios 1:20, 1:40, 1:50 and above) solutions will favour the sole formation of species C′ (Scheme 2), thus advancing a new sensing process (appearance of one peak corresponding to the complex + analyte species C′); the scope of this hypothesis is discussed and presented.
 |
| | Scheme 2 (Upper) a schematic representation of the hypothesis (lower) the selected two frameworks for this study. | |
Results
Synthesis of the ligands
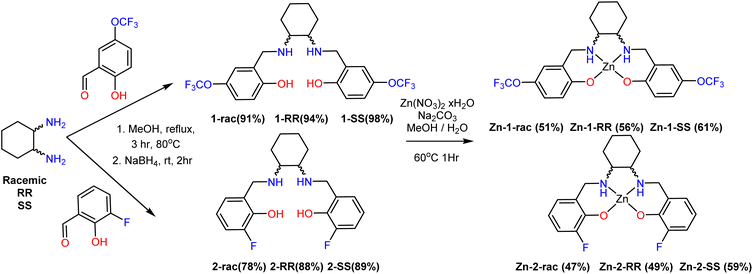
All ligands can be synthesised using commercially available chemicals in two high-yielding steps, avoiding column chromatography (Scheme 3). The ligands have been characterised by NMR (1H, 13C, 19F), IR, UV-Vis, and HR-MS (with ESI† as an ion source). The chirality of each species has been determined by Circular Dichroism (CD) (Fig. 1), observing the opposite enantiomer. The total yield for the ligands varies between 78–98%.
 |
| | Scheme 3 A simplified version of the synthetic routes to yield all ligands and complexes. | |
 |
| | Fig. 1 The circular dichroism spectra for the ligands (solvent, MeOH, c = 1 mM, T = 298 K). | |
Complex synthesis
With the ligands in hand and bulk, we performed several reactions for synthesising the corresponding Zn complexes (Scheme 3). We screened several parameters such as metal salt Zn(NO3)2 6(H2O), ZnCl2, Zn(OTf)2, Zn(BF4)2, Zn(ClO4)2, solvent (MeOH, CH2Cl2, EtOH, CH3CN), metal:ligand ratio (3:1 to 1:3), temperature (25 °C, 50 °C, 75 °C), base (Et3N, Na2CO3, K2CO3) and identified the optimum conditions as: Zn(NO3)2 6(H2O):Ligand:Na2CO3 in a molar ratio 1:1:1, on a mixture of solvents MeOH/H2O (10/2 mL). The metal salt and ligand were dissolved in methanol, and the solution turned milky upon adding an aqueous Na2CO3 solution. After 1 h of reflux, the solution was filtered, and the filtrate was kept for slow evaporation. Shiny block-shaped colourless crystals were collected in good to moderate yields between four and fourteen days.
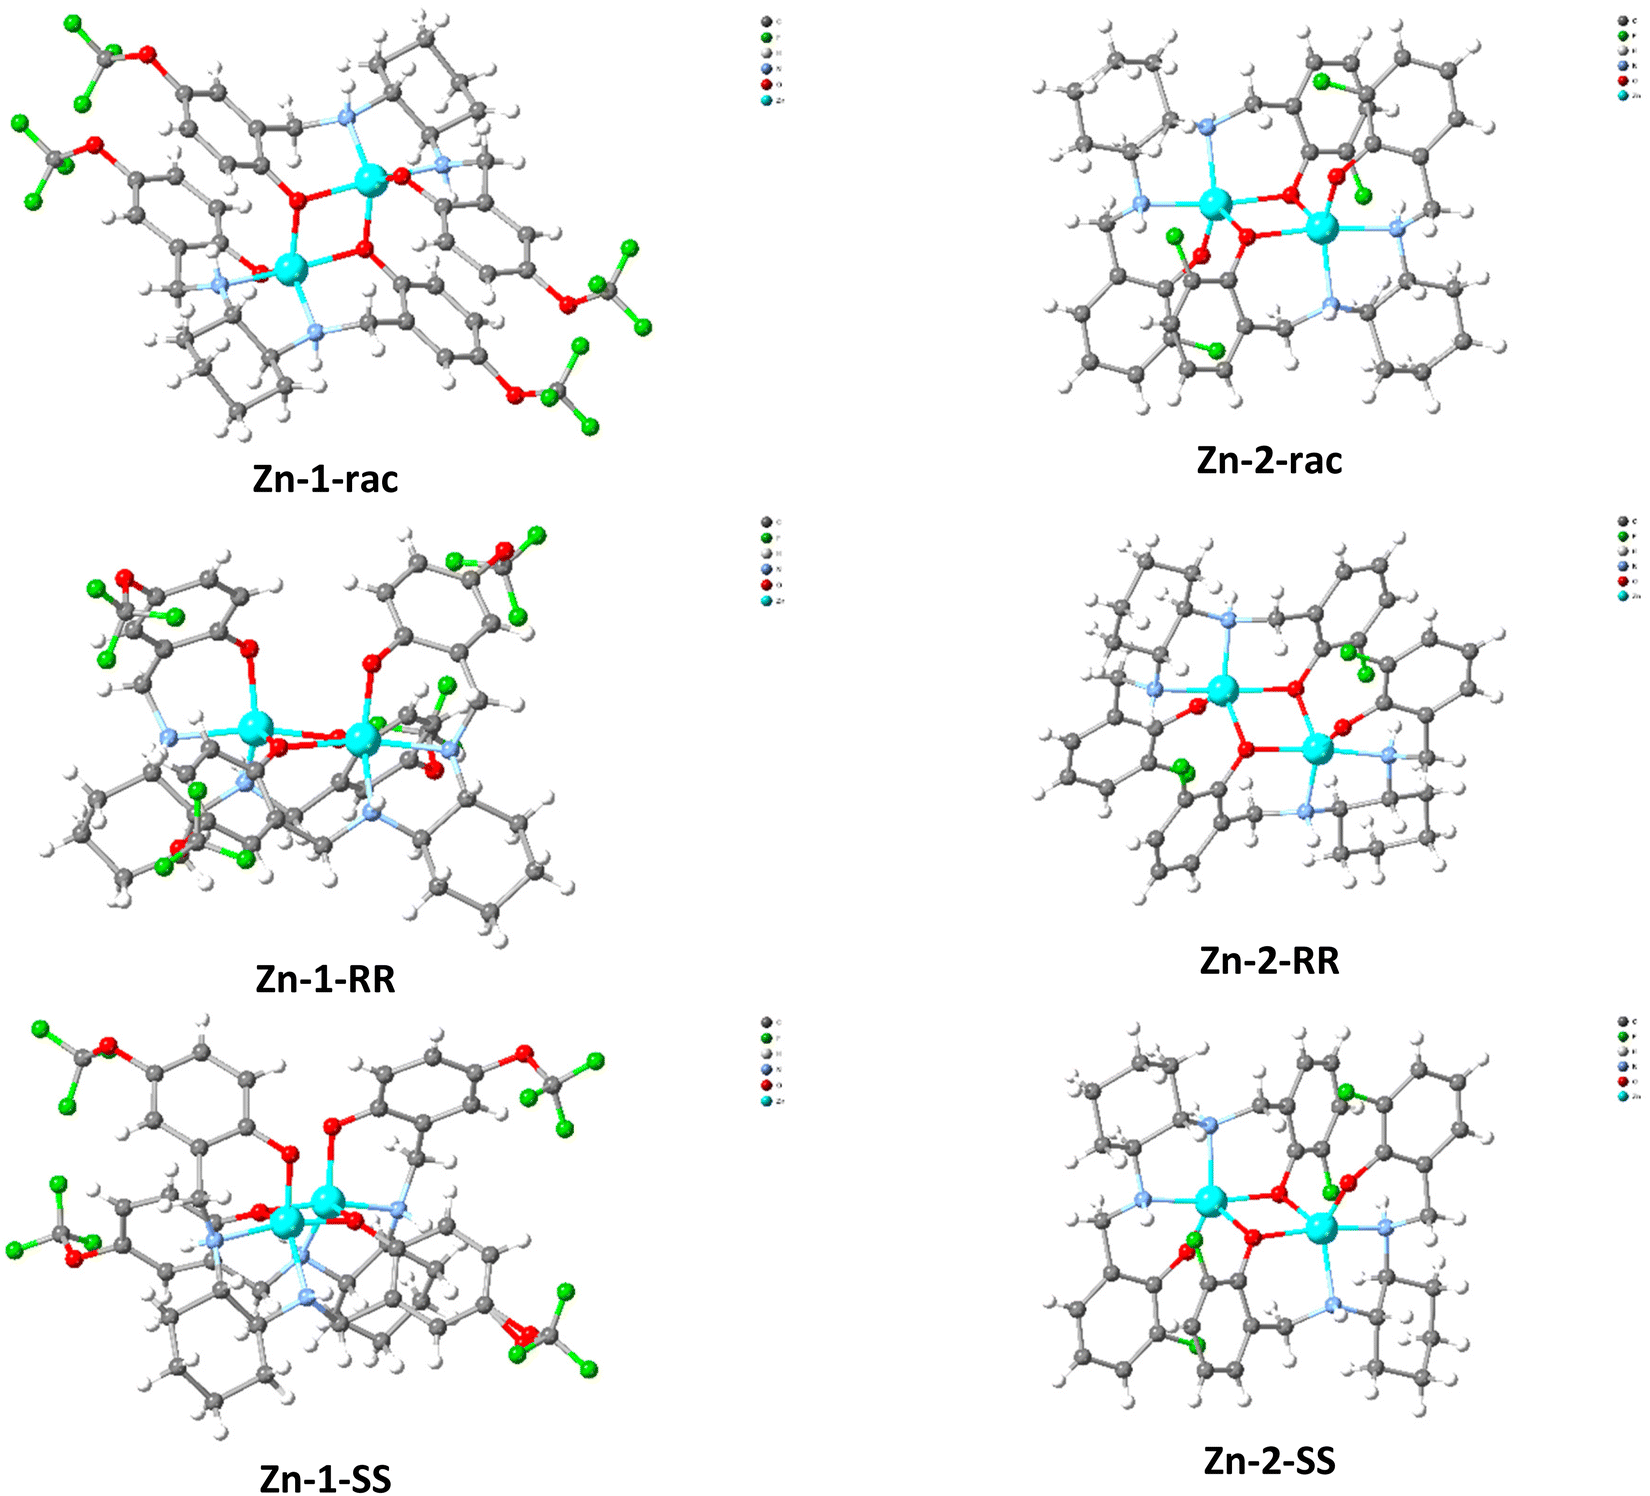
Characterisation in solid state
Single crystal X-Ray diffraction studies (Table S1†) for Zn-1 and Zn-2 families identified the formation of dimers for all cases (Fig. 2); however, minor differentiations could be identified in the crystallised lattice molecules for Zn-1-RR and Zn-1-SS. No lattice molecules could be determined for compound Zn-1-rac, however the actual formula for Zn-1-RR is [ZnL 1(CH3OH) 0.375(H2O)] and for Zn-1-SS is [ZnL 2(CH3OH)]. For the Zn-2 family, all compounds crystallise as [ZnL 2(H2O)]. All lattice molecules form hydrogen bonding interactions with the metalloligand (ZnL) moieties. Zn-1-rac and Zn-2-rac crystallise in achiral space groups (P21/n and P![[1 with combining macron]](https://www.rsc.org/images/entities/char_0031_0304.gif) ), while the remaining four complexes crystallise in chiral space groups. The Zn centre inclines to adopt a trigonal bipyramidal geometry (Fig. S1† & Table 1). Notably, for the chiral species, two different indexes could be determined; however, their average is close to the index calculated for the non-chiral species (Table 1). In all species, the C–N bond is within the range of single bond values, discarding the occurrence of oxidative dehydrogenation,65,76 while the phenoxido C–O bond is within the range of a single bond value. The Flack parameter value (Table S1†) for all four compounds is close to zero, thus determining enantiomeric purity. The compounds were further characterised by Thermogravimetric (TG) and elemental (CHN) analysis, which slightly deviated from the expected calculated values. They are consistent with additional lattice solvent molecules (Fig S2†).
), while the remaining four complexes crystallise in chiral space groups. The Zn centre inclines to adopt a trigonal bipyramidal geometry (Fig. S1† & Table 1). Notably, for the chiral species, two different indexes could be determined; however, their average is close to the index calculated for the non-chiral species (Table 1). In all species, the C–N bond is within the range of single bond values, discarding the occurrence of oxidative dehydrogenation,65,76 while the phenoxido C–O bond is within the range of a single bond value. The Flack parameter value (Table S1†) for all four compounds is close to zero, thus determining enantiomeric purity. The compounds were further characterised by Thermogravimetric (TG) and elemental (CHN) analysis, which slightly deviated from the expected calculated values. They are consistent with additional lattice solvent molecules (Fig S2†).
 |
| | Fig. 2 Crystallographic representation of Zn-1 (left)and Zn-2 (right) families. Lattice solvent molecules have been omitted for clarity. Colour code; Zn (light blue), O (red), N (blue), C (grey), H (white), F (green). | |
Table 1 Selected bond distances for all complexes and trigonality index
| |
Zn–O1 |
Zn–O2 |
Zn–O3 |
Zn–N1 |
Zn–N2 |
Trigonality index (τ)77 |
| Trigonality index indicates the geometry of the coordination center.77 When τ = 0 the geometry corresponds to square pyramidal, when τ = 1 corresponds to trigonal bipyramidal. |
|
Zn-1-rac
|
2.057(3) |
2.068(3) |
1.963(3) |
2.110(4) |
2.141(3) |
0.68 |
|
Zn-1-RR
|
2.079(7) |
1.987(7) |
1.990(8) |
2.132(8) |
2.186(8) |
0.61 |
| 1.985(8) |
2.108(7) |
1.987(7) |
2.101(8) |
2.189(8) |
0.65 |
|
Zn-1-SS
|
2.088(5) |
2.002(5) |
1.981(6) |
2.132(7) |
2.190(6) |
0.61 |
| 1.995(5) |
2.086(5) |
1.966(6) |
2.194(7) |
2.126(8) |
0.60 |
|
Zn-2-rac
|
1.959(4) |
2.049(4) |
2.101(4) |
2.141(5) |
2.093(5) |
0.61 |
|
Zn-2-RR
|
1.959(4) |
2.095(5) |
2.040(4) |
2.149(5) |
2.109(5) |
0.74 |
| 2.051(4) |
2.099(5) |
1.950(4) |
2.115(5) |
2.133(5) |
0.50 |
|
Zn-2-SS
|
1.954(5) |
2.099(6) |
2.051(5) |
2.133(7) |
2.111(6) |
0.50 |
| 2.046(5) |
2.097(6) |
1.959(5) |
2.111(6) |
2.152(7) |
0.74 |
Characterisation in solution state
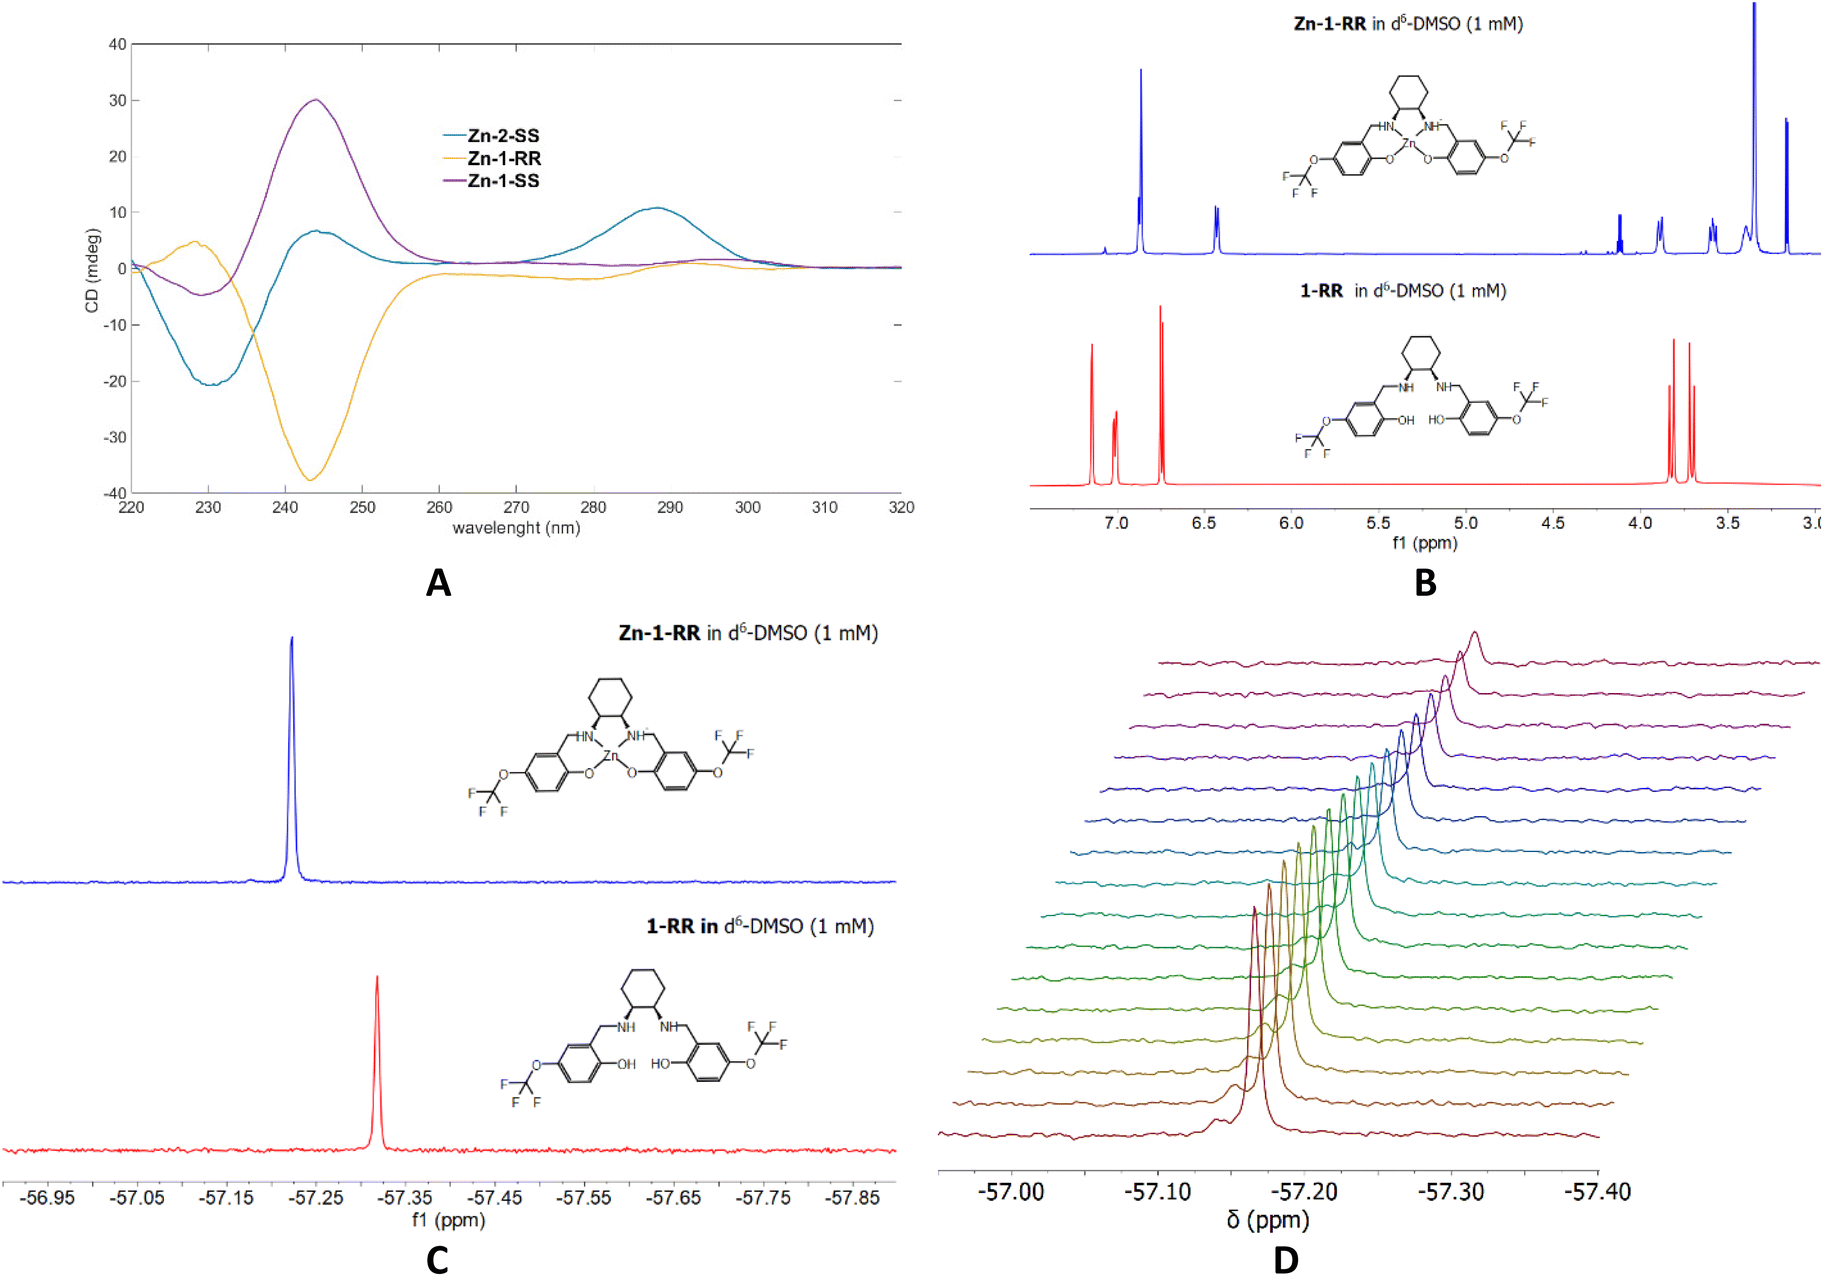
With the complexes in hand, we attempted to elucidate if they retain their structure in solution; therefore, we recorded 1H and 19F NMR, CD and ESI-MS. The ESI-MS data for Zn-1-RR (Fig. S3†) validate the formation of monomeric and dimeric species; a characteristic peak with corresponding isotropic distribution can be identified for both species. CD studies of selected samples in DMSO validate the retention of the enantiomeric form (Fig. 3A). Then, we recorded 1H and 19F NMR data using a coordinating solvent (d6-DMSO) and compared them with the free ligands (Fig. 3B, C and ESI†). From these data, complexation is evident; characteristic peaks in the aromatic and cyclohexane backbone regions shift at different values in 1H NMR. In 19F NMR, the sole peak shifts by 0.1 ppm (Fig. 3C), whereas for the Zn-2 family, the peak shifts almost by 1 ppm (0.87 ppm, Fig. S5†). Minor peaks can be observed in the 1H NMR of Zn-1-SS; however, this may be attributed to different species formed in solution (see Scheme 2, A′, B′ and C′), rather than impurities since the 19F NMR data suggests the presence of only one species. To validate the existence of a monomeric or a dimeric species, we performed 19F NMR diffusion studies (Fig. 3D). However, the data was inconclusive as the apparent molecular weight was intermediate between the putative monomeric and dimeric species.78
 |
| | Fig. 3 (A) the circular dichroism spectra for selected complexes Zn-1-RR, Zn-1-SS and Zn-2-SS. (c = 1 mM) (B & C) 1H and 19F NMR comparison of 1-RR and Zn-1-RR in d6-DMSO (c = 1 mM, T = 303 K). (D) 19F NMR diffusion studies. | |
We performed potentiometric studies for 2-rac and its corresponding Zn-2-rac complex at a millimolar level in two concentrations (0.2 and 1.2 mM) in a mixed DMSO–H2O solvent system (Fig. S6†). Four deprotonation constants can be calculated for the two phenolic OH and two NH groups. The lowest pK value belongs to the deprotonation of one NH group, while the other deprotonation processes overlap. The lowest pK values in all measurements agree; however, the basic pH range values slightly differ in the samples with different ligand concentrations. The solution at 1.2 mM concentration becomes turbid above pH 9, prohibiting further evaluation. The higher pK values were set from the 0.2 mM measurements. The interaction of the ligand with Zn(II) was studied at a 1:2 metal-to-ligand ratio in 0.2 and 1.2 mM (for the ligand) solutions; the data were evaluated considering the monomeric and dimeric species (Fig. 4). From the distribution curves (Table 2), we note that (a) the higher ligand concentration shifts the complex formation to lower pH, and (b) the formation of the diprotonated dimeric complex in the 1.2 mM solution is favoured. Notably, upon ligand concentration increase, the data fitting improves with the dimeric model, and at a concentration of 1.2 mM, the formation of the dimeric complex is more favourable.
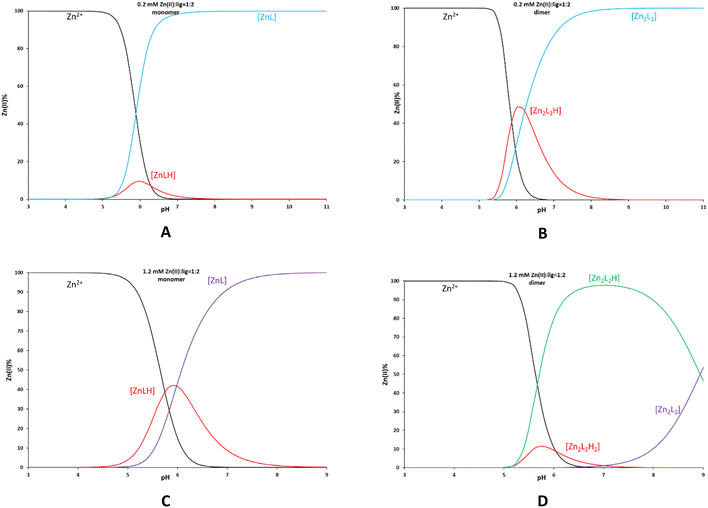 |
| | Fig. 4 Species distribution for the Zn-2-rac system at different concentrations (0.2 mM, A and B; 1.2 mM, C and D) with monomeric (A and C) and dimeric (B and D) models. | |
Table 2 pK values of 2-rac in solutions of different concentrations (I = 0.2 M, T = 298 K, standard deviations are in parentheses). The pK3 and pK4 values at 1.2 mM is likely to be the same as for 0.2 mM
| Ligand |
2-rac
|
|
c[mM] |
0.2 |
1.2 |
| pK1 |
4.27(9) |
4.05(2) |
| pK2 |
7.34(8) |
7.40(3) |
| pK3 |
9.50(6) |
— |
| pK4 |
10.99(4) |
— |
| Ligand |
2-rac
|
|
c[mM] |
0.2 |
1.2 |
| ZnLH |
19.20(12) |
Fitting: 5.33 × 10⁻⁴ |
19.47(12) |
Fitting: 1.96 × 10⁻³ |
| ZnL |
14.00(2) |
13.49(11) |
| Zn2L2H2 |
— |
Fitting: 6.98 × 10⁻⁴ |
41.97(18) |
Fitting: 5.02 × 10⁻⁴ |
| Zn2L2H |
38.18(5) |
36.9(3) |
| Zn2L2 |
31.96(6) |
27.96(11) |
Investigating amine response
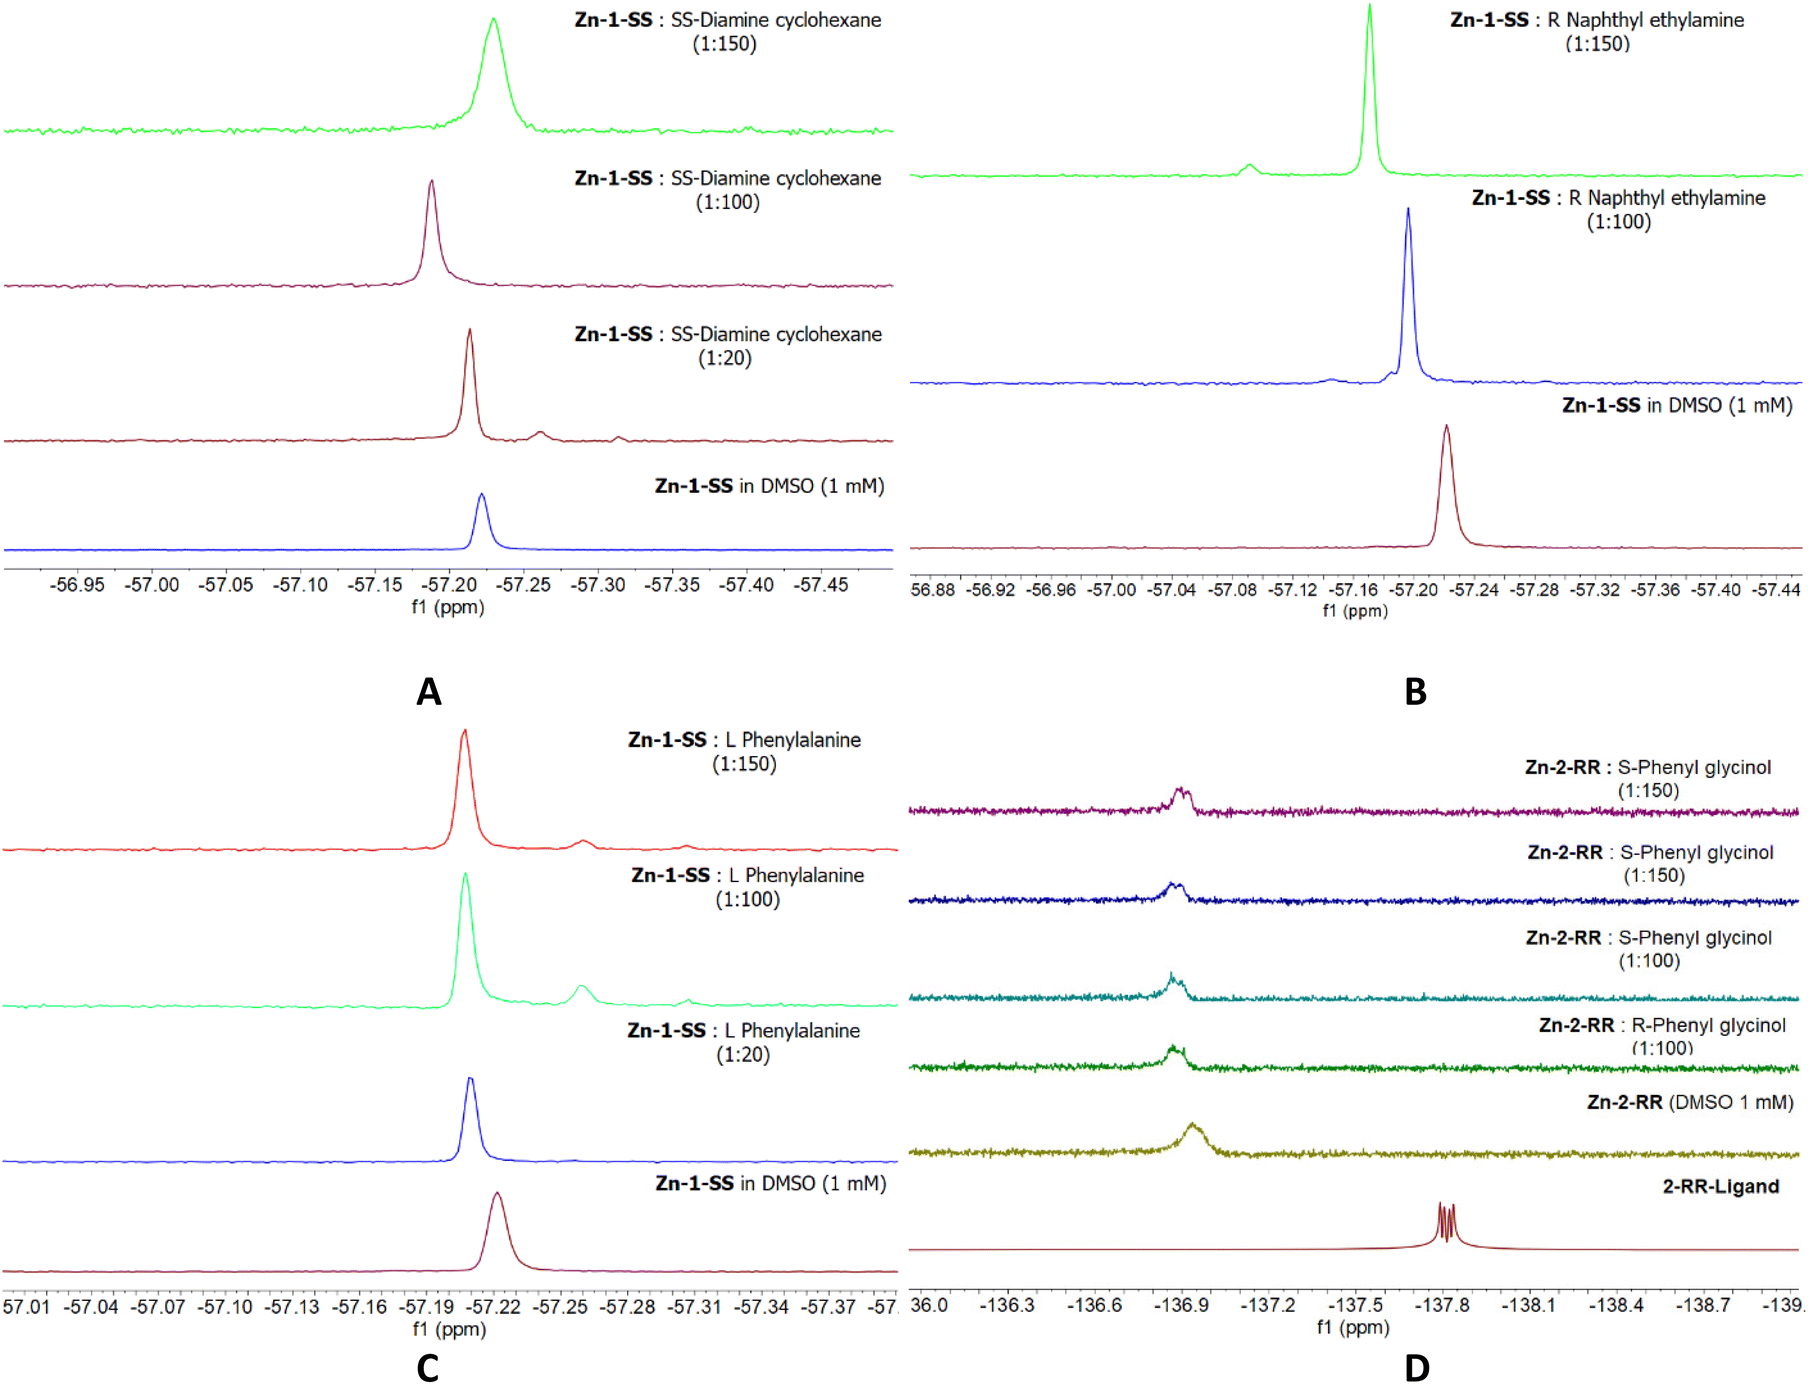
With the complexes in hand, we attempted to identify the best solvent system, with CDCl3 being our first choice. Previous works used this solvent and the complexes at 1 mM level.38–40 The data presented herein are the outcome of mixing the analyte and the complex within the NMR tube, avoiding stirring or sonication for prolonged periods; the reason for this choice is our aim to develop an efficient, convenient and rapid sensing method. Our first trial for Zn-1-RR (Fig. S7†), identifies that this non-coordinating solvent system levies monomeric-dimeric competition,52 therefore, we discarded its use. Then we used a binary solvent system (CDCl3–DMSO) in different ratios. However, the same behaviour was observed again (results are not presented). Thus, we concluded that DMSO would be the ideal solvent to proceed. The 19F NMR data of the complexes (Fig. 4) identify a single broad peak, indicating that an equilibrium (monomer vs. dimer) is favoured or that different types of interactions occur.36 Initial studies of the complex:analyte in 1:1 to 1:4 ratios give an unaltered complex spectrum (results not presented). To our disappointment, titrations of Zn-1-RR and Zn-1-SS at millimolar scale with limited excess of phenylglycinol in ratios 1:5 to 1:50, as this was our testing hypothesis, show minimal differences, thus prohibiting us from further continuing with this study. Given that we incorporated a strongly coordinating solvent (DMSO) which may occupy the coordinating site(s) on the Zn centre, we tried experiments with 1:100 and 1:150 ratios to favour the DMSO-analyte exchange. The latter experiment (1:150) suggests that a ligand (1-RRvs.analyte) exchange process starts, and the Zn(analyte)x complex forms (Scheme 1).
Then we tested Zn-1SS with other amines (Fig. 5A–C). Our first choice was to incorporate a diamine at different ratios (1:20, 1:50 and 1:100, Fig. 5A). The data from the first trial shows the main peak slightly shifted and two minor peaks, which could be indicative of the formation of the complex + analyte species; however, given that none of the two peaks is of the same intensity or integral with the main peak, we discarded this set of experiments from future studies. We also tried a different amine but noted a slight shift in the principal peak and the appearance of a minor peak (Fig. 5B). The same observation was noted when an amino acid was incorporated (Fig. 5C). Last, we used Zn-2-RR and phenyl glycinol at high complex analyte ratios (1:100 and 1:150), but again, one single peak could be observed (Fig. 5D).
 |
| | Fig. 5
19F NMR data for titration of Zn-1RR and Zn-1-SS with (R or S) phenylglycinol in different ratios c = 1 mM, T = 303 K. | |
DFT studies
We performed a DFT study to investigate the species of Zn-1-RR formed in solution, to support the interpretation of the observed experimental signals (Scheme 4). Calculations were carried out to model the system in non-coordinating (chloroform) and coordinating (DMSO) solvent. To find the most relevant species, we screened the conformational space using CREST,79 and re-optimised in Gaussian80 the lowest and most representative minima at the B3LYP81–83-D384/6-31g(d,p)85,86 & SDD87 level. The solvent (chloroform or DMSO) was modelled as a continuum media using PCM;88,89 in some calculations, up to two DMSO explicit molecules were included (see Computational details in ESI†). Results in chloroform show that in the absence of an analyte or coordinating solvent, the optimised Zn-1-RR structure resembles that (Dimer) defined by single X-Ray diffraction. The Dimer is thermodynamically stable compared to two molecules of the corresponding monomer by 20.5 kcal mol−1, suggesting the absence of the Monomer species in these conditions. However, two distinctive signals can be observed in the 19F NMR experimentally (Fig. S7†). For this reason, we decided to reinvestigate the system, considering the possible presence of some water molecules, as this notion was noted during the preparation of the complexes (see Fig. S2†). Different conformers of the Monomer and Dimer were optimised with one, two or three coordinating water molecules. This selection is because the Zn(II) coordination sphere can immediately change from 4 to 5 to 6 due to the presence of water molecules and/or Lewis bases. This flexibility has been explicitly described in biological and catalysis-related examples.90,91 When one water molecule coordinates with the Dimer, it produces an intermediate species Dimer(H2O), which is 7.8 kcal mol−1 more stable; hence water coordination is favoured. For the monomer, the Monomer(H2O) is favoured by 13.8 kcal mol−1. However, the significant instability of the monomer compared to the Dimer, makes Monomer(H2O) less stable than Dimer(H2O) by 14.5 kcal mol−1; hence this species could neither be experimentally observed. Calculations accounting for two coordinating water molecules result in Dimer(H2O)2 and Monomer(H2O)2 with relative energies of −16.0 and −8.6 kcal mol−1, respectively respect to Dimer. The coordination of this second water molecule reduces the difference between monomeric and dimeric species. However, the dimer is still preferred by 7.4 kcal mol−1. The most stable isomer of Monomer(H2O)2 presents a geometry with a water molecule coordinated to Zn and the other, forming a bridge between the oxygen of the ligand and the coordinated water. The geometry of this species suggests that a strong interaction with a third water molecule could be favoured. Calculations including a third water molecule yield Dimer(H2O)3 and Monomer(H2O)3 with relative energies of −24.2 and −21.9 kcal mol−1, respectively respect to Dimer; see Scheme 4.
 |
| | Scheme 4 Schematic representation of a simplified reaction network of the most relevant species and their relative free energies in chloroform and kcal mol−1. | |
The difference between monomeric and dimeric species is small (2.3 kcal mol−1), and depending on the water's concentration, both species could be observed. Please note that computational free energies reported corresponding to the 1 M Standard State. If we have concentrations significantly different from 1 M, the energies alone cannot predict the formed species, and concentrations must be considered.92 The overall equilibrium between these two species is governed by the chemical equation Dimer(H2O)3 + 3 H2O ⇌ 2 Monomer(H2O)3, this means that Keq = [Monomer(H2O)3]2/([Dimer(H2O)3][H2O]3) = 8.3. Hence at concentrations of water above [H2O] = [Monomer(H2O)3]2/([Dimer(H2O)3]Keq)1/3, the monomer will be observed while below the dimer will be observed assuming there is enough water to form Dimer(H2O)3. We checked the monomer to total ratio as m/t = [Monomer(H2O)3]/[Dimer]0 × 100 at different concentrations of water, where [Dimer]0 is the initial concentration of dimer.
For initial concentrations of water [H2O]0 = 0.01, 0.1, 0.25 and 0.5 M, the predicted m/t ratio is 0.3%, 14%, 50% and 110%, suggesting that indeed in the reaction media, Dimer(H2O)3 and Monomer(H2O)3 could be present at the same time. Please note that as small errors in computational free energies will impact the equilibrium constants, we can only provide a qualitative explanation. The monomer–dimer equilibrium observed for initial water concentrations between 0.1 and 0.5 M could be at concentrations lower or higher.93 The geometries of Dimer(H2O)3 and Monomer(H2O)3 are presented in Fig. 7. The most stable dimeric species presents a water molecule strongly coordinated to one of the Zn and another weakly coordinated to the other Zn, forming hydrogen bonds with the ligand (Zn–O distances 2.21 and 2.60 Å). The third water molecule bridges the strongly coordinated water molecule and one of the ligand's oxygens (OH–O distances are 1.61 and 1.74 Å). In the monomer, the structure presents one water molecule coordinated to the Zn and the other two bridges between the coordinated water and two oxygens of the ligand (OH–O(lig) distances are 1.69 and 1.65 Å and ZnO(H)H–O 1.71 and 1.72 Å). Adding more water molecules has not been considered as more strong interactions seem unlikely, and conformational complexity increases.
We also investigated the structures related to amines, considering the coordination of one and two analyte molecules, (R) 2-phenylglycinol, to the monomer and the dimer as hypothesised (Scheme 2). We found that Dimer(analyte), Monomer(analyte) are located at −13.3 and −6.7 kcal mol−1 and Dimer(analyte)2, and Monomer(analyte)2 at −28.7 and −29.5 kcal mol−1, respectively; see Scheme 5 and Fig. 7. In this case, there is no space for the coordination of a third analyte molecule. Formation of Monomer(analyte)2 species is primarily favoured. The practical difficulties for sensing analytes at low concentrations seem to be due to the need for water–analyte exchange. The main chemical equations of the equilibria, in this case, are Dimer(H2O)3 + 4 analyte ⇌ 2 Monomer(analyte)2 + 3 H2O and Monomer(H2O)3 + 2 analyte ⇌ 2 Monomer(analyte)2 + 3 H2O. The energy difference between the aqua and analyte species is significant, 5.3 kcal mol−1 and 3.8 kcal mol−1, respectively. In both cases, the expressions depend upon the concentration of water and analyte. The two equilibriums are related, as well as to the previously mentioned species. Hence, a system of 12 equations needs to be solved to find the concentration of all species at equilibrium (see ESI†). Using the concentration of water 0.5 M (an approximate value according to the results above), we tested the a/t ratio = [Monomer(analyte)2]/([Dimer]0) × 100 at the [analyte]0 = [Dimer]0, 10 × [Dimer]0 and 100 × [Dimer]0; the respective a/t ratios are 0.5%, 29% and 178% (please note the relation between dimer and monomer is 1 to 2). These results show that the relationship between water/analyte concentrations impacts the sensing ability of the complexes.
 |
| | Scheme 5 Schematic representation of a simplified reaction network of the most relevant species and their relative free energies in DMSO and in kcal mol−1. | |
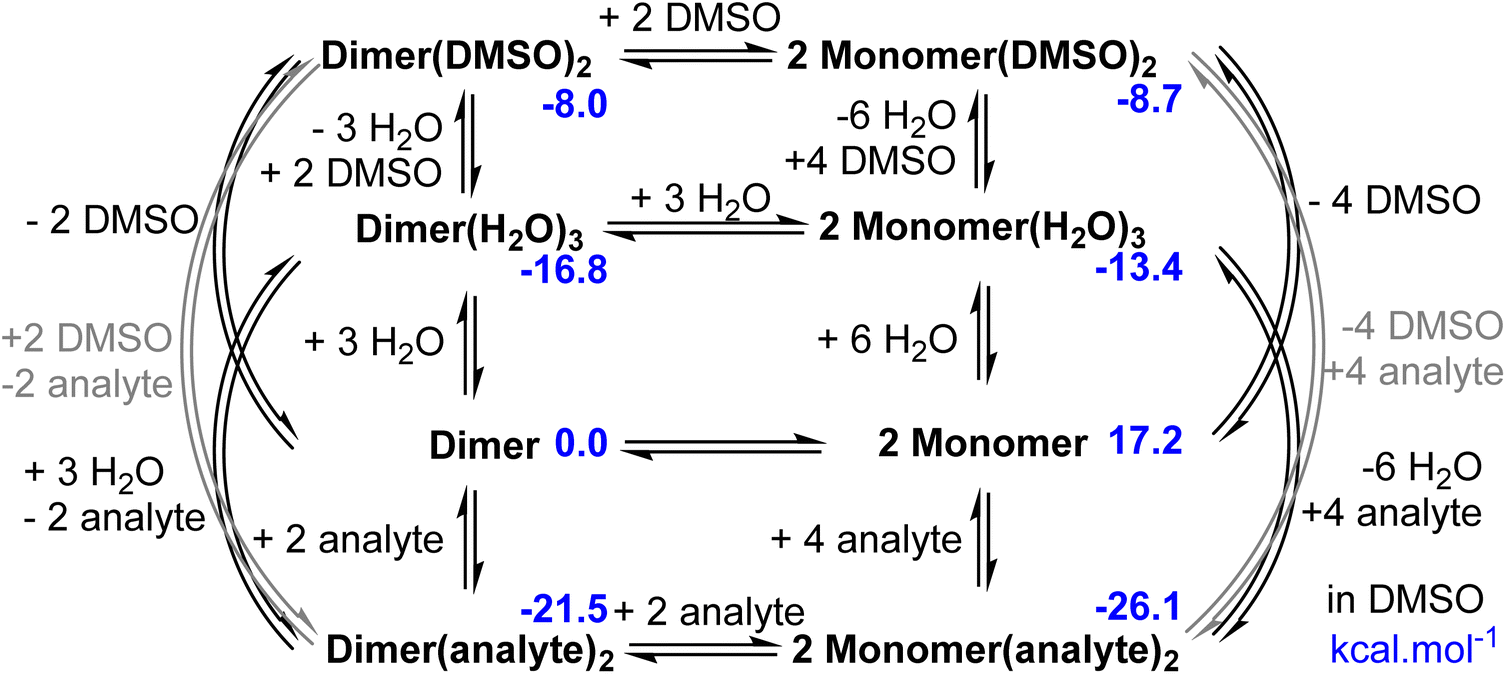
Following experimental results, we explored the equilibria in DMSO. The above-presented minima were computationally reoptimised using DMSO as the solvent, and results are presented in Scheme 5. The different conformers for the dimeric and monomeric species with one and two DMSO molecules coordinated were also searched. We found that the coordination of a DMSO molecule to form Dimer(DMSO) is favoured by −5.7 kcal mol−1 and the inclusion of a second DMSO molecule slightly stabilises the resulting Dimer(DMSO)2 to −8.0 kcal mol−1 in respect to the Dimer. The most stable conformer for Dimer(DMSO)2 is presented in Fig. 8, DMSO coordinates through the oxygen. The coordination of DMSO molecules also stabilises each monomer; the first DMSO stabilises the monomer in 7.6 kcal mol−1 and the second 5.4 kcal mol−1 more (see, Scheme 5 and Fig. 8). Hence, two Monomer(DMSO)2 molecules have similar energy as one Dimer(DMSO)2 (two monomers are 0.7 kcal mol−1 more stable). However, both are significantly less stable than the complexes with water or analyte molecules coordinated. Indeed, the most stable minimum is that of the monomer (analyte)2, however the concentration of DMSO is several orders of magnitude larger than that of the analyte. The chemical equations, corresponding equilibrium constants, and mass balances were written to predict the concentration of all species at equilibria. Concentrations were obtained by solving a system of 19 equations and 19 unknown variables considering initial concentrations 14.06 M DMSO, 0.50 M water, 1 × 10⁻³ M Dimer, no concentration of the rest of species except for the analyte for which we considered 0, 1 × 10⁻³, 1 × 10⁻² and 0.1 M. At none or low concentration of analyte the most abundant species is Mono(DMSO)2. Although this complex is less stable than the complexes with analyte and water, the large concentration of DMSO concerning the rest of the coordinating molecules (<0.5 M) makes the equilibria shift towards its formation. It is also interesting to note that although the stability of Mono(DMSO)2 and Dimer(DMSO)2 is similar, the chemical equation Dimer(DMSO)2 + 2 DMSO ⇌ 2 Monomer(DMSO)2 is also displaced towards the formation of Monomer(DMSO)2 for the same reason. At an increasing analyte concentration, the most abundant species becomes monomer(analyte)2. The computational a/t ratio = [Monomer(analyte)2]/([Dimer]0) × 100 and d/t ratio = [Monomer(DMSO)2]/([Dimer]0)×100 at different initial concentrations of analyte [analyte]0 = 0.0, 1 × 10⁻³, 1 × 10⁻² and 0.1 M are a/t = 0%, 2%, 87% and 198% and d/t = 192%, 190%, 108%, 2% explaining the difficulties associated to analyte sensing. Please note that in DMSO the concentration of water has an effect; decreasing the water concentration does not have a significant impact (i.e. [H2O]0 = 0.05 M results in a/t = 0%, 2%, 89% and 198% and d/t = 200%, 198%, 110%, 2% respectively for [analyte]0 = 0.0, 1 10−3, 1 10−2 and 0.1 M), but if the concentration of water is higher Monomer(H2O)3 would be formed instead of Monomer(DMSO)2. For instance, considering [H2O]0 = 5 M and [analyte]0 = 1 × 10⁻² M Monomer(H2O)3 is formed and is more difficult to sense the analyte as the a/t, d/t, and m/t ratios are 7%, 6% and 186%. Increasing the concentration of analyte and considering [H2O]0 = 5 M and [analyte]0 = 0.1 M Monomer(analyte)2 species is formed. These ratios change to a/t, d/t, and m/t 154%, 1% and 45%, respectively.
Discussion
The synthesis of the targeted families is straightforward, from commercially available resources and in two high-yielding steps. The compounds, as anticipated, are isolated as dimers; however, post-synthesis, they are susceptible to absorbing moisture (H2O). In the solution phase, in the presence of coordinating solvents (DMSO or H2O) and at a millimolar level (1 mM), NMR diffusion, solution and ESI† studies propose a dimer–monomer equilibrium; this finding is in contrast to known Zn-salen complexes which exist as monomers under similar conditions.52,71 Variable temperature studies (NMR) would be insightful to elucidate at which temperature the monomeric or dimeric species will be favoured. Still, given that we aimed to develop an operational simple detection method, we did not proceed further.
We anticipated that coordinating solvent molecules, one or two, would occupy the vacant positions in the Zn coordination sphere and that slight excess of analyte would favour the formation of monomeric species C′ or C′′, respectively (Scheme 6), avoiding the presence other species (A′ or B′, Scheme 2). By doing so, a new single distinct peak corresponding to C′ or C′′ would appear in the NMR data, thus providing a new detection method (not two different peaks, one for the complex and one for the complex + analyte). However, the solvent-analyte exchange requires an extreme excess of the latter for a new distinct peak to appear in the 19F NMR spectrum. The above evidence (Fig. 5 & 6) suggests that this approach may be suitable for diamines but cannot be generalised. For example, the excess of phenylglicinol results in complex decomposition, formation of the Zn(analyte)x complex and release of the fluorinated ligand (Fig. 5, Zn-1-SS 1:150 ratio).
 |
| | Scheme 6 A summarising schematic representation of our working hypothesis. | |
 |
| | Fig. 6
19F NMR data of Zn-1-RR with various analytes SS-diaminocyclohexane A, R naphthyl ethylamine B, L – phenylalanine C, and Zn-2-RR with phenylglycinol (D) c = 1 mM, T = 303 K. | |
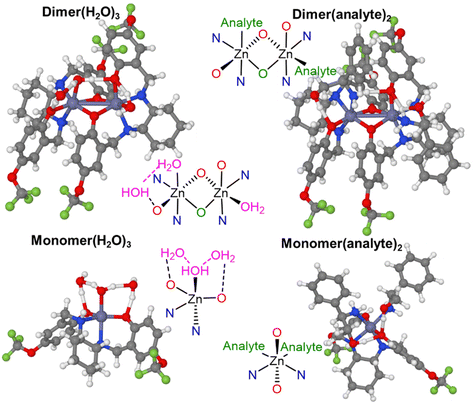 |
| | Fig. 7 Ball stick representation of the calculated structures of the Dimer(H2O)3, Dimer(analyte)2, Monomer(H2O)3 and Monomer(analyte)2, in chloroform. | |
 |
| | Fig. 8 Ball stick representation of the calculated structures of the Dimer(DMSO)2 and Monomer(DMSO)2, in DMSO. | |
Then, theoretical calculations were performed to shed light on the experimental findings. These calculations scrutinised the stability of all possible tetra-, penta- and hexa-coordinated Zn monomeric and dimeric species in the presence of coordinating and non-coordinating solvents and analytes. Different equilibriums are possible (Schemes 4 & 5), while speciation depends on concentration. The outcome favours unconventional hexa-coordinating species, which is a peculiar finding unsupported by the provided experimental evidence. However, these calculations explain that (a) the solvent-analyte exchange is energetically unfavourable and (b) the concentration of the H2O molecules significantly impacts this process and prohibits the development of a new sensing process at low concentrations.
Conclusions
For the first time, we examined the ability of fluorine-based Zn-salan complexes to function as amine sensors with 19F NMR. Being aware that these species will isolate as dimers, we aimed to obtain species C′ or C′′ with slight analyte excess, but this process is unfavourable due to the presence of coordinating solvents. Future synthetic efforts will focus on altering the organic framework and having the antenna close to the metal centre to ease the sensing process in non-coordinating solvents.
Author contributions
GEK devised the project with critical input from NBE. NBE synthesised and characterised the ligands and complexes and performed the 19F NMR sensing studies. GEK, GJT and SJC crystallographic data. AG and CK performed solution studies. YAH performed and helped with the evaluation of circular dichroism studies. RGM performed and evaluated MS studies. GRA performed diffusion 19F NMR studies. MB performed theoretical calculations. All authors contributed to the preparation of the article.
Conflicts of interest
There are no conflicts to declare.
Acknowledgements
N. B. E. thanks the TETFUND for financial support. G. E. K. thanks the EPSRC UK National Crystallography Service at the University of Southampton for collecting the crystallographic data.94 M. B. acknowledges financial support PID 2020-112762GB-I00 funded by MCIN/AEI/10.13039/501100011033. We thank Prof. Louise C. Serpell (Sussex Neuroscience) for accessing the Circular Dichroism (CD) apparatus.
References
- E. Zor, H. Bingol and M. Ersoz, Trends Anal. Chem., 2019, 121, 115662 CrossRef CAS.
- D. S. Hassan, F. Y. Thanzeel and C. Wolf, Chirality, 2020, 32, 457–463 CrossRef CAS PubMed.
- X. Liang, W. Liang, P. Jin, H. Wang, W. Wu and C. Yang, Chemosensors, 2021, 9, 1–23 CrossRef.
- F. Burg, S. Breitenlechner, C. Jandl and T. Bach, Chem. Sci., 2020, 11, 2121–2129 RSC.
- C. Wolf and K. W. Bentley, Chem. Soc. Rev., 2013, 42, 5408–5424 RSC.
- X. Niu, X. Yang, H. Li, J. Liu, Z. Liu and K. Wang, Microchim. Acta, 2020, 187, 676 CrossRef CAS PubMed.
- C. M. Kisukuri and L. H. Andrade, Org. Biomol. Chem., 2015, 13, 10086–10107 RSC.
- S. R. Laplante, L. D. Fader, K. R. Fandrick, D. R. Fandrick, O. Hucke, R. Kemper, S. P. F. Miller and P. J. Edwards, J. Med. Chem., 2011, 54, 7005–7022 CrossRef CAS PubMed.
- R. Jayakumar, R. Vadivel and N. Ananthi, Org. Med. Chem. Int. J., 2018, 5, 555661 Search PubMed.
- D. W. Armstrong, C. D. Chang and W. Y. Li, J. Agric. Food Chem., 1990, 38, 1674–1677 CrossRef CAS.
- Y. Hou, Z. Liu, L. Tong, L. Zhao, X. Kuang, R. Kuang and H. Ju, Dalton Trans., 2019, 49, 31–34 RSC.
- X. Yu, L. He, M. Pentok, H. Yang, Y. Yang, Z. Li, N. He, Y. Deng, S. Li, T. Liu, X. Chen and H. Luo, Nanoscale, 2019, 11, 15589–15595 RSC.
- L. A. Warning, A. R. Miandashti, L. A. McCarthy, Q. Zhang, C. F. Landes and S. Link, ACS Nano, 2021, 15, 15538–15566 CrossRef CAS PubMed.
- K. W. Bentley and C. Wolf, J. Am. Chem. Soc., 2013, 135, 12200–12203 CrossRef CAS PubMed.
- E. G. Shcherbakova, V. Brega, T. Minami, S. Sheykhi, T. D. James and P. Anzenbacher, Chem. – Eur. J., 2016, 22, 10074–10080 CrossRef CAS PubMed.
- Z. A. De los Santos, S. MacAvaney, K. Russell and C. Wolf, Angew. Chem., Int. Ed., 2020, 59, 2440–2448 CrossRef CAS PubMed.
- Z. A. De los Santos, C. C. Lynch and C. Wolf, Angew. Chem., Int. Ed., 2019, 58, 1198–1202 CrossRef CAS PubMed.
- K. W. Bentley, D. Proano and C. Wolf, Nat. Commun., 2016, 7, 12539 CrossRef PubMed.
- J. M. Dragna, G. Pescitelli, L. Tran, V. M. Lynch, E. V. Anslyn and L. Di Bari, J. Am. Chem. Soc., 2012, 134, 4398–4407 CrossRef CAS PubMed.
- W. Yang, K. R. Cadwallader, Y. Liu, M. Huang and B. Sun, Food Chem., 2019, 282, 153–163 CrossRef CAS PubMed.
- Z. Liu, Y. Xu, C. Y. Ji, S. Chen, X. Li, X. Zhang, Y. Yao and J. Li, Adv. Mater., 2020, 32, 1–9 CAS.
- S. R. Chaudhari and N. Suryaprakash, Org. Biomol. Chem., 2012, 10, 6410–6419 RSC.
- Z. Xu, C. Liu, S. Zhao, S. Chen and Y. Zhao, Chem. Rev., 2019, 119, 195–230 CrossRef CAS PubMed.
- Z. Chen, M. Yang, Z. Sun, X. Zhang, J. Xu, G. Bian and L. Song, Anal. Chem., 2019, 91, 14591–14596 CrossRef CAS PubMed.
- C. Dong, Z. Xu, L. Wen, S. He, J. Wu, Q. H. Deng and Y. Zhao, Anal. Chem., 2021, 93, 2968–2973 CrossRef CAS PubMed.
- M. S. Seo and H. Kim, J. Am. Chem. Soc., 2015, 137, 14190–14195 CrossRef CAS PubMed.
- C. M. Puentes and T. J. Wenzel, Beilstein J. Org. Chem., 2017, 13, 43–53 CrossRef CAS PubMed.
- Z. Sun, Z. Chen, Y. Wang, X. Zhang, J. Xu, G. Bian and L. Song, Org. Lett., 2020, 22, 589–593 CrossRef CAS PubMed.
- C. C. Hinckley, J. Am. Chem. Soc., 1969, 91, 5160–5162 CrossRef CAS PubMed.
- J. A. Dale, D. L. Dull and H. S. Mosher, J. Org. Chem., 1969, 34, 2543–2549 CrossRef CAS.
- W. H. Pirkle, D. L. Sikkenga and M. S. Pavlin, J. Org. Chem., 1977, 42, 384–387 CrossRef CAS.
- J. Bravo, C. Cativiela, J. E. Chaves, R. Navarro and E. P. Urriolabeitia, Inorg. Chem., 2003, 42, 1006–1013 CrossRef CAS PubMed.
- J. X. Yu, R. R. Hallac, S. Chiguru and R. P. Mason, Prog. Nucl. Magn. Reson. Spectrosc., 2013, 70, 25–49 CrossRef CAS PubMed.
- J. Yu, V. Kodibagkar, W. Cui and R. Mason, Curr. Med. Chem., 2005, 12, 819–848 CrossRef CAS PubMed.
- M. A. Danielson and J. J. Falke, Annu. Rev. Biophys. Biomol. Struct., 1996, 25, 163–195 CrossRef CAS PubMed.
- E. N. G. Marsh and Y. Suzuki, ACS Chem. Biol., 2014, 9, 1242–1250 CrossRef CAS PubMed.
- M. G. Boersma, T. Y. Dinarieva, W. J. Middelhoven, W. J. H. Van Berkel, J. Doran, J. Vervoort and I. M. C. M. Rietjens, Appl. Environ. Microbiol., 1998, 64, 1256–1263 CrossRef CAS PubMed.
- Y. Zhao and T. M. Swager, J. Am. Chem. Soc., 2015, 137, 3221–3224 CrossRef CAS PubMed.
- Y. Zhao, L. Chen and T. M. Swager, Angew. Chem., Int. Ed., 2016, 55, 917–921 CrossRef CAS PubMed.
- W. Wang, X. Xia, G. Bian and L. Song, Chem. Commun., 2019, 55, 6098–6101 RSC.
-
Y. Shimazaki, in Pure and Applied Chemistry, Walter de Gruyter GmbH, 2014, vol. 86, pp. 163–172 Search PubMed.
- H. Nagae, R. Aoki, S. N. Akutagawa, J. Kleemann, R. Tagawa, T. Schindler, G. Choi, T. P. Spaniol, H. Tsurugi, J. Okuda and K. Mashima, Angew. Chem., Int. Ed., 2018, 57, 2492–2496 CrossRef CAS PubMed.
- I. Caretti, E. Carter, I. A. Fallis, D. M. Murphy and S. Van Doorslaer, Phys. Chem. Chem. Phys., 2011, 13, 20427–20434 RSC.
- D. M. Murphy, I. Caretti, E. Carter, I. A. Fallis, M. C. Göbel, J. Landon, S. Van Doorslaer and D. J. Willock, Inorg. Chem., 2011, 50, 6944–6955 CrossRef CAS PubMed.
- B. Agrahari, S. Layek, R. Ganguly and D. D. Pathak, New J. Chem., 2018, 42, 13754–13762 RSC.
- S. Mouri, Z. Chen, H. Mitsunuma, M. Furutachi, S. Matsunaga and M. Shibasaki, J. Am. Chem. Soc., 2010, 132, 1255–1257 CrossRef CAS PubMed.
- S. Shaw and J. D. White, Chem. Rev., 2019, 119, 9381–9426 CrossRef CAS PubMed.
- S. M. Kirk, P. McKeown, M. F. Mahon, G. Kociok-Köhn, T. J. Woodman and M. D. Jones, Eur. J. Inorg. Chem., 2017, 5417–5426 CrossRef CAS.
- L. Chiang, K. Herasymchuk, F. Thomas and T. Storr, Inorg. Chem., 2015, 54, 5970–5980 CrossRef CAS PubMed.
- A. Thevenon, J. A. Garden, A. J. P. White and C. K. Williams, Inorg. Chem., 2015, 54, 11906–11915 CrossRef CAS PubMed.
- S. I. Sampani, V. Zdorichenko, M. Danopoulou, M. C. Leech, K. Lam, A. Abdul-Sada, B. Cox, G. J. Tizzard, S. J. Coles, A. Tsipis and G. E. Kostakis, Dalton Trans., 2020, 49, 289–299 RSC.
- S. Di Bella, Dalton Trans., 2021, 50, 6050–6063 RSC.
- R. Xu, L. Hua, X. Li, Y. Yao, X. Leng and Y. Chen, Dalton Trans., 2019, 48, 10565–10573 RSC.
- T. Nakamura, S. Tsukuda and T. Nabeshima, J. Am. Chem. Soc., 2019, 141, 6462–6467 CrossRef CAS PubMed.
- G. Salassa, M. J. J. Coenen, S. J. Wezenberg, B. L. M. Hendriksen, S. Speller, J. A. A. W. Elemans and A. W. Kleij, J. Am. Chem. Soc., 2012, 134, 7186–7192 CrossRef CAS PubMed.
- I. P. Oliveri and S. Di Bella, Chemistry, 2023, 5, 119–137 CrossRef.
- N. Kelly, K. Schnaars, K. Gloe, T. Doert, J. J. Weigand and K. Gloe, Aust. J. Chem., 2017, 70, 601–607 CrossRef CAS.
- A. L. Singer and D. A. Atwood, Inorg. Chim. Acta, 1998, 277, 157–162 CrossRef CAS.
- H. Adams, N. A. Bailey, D. E. Fenton, I. G. Ford, S. J. Kitchen, M. G. Williams, P. A. Tasker, A. J. Leong and L. F. Lindoy, J. Chem. Soc., Dalton Trans., 1991, 1665–1674 RSC.
- M. Karmakar, A. Frontera and S. Chattopadhyay, CrystEngComm, 2020, 22, 6876–6885 RSC.
- H. R. Wen, J. J. Hu, K. Yang, J. L. Zhang, S. J. Liu, J. S. Liao and C. M. Liu, Inorg. Chem., 2020, 59, 2811–2824 CrossRef CAS PubMed.
- S. Bunda, N. V. May, D. Bonczidai-Kelemen, A. Udvardy, H. Y. V. Ching, K. Nys, M. Samanipour, S. Van Doorslaer, F. Joó and N. Lihi, Inorg. Chem., 2021, 60, 11259–11272 CrossRef CAS PubMed.
- S. Bunda, K. Voronova, Á. Kathó, A. Udvardy and F. Joó, Molecules, 2020, 25, 3993 CrossRef CAS PubMed.
- N. Lihi, S. Bunda, A. Udvardy and F. Joó, J. Inorg. Biochem., 2020, 203, 110945 CrossRef CAS PubMed.
- A. Böttcher, H. Elias, E. G. Jäger, H. Langfelderova, M. Mazur, L. Müller, H. Paulus, P. Pelikan, M. Rudolph and M. Valko, Inorg. Chem., 1993, 32, 4131–4138 CrossRef.
- J. Devonport, J. Spencer and G. E. Kostakis, Dalton Trans., 2021, 50, 12069–12073 RSC.
- F. H. Allen, Acta Crystallogr., Sect. B: Struct. Sci., 2002, 58, 380–388 CrossRef PubMed.
- G. Li, X. Zhao, L. Wang and W. Liu, ChemistrySelect, 2019, 4, 9317–9321 CrossRef CAS.
- J. Dong, C. Tan, K. Zhang, Y. Liu, P. J. Low, J. Jiang and Y. Cui, J. Am. Chem. Soc., 2017, 139, 1554–1564 CrossRef CAS PubMed.
- C. He, J. Wang, P. Wu, L. Jia, Y. Bai, Z. Zhang and C. Duan, Chem. Commun., 2012, 48, 11880–11882 RSC.
- K. T. Hylland, S. Øien-Ødegaard, R. H. Heyn and M. Tilset, Eur. J. Inorg. Chem., 2020, 3627–3643 CrossRef CAS.
- C. He, Z. Lin, Z. He, C. Duan, C. Xu, Z. Wang and C. Yan, Angew. Chem., Int. Ed., 2008, 47, 877–881 CrossRef CAS PubMed.
- Y. Jiao, J. Zhang, L. Zhang, Z. Lin, C. He and C. Duan, Chem. Commun., 2012, 48, 6022–6024 RSC.
- Y. Liu, X. Wu, C. He, Z. Li and C. Duan, Dalton Trans., 2010, 39, 7727–7732 RSC.
- Y. Li, L. Wen, H. Meng, J. Lv, G. Luo and Y. Zhao, Cell Rep. Phys. Sci., 2020, 1, 100100 CrossRef.
- A. Böttcher, H. Elias, L. Müller and H. Paulus, Angew. Chem., Int. Ed. Engl., 1992, 31, 623–625 CrossRef.
- A. W. Addison, T. N. Rao, J. Reedijk, J. Van Rijn and G. C. Verschoor, J. Chem. Soc., Dalton Trans., 1984, 1349–1356 RSC.
- R. Evans, Z. Deng, A. K. Rogerson, A. S. McLachlan, J. J. Richards, M. Nilsson and G. A. Morris, Angew. Chem., Int. Ed., 2013, 52, 3199–3202 CrossRef CAS PubMed.
- P. Pracht, F. Bohle and S. Grimme, Phys. Chem. Chem. Phys., 2020, 22, 7169–7192 RSC.
-
M. J. Frisch, G. W. Trucks, H. B. Schlegel, G. E. Scuseria, M. A. Robb, J. R. Cheeseman, G. Scalmani, V. Barone, G. A. Petersson, H. Nakatsuji, X. Li, M. Caricato, A. V. Marenich, J. Bloino, B. G. Janesko, R. Gomperts, B. Mennucci, H. P. Hratchian, J. V. Ortiz, A. F. Izmaylov, J. L. Sonnenberg, D. Williams, F. Ding, F. Lipparini, F. Egidi, J. Goings, B. Peng, A. Petrone, T. Henderson, D. Ranasinghe, V. G. Zakrzewski, J. Gao, N. Rega, G. Zheng, W. Liang, M. Hada, M. Ehara, K. Toyota, R. Fukuda, J. Hasegawa, M. Ishida, T. Nakajima, Y. Honda, O. Kitao, H. Nakai, T. Vreven, K. Throssell, J. A. Montgomery Jr., J. E. Peralta, F. Ogliaro, M. J. Bearpark, J. J. Heyd, E. N. Brothers, K. N. Kudin, V. N. Staroverov, T. A. Keith, R. Kobayashi, J. Normand, K. Raghavachari, A. P. Rendell, J. C. Burant, S. S. Iyengar, J. Tomasi, M. Cossi, J. M. Millam, M. Klene, C. Adamo, R. Cammi, J. W. Ochterski, R. L. Martin, K. Morokuma, O. Farkas, J. B. Foresman and D. J. Fox, Gaussian 16, Revision C.01, Gaussian, Inc., Wallin, 2016 Search PubMed.
- P. J. Stephens, F. J. Devlin, C. F. Chabalowski and M. J. Frisch, J. Phys. Chem., 1994, 98, 11623–11627 CrossRef CAS.
- C. Lee, W. Yang and R. G. Parr, Phys. Rev. B: Condens. Matter Mater. Phys., 1988, 37, 785–789 CrossRef CAS PubMed.
- A. D. Becke, J. Chem. Phys., 1993, 98, 5648–5652 CrossRef CAS.
- S. Grimme, J. Comput. Chem., 2006, 27, 1787–1799 CrossRef CAS PubMed.
- R. Ditchfield, W. J. Hehre and J. A. Pople, J. Chem. Phys., 1971, 54, 724–728 CrossRef CAS.
- P. C. Hariharan and J. A. Pople, Theor. Chim. Acta, 1973, 28, 213–222 CrossRef CAS.
- M. Dolg, U. Wedig, H. Stoll and H. Preuss, J. Chem. Phys., 1987, 86, 866–872 CrossRef CAS.
- G. Scalmani and M. J. Frisch, J. Chem. Phys., 2010, 132, 114110 CrossRef PubMed.
- J. Tomasi, B. Mennucci and R. Cammi, Chem. Rev., 2005, 105, 2999–3093 CrossRef CAS PubMed.
- N. J. Ataie, Q. Q. Hoang, M. P. D. Zahniser, Y. Tu, A. Milne, G. A. Petsko and D. Ringe, Biochemistry, 2008, 47, 7673–7683 CrossRef CAS PubMed.
- J. L. Moore, J. Oppelt, L. Senft, A. Franke, A. Scheitler, M. W. Dukes, H. B. Alix, A. C. Saunders, S. Karbalaei, D. D. Schwartz, I. Ivanović-Burmazović and C. R. Goldsmith, Inorg. Chem., 2022, 61, 19983–19997 CrossRef CAS PubMed.
- M. Besora and F. Maseras, Wiley Interdiscip. Rev.: Comput. Mol. Sci., 2018, 8, e1372 Search PubMed.
- R. Pérez-Soto, M. Besora and F. Maseras, Org. Lett., 2020, 22, 2873–2877 CrossRef PubMed.
- S. J. Coles and P. A. Gale, Chem. Sci., 2012, 3, 683–689 RSC.
|
| This journal is © The Royal Society of Chemistry 2023 |
Click here to see how this site uses Cookies. View our privacy policy here. 
 Open Access Article
 This Open Access Article is licensed under a
  a,
Antal
Galvácsi
b,
Csilla
Kállay
a,
Antal
Galvácsi
b,
Csilla
Kállay