
 Open Access Article
 This Open Access Article is licensed under a Creative Commons Attribution-Non Commercial 3.0 Unported Licence
Polymorphism and polymorph-dependent luminescence properties of the first lithium oxonitridolithosilicate Li3SiNO2:Eu2+†
Kilian M.
Rießbeck
 a,
Daniel S.
Wimmer
a,
Markus
Seibald
b,
Dominik
Baumann
b,
Klaus
Wurst
a,
Gunter
Heymann
a and
Hubert
Huppertz
*a
a,
Daniel S.
Wimmer
a,
Markus
Seibald
b,
Dominik
Baumann
b,
Klaus
Wurst
a,
Gunter
Heymann
a and
Hubert
Huppertz
*a
aDepartment of General, Inorganic and Theoretical Chemistry, Universität Innsbruck, Innrain 80-82, A-6020 Innsbruck, Austria. E-mail: Hubert.Huppertz@uibk.ac.at; Web: https://www.uibk.ac.at/en/aatc/ag-huppertz
bams-OSRAM International GmbH, Mittelstetter Weg 2, D-86830 Schwabmünchen, Germany
First published on 15th March 2023
Abstract
Building on studies of monoclinic Li3SiNO2, a polymorph, β-Li3SiNO2, with a previously unknown structure type was synthesized. The β-phase crystallizes in the orthorhombic space group Pbca (no. 61) with lattice parameters of a = 18.736(2), b = 11.1267(5), c = 5.0897(3) Å, and a cell volume of V = 1057.2(1) Å3. Using high-temperature solid-state reactions in sealed tantalum tubes, it was possible to obtain high purity samples (<5 wt% of side phase LiSi2N3 according to Rietveld analysis) containing exclusively one or the other polymorph, depending solely on the cooling rate. In contrast to the monoclinic phase, orthorhombic β-Li3SiNO2 additionally contains a third layer and shows a layer-sequence of the type ABCB. Doped with the activator ion Eu2+, the new polymorph exhibits an intense yellow emission (λmax = 586 nm, fwhm = 89 nm, 0.33 eV, 2650 cm−1) under irradiation with UV to blue light. Hence, the structural difference between the two polymorphs goes along with a significant blue-shift of 16 nm. The results from single-crystal diffraction and single-grain luminescence measurements were confirmed by Rietveld analysis of bulk samples and powder luminescence data.
Introduction
The most well-known luminescent materials and also those with the most commercial applications are oxides, such as YAG:Ce3+ and nitrides, for example CASN (Ca1−xSrxAlSiN3:Eu2+).1–5 Therefore, it seems obvious to combine these fields and search for phosphors that take advantage of the potentially greater structural diversity offered by oxonitrides.6 Here silicates can provide high stability against thermal decomposition and rigid structures, which are desirable properties for potential rare earth doped luminescent materials.7–9 Prominent examples for oxonitride and oxonitridosilicate phosphors are the blue to yellow Ca/Sr/BaSi2O2N2:Eu2+, the green β-SiAlON:Eu2+ and the red SALON.10–13In the field of lithium oxonitridosilicates, several representatives have been proposed in the past, first by Juza et al. and later by Podsiadło et al.14–18 Nevertheless, until now only a few of them could be synthetically proven and elucidated structurally by single-crystal or even powder X-ray diffractometry.18,19 Among the compounds introduced by Podsiadło et al., the first mention of Li3SiNO2 can be found, including different possible starting materials as well as temperatures of synthesis and decomposition. These findings were based on DTA, DTG, TG, and powder X-ray diffraction, but without the deposition of a structure model.15
As reported before,20 it was now possible to find a synthesis pathway, which led to the growth of measurable single-crystals of Li3SiNO2. After LiSiON, the compound Li3SiNO2 is only the second lithium oxonitridosilicate to be elucidated based on single-crystal diffraction data, the second after LiSiON:Eu2+/(Mn2+) with known luminescence properties and the first, which exhibits lithium ions not only in tetrahedral coordination: in all the aforementioned compounds, lithium is exclusively fourfold coordinated and acts as part of the combined network of the tetrahedrally coordinated silicon and lithium ions. In contrast, Li3SiNO2 exhibits lithium ions also in higher coordination as completing cations, which occupy the cavities of the tetrahedra network, making it the first lithium oxonitridolithosilicate.18,19,21 These findings set the compound in structural proximity to the alkali lithosilicates, however, with lithium as the only alkali cation. Based on the work of Hoppe et al., the alkali lithosilicates are characterized by an anionic network of tetrahedra with both silicon and lithium as central atoms and higher coordinated alkali cations to complete the structure.22 In the past decade, a variety of phosphors belonging to this class have been discovered, particularly those related to the UCr4C4-structure type.23–25
Polymorphism is a common phenomenon especially in structures, which can be described as layer-like, such as SiC.26 In its simplest form, it appears as polytypism, where the differences lie only in the stacking pattern of the layers. Although this study is not about a phyllosilicate, parallels can easily be drawn due to the structure, which can be described as built by alternating layers containing either just metal ions or silicate chains as well as metal ions. However, the differences between monoclinic α-Li3SiNO2 and the newly found orthorhombic variation β-Li3SiNO2 consist not only in a deviating stacking sequence but also in a different structure of one of the layers itself.
Regarding luminescent materials, polymorphism is of great interest, as it allows a comparison of any occurring changes in the crystal structure with their effects on the emission properties. In this way, deeper insights into structure–property relationships can be gained, in particular with regard to the interactions between host and doping agent. This also is an important step in the journey, which should one day enable us to precisely tailor phosphors for any desired application.
Examples of luminescent materials showing polymorphism are NaAlSiO4:Eu2+, where the polymorphs are accessible via different synthesis temperatures, SrSi2N2O2:Eu2+ and Ca1−xSrxAlSiN3:Eu2+, both exhibiting the aforementioned polytypism and Sr2LiAlO4:Eu2+, where an ordering phenomenon occurs, which leaves the stacking unchanged.2,27–29 In contrast, polymorphism in Li3SiNO2 results in the creation of an additional layer. The synthetic controllability of phase formation is done via the cooling rate, which is also known for the intrinsic luminescent K3YSi2O7.30
In this article, a detailed description of the crystal structure of the novel β-Li3SiNO2 as well as on the luminescence properties when doped with Eu(II) will be given. Additionally, the differences between the α- and the β-polymorph regarding structure, luminescence, and synthesis are discussed briefly.
Results and discussion
The syntheses, which led to the discovery of this novel polymorph were originally intended to combine two aspects of the temperature profile, which have been found to be beneficial for α-Li3SiNO2: firstly, a synthesis temperature of 960 °C and secondly a cooling rate of 0.1 °C min−1, both were applied with the intention of growing larger crystals. Surprisingly, a completely new phase was obtained showing a previously unknown structure type with significant structural differences to the α-polymorph and consequently also different luminescence properties if Eu(II) as an activator is provided.β-Li3SiNO2, when synthesized according to the described route, is a white powder exhibiting crystals of typically several tens of μm with plate to needle-like shape. When doped with Eu(II), the product shows a beige color under white light.
All discussed data were obtained from samples containing a formal ratio of 2 mol% Eu (based on overall Li-content) except for one of the powder samples for Rietveld analysis, here one doped and one undoped sample have been used.
Crystal structure
As the powder X-ray diffraction (PXRD) measurement of the product yielded an unexpected pattern, single-crystals were isolated for a detailed structural investigation. The solution and refinement of the X-ray diffraction data revealed the presence of a new polymorph of Li3SiNO2 crystallizing in the orthorhombic space group Pbca (no. 61) with the lattice parameters a = 18.736(2), b = 11.1267(5), c = 5.0897(3) Å, and a volume of V = 1061.0(2) Å3. The crystallographic and refinement data of the novel compound, designated as β-Li3SiNO2, can be found in Table 1. A visualization of the Rietveld analysis of a doped sample can be seen in Fig. 5. More details are given in the ESI:† Wyckoff positions, atomic coordinates and equivalent isotropic displacement parameters are listed in Table S2,† anisotropic displacement parameters in Table S3,† and interatomic distances in Table S4.† See Fig. S1† for the Rietveld analysis of an undoped sample, Table S1† for the resulting values of the Rietveld refinements and Fig. S2† for a comparison of the PXRD patterns of both polymorphs.| Parameter | Value |
|---|---|
| Empirical formula | β-Li3SiNO2 |
| Molar mass/g mol−1 | 94.7 |
| Crystal system | Orthorhombic |
| Space group | Pbca (no. 61) |
| Powder data of β-Li 3 SiNO 2 | |
| Powder diffractometer | STOE Stadi P |
| Radiation | Mo-Kα1 (λ = 70.93 pm) |
| a/Å | 18.7462(5) |
| b/Å | 11.1270(4) |
| c/Å | 5.0897(2) |
| V/Å3 | 1061.66(5) |
| Single-crystal data of β-Li 3 SiNO 2 :Eu 2+ | |
| Single-crystal diffractometer | Bruker D8 Quest Kappa |
| Radiation | Mo-Kα (λ = 71.073 pm) |
| a/Å | 18.736(2) |
| b/Å | 11.1267(5) |
| c/Å | 5.0897(3) |
| V/Å3 | 1061.0(2) |
| Formula units per cell Z | 16 |
| Calculated density/g cm−3 | 2.4203 |
| Crystal size/mm3 | 0.020 × 0.020 × 0.020 |
| Temperature/K | 293 |
| Absorption coefficient/mm−1 | 0.884 |
| F (000)/e | 748 |
| θ-Range/° | 2.17–32 |
| Range in hkl | ±27, ±16, ±7 |
| Reflections total/independent | 31![[thin space (1/6-em)]](https://www.rsc.org/images/entities/char_2009.gif) 987/1740 987/1740 |
| R int | 0.0899 |
| Reflections with I ≥ 2σ(I) | 1144 |
| Data/ref. parameters | 1740/128 |
| Absorption correction | Multi-scan |
| Final R1/wR2 [I ≥ 2σ(I)] | 0.0380/0.0778 |
| Final R1/wR2 (all data) | 0.0667/0.0876 |
| Goodness of fit on F2 | 1.18 |
| Largest diff. peak/hole/e Å−3 | 0.66/−0.37 |
Based on the bond length-bond strength calculations for the α-phase and considerations on coordination and linkage patterns, the positions of the oxygen and nitrogen atoms were distinguished in the refinement, particularly also because incorrectly assigned atoms resulted in significant over- or underoccupancies.20
The 3D structure of β-Li3SiNO2 can formally be described as built up from three different, condensed layers. Two of these layers, in the following referred to as A and C, contain zweier single chains of [SiN2O2]-tetrahedra, allowing the compound to be classified as an inosilicate.31,32 In combination with the [Li(N,O)4]-tetrahedra, which occur in dimers and in chains, a 3D connected lithosilicate tetrahedra network is formed. This framework is completed by five- and sixfold coordinated Li-ions, which occupy the cavities.
Layer A, shown in Fig. 1, consists of zweier single chains of [SiN2O2]-tetrahedra that are corner-linked via the N-atoms. The bond lengths in these tetrahedra vary for Si1–O between 1.656(2) and 1.680(2) Å and for Si1–N between 1.716(2) and 1.720(2) Å, which is similar to the values in the literature and the sum of the ionic radii.33 These zweier single chains of [SiN2O2]-tetrahedra are connected via common corners and edges with units representing dimers with respect to layer A. These dimers are formed by two edge-sharing [LiNO3]-tetrahedra of the Li5-atoms. The bond length of this lithium ion varies for Li5–O between 1.910(4) and 2.400(4) Å and is 1.960(4) Å for Li5–N.
 | ||
Fig. 1 Structure of layer A with its building units and the therein occurring coordination: in (a), the coordination sphere of the Li5 position with bond lengths to N1, O1, and O3 is shown, while (b) depicts the edge-sharing unit consisting of two [LiNO3]-tetrahedra (orange). (c) shows the [SiN2O2]-tetrahedron of the Si1 position and the related bond lengths to the N1, the O1, and the O3 position. (d) Illustrates the zweier single chain, which is formed by these tetrahedra (blue). In (e), an excerpt of layer A viewed along [![[1 with combining macron]](https://www.rsc.org/images/entities/char_0031_0304.gif) 00] can be seen with unit cell edges drawn in (black lines). For clarity reasons, just the polyhedra are depicted here. 00] can be seen with unit cell edges drawn in (black lines). For clarity reasons, just the polyhedra are depicted here. | ||
Layer B (Fig. 2) contains solely lithium in different coordination on the cation sites. Firstly, there are chains of [LiO4]-tetrahedra, which are all edge-linked with each other. In these chains, the Li2 sites form the backbone and the Li1 sites act as branches. The Li–O bond lengths for the Li1 position are in the range of 1.912(3) to 1.941(3) Å, for Li2 they vary between 1.943(4) and 2.178(4) Å. Secondly, there is a chain of Li-octahedra, where the [LiN4O2]-octahedra of the Li3 site form the backbone edge-linked via two N-atoms each and the distorted [LiN2O4]-octahedra of the disordered Li4 site act as branches. The two described chains within layer B are linked together via common edges. The bond lengths of the octahedrally coordinated lithium ions have values of 2.053(4) and 2.058(4) Å for Li3–O and from 2.210(4) to 2.517(4) Å for Li3–N. For the distorted site, they are in the range from 1.993(5) to 3.03(6) Å for Li4–O, from 2.172(5) to 2.245(5) Å for Li4–N, from 2.02(2) to 2.55(2) Å for Li4a–O and from 2.63(2) to 2.65(2) Å for Li4a–N. As reported elsewhere, the electron density around the Li4 position was approximated during the refinement with two distinct positions Li4 and Li4a. For this purpose, the occupation was first refined and then manually adjusted to obtain equal isotropic displacement factors for both positions.20
 | ||
| Fig. 2 Structure of layer B with its building units and the therein occurring coordination: (a) shows the coordination sphere of the Li2 position with bond lengths to O3 and O4, and (b) the coordination sphere of the Li1 position with bond lengths to O1–O4. In (c), the edge-linked chain of these two [LiO4]-tetrahedra can be found (orange). (d) Shows the [LiN4O2]-octahedron of the Li3 position and the related bond lengths to N1, N2, O1, and O2, and (e) the coordination sphere of the disordered octahedrally coordinated Li4/a position with the bonds of the Li4 position to N1, N2, O1, O2, O3, and O4 depicted in orange and the bonds of the Li4a position to the same anions depicted in green. In (f), the chain, which is formed by these two octahedra, can be seen (light and dark green), while (g) shows an excerpt of layer B viewed along [00] with unit cell edges drawn in (black lines). For clarity reasons, just the polyhedra are depicted here. | ||
Fig. 3 shows layer C, which is also composed of two alternating chains. First, there is a corner-linked zweier single chain of the [SiN2O2]-tetrahedra of the Si2 site analogous to the [SiN2O2]-chain of layer A and second, there is an edge-linked chain of the distorted [LiNO4]-trigonal bipyramids of the fivefold coordinated Li6 site. Here, the central lithium ion lies approximately in the centre of a triangle of two O- and one N-ion, while two additional O-ions have significantly longer bond lengths leading to a 3 + 2-coordination. Accordingly, the Li6–N distance is 1.983(4) Å, the shorter Li6–O distances are 1.938(4) and 2.065(4) Å, while the longer distances amount to 2.627(4) and 2.649(4) Å. For the Si2 position, there are Si2–O distances of 1.652(2) and 1.678(2) Å and Si2–N distances of 1.718(2) and 1.726(2) Å. Layer C can be described as a variation of layer A, where a reverse orientation of the silicon tetrahedra and the resulting shift of the Li-position leads to a different interconnection scheme, namely a chain of trigonal bipyramids instead of dimers of tetrahedra. For a visualization of this correlation, see Fig. S3 in the ESI.†
 | ||
| Fig. 3 Structure of layer C with its building units and the therein occurring coordination: in (a), the coordination sphere of the Si2 position with bond lengths to N2, O2, and O4 is shown, while (b) depicts the corner-linked zweier single chain of the [SiN2O2]-tetrahedra (blue). (c) Shows the trigonal bipyramid of [LiNO4] with the central Li6 position and the related bond lengths to N1, O2, and O4, while (d) shows the chain, which is formed by these bipyramids (yellow). In (e), an excerpt of layer C is illustrated, viewed along [00] with unit cell edges drawn in (black lines). For clarity reasons, just the polyhedra are depicted here. | ||
The three described layers are edge- and corner-linked to each other and stacked along the crystallographic a-axis in a sequence of ABCB or more precisely ABCB′A′B′′C′B′′′, if translation and mirroring of the layers are considered. These transformations are described by the symmetry operations of the space group Pbca (P21/b 21/c 21/a) namely the inversion center, the glide planes, and the 21 screw-axes.
The described crystal structure of β-Li3SiNO2, visualized in Fig. 4, represents a hitherto unknown structure type. Nevertheless, several structural motifs can be found in other compounds. Most obvious are the parallels to α-Li3SiNO2, where layer A as well as layer B can be found as described here (Fig. 1 & 2), but in lack of a third layer, in alternating order or again more precisely in a sequence of ABA′B′. As reported, from layer A one can draw a parallel to isostructural layers in Na2Mn2S3 and Na6In2S6.20,34,35
 | ||
| Fig. 4 Illustration of the overall structure of β-Li3SiNO2 viewed along [001] on the right, which is composed of the condensed layers A, B, and C (seen in [00] direction) shown on the left in a sequence of ABCB. For clarity reasons, just the polyhedra are depicted here and the edges of one unit cell are marked. | ||
In this work, unlike in most other cases, it was possible to obtain an indication of the positions most likely to be occupied by the Eu(II)-ions. This appeared to be feasible due to the great difference in mass between Li(I) and Eu(II), which led to remaining electron density at the Li1 and Li2 positions. Further considerations on plausibility are given below in the section on luminescence.
To prove the single-crystal data to be representative for the obtained powder sample, Rietveld refinements based on the above-described structure model have been conducted for doped and undoped samples. As evidence of the high phase content of 94% β-Li3SiNO2 in the Eu(II)-doped powder sample, Fig. 5 shows the visualized results of the Rietveld analysis. The associated values are listed in Table S1 in the ESI.†
 | ||
| Fig. 5 Rietveld refinement of the X-ray diffraction data from an Eu(II)-doped powder sample of β-Li3SiNO2. The measured pattern is shown in black, the calculated pattern in red, the difference curve in turquiose and the tick marks of the theoretical positions for the reflections are shown in green for β-Li3SiNO2 and in orange for the side phase LiSi2N3. | ||
Luminescence
When β-Li3SiNO2 is doped with Eu (formal 2 mol% relative to the content of lithium), an intense yellow luminescence is observed under irradiation with UV- to blue light as shown in Fig. 6. | ||
| Fig. 6 Powder sample of β-Li3SiNO2:Eu2+ under white light on the lower left and under UV-light (365 nm) on the upper right. | ||
Obviously, the compound does not exhibit a divalent cation, which would be predestinated for substitution by Eu(II). Nevertheless, there are many examples from literature for Eu-ions on or near Li(I)-positions, for example the above-mentioned LiSiNO:Eu2+ or RbKLi2[Li3SiO4]4:Eu2+ where also the mechanism for charge-compensation by unoccupied neighboring Li(I)-positions is postulated.21,36 Furthermore, since the title compound is an oxonitride, the additional positive charge could also be compensated by local anionic substitution of oxygen by nitrogen.
Spectroscopic measurements with an excitation wavelength of 448 nm on a powder sample reveal the emission peak to be located at λmax = 590 nm with a full width at half maximum (fwhm) of 89 nm (0.33 eV, 2657 cm−1). This kind of emission profile is characteristic for Eu(II) and caused by the parity allowed 4f6(7F)5d1 → 4f7(8S7/2) transition.37,38
For the recording of an excitation spectrum, the raw data maximum of the emission has been used for monitoring the intensity. In this way, the peak of excitation was found to be positioned at 374 nm. The comparison, shown in Fig. 7, between spectroscopic and structural data of a single-crystal (586 nm, fwhm 89 nm/0.33 eV/2650 cm−1) and the powder sample demonstrates that the crystal is representative for the sample. Thus, the crystal structure described above can be associated with the luminescence properties presented here. The slight red-shift of the powder emission, visible in Fig. 7, can be explained by reabsorption and a total Eu-content slightly deviating from that of the single-crystal. The good agreement between single-crystal and powder emission in combination with the results from the Gauß-fit below indicates, that the spectroscopic measurements are not influenced by the side phase LiSi2N3, which also has its excitation peak at higher energies, when doped with Eu(II).39
 | ||
| Fig. 7 Excitation spectrum (purple line, monitored at λem = 568 nm; raw data maximum), emission spectrum (yellow line, λexc = 448 nm) of a powder sample and emission spectrum of a single-crystal (grey line, λexc = 448 nm) of β-Li3SiNO2:Eu2+. | ||
For Eu(II) doped phosphors, the intensity of luminescence is known to be strongly dependent on temperature due to the increasing percentage of non-radiative electron transitions at higher temperatures. Since the behavior of luminescent materials at elevated temperatures is of great interest with respect to any application in solid-state lighting, a thermal quenching experiment has been conducted (see Fig. 8).40 At the highest temperature of 225 °C, the powder sample shows an integral intensity of 63% of the value at room temperature, while it is still at 85% at 125 °C, which is a common temperature in pc-LED applications.
 | ||
| Fig. 8 Thermal-quenching behavior of a β-Li3SiNO2:Eu2+ powder sample visualized by the normalized integral intensity of emission relative to the intensity at room temperature versus temperature. | ||
A determination of the quantum efficiency was also attempted, but no reliable value could be obtained due to the presence of strongly absorbing inseparably small black residual particles originating from corrosion of the tantalum tube.
Although the emission profile of β-Li3SiNO2:Eu2+ resembles a usual unimodal profile at first glance, a bimodal Gauß-fit on the wavenumber scale yielded considerably better results. Combined with the findings from structure refinement suggesting realistic amounts of europium as explanation for remaining electron density at the Li1 and the Li2 sites, this could be seen as first hint to solving the pressing question, where the activator ion is located.
Synthesis optimization led to better powder samples also for α-Li3SiNO2:Eu2+. This allowed to obtain luminescence data with higher resolution also for this polymorph. A subsequent Gauß-fit revealed a bimodal decomposition similar to that in β-Li3SiNO2:Eu2+. The decomposed emission spectra for both polymorphs can be found in Fig. S4 (ESI†). Since the Eu(II)-ions apparently occupy similar positions in both polymorphs, it is likely that also the quantum efficiencies are in the same range. For α-Li3SiNO2:Eu2+ values above 30% have been reported.20
Fig. 9 and 10 show that the emission peaks of the two polymorphs differ by 16 nm. To explain this, a differing distribution of the europium content on the two most likely europium hosting sites Li1 and Li2 of the polymorphs was initially considered. However, as the bimodal Gauß-fit shows shifting of both modes instead of an intensity variation (see Fig. S4 and Table S5 in the ESI†), the answer probably needs to be sought in the local environment of the sites. For this purpose, the volumes of the coordination polyhedra of all lithium ions, which exist in both polymorphs, are plotted in Fig. 11.
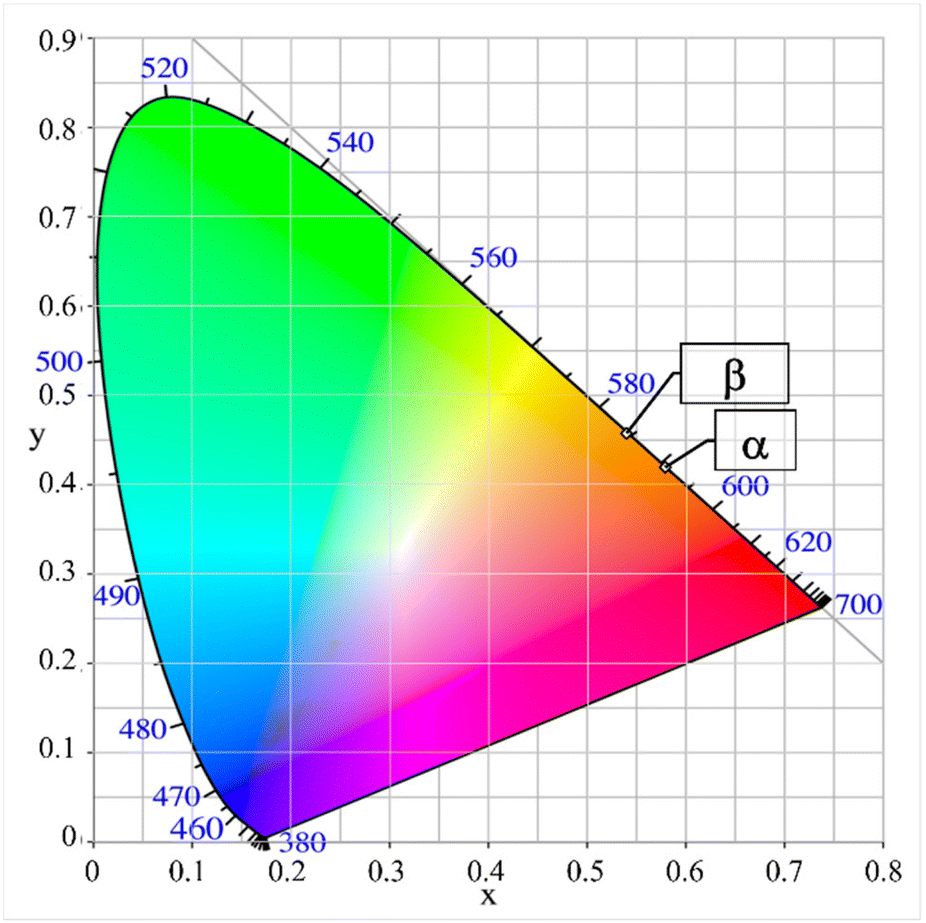 | ||
| Fig. 9 CIE-diagram with the color points of powder samples of the polymorphs α- and β-Li3SiNO2:Eu2+. | ||
 | ||
| Fig. 10 Comparison of the powder emission spectra of α- and β-Li3SiNO2:Eu2+ under irradiation with blue light (448 nm). | ||
 | ||
| Fig. 11 The coordination polyhedron volumes of all lithium ions, which are present in both polymorphs, are compared. | ||
The tetrahedron volume of the Li2-position in β-Li3SiNO2 has an increased volume of 14% with respect to the same position in α-Li3SiNO2. If an Eu(II)-ion is incorporated here, an even larger polyhedron would be formed, whose spatial requirements would have to be compensated by structure relaxation. Nevertheless, the volumes of the Li2-tetrahedra in both polymorphs could act as indicator for the unobservable polyhedron size of Eu(II), even if it is very unlikely that it is still a tetrahedron. For a possible 4 + 2 coordination, the local environment of the Li2-position is shown in Fig. S5 in the ESI.† In this case, the average bond length of Li2 to the coordination anions is rounded 2.4 Å. This value is already in the range of Ca–N bonds in the well-known europium host Ca2Si5N8 (2.3 to 3.1 Å).41
An increased volume of the Eu(II)-polyhedra in β-Li3SiNO2:Eu2+ would reduce the crystal-field splitting and thereby lead to a shorter emission wavelength compared with α-Li3SiNO2:Eu2+.42
Looking at the neighboring voids of the Li2-position (see Fig. 2 & 4), a larger expansion of the resulting polyhedron can be expected, when occupied by europium. This, in combination with the change in polyhedron volume consistent with the observed blue-shift for β-Li3SiNO2, supports Li2 as the dominant site for incorporation of europium. In addition, the configuration of the Li2 polyhedra as a chain resembles many known phosphors, in particular from the substance class of alkali lithosilicates.23–25 Nevertheless, since the volume change between the polymorphs is inverted for Li1, the explanatory approaches mentioned so far cannot yet conclusively clarify the different luminescence and structural differences in the wider environment that have not been taken into account, such as different rigidity, would have to be used for the explanation of the blue-shift (Table 2).
| α-Li3SiNO2(:Eu2+) | β-Li3SiNO2(:Eu2+) | |
|---|---|---|
| Crystal system | Monoclinic | Orthorhombic |
| Space group | C2/c (no. 15) | Pbca (no. 61) |
| Cell parameters a | 10.4901(3) Å | 18.736(2) Å |
| b | 11.0342(3) Å | 11.1267(5) Å |
| c | 5.1186(2) Å | 5.0897(3) Å |
| β | 116.14(1)° | |
| Cell volume | 531.87 (2) Å3 | 1061.0 (2) Å3 |
| Luminescence maximum (single-crystal) | 602 nm (2.04 eV, 16484 cm−1) |
586 nm (2.1 eV, 16948 cm−1) |
| Full width at half maximum (single-crystal) | 90 nm (0.31 eV, 2544 cm−1) | 89 nm (0.33 eV, 2650 cm−1) |
| Luminescence maximum (powder sample) | 607 nm (2.03 eV, 16345 cm−1) |
590 nm (2.08 eV, 16810 cm−1) |
| Full width at half maximum (powder sample) | 92 nm (0.32 eV, 2576 cm−1) | 89 nm (0.33 eV, 2657 cm−1) |
Conclusion
As this contribution as well as Latshaws30 clearly shows, the cooling rate during the synthesis is a powerful tool to select one polymorph according to its energetic state. Utilizing this knowledge on the described compound, a new phase designated as β-Li3SiNO2 could be obtained and characterized. While in many cases a separate synthesis of polymorphs is very challenging if even possible, it was successful regarding Li3SiNO2 with very high selectivity. This could be confirmed by powder X-ray diffraction data as well as luminescence spectroscopy. Like the α-phase, the new polymorph crystallizes in an again unseen structure type possessing interesting luminescence properties when Eu(II) as activator ion is provided. Although it is not fully clarified yet, which crystallographic site the Eu(II) ion occupies, considerations have been made to explain the blue-shift from 602 nm (α-Li3SiNO2) to 586 nm (β-Li3SiNO2).Both polymorphs hold potential for use in pc-LED applications, especially in the area of single phosphor converted LEDs or amber emitting devices, due to their relatively inexpensive synthesis regarding starting materials and energy consumption.43 However, some optimization is still needed in terms of luminescence efficiency and thermal quenching behavior. But maybe even more beneficial for the future of luminescent materials are the correlations between synthesis, structure, and luminescence properties elucidated in this work, which emphasize the importance of a controlled thermal synthesis management for tailoring of phosphor materials.
As shown, the new substance class of lithium oxonitridolithosilicates can be of great interest not only from the perspective of a seeker for luminescence materials, but also from the viewpoint of a solid-state chemist, since it was not exactly expectable that such compounds as Li3SiNO2 without heavy cations could be stable.
Experimental section
Synthesis
As some of the starting materials are moisture sensitive and may react or decompose under atmospheric conditions, all preparations were carried out using an inert gas (Ar 5.0, Messer Austria GmbH) filled glovebox (MBraun, O2 < 1 ppm, H2O < 1 ppm). The starting materials Si3N4 (49.1 mg, UBE SN-E10, >99.9%) and Li2O (41.9 mg, Sigma Aldrich, 97%) with a stoichiometric ratio of 1:4 were weighed and mixed along with 5 wt% LiF (5.0 mg, Sigma Aldrich, >99.99%) as flux and for doped samples with 2 mol% EuF2 (4.0 mg, Alfa Aesar, >99.9%) in an agate mortar. Afterwards the powder mixture was filled into a tantalum ampoule and sealed via arc welding under argon atmosphere. The reaction vessel was then placed inside an ampoule from silica glass containing a low-pressure inert gas atmosphere (400 mbar, Ar 5.0, Messer Austria GmbH). The temperature profile for the synthesis of β-Li3SiNO2 consists of a heating ramp with 4 °C min−1 up to 960 °C, a dwelling time of 4 h and subsequently a cooling ramp to 500 °C with 0.1 °C min−1 and a second one to 150 °C with 0.3 °C min−1. For the synthesis of α-Li3SiNO2, heating and dwelling are just as described above but the cooling is done via a ramp with 0.3 °C min−1 to 300 °C. Once cooled down to room temperature, the samples could be opened and further examined under atmospheric conditions without detectable decomposition after several months.
Microscopy
A Leica M125 stereomicroscope with external light sources SCHOTT KL1500 LCD and KL2500 LCD and a Leica DFC420 camera, was used for sample examination, documentation, and preparation of single-crystals.Single-crystal X-ray diffraction
For structural investigations based on single-crystals, a Bruker D8 Quest diffractometer (Mo-Kα radiation, λ = 0.71073 Å), equipped with a Photon III detector, was used. Multiscan absorption correction and data processing were done using the SAINT44 and SADABS45 software tools. The structure was solved using charge flipping implemented in Superflip,46,47 the refinement was done with Jana2006.48 Pictures of the crystal structure were generated using DIAMOND 4.6.4.49 Polyhedron volumes were calculated using VESTA Ver. 3.5.7.50 Further crystallographic data can be found under the deposition number 2220391 at the joint Cambridge Crystallographic Data Centre and Fachinformationszentrum Karlsruhe Access Structures Service https://www.ccdc.cam.ac.uk/structures.†Powder X-ray diffraction
A STOE STADI P X-ray diffractometer (Mo-Kα1 radiation, λ = 0.7093 Å) with a Ge(111)-monochromator and a Dectris Mythen 1K detector in modified Debye–Scherrer geometry was used for collection of diffraction data from powder samples. With Topas 4.2,51 Rietveld refinement was carried out to verify the cell parameters from single-crystal analysis and to assess the phase composition of the product. Identification of the secondary phase was done using the ICDD PDF-2 2021 database.52 The diffraction pattern can be found in Fig. S1 & S2.†Luminescence spectroscopy
To generate emission spectra of single-crystals and μm-sized agglomerates or powder piles, a setup of a blue laser diode (λ = 448 nm, THORLABS, Newton, NJ, USA) and a CCD Detector (AVA AvaSpec 2048, AVANTES, Apeldoorn, Netherlands) connected with the Software AVA AvaSoft (version 7) was used (wavelength range recorded: 470.7–900 nm; step size: 0.33 nm). The excitation spectrum of a powder sample was recorded on a Fluoromax 4 spectrophotometer (Horiba, Japan) (wavelength range: 280–450 nm; step size: 1 nm) using the raw data maximum of emission (568 nm) as monitoring wavelength. With this device, also the thermal-quenching behavior was examined.Author contributions
Syntheses, preparation and characterization of the title compounds via PXRD-measurements and Rietveld refinement were carried out by K. M. R. as well as the solution of the crystal structure of β-Li3SiNO2 and parts of the luminescence spectroscopy. More in-depth spectroscopic analysis was conducted by M. S and D. B., while G. H. and K. W. collected the single-crystal data and helped in finding the best solution. K. M. R. wrote the manuscript, which was then reviewed by D. S. W., M. S., D. B., and H. H. The whole project was supervised by M. S., D. B., and H. H.Conflicts of interest
The authors declare no conflict of interest regarding this articleAcknowledgements
The authors would like to thank Christiane Stoll for her support in the single-grain and powder luminescence measurements (ams-OSRAM International GmbH) and Daniel S. Wimmer for preliminary work in this field. Parts of this work are supported by the German Federal Ministry of Economic Affairs and Climate Action (Bundesministerium für Wirtschaft und Klimaschutz) in the frame of the “Important Project of Common European Interest (IPCEI) on microelectronics”.All the authors have accepted responsibility for the entire content of this submitted manuscript and approved submission.
References
- P. Pust, P. J. Schmidt and W. Schnick, Nat. Mater., 2015, 14, 454–458 CrossRef CAS PubMed.
- T. Fiedler, S. Dirksmeyer, M. Seibald, F. Hummel, S. Peschke, G. M. Achrainer and D. Bichler, Chem. – Eur. J., 2020, 26, 795–798 CrossRef CAS PubMed.
- H. Watanabe and N. Kijima, J. Alloys Compd., 2009, 475, 434–439 CrossRef CAS.
- Z. Xia and A. Meijerink, Chem. Soc. Rev., 2017, 46, 275–299 RSC.
- L. Chen, C.-C. Lin, C.-W. Yeh and R.-S. Liu, Materials, 2010, 3, 2172–2195 CrossRef CAS.
- R.-J. Xie and N. Hirosaki, Sci. Technol. Adv. Mater., 2007, 8, 588 CrossRef CAS.
- M. Zeuner, S. Pagano and W. Schnick, Angew. Chem., Int. Ed., 2011, 50, 7754–7775 CrossRef CAS PubMed.
- N. C. George, K. A. Denault and R. Seshadri, Annu. Rev. Mater. Res., 2013, 43, 481–501 CrossRef CAS.
- C. Cheng, L. Ning, X. Ke, M. S. Molokeev, Z. Wang, G. Zhou, Y. C. Chuang and Z. Xia, Adv. Opt. Mater., 2020, 8, 1901608 CrossRef CAS.
- Y. Q. Li, A. C. A. Delsing, G. d. With and H. T. Hintzen, Chem. Mater., 2005, 17, 3242–3248 CrossRef CAS.
- V. Bachmann, C. Ronda, O. Oeckler, W. Schnick and A. Meijerink, Chem. Mater., 2009, 21, 316–325 CrossRef CAS.
- N. Hirosaki, R.-J. Xie, K. Kimoto, T. Sekiguchi, Y. Yamamoto, T. Suehiro and M. Mitomo, Appl. Phys. Lett., 2005, 86, 211905 CrossRef.
- G. J. Hoerder, M. Seibald, D. Baumann, T. Schröder, S. Peschke, P. C. Schmid, T. Tyborski, P. Pust, I. Stoll, M. Bergler, C. Patzig, S. Reißaus, M. Krause, L. Berthold, T. Höche, D. Johrendt and H. Huppertz, Nat. Commun., 2019, 10, 1–9 CrossRef CAS PubMed.
- A. Kraśnicka and S. Podsiadło, J. Therm. Anal., 1988, 34, 305–310 CrossRef.
- S. Podsiadło, J. Therm. Anal., 1987, 32, 43–47 CrossRef.
- S. Podsiadło, J. Therm. Anal., 1987, 32, 445–449 CrossRef.
- S. Podsiadło, J. Therm. Anal., 1987, 32, 771–775 CrossRef.
- R. Juza, H. H. Weber and E. Meyer-Simon, Z. Anorg. Allg. Chem., 1953, 273, 48–64 CrossRef CAS.
- Y. Laurent, F. Grekov, J. David and J. Guyader, Ann. Chim., 1980, 5(8), 647–655 CAS.
- D. S. Wimmer, K. M. Rießbeck, M. Seibald, D. Baumann, K. Wurst, G. Heymann and H. Huppertz, Dalton Trans., 2022, 51, 16465–16478 RSC.
- Y. Y. Ma, F. Xiao, S. Ye, Q. Y. Zhang, Z. H. Jiang and Y. Qian, ECS J. Solid State Sci. Technol., 2012, 1, R1–R6 CrossRef CAS.
- R. Hofmann and R. Hoppe, Z. Anorg. Allg. Chem., 1988, 560, 35–46 CrossRef CAS.
- D. Dutzler, M. Seibald, D. Baumann and H. Huppertz, Angew. Chem., Int. Ed., 2018, 57, 13676–13680 CrossRef CAS PubMed.
- F. Ruegenberg, A. García-Fuente, M. Seibald, D. Baumann, S. Peschke, W. Urland, A. Meijerink, H. Huppertz and M. Suta, Adv. Opt. Mater., 2021, 9, 2101643 CrossRef CAS.
- Z. Xia, Z. Xu, M. Chen and Q. Liu, Dalton Trans., 2016, 45, 11214–11232 RSC.
- H. Romanus, L. Spiess and G. Teichert, Mater. Sci. Forum, 1998, 264, 437–440 Search PubMed.
- M. Zhao, Z. Xia, M. S. Molokeev, L. Ning and Q. Liu, Chem. Mater., 2017, 29, 6552–6559 CrossRef CAS.
- M. Seibald, T. Rosenthal, O. Oeckler, C. Maak, A. Tücks, P. J. Schmidt, D. Wiechert and W. Schnick, Chem. Mater., 2013, 25, 1852–1857 CrossRef CAS.
- G. J. Hoerder, S. Peschke, K. Wurst, M. Seibald, D. Baumann, T. Schröder, D. Bichler, G. M. Achrainer and H. Huppertz, Z. Naturforsch., 2019, 74b, 765–772 CrossRef.
- A. M. Latshaw, G. Morrison, K. D. zur Loye, A. R. Myers, M. D. Smith and H.-C. zur Loye, CrystEngComm, 2016, 18, 2294–2302 RSC.
- F. Liebau, Die Naturwiss., 1962, 49, 481–482 CrossRef CAS.
- F. Liebau, Structural chemistry of silicates: structure, bonding, and classification, Springer Science & Business Media, 2012 Search PubMed.
- R. D. Shannon, Acta Crystallogr., Sect. A: Cryst. Phys., Diffr., Theor. Gen. Crystallogr., 1976, 32, 751–767 CrossRef.
- K. Klepp, P. Böttcher and W. Bronger, J. Solid State Chem., 1983, 47, 301–306 CrossRef CAS.
- B. Eisenmann and A. Hofmann, Z. Kristallogr. – Cryst. Mater., 1991, 197, 151–152 CrossRef CAS.
- D. Dutzler, M. Seibald, D. Baumann, F. Philipp, S. Peschke and H. Huppertz, Z. Naturforsch., 2019, 74b, 535–546 CrossRef.
- A. A. Setlur, Electrochem. Soc. Interface, 2009, 18, 32 CrossRef CAS.
- M. Seibald, T. Rosenthal, O. Oeckler, F. Fahrnbauer, A. Tücks, P. J. Schmidt and W. Schnick, Chem. – Eur. J., 2012, 18, 13446–13452 CrossRef CAS PubMed.
- Y. Li, N. Hirosaki, R. Xie, T. Takeka and M. Mitomo, J. Solid State Chem., 2009, 182, 301–311 CrossRef CAS.
- V. Bachmann, C. Ronda and A. Meijerink, Chem. Mater., 2009, 21, 2077–2084 CrossRef CAS.
- T. Schlieper and W. Schnick, Z. Anorg. Allg. Chem., 1995, 621, 1037–1041 CrossRef CAS.
- K. A. Denault, J. Brgoch, M. W. Gaultois, A. Mikhailovsky, R. Petry, H. Winkler, S. P. DenBaars and R. Seshadri, Chem. Mater., 2014, 26, 2275–2282 CrossRef CAS.
- C. C. Lin and R.-S. Liu, J. Phys. Chem. Lett., 2011, 2, 1268–1277 CrossRef CAS PubMed.
- Bruker SAINT, v8.34a, M. Bruker AXS Inc., WI, USA, 2014 Search PubMed.
- L. Krause, R. Herbst-Irmer, G. M. Sheldrick and D. Stalke, J. Appl. Crystallogr., 2015, 48, 3–10 CrossRef CAS PubMed.
- G. Oszlányi and A. Sütő, Acta Crystallogr., Sect. A: Found. Crystallogr., 2004, 60, 134–141 CrossRef PubMed.
- L. Palatinus and G. Chapuis, J. Appl. Crystallogr., 2007, 40, 786–790 CrossRef CAS.
- V. Petříček, M. Dušek and L. Palatinus, Z. Kristallogr. – Cryst. Mater., 2014, 229, 345–352 CrossRef.
- K. Brandenburg, DIAMOND-Crystal and molecular structure visualization, Crystal Impact GbR, Bonn, 2020 Search PubMed.
- K. Momma and F. Izumi, J. Appl. Crystallogr., 2011, 44, 1272–1276 CrossRef CAS.
- TOPAS, version 4.2, M. Bruker AXS Inc., WI, USA, 2009 Search PubMed.
- S. Gates-Rector and T. Blanton, Powder Diffr., 2019, 34, 352–360 CrossRef CAS.
Footnote |
| † Electronic supplementary information (ESI) available. CCDC 2220391. For ESI and crystallographic data in CIF or other electronic format see DOI: https://doi.org/10.1039/d2dt03921d |
| This journal is © The Royal Society of Chemistry 2023 |