 Open Access Article
Creative Commons Attribution 3.0 Unported Licence
Synthesis of cesium lead bromide nanoparticles by the ultrasonic bath method: A polar-solvent-free approach at room temperature†
Govind B.
Nair
 *a,
R.
Krishnan
 ab,
Arno
Janse van Vuuren
c and
H. C.
Swart
 *a
*a
aDepartment of Physics, University of the Free State, P. O. Box 339, Bloemfontein 9300, South Africa. E-mail: govind1291@yahoo.com; Nair.GB@ufs.ac.za; swarthc@ufs.ac.za
bExtreme Light Infrastructure-Nuclear Physics (ELI-NP), ‘Horia Hulubei’ National R&D Institute for Physics and Nuclear Engineering (IFIN-HH), 077125 Măgurele, Ilfov, Romania
cCentre for HRTEM, Nelson Mandela University, Port Elizabeth, 6001, South Africa
First published on 17th November 2022
Abstract
Colloidal synthesis of CsPbBr3 nanoparticles (NPs) is often carried out by involving polar solvents that threaten the chemical stability of the NPs. Here, we report a polar-solvent-free synthesis of all-inorganic CsPbBr3 NPs by employing an ultrasonic bath approach. The phase evolution of the CsPbBr3 NPs strongly depended on the duration of ultrasonication. A secondary phase of Cs4PbBr6 was also found to evolve, which emitted narrow blue-emission bands. For the longest period of ultrasonication (12 h), the CsPbBr3 and Cs4PbBr6 phases co-existed to produce blue and green emission bands with a photoluminescence quantum yield (PLQY) of 53%. The purest form of CsPbBr3 phases was observed for the NPs produced by sonicating the precursors for 8 h. They exhibited narrow green emission bands with a PLQY of 50%. The power-conversion efficiency of a silicon solar cell was remarkably increased when coated with the CsPbBr3 NPs, thus, proving its potential to be used as a spectral downshifter for Si solar cells.
1. Introduction
All-inorganic perovskites (AIPs) have garnered tremendous attention due to their photovoltaic, luminescence, and optoelectronic applications.1–3 In contrast to organic–inorganic hybrid halide perovskites, AIPs exhibit better stability against environmental factors such as thermal stress, illumination, and humidity.4,5 Despite being the most sensational material that revolutionized the photovoltaic industry, there were always certain struggles and hardships experienced while producing high-quality perovskite nanocrystals (PNCs).AIP NCs were first introduced by Kovalenko et al. through the hot-injection (HI) synthesis method.6 Although the HI method was successful in realizing cesium lead halide (CsPbX3; X = Cl, Br, I) perovskites with different shapes and morphologies, the protocols involved in the synthesis were complex. The requirement of a vacuum environment, inert atmosphere and high temperatures limited the applicability of HI methods for the large-scale production of PNCs. Moreover, the complex requirements for the synthesis elevated the production costs involved in HI methods and affected the reproducibility of the NCs.4 Citing these issues, several other synthesis strategies were developed and implemented to eliminate the shortcomings experienced in the HI method. Facile processing methods such as ligand-assisted reprecipitation (LARP)7,8 and room-temperature supersaturated recrystallization processes9 have been developed to achieve high-quality AIP NCs at a relatively lower cost. These methods were widely adopted owing to their ability to control the shape of the NCs and the possibility to scale up the synthesis process for large-scale production of the NCs. However, these methods depended greatly on the polar solvents such as N,N-dimethylformamide (DMF) and dimethyl sulfoxide (DMSO) for mixing the precursor salts. AIP NCs are highly sensitive to the polar solvents as they can either get degraded or dissolved in those solvents easily.10,11 Furthermore, DMF and DMSO can induce defects in CsPbX3 NCs.12 These issues can be addressed by adopting polar-solvent-free synthesis strategies and ensuring high-quality product yields at a lower production cost and effort.
Ultrasonication is one of the feasible methods that can be employed to produce AIP NCs by eliminating the use of polar solvents, and thus, eradicating the threats posed by the solvents on the quality of the NCs. Compared to HI and LARP methods, ultrasonication does not require any heating and can be practiced as a ‘one-pot’ synthesis process. Synthesis strategies assisted by ultrasonication were previously adopted to successfully produce CsPbBr3 NCs.12,13 Xu et al. proceeded with a one-step precipitation strategy to produce CsPbBr3 nanoplatelets (NPLs) and ultrasonicated these NPLs to obtain their quantum dots (QDs).13 However, their strategy was incomplete without HBr and acetone, which were essential for precipitating the NPLs and QDs out of the precursor solution. In contrast, Rao et al. demonstrated a suitable polar-solvent-free approach by completely relying on ultrasonication to obtain high-quality CsPbBr3 NCs.12 They varied the power and duration of the ultrasound waves as well as the quantity of the capping ligands to obtain NCs of different shapes and sizes. The ultrasound waves were channelled to the precursor solution using a high-power tip-sonicator system. A tip-sonicator passes a focussed beam of ultrasound waves that can rapidly produce nanocrystals in a short span of time. Nevertheless, this method comes with certain limitations and challenges. The probe of the tip-sonicator must always be in contact with the solution, which can introduce contaminants that can hamper the quality of the final NCs. Furthermore, it is challenging to reproduce the results using a tip-sonicator as the position of the probe immersed in the solution can differ from the results. Also, the sonication effect is more focused on the vicinity of the probe, so, the solution will require mixing and often stirring between the sonication cycles to obtain a homogenized result. Due to high-power streaming through the probe, the temperature of the solution can rise, causing unintentional heating and, consequently, leading to the formation of defects in the NCs. CsPbBr3 NCs experience adverse effects at higher temperatures and they transition from the optically active phase to an optically inactive phase. Hence, it is necessary to frequently monitor the temperature to avoid the formation of the optically inactive phase of the NCs. Also, it is not possible to perform continuous sonication of the solution to avoid the rise in temperature.
This work addressed these issues by adopting a simple ultrasonic bath method to produce CsPbBr3 nanoparticles (NPs). Compared to tip-sonicator equipment, an ultrasonic bath has a very cost-effective setup that disperses ultrasound waves of lower power across the solution without introducing any probe directly into it. This eliminates the possibility of the solution being contaminated. As the ultrasound waves of low power are dispersed across the medium, the chances of the solution getting heated are very low. The temperature of the synthesis remains below 50 °C and there is no risk of the emergence of the optically inactive phase of the NCs using this approach. This rules out the need for frequent monitoring of the temperature. In addition, in-person attendance throughout the synthesis process is not required unlike other synthesis protocols. Considering these benefits, the preparation of CsPbBr3 NPs by the ultrasonic bath method was preferred and different durations of ultrasonication were tested and all other parameters were kept constant. However, the control over the synthesis parameters and particle size homogeneity get compromised while using an ultrasonic bath. Due to the lack of fine control over the synthesis parameters, the nanoparticles obtained from the ultrasonic bath process can often be a mixture of multiple phases.
2. Experimental
Chemicals
The following chemicals were used in this study: CsBr (cesium bromide 99.9%, Sigma-Aldrich), PbBr2 (lead(II) bromide ≥98%, Sigma-Aldrich), oleylamine (Acros Organics), oleic acid (≥99%, Sigma-Aldrich), and toluene (ACE Ltd, South Africa). All the chemicals were used without further purification and processing.Synthesis of CsPbBr3 NPs by the ultrasonic bath method
0.1 mmol CsBr (21.28 mg) and 0.1 mmol PbBr2 (36.70 mg) were added into 5 ml of toluene in a glass beaker. 0.1 ml of oleic acid (OA) and 0.2 ml of oleylamine (OAm) were also added to the solvent. The beaker along with the contents was immersed in an ultrasonic water bath (Bandelin Sonorex) and ultrasound waves were passed through the solution. Sonication was provided for different durations of time (viz. 2 h, 4 h, 6 h, 8 h, 10 h and 12 h). The temperature of the solution was recorded during ultrasonication and it was found that the temperature varied between 40 and 45 °C. On the successful reaction of the precursors, the solvent gradually transformed from a transparent liquid to a yellowish solution. To remove the bigger particles and the unreacted precursors, the entire solution was centrifuged at 6000 rpm for 10 min. The supernatant was discarded and the precipitates were redispersed in 5 ml of toluene. The redispersed solution was centrifuged for 5 min at 6000 rpm and the supernatant was collected for further characterization. Hereafter, the NPs prepared at 2 h, 4 h, 6 h, 8 h, 10 h and 12 h shall be addressed as CPB2, CPB4, CPB6, CPB8, CPB10 and CPB12, respectively.Characterization
The X-ray diffraction (XRD) patterns of the synthesized CsPbBr3 NPs were acquired using a Bruker D8 Advance diffractometer (Bruker, Germany) operated at a wavelength of 1.5406 Å (Cu-Kα radiation) at 40 kV and 40 mA. The diffractometer was attached with a 2.2 kW Cu-anode, Lynx Eye detector and ceramic X-ray tube as the source. The ultraviolet and visible (UV-Vis) absorption spectra of the CsPbBr3 colloidal solutions were recorded using a PerkinElmer 950 lambda spectrophotometer. The high-resolution transmission electron microscopy (HR-TEM) images and selected-area electron diffraction (SAED) patterns of the colloidal particles were obtained using a JEOL JEM 2100. X-ray photoelectron spectroscopy (XPS) survey scans were performed using a PHI Quantes Dual Scanning X-ray Photoelectron Microprobe with a pass energy of 280 eV in energy steps of 1 eV per step and a stay time of 50 ms per step. The binding energy (BE) charge correction for adventitious carbon (C 1s) was achieved by correcting the reference BE value of 284.8 eV. The peak fitting and analysis of the XPS scans were performed using XPS peak 4.1 software. The steady-state photoluminescence (PL) spectra were recorded using an Edinburgh FS5 spectrofluorometer equipped with a 150 W xenon lamp and a slit width of 0.5 nm. Time-resolved photoluminescence (TRPL) and PL quantum yield (PLQY) measurements were recorded using an Edinburgh FLS 980 spectrofluorometer using the 360 nm emitting picosend pulsed light emitting diode (EPLED) module pulsating at 1 μs and the integrating sphere, respectively. The photocurrent–voltage (I–V) curves were recorded using a solar simulator (VeraSol Class AAA) equipped with a Keithley 2450 source meter and LSS-7120 controller under AM1.5G illumination. Prior to measurements, the calibration of the light intensity was carried out using a reference cell (Newport 91150V). The perovskite NPs were coated on a 33 cm × 28 cm Si cell using the drop-casting method.3. Results and discussion
Although the synthesis process was aimed at obtaining a pure phase of CsPbBr3 NPs, an alternate phase of Cs4PbBr6 also appeared in most samples. To record the XRD patterns, the perovskite solutions were spin-coated on silicon wafers (with (1 0 0) orientation plane) several times and dried. Fig. 1 shows the XRD patterns of cesium lead bromide NPs prepared by ultrasonication of the precursors for different durations. The NPs exhibited dual phases of CsPbBr3 and Cs4PbBr6 corresponding to the standard JCPDS data #18-0364 and #73-2478, respectively. In the cases of CPB2 and CPB4, the NPs existed in a mixed phase with the hexagonal phase of Cs4PbBr6 as the dominant one. These patterns also showed some peaks corresponding to PbBr2, thus, indicating the presence of unreacted PbBr2 precursors. This is evident from the XRD patterns shown in Fig. 1. The delayed dissolution of PbBr2 resulted in a Cs-rich solution that favoured the formation of the Cs4PbBr6 phase for the lower durations of ultrasonication. However, the phase of the NPs was found to evolve into the monoclinic phase of CsPbBr3 for CPB6, CPB8 and CPB10. The Cs4PbBr6 phase was found to be suppressed and the trace peaks of PbBr2 completely vanished for CPB6, CPB8 and CPB10. This probably resulted from a better reaction between the precursors at a longer duration of ultrasonication. The CPB8 NPs yielded the purest CsPbBr3 phase and no visible traces of the Cs4PbBr6 phase were detected in its XRD pattern. On the other hand, CPB6 and CPB10 NPs resulted in the formation of dominant CsPbBr3 NPs with some traces of the Cs4PbBr6 phase. Since the CPB8 NPs yielded a nearly pure phase of CsPbBr3, it was expected that higher durations of ultrasonication should also yield similar results. But contradicting these expectations, the CPB10 and CPB12 NPs produced higher proportions of the Cs4PbBr6 phase. From these observations, it can be concluded that longer durations of ultrasonication produced adverse effects on the quality of the NPs and may have disintegrated the CsPbBr3 phase to form a more stable 0-dimensional Cs4PbBr6 phase.14 The passage of ultrasound waves for longer durations elevated the synthesis temperature to around 45 °C, which might have favoured the formation of the Cs4PbBr6 phase. The crystallite size of CPB8 NPs was determined to be 97 nm using the Williamson–Hall (W–H) plot as shown in Fig. S1.† The XRD pattern of CPB8 NPs featured only three groups of peaks as compared to the standard pattern for the monoclinic CsPbBr3 bulk material. This is due to the preferred orientation of the nanoparticles along specific crystal planes. When spherical nanoparticles are deposited on a surface, there will be a random distribution of crystal plane orientations with respect to the diffraction angle. As a result, relative peak intensities of the stimulated XRD pattern for the bulk material may be observed for spherical nanoparticles. In contrast, when the particles are non-spherical, the distribution of the nanoparticles will be in non-random directions, and they will be dried on the surface of the substrate with a preferential orientation. As a result, the XRD patterns will reflect different relative peak intensities depending on the morphology of non-spherical nanoparticles. Additionally, the XRD pattern will show only a certain specific number of peaks depending on the preferred orientation of the nanoparticle and it might not be like the XRD pattern of their corresponding bulk material. This phenomenon has been discussed in detail by Holder and Schaak.15 In this work, the sheet-like nanostructures of CPB8 NPs preferred to align with their (0 0 1), (1 0 0), and (1 1 0) faces parallel to the silicon wafer. Hence, the only observable XRD peaks corresponded to the crystal planes parallel to (0 0 1), (1 0 0), (1 1 0), (0 0 2), and (2 0 0).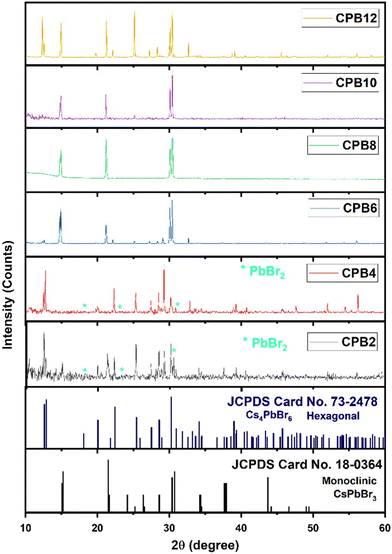 | ||
| Fig. 1 XRD patterns of CPB2, CPB4, CPB6 CPB8, CPB10 and CPB12 NPs that were synthesized at different durations of ultrasonication: 2 h, 4 h, 6 h, 8 h and 12 h, respectively. | ||
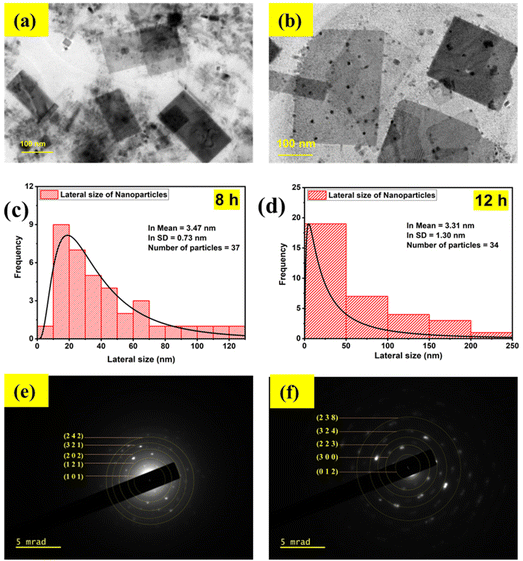
The ultrasound waves also induced changes in the morphology, which is evident from the TEM images shown in Fig. 2(a) and (b). The CPB8 NPs exhibited a sheet-like structure with a mean particle size of 32 nm. Additionally, the TEM images of CPB8 showed inhomogeneity with the presence of small irregularly shaped particles. The degree of inhomogeneity was higher for CPB12 NPs which showed distinct kinds of particles that differed in both size and shape. Some NPs retained the sheet-like morphology, while many smaller particles with spherical or irregular shapes became more prominent. It can be suspected that the longer duration of ultrasound waves induced these changes in the morphology. The average particle sizes of the NPs were determined using the Gatan Microscopy suite. Fig. 2(c) and (d) show the particle-size distribution of the NPs and the average size of the particles through a lognormal distribution curve. Their corresponding SAED patterns are shown in Fig. 2(e) and (f). The electron diffraction patterns of CPB8 [Fig. 2(e)] were found to match with the XRD patterns of monoclinic CsPbBr3. But the electron diffraction pattern of CPB12 NPs [Fig. 2(e)] showed more resemblance to the XRD patterns of the hexagonal Cs4PbBr6.
The chemical states and binding energies of each constituent element were determined by XPS. The primary interest of this XPS analysis was to investigate how the ultrasonication time duration induced a change in the chemical environment and BE of the elements in CsPbBr3 perovskite nanocrystals. The known binding energy of the pollutant carbon (C 1s) is 284.8 eV and was used as a reference to standardize the photoelectron lines of other elements in CsPbBr3 perovskite nanocrystals.
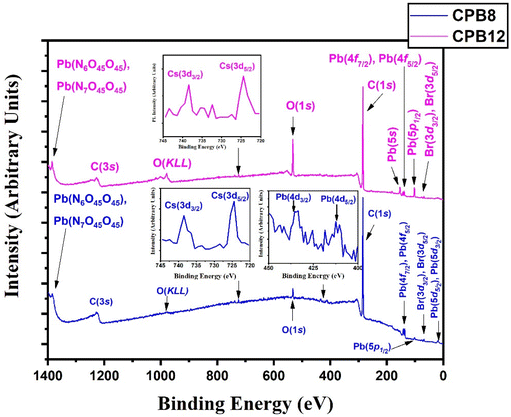
Fig. 3 shows the wide scan XPS spectra of CPB8 and CPB12 measured from 0 to 1400 eV. The survey spectra of CPB8 and CPB12 evidently authorize the major core levels (Cs 3d, Pb 4d, Br 3d, O 1 s, and C 1s) and Auger lines in the CsPbBr3 nanocrystals. The intensity of the binding energy lines and Auger lines for the Cs, Pb, Br, and O elements in CPB8 was comparatively higher than the ones found in CPB12. In contrast, the binding energy intensity of the C (1s) lines was relatively higher in CPB12 than in CPB8, which might be due to the elapsed interaction of species with oleic acid and oleylamine. To further explore the shift in BE and the change in the chemical state, narrow scan XPS analyses were performed for the CsPbBr3 perovskite nanocrystals ultrasonicated at different durations during the synthesis. It was observed that three main elements (Pb, Br, O) were identified from the high-energy XPS analysis to explore the effects of ultrasonication duration on CsPbBr3 perovskite nanocrystals. Fig. 4 displays the high-energy XPS spectra of Pb (4f), Br (3d), and O (1s) regions of the elements in CPB8 and CPB12. Fig. 3(a and b) shows the deconvoluted Pb 4f (Pb 4f7/2 and Pb 4f5/2) regions in CPB8 and CPB12, respectively, during the synthesis. The CPB8 NPs have a maximum of three well-separated doublets (Fig. 3(a)) identified at 137.7/142.6 eV, 138.3/143.2, and 139.0/143.9 eV which corresponds to the +2-oxidation state of Pb with the interaction of Pb–O, CsPbBr3, and Pb–Br,16–19 respectively. But the XPS spectra of CPB12 also splits into two doublets (Fig. 3(b)) with an additional highly intense pair of peaks found at 136.6/141.5, which is due to the interaction between the elemental Pb and oleate.20–22 Hence, the XPS spectra of CPB12 demonstrated an increase of Pb–oleate species compared to CPB8. These features can be visualized from the peak fitting. Fig. 3(c and d) shows the high-resolution XPS spectra of the Br (3d) region for CPB8 and CPB12, respectively. The narrow scan XPS spectra of CPB8 showed a low-intense BE at 68.0 eV, and a high-intensity peak was found at 68.8 eV, which are ascribed to the Pb–Br interactions in Cs4PbBr6 and CsPbBr3, respectively.17,22,23 The Br (3d) region of CPB12 has high intense binding energy lines at 68.2 eV and a low intense peak at 69.4 eV, which also corresponds to the Pb–Br interaction in Cs4PbBr6 and CsPbBr3, respectively.24 The binding energy peak at 69.4 eV due to Br 3d5/2 and Br 3d3/2 splitting was found to be stronger in CPB12, thus suggesting a higher concentration of the Cs4PbBr6 phase. In contrast, the CsPbBr3 phase was dominantly present in CPB8, and this was evident from the stronger BE peak at 68.0 eV. The XPS binding energy spectra of the O 1s region of CPB8 comprise three deconvoluted peaks located at 530.7 eV, 532.1 eV, and 532.8 eV assigned to Pb–O25 and O–H adsorption,26,27 and O2− and carbon via sp2 orbitals,28 respectively. But, the O 1s region of CPB12 also split into three peaks. The peak at 531.3 eV can be ascribed to the formation of superoxide (O2−),26 and the binding energy line observed at 532.2 eV can be attributed to the interaction of O–H groups.26 The photoelectron line at 533.2 eV is assigned to the interaction between H2O in the hydrated perovskite surface and the organic oleate compounds due to surface-level adsorption.29 From the high-energy XPS spectra, we assume that the CPB12 NPs showed a change in their surface electronic properties compared to CPB8 NPs. This change in surface-level electronic properties might be due to the prolonged interaction of the organic species and atmospheric surface contaminations. The XPS spectra of Cs (3d) and C (1s) regions in CPB8 and CPB12 NPs are furnished in Fig. S1 (ESI†). The XPS spectra of the Cs (3d) and C (1s) regions in the CPB8 and CPB12 NPs didn't show any remarkable change with respect to the peak position and the BE values. Fig. S2(a and b†) illustrates the deconvoluted XPS spectra of Cs 3d core levels in CPB8 and CPB12, respectively. The Cs 3d region has two well-separated doublets due to the Cs 3d3/2 & Cs 3d5/2 electronic states. The binding energies of the first doublet observed at 723.6/737.5 eV for CPB8 and 723.5/737.4 eV for CPB12 were assigned to the Cs 3d region in the CsPbBr3 nanocrystals. The binding energy of the second doublet was observed at 724.6/738.5 eV exactly for both CPB8 and CPB12 NPs, and it is due to the interaction of the Cs–N group.30 Fig. S1(c and d†) shows the XPS spectra of the fitted C (1s) region in CPB8 and CPB12, respectively. The XPS spectra of the C (1s) region in CPB8 and CPB12 split into two peaks. The binding energy at 284.8 eV corresponds to the interaction of C–C/C–H groups.31 The other peaks located at 285.7 eV for 8 h and 286.0 eV for CPB12 were attributed to the interaction between C and O.31
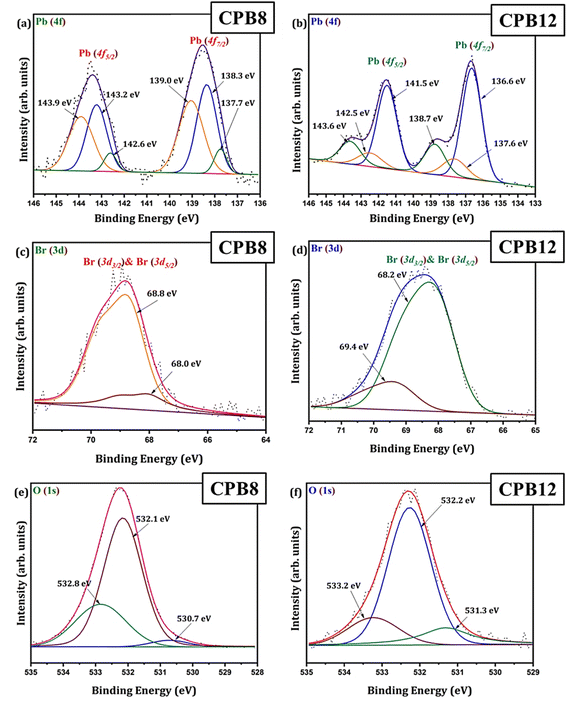 | ||
| Fig. 4 XPS high energy spectra of (a and b) Pb 4f, (c and d) Br 3d, (e and f) and O 1s regions in CPB8 and CPB12, respectively. | ||
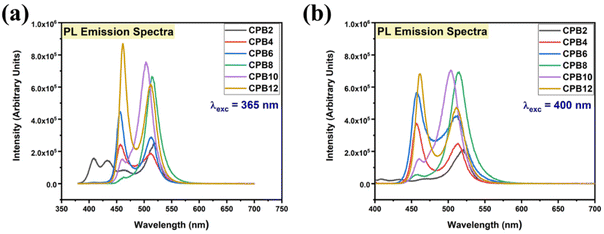
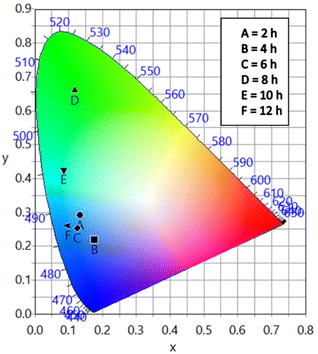
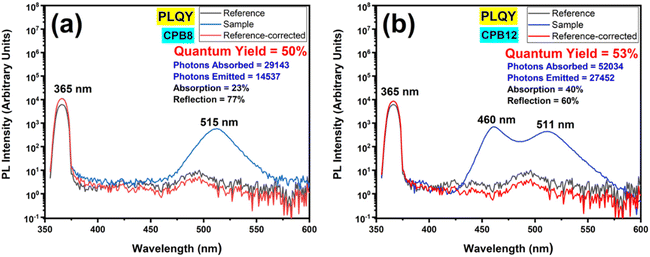
The different durations of ultrasonication showed noticeable effects on the PL properties of the NPs. This, in fact, was a consequence of the formation of dual phases of CsPbBr3 and Cs4PbBr6 that appeared in different ratios. The PL excitation spectra of the NPs formed by different ultrasonication periods are shown in the ESI (Fig. S3†). The excitation spectra were recorded by monitoring PL emission at 515 nm. These spectra demonstrated a significant difference in their nature that can be ascribed to the presence of two perovskite phases. The CPB2 and CPB4 NPs showed a broad excitation band whose peak wavelength appeared at 352 nm. Comparing the XRD patterns from Fig. 1, it can be inferred that the excitation peak around 350 nm is solely emerging due to the Cs4PbBr6 NPs. In the cases of CPB6, CPB8 and CPB10, the nature of the excitation band changed drastically, and the peak wavelength shifted above 410 nm. This nature can be attributed to the CsPbBr3 NPs which were dominantly formed. The CPB12 NPs produced noticeably mixed proportions of CsPbBr3 and Cs4PbBr6 NPs, due to which, the PL excitation band depicted the nature of both these phases. The PL spectra of the prepared NPs were recorded for two different excitation wavelengths, viz. 365 nm and 400 nm, as shown in Fig. 5. From the literature, it is known that pure-phase CsPbBr3 NCs produced an intense single narrow-band emission centered between 505 and 520 nm.4 Under 365 nm excitation, the intensity of the PL emission was found to be proportional to the duration of ultrasonication, as shown in Fig. S4.† But the peak position of the NPs varied due to the presence of dual phases in the NCs. The CPB2 NPs exhibited multiple emission peaks in the blue region and a peak at 520 nm in the green region. This can be attributed to the presence of multiple phases that just began to form after 2 h of ultrasonication. The NPs improved after 4 h of ultrasonication and showed only two emission bands, viz. one in the blue (457 nm) and one in the green (513 nm) regions. CPB6 NPs also showed similar emission bands, but with higher intensities. CPB8 demonstrated an intense emission band in the green region and only a small hump in the blue region. It can be deduced that the green emission resulted from the CsPbBr3 phase and the blue emissions resulted from the zero-dimensional Cs4PbBr6. This fact was further evident from the PL spectra of CPB10 and CPB12 NPs which also confirmed the presence of the Cs4PbBr6 phase along with CsPbBr3. Although CPB10 NPs exhibited a slightly stronger intensity for the green emission than CPB8, they also produced blue emissions that decreased their color purity. On the other hand, CPB12 produced stronger blue emissions than green emissions, which eventually resulted in the shifting of the chromaticity coordinates from the green to the blue region. The nature of the PL spectra, however, changed when the NPs were excited at 400 nm. The PL intensity was found to be proportional to the ultrasonication time up to 8 h, beyond which the intensity seemed to be saturated. CPB2 NPs exhibited only one peak in the green region (519 nm) and the blue peaks were virtually suppressed. The nature of the PL emission bands for CPB4, CPB6, CPB8, CPB10 and CPB12 was similar for both excitation wavelengths (365 nm and 400 nm). The PL emission bands with narrow full-width at half maxima (FWHM) indicate the narrow-size distribution of the particles.32 The green emission of CPB8 NPs showed an FWHM of 26 nm, which is slightly higher than the reported values (∼18–20 nm) for phase-pure CsPBBr3 NCs.32,33 This indicates that CPB8 NPs were formed with a broader size distribution of particles due to the lack of fine control over the synthesis parameters. The PL FWHM values of CPB10 and CPB12 NPs were found to be 28 nm, whereas those of CPB6 and CPB4 NPs were 29 nm and 45 nm, respectively. The broad FWHM values reflect the degree of inhomogeneity in the particle size of the NPs that resulted from uncontrolled sonication using dispersed low-energy waves. The details of the PL spectra can be well observed in the ESI (Fig. S5 and S6†). The variation in the chromaticity coordinates of the NPs under 365 nm excitation is shown in Fig. 6. The UV-Visible absorption spectra of the NPs were investigated to study their optical properties. Fig. 7 shows the absorption spectra together with their corresponding PL emission spectra. The absorption spectra behaved differently for different NPs. CPB2 NPs showed weak absorption edges at 517 nm, whereas CPB4 showed absorption edges at 455 and 497 nm. CPB6 NPs had a strong absorption edge at 456 nm and another at 509 nm. However, CPB8 was an exception among all the samples, and it showed one strong absorption edge at 497 nm. In the case of CPB10, the absorption edge at 494 nm appeared as a small hump, along with a strong absorption edge at 456 nm. The absorption at 494 nm became stronger for CPB12 and was accompanied by a stronger absorption edge at 456 nm. The absolute quantum yield (QY) values of the CPB8 and CPB12 NPs were recorded using a “direct excitation” method on an Edinburgh FLS980 with an integrating sphere. The absolute fluorescence QY (η) is defined as the ratio of the number of photons emitted (Nem) to the number of photons absorbed (Nabs).
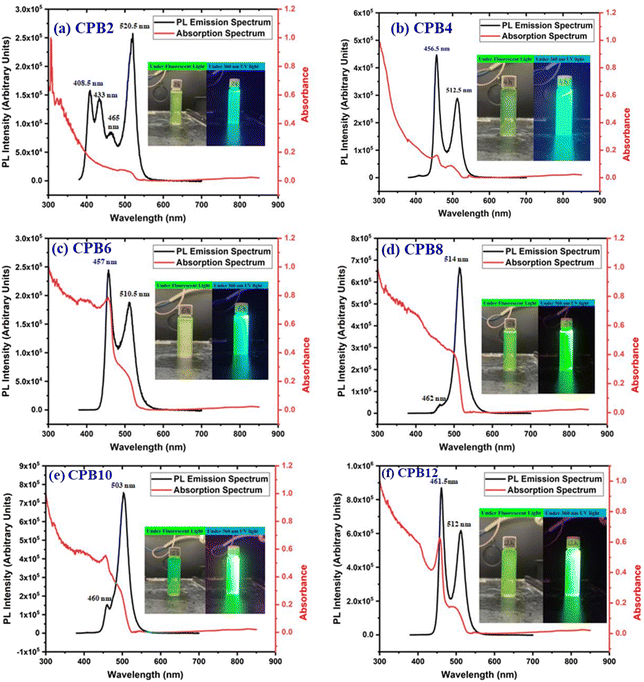 | ||
| Fig. 7 UV-Vis and PL spectra of (a) CPB2, (b) CPB4, (c) CPB6, (d) CPB8, (e) CPB10 and (f) CPB12 NPs. The inset shows the photographs of the samples taken under a fluorescent lamp and 360 nm UV light. | ||
Fig. 8 shows the PL spectra of the QY measurements performed for CPB8 and CPB12 NPs excited at 365 nm. The CPB8 and CPB12 NPs were found to exhibit QYs of 50% and 53%, respectively.
The time-resolved PL decay curves recorded for the NPs, excited at 360 nm and monitored for their green emission bands, are shown in Fig. 9. The decay curves were fitted using the Fluoracle software (Edinburgh Instruments) fit using a four-exponential function:
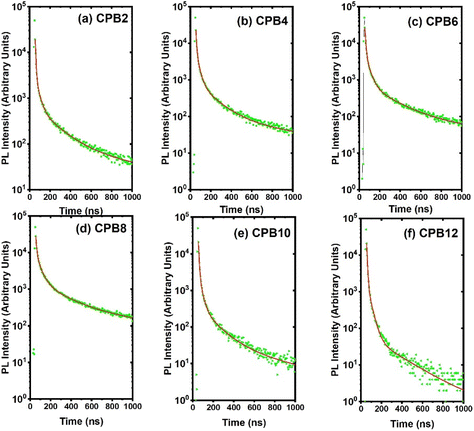 | ||
| Fig. 9 PL decay curves of (a) CPB2, (b) CPB4, (c) CPB6, (d) CPB8, (e) CPB10 and (f) CPB12 NPs excited at 360 nm and monitored for their green emission peak. | ||
To investigate the potential of the prepared perovskite NPs as a spectral downshifting material for improving the existing silicon solar cell efficiency, the I–V characteristics of a polycrystalline silicon solar cell were studied before and after coating the CPB8 NPs on them. The NPs were coated using the drop-cast method and allowed to evaporate to form a reasonable coating on the Si cell. The temperature of the solar illumination was recorded using a Newport 91150V reference cell and meter. The temperature was found to be approximately 40 °C throughout the measurements. The power density of the reference cell was recorded before both measurements, which was utilized while calculating the power conversion efficiency (PCE). Fig. 10 shows the I–V curves for the solar cell without and with the perovskite layer coating on its top surface. The power vs. voltage plot for the solar cells with and without the perovskite coating is shown in Fig. 11. Their corresponding solar cell parameters are presented in Table 1. The PCE of the solar cell without the coating was found to be 6.72%. After coating the CPB8 NPs, the PCE of the cell was enhanced to reach a value of 8.28%. Under solar illumination, the top surface of the Si cell emitted green light due to the perovskite-coating. The efficiency of the cell was found to enhance by 18.84% after coating with perovskite NPs.
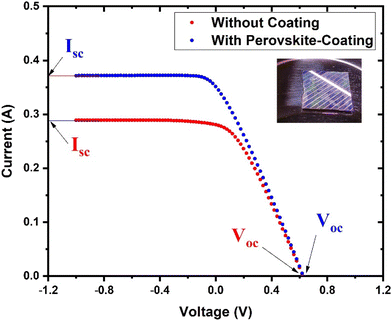 | ||
| Fig. 10 I–V characteristics of the Si cell with and without the CPB8 perovskite coating under AM1.5G illumination from a solar simulator. | ||
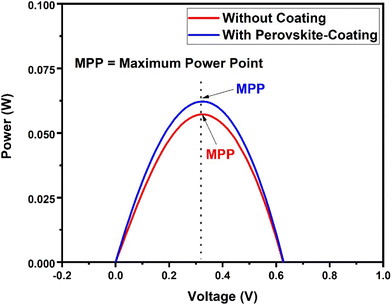 | ||
| Fig. 11 Power vs. voltage plot for the Si solar cells with and without the CPB8 perovskite coating under solar simulator illumination. | ||
| Solar cell | Without the coating | With the perovskite coating |
|---|---|---|
| Short-circuit current, Isc (A) | 0.2889 | 0.3513 |
| Open-circuit voltage, Voc (V) | 0.6299 | 0.6299 |
| Maximum power point, MPP (W) | 0.0572 | 0.0622 |
| Fill factor, FF | 0.3142 | 0.2809 |
| Area of the cell, A (m2) | 0.000924 | 0.000924 |
| Power density of the reference cell (kW m−2) | 0.9203 | 0.8125 |
| Power of the reference cell, Pin (W) | 0.8503 | 0.7507 |
| Power conversion efficiency, PCE (%) | 6.72% | 8.28% |
4. Conclusion
We demonstrated a low-cost, polar-solvent-free synthesis of CsPbBr3 NPs by employing an ultrasonic bath method. Compared to tip-sonicators, the CsPBBr3 nanoparticles prepared by the ultrasonic bath method failed to produce a pure phase, and multiple phases of Cs–Pb–Br perovskites ended up in the final product. There was a large inhomogeneity in the particle size of the NPs that led to the broadening of the PL emission band. In addition, the synthesis process was longer than the tip sonication process. Nevertheless, all synthesis processes are accompanied by their own pros and cons, and hence, the demerits of the ultrasonic bath method may be acceptable considering the lower production costs. Despite being a lengthy process, this method rules out several disadvantages experienced in the tip-sonication method. The duration of the sonication produced different results in the formation of the NPs. Although the CsPBBr3 phase was expected to form when the precursors were taken in a 1![[thin space (1/6-em)]](https://www.rsc.org/images/entities/char_2009.gif) :
:![[thin space (1/6-em)]](https://www.rsc.org/images/entities/char_2009.gif) 1 ratio, the formation of the Cs4PbBr6 phase was observed, especially, during lower durations of ultrasonication. This occurred mainly due to the quick solubility of the CsBr precursors that provided a Cs-rich environment for the NPs to grow. However, longer durations of sonication ensured better solubility of both CsBr and PbBr2 precursors that favoured the formation of the CsPbBr3 phase. The purest phase of CsPbBr3 was found for 8 h of sonication. Yet, the Cs4PbBr6 phase was found to form when the sonication time exceeded 8 h. It is assumed that prolonged sonication and rising temperature in the medium might have disintegrated the CsPbBr3 phase to form a much more stable zero-dimensional phase of Cs4PbBr6. Eventually, two emission bands (blue and green) were observed for the NPs prepared by 12 h of sonication with a PLQY of 53%. On the other hand, the NPs prepared by 8 h of sonication showed a single narrow band in the green region with a PLQY of 50%. As the temperature of the solvents during sonication did not exceed 45 °C, an optically active phase of CsPbBr3 NPs was obtained. The potential of the CsPbBr3 NPs prepared by 8 h of sonication as a spectral downconverting material for solar cells was also investigated by coating them on a silicon solar cell. The perovskite-coating enhanced the power-conversion efficiency of the solar cell by 18.84%.
1 ratio, the formation of the Cs4PbBr6 phase was observed, especially, during lower durations of ultrasonication. This occurred mainly due to the quick solubility of the CsBr precursors that provided a Cs-rich environment for the NPs to grow. However, longer durations of sonication ensured better solubility of both CsBr and PbBr2 precursors that favoured the formation of the CsPbBr3 phase. The purest phase of CsPbBr3 was found for 8 h of sonication. Yet, the Cs4PbBr6 phase was found to form when the sonication time exceeded 8 h. It is assumed that prolonged sonication and rising temperature in the medium might have disintegrated the CsPbBr3 phase to form a much more stable zero-dimensional phase of Cs4PbBr6. Eventually, two emission bands (blue and green) were observed for the NPs prepared by 12 h of sonication with a PLQY of 53%. On the other hand, the NPs prepared by 8 h of sonication showed a single narrow band in the green region with a PLQY of 50%. As the temperature of the solvents during sonication did not exceed 45 °C, an optically active phase of CsPbBr3 NPs was obtained. The potential of the CsPbBr3 NPs prepared by 8 h of sonication as a spectral downconverting material for solar cells was also investigated by coating them on a silicon solar cell. The perovskite-coating enhanced the power-conversion efficiency of the solar cell by 18.84%.
Conflicts of interest
There are no conflicts to declare.Acknowledgements
This research was supported by the South African Research Chairs Initiative of the Department of Science and Technology and the National Research Foundation of South Africa (Grant 84415). The financial assistance from the University of the Free State is highly recognized.References
- H. J. Snaith, J. Phys. Chem. Lett., 2013, 4, 3623–3630 CrossRef CAS.
- N. Yantara, S. Bhaumik, F. Yan, D. Sabba, H. A. Dewi, N. Mathews, P. P. Boix, H. V. Demir and S. G. Mhaisalkar, J. Phys. Chem. Lett., 2015, 6, 4360–4364 CrossRef CAS PubMed.
- B. Cai, Y. Xing, Z. Yang, W.-H. Zhang and J. Qiu, Energy Environ. Sci., 2013, 6, 1480 RSC.
- J. Shamsi, A. S. Urban, M. Imran, L. de Trizio and L. Manna, Chem. Rev., 2019, 119, 3296–3348 CrossRef CAS.
- Q. Zhang and Y. Yin, ACS Cent. Sci., 2018, 4, 668–679 CrossRef CAS.
- L. Protesescu, S. Yakunin, M. I. Bodnarchuk, F. Krieg, R. Caputo, C. H. Hendon, R. X. Yang, A. Walsh and M. v. Kovalenko, Nano Lett., 2015, 15, 3692–3696 CrossRef CAS PubMed.
- C. K. Ng, W. Yin, H. Li and J. J. Jasieniak, Nanoscale, 2020, 12, 4859–4867 RSC.
- X. Du, G. Wu, J. Cheng, H. Dang, K. Ma, Y.-W. Zhang, P.-F. Tan and S. Chen, RSC Adv., 2017, 7, 10391–10396 RSC.
- X. Li, Y. Wu, S. Zhang, B. Cai, Y. Gu, J. Song and H. Zeng, Adv. Funct. Mater., 2016, 26, 2435–2445 CrossRef CAS.
- X. Li, D. Yu, F. Cao, Y. Gu, Y. Wei, Y. Wu, J. Song and H. Zeng, Adv. Funct. Mater., 2016, 26, 5903–5912 CrossRef CAS.
- S. Wei, Y. Yang, X. Kang, L. Wang, L. Huang and D. Pan, Chem. Commun., 2016, 52, 7265–7268 RSC.
- L. Rao, Y. Tang, C. Song, K. Xu, E. T. Vickers, S. B. Naghadeh, X. Ding, Z. Li and J. Z. Zhang, Chem. Mater., 2019, 31, 365–375 CrossRef CAS.
- X. Xu, H. He, Z. Fang, H. Lou, C. Lin, L. Chen and Z. Ye, ACS Appl. Nano Mater., 2019, 2, 6874–6879 CrossRef CAS.
- M. I. Saidaminov, J. Almutlaq, S. Sarmah, I. Dursun, A. A. Zhumekenov, R. Begum, J. Pan, N. Cho, O. F. Mohammed and O. M. Bakr, ACS Energy Lett., 2016, 1, 840–845 CrossRef CAS.
- C. F. Holder and R. E. Schaak, ACS Nano, 2019, 13, 7359–7365 CrossRef CAS.
- J. A. Taylor and D. L. Perry, J. Vac. Sci. Technol., A, 1984, 2, 771–774 CrossRef CAS.
- V. I. Nefedov, J. Electron Spectrosc. Relat. Phenom., 1982, 25, 29–47 CrossRef CAS.
- Q. Hu, Z. Li, Z. Tan, H. Song, C. Ge, G. Niu, J. Han and J. Tang, Adv. Opt. Mater., 2018, 6, 1700864 CrossRef.
- Q. Jiang, X. Zeng, N. Wang, Z. Xiao, Z. Guo and J. Lu, ACS Energy Lett., 2018, 3, 264–269 CrossRef CAS.
- L. R. Pederson, J. Electron Spectrosc. Relat. Phenom., 1982, 28, 203–209 CrossRef CAS.
- J. A. Taylor, G. M. Lancaster and J. W. Rabalais, J. Electron Spectrosc. Relat. Phenom., 1978, 13, 435–444 CrossRef CAS.
- J. Y. Woo, Y. Kim, J. Bae, T. G. Kim, J. W. Kim, D. C. Lee and S. Jeong, Chem. Mater., 2017, 29, 7088–7092 CrossRef CAS.
- W. E. Morgan, J. R. Van Wazer and W. J. Stec, J. Am. Chem. Soc., 1973, 95, 751–755 CrossRef CAS.
- Q. Xu, J. Wang, W. Shao, X. Ouyang, X. Wang, X. Zhang, Y. Guo and X. Ouyang, Nanoscale, 2020, 12, 9727–9732 RSC.
- M. Liu, Z. Li, W. Zheng, L. Kong and L. Li, Front. Mater., 2019, 6, 306 CrossRef.
- S. Cacovich, D. Messou, A. Bercegol, S. Béchu, A. Yaiche, H. Shafique, J. Rousset, P. Schulz, M. Bouttemy and L. Lombez, ACS Appl. Mater. Interfaces, 2020, 12, 34784–34794 CrossRef CAS.
- Y. Duan, D.-Y. Wang, R. D. Costa, Y. Duan, D.-Y. Wang and R. D. Costa, Adv. Funct. Mater., 2021, 31, 2104634 CrossRef CAS.
- R. Krishnan, G. B. Nair, S. G. Menon, L. Erasmus and H. C. Swart, J. Alloys Compd., 2021, 878, 160386 CrossRef CAS.
- J. Halim, K. M. Cook, M. Naguib, P. Eklund, Y. Gogotsi, J. Rosen and M. W. Barsoum, Appl. Surf. Sci., 2016, 362, 406–417 CrossRef CAS.
- J. Sharma, T. Gora, J. D. Rimstidt and R. Staley, Chem. Phys. Lett., 1972, 15, 232–235 CrossRef CAS.
- R. Krishnan, R. E. Kroon and H. C. Swart, Mater. Res. Bull., 2022, 145, 111554 CrossRef CAS.
- C. Zheng, C. Bi, F. Huang, D. Binks and J. Tian, DOI:10.1021/acsami.9b07818.
- Y. Ming, P. Cao, B. Yang, F. Zheng, X. Hong, Y. Gao, X. Zhang, Y. Chu and J. Zou, J. Mater. Sci.: Mater. Electron., 2021, 32, 12793–12799 CrossRef CAS.
- V. Kumar, V. Nagal, R. Kumar, S. Srivastava, B. K. Gupta, M. Kumar, A. K. Hafiz and K. Singh, RSC Adv., 2020, 10, 34651–34657 RSC.
- T. GüNer, G. Topçu, U. Savaci, A. Genç, S. Turan, E. Sari and M. M. Demir, Nanotechnology, 2018, 29, 135202 CrossRef.
- F. Gabelloni, F. Biccari, G. Andreotti, D. Balestri, S. Checcucci, A. Milanesi, N. Calisi, S. Caporali and A. Vinattieri, Opt. Mater. Express, 2017, 7(12), 4367–4373 CrossRef CAS.
- Y.-T. Zeng, Z.-R. Li, S.-P. Chang, A. Ansay, Z.-H. Wang and C.-Y. Huang, Nanomaterials, 2022, 12, 759 CrossRef CAS PubMed.
- J. Tamayo, T. Do, K. El-Maraghy and V. I. Vullev, J. Photochem. Photobiol., 2022, 10, 100109 CrossRef.
Footnote |
| † Electronic supplementary information (ESI) available. See DOI: https://doi.org/10.1039/d2dt03689d |
| This journal is © The Royal Society of Chemistry 2023 |

