
 Open Access Article
 This Open Access Article is licensed under a
 Creative Commons Attribution 3.0 Unported Licence
Element similarity in high-dimensional materials representations†
Anthony
Onwuli
 a,
Ashish V.
Hegde
a,
Kevin V. T.
Nguyen
a,
Keith T.
Butler
*b and
Aron
Walsh
*ac
a,
Ashish V.
Hegde
a,
Kevin V. T.
Nguyen
a,
Keith T.
Butler
*b and
Aron
Walsh
*ac
aDepartment of Materials, Imperial College London, London SW7 2AZ, UK. E-mail: a.walsh@imperial.ac.uk
bDepartment of Chemistry, University College London, London WC1H 0AJ, UK. E-mail: k.t.butler@ucl.ac.uk
cDepartment of Physics, Ewha Womans University, Seoul 03760, Korea
First published on 12th September 2023
Abstract
The traditional display of elements in the periodic table is convenient for the study of chemistry and physics. However, the atomic number alone is insufficient for training statistical machine learning models to describe and extract composition-structure–property relationships. Here, we assess the similarity and correlations contained within high-dimensional local and distributed representations of the chemical elements, as implemented in an open-source Python package ElementEmbeddings. These include element vectors of up to 200 dimensions derived from known physical properties, crystal structure analysis, natural language processing, and deep learning models. A range of distance measures are compared and a clustering of elements into familiar groups is found using dimensionality reduction techniques. The cosine similarity is used to assess the utility of these metrics for crystal structure prediction, showing that they can outperform the traditional radius ratio rules for the structural classification of AB binary solids.
1. Introduction
The periodic table offers an effective description of the elements in order of increasing atomic number. Its true power comes from the latent information that it contains. Chemists are educated to recall periodic trends in electronic configuration, atomic radius, electronegativity, accessible oxidation states, and related characteristics. This understanding gives the ability to rapidly assess, with bias, whether a particular compound will be stable or infer what properties a molecule or material may possess without detailed computations.1–4Significant advances have been made in the statistical description of chemical systems with the application of supervised, unsupervised and generative machine learning (ML) techniques.5–7 A critical factor in the performance of such ML models for chemical systems is the representation of the constituent elements. The atomic number of an element can be augmented or replaced by a vector that may be built directly from standard data tables, trained from chemical datasets using a machine learning model, or even generated from random numbers. Such representations can be categorised as local (vector components with specific meaning) or distributed (vector components learned from training data). These have been used to build powerful ML models for property prediction based on composition alone.8–11
Perhaps the simplest local representation is one-hot encoding where a binary n-dimensional vector v is used to categorise the atomic number of the element, e.g. H can be represented as [1000…] and He as [0100…]. A single component is ‘hot’ for each element, thus providing an orthogonal and sparse description. A selection of other common representations from the literature is given in Table 1.
In this study, we are interested in the latent chemical information that can be distilled from such high-dimensional element representations. We consider the fundamental concept of element similarity, which can be defined here as the distance or correlation between elemental vectors. We explore various metrics and then apply them to data-driven structure classification for the case of binary solids. The underlying tools have been combined into an open-source and modular Python package ElementEmbeddings to support future investigations.
2. Results and discussion
2.1 Element representations
We consider four vector representations of the chemical elements in the main text, but cover all seven mentioned in Table 1 in the final section for applications to crystal structure prediction, with additional analysis provided as ESI.† The aim here is not to be exhaustive but to cover a set of distinct approaches that have been developed for chemical models. The analysis is performed on elements 1 (H)–83 (Bi) as higher atomic number elements are not covered in all representation schemes. For SkipAtom, only 80 elements are considered as the noble gases Ar, He and Ne are not contained within the representation. The source of the training data for these vectors was the Materials Project, which is largely focused on inorganic crystals.The Magpie12 representation is a 22-dimensional vector. It is a local representation where the vector components have specific meaning as they are built from elemental properties including atomic number, effective radii, and the row of the periodic table. The Mat2Vec14 representation is a 200-dimensional vector distributed representation built from unsupervised word embeddings18 of over 3 million abstracts of publications between 1922 and 2018. In contrast, the atomic weights from a crystal graph convolutional neural network trained to predict the formation energies of crystalline materials are used to generate the 16 dimensional MEGnet15 representation. The Random200 representation is simply a 200-dimensional vector generated randomly for each element, employed here as a control measure. Each vector component is generated from the standard normal distribution,  .
.
The actual vectors were collected from various sources: the Magpie, Olinyk and Mat2Vec representations were obtained as csv files from the CBFV repository;19 the Matscholar and MEGnet16 were obtained from the lrcfmd/ElMD repository;20 the SkipAtom embeddings were obtained from the lantunes/SkipAtom repository; NumPy21 was used to generate the Random_200 vectors. We found that the original Oliynyk csv file had 4 columns with missing values: Miracle_Radius_[pm]; crystal_radius; MB_electronegativty; Mulliken_EN. For Miracle_Radius_[pm], we used the mode to impute the missing values and for the other 3 columns, we used knn-imputing with the default parameters in scikit-learn.22 The choice of imputation was such that the overall distribution was preserved. All embedding vectors used in this work have been standardised prior to analysis.
2.2 Similarity measures
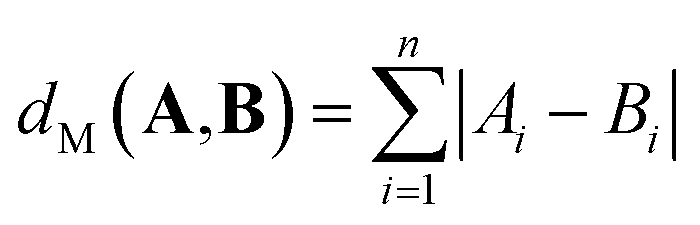
The distance between two vectors depends on the choice of measure in n dimensional space. We assess the pairwise distances between elements representations A and B. The Minkowski distance is a metric in the normed vector space, which is a generalisation of the common distance metrics Euclidean, Manhattan and Chebyshev: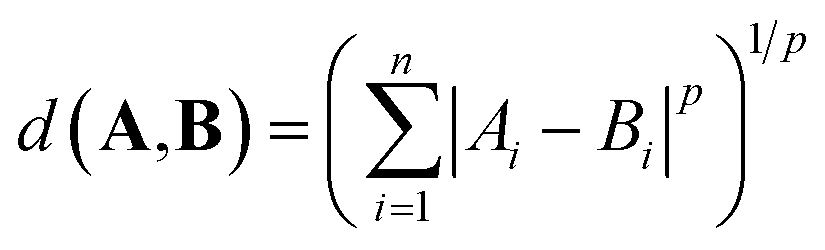 | (1) |
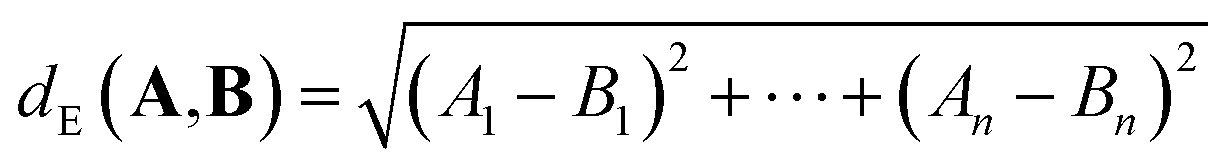
For p = 2, we obtain the Euclidean (or L2) distance which is the length of a line segment connecting A and B:
 | (2) |
 | (3) |
 | (4) |
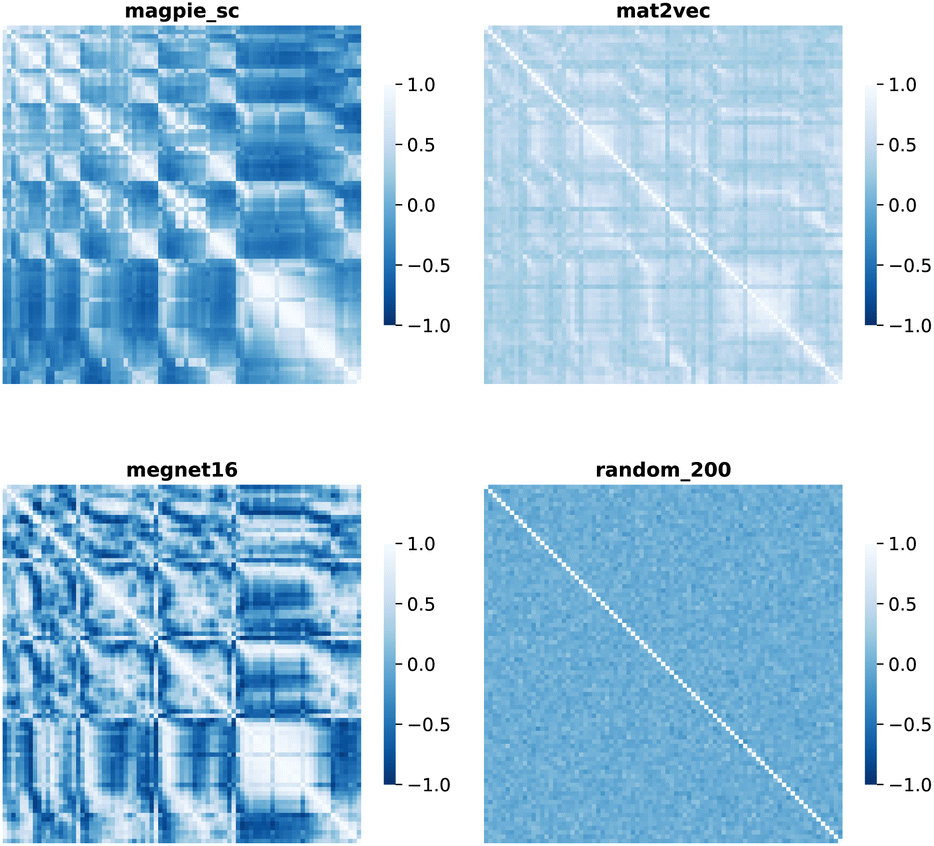
Element separations are plotted for Euclidean and Manhattan distance in Fig. 1 and 2, with other measures shown in the ESI.† The elements are ordered in increasing atomic number along the x-axis and decreasing atomic number along the y-axis. This cuts across the groups in the periodic table. The leading diagonals in the distance plots are zero-valued as they correspond to d(A,A). The lighter blues correspond to elements whose vector representations are close to each other within the chosen metric space. These elements can be interpreted as similar to each other. Stripes are seen for the nobel gas elements, such as Kr and Xe, which are very different from the neighbouring halogens and alkali metals. On a visual basis, the global structure of the heatmaps appears similar for the Euclidean and Manhattan distances, with the main difference being the absolute scale of the distances. Less structure is seen for the Random_200 vectors, as expected for this control representation.
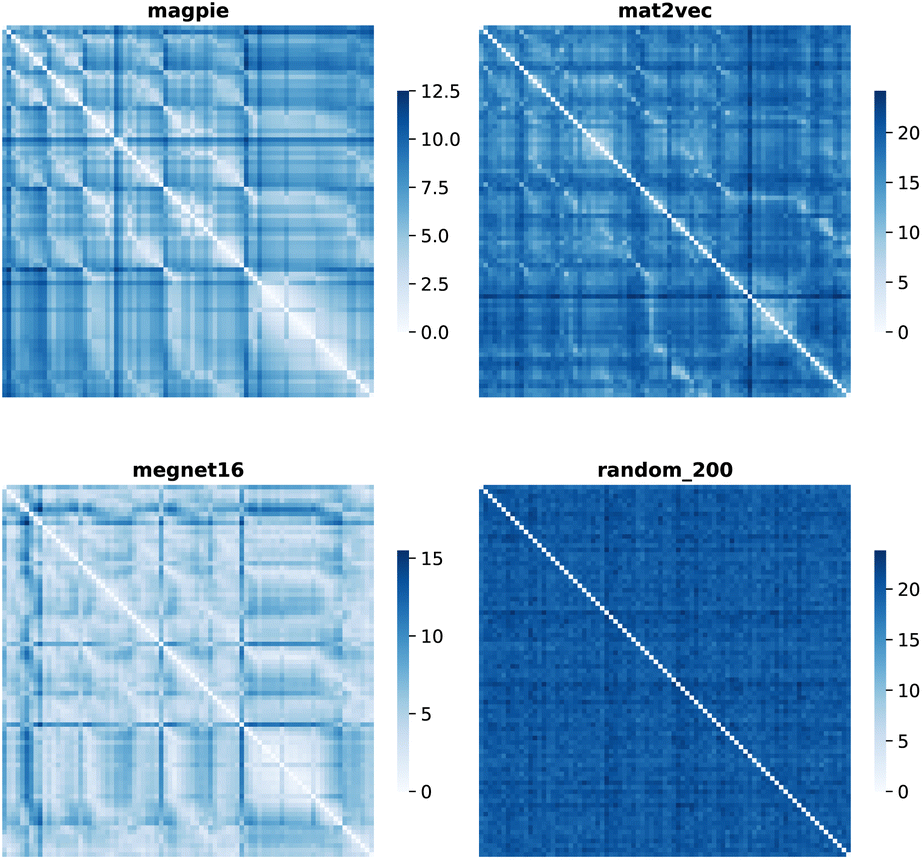 | ||
| Fig. 1 Map of the pairwise Euclidean distance between element vectors for four representation schemes. The elements are ordered in increasing atomic number along the axes from 1 (H) to 83 (Bi). | ||
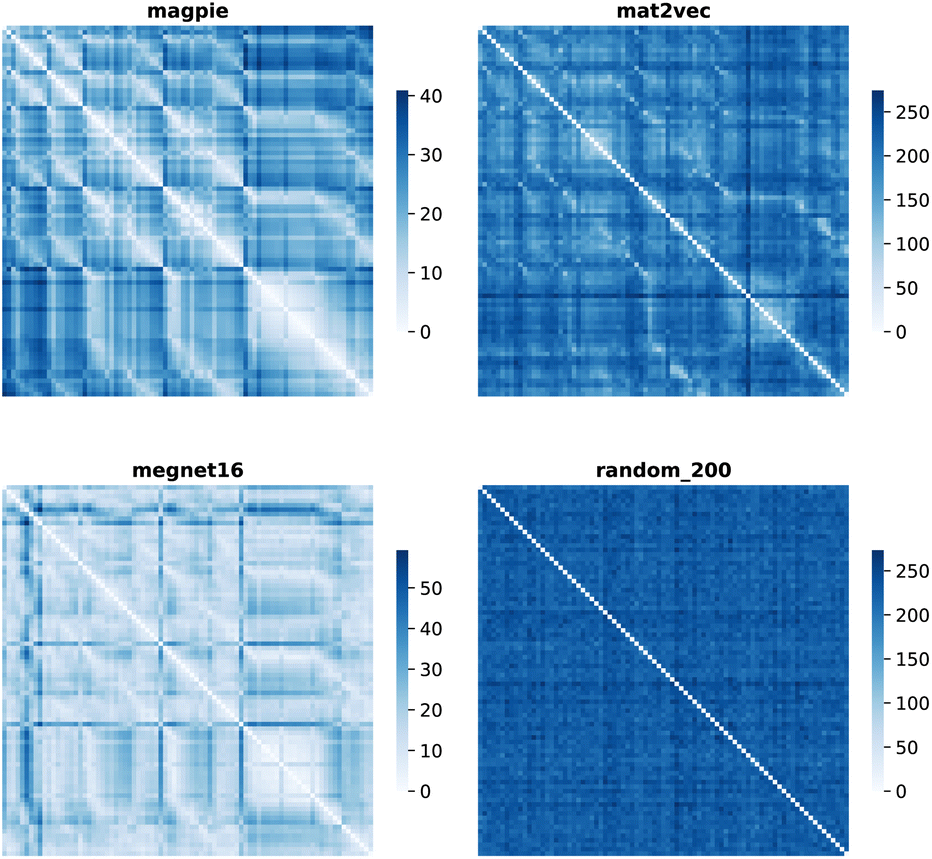 | ||
| Fig. 2 Map of the pairwise Manhattan distance between element vectors for four representation schemes. | ||
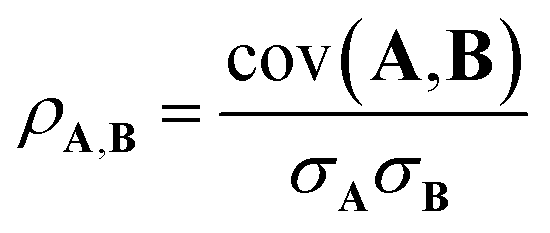
Alternatively, we can consider the angle between vectors using the cosine similarity based on the dot product:
 | (5) |
 | ||
| Fig. 3 Map of the cosine similarity between element vectors for four representation schemes. | ||
The Pearson correlation coefficient provides a measure of the linear correlation:
 | (6) |
 | ||
| Fig. 4 Map of the Pearson correlation coefficient between element vectors for four representation schemes. | ||
The cosine similarity and Pearson correlation are convenient metrics as both cos(θ) and ρ ∈ [−1, 1]. The resulting heat maps are visually similar, with comparable structure to the distance metrics. Histograms of the values are shown in Fig. S3 and S4.† A skewed distribution is found in each case with the exception of Random_200, which follows a normal distribution by construction. We note that the cosine similarity is scale-invariant as it only depends on the angles between vectors. Some elemental representation schemes may be sensitive to bias in the training data, such as an abundance of certain metal oxides, that produce outliers in vector components. Therefore, we use cosine similarity in later sections.
2.3 Periodic trends
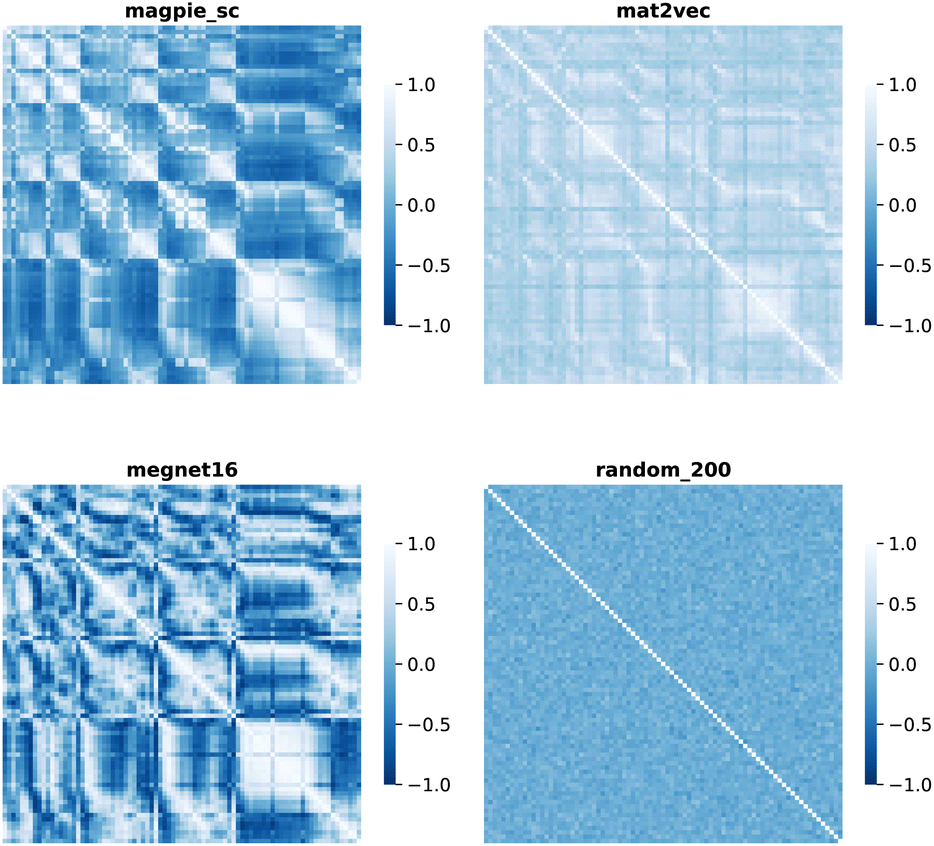
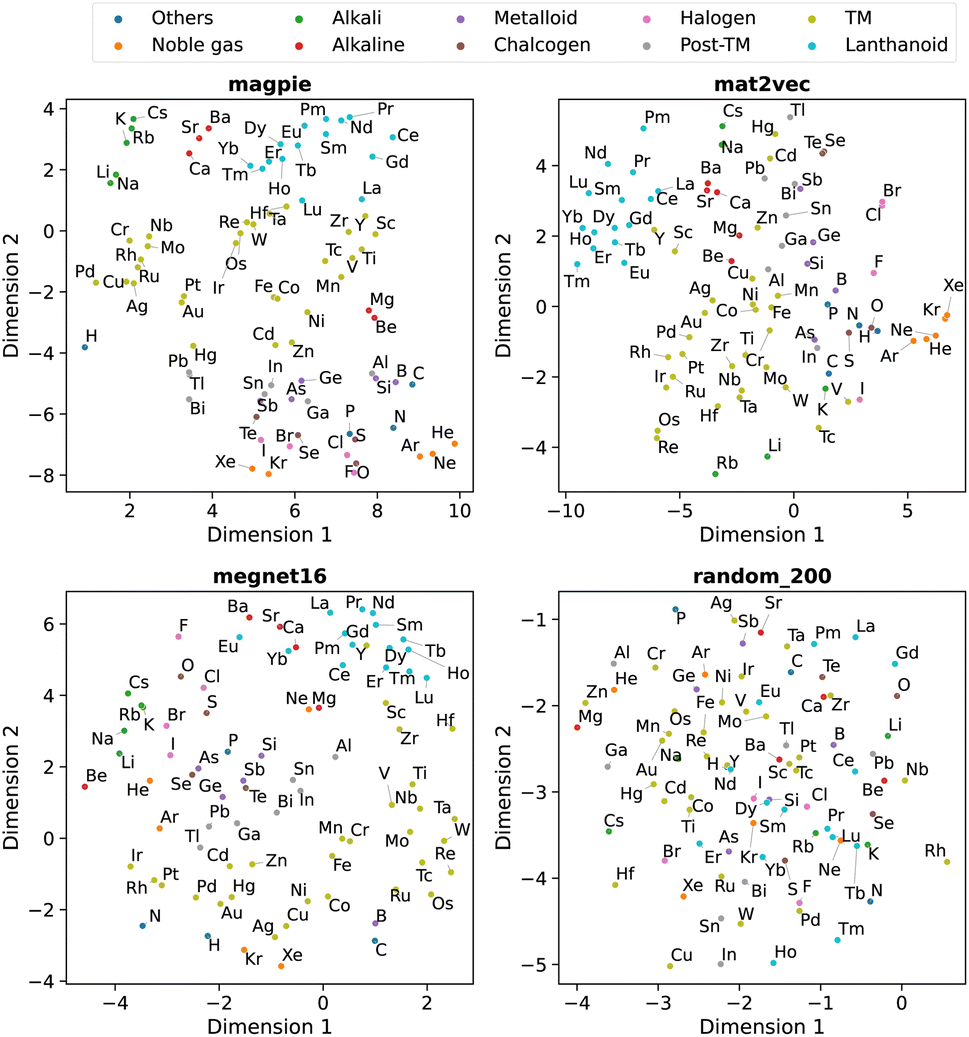
Beyond understanding the pairwise connection between elements, we can go deeper to investigate how the elements are distributed across the n dimensions in each representation. For this, we use dimensionality reduction techniques based on unsupervised machine learning analysis. These two-dimensional plots enable intuitive interpretations of the elemental representations and aid in determining the connection to standard elemental groupings.The first method is principal component analysis (PCA). Here two principal component axes are defined using a linear transformation of the original features that give the greatest variance in the vector components. The PCA, generated using scikit-learn,22 is shown in Fig. 5 with each data point coloured by the group in the periodic table.
 | ||
| Fig. 5 Two-dimensional projection of four element representations using principal component analysis. | ||
The second approach is t-distributed stochastic neighbour embedding (t-SNE). Unlike PCA, this algorithm is a nonlinear dimensionality reduction technique that can better separate data which is not linearly separable. Here a probability distribution is generated to represent the similarities between neighbouring points in the original high-dimensional space and a similar distribution with the same number of points is found in a lower-dimensional space. The t-SNE, also generated using scikit-learn,22 is shown in Fig. 6 with each data point coloured by their group in the periodic table.
 | ||
| Fig. 6 Two-dimensional projection of four element representations using t-SNE. | ||
We observe that the element representations, with the exception of the random vectors, possess an insightful structure in the reduced dimensions, Fig. 5 and 6. The lanthanoid elements cluster together in the non-random representations independent of the choice of dimension reduction technique. In most of the representations Sr, Ba, Ca tend to group closely together, which reflects their common application in substitutional mixtures, for example in tuning ferroelectric solid-solutions. Interestingly the learned, distributed representations pick up some similarities, which are obvious to a trained chemist, but are not captured in the local Magpie representation, such as the similarity between Bi and Sb. In the Magpie representation, H tends to be considered more of an odd-one-out element, at the periphery of the distributions, whereas in the distributed representations it tends to be clustered with other elements, reflecting how it has been observed in training data from crystals such as HF and LiH.
2.4 Application to crystal structure prediction
We have established that chemical correlations are found within the various elemental representations. The next question is if they can be useful beyond their original purpose. We consider a simple classification case in crystal structure prediction, a research topic of widespread importance in computational chemistry.4,25,26The radius ratio rules were developed to rationalise the local coordination and crystal structure preferences of ionic solids.27 In this model, the coordination number of a cation is determined by the balance between the electrostatic attraction (cation–anion interactions) and repulsion (anion–anion interactions). A geometric analysis predicts that 8-fold (cubic) coordination should be obtained when the radius ratio ρ = rcation/ranion falls in the range 0.732–1.000. A 6-fold coordination environment is predicted for 0.414 < ρ < 0.732, while 4-fold coordination is predicted for 0.225 < ρ < 0.414. For binary AB solids, these regimes are typified by the CsCl (8-fold), rocksalt (6-fold), or zinc blende/wurtzite (4-fold) structures. While it is accepted that there are many cases where these rules fail, especially in the lower radius ratio regime,28 they are still commonly taught in undergraduate programs due to their instructive nature.
To assess the utility of the various element embeddings for this problem, we follow the structure substitution procedure proposed by Hautier et al.29 and as implemented in the Python code SMACT>=2.3.30–32 In this approach, the likelihood that a new chemical composition (X) will adopt the crystal structure of a known chemical composition (X′) depends on the substitution probability function p(X, X′). The original pairwise substitution weights were learned from a training set of inorganic materials from the Inorganic Crystal Structure Database.33 However, we instead use the cosine similarity between element representations, i.e. we make an assumption that the preferred crystal structure is the one that maximises cos(X, X′).
Unary substitutions are considered here, i.e. where two compositions differ by one element. This allows us to approximate the probability function to 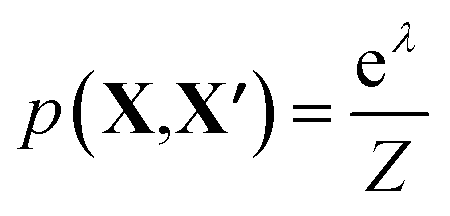 , where Z is the partition function, and λ is the metric for chemical similarity. These are the pairwise substitution weights in the original model.29 In the SMACT implementation, these can be a user-defined, pairwise metric for similarity which here is defined as cos(X, X′). A related procedure has been employed by Wang et al. to predict new stable compounds,34,35 and an extension based on metric learning has been reported by Kusaba et al.36
To obtain a set of binary AB solids that adopt one of the four structure types as their ground-state structure, we queried the Materials Project (version: 2022.10.28)37 using pymatgen.38 The query was carried out using the parameters: formula= *1*1; theoretical=False; is_metal=False. This query returned 494 binary AB solids. We chose to exclude metallic materials to focus on compositions where the bonding should be heteropolar. Some of the materials in this dataset contained polymorphs of the same composition. For example, 83 ZnS entries were returned. The data was filtered by only keeping the polymorph of a composition with the lowest energy above the convex hull as an approximation for relative stability. This filter reduced the dataset from 494 materials to 233. The query data was further filtered by matching the structures to one of the four aforementioned structure types using the structure_matcher module in pymatgen38 with the default parameters.
Our process led to a dataset of 101 unique compounds. The final filter was to check that the species in the remaining compounds could be assigned oxidation states, which led to a final dataset of 100 compounds. Taking the empirical Shannon radii39 for each ion, averaged over coordination environments, the radius ratio rules are found to correctly predict the ground-state crystal structures in 54% of cases. This assessment was performed on 81 of the 100 compounds as Shannon radii are not available for all ions. For instance, oxygen is assigned a −1 oxidation state in AgO (mp-1079720), which has no available radius. The performance is lower than the 66% reported in a recent study of the predictive power of Pauling's rules, and using Pauling's univalent radii, to assign the coordination preferences of metals in a dataset of around 5000 metal oxides.40 The differences likely arise from the use of averaged Shannon radii and sensitivity to the chosen dataset (Table 2).
| Element embedding | Accuracy |
|---|---|
| Random_200 | 58.0% |
| Hautier et al.29 | 54.0% |
| SkipAtom | 68.0% |
| Oliynyk | 75.0% |
| MEGNet16 | 73.0% |
| Magpie | 78.0% |
| MatScholar | 81.0% |
| Mat2Vec | 80.0% |
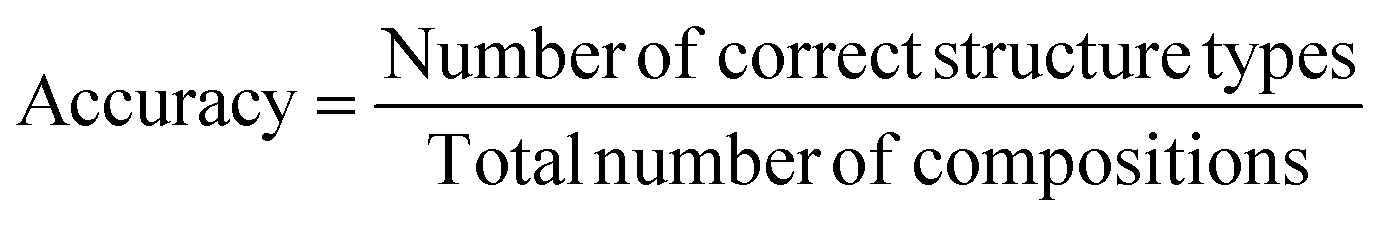
The measure of performance defined here is classification accuracy. It is determined by the number of compositions with correctly predicted ground state structure, via the most probable substitution, over the total number of compositions in the dataset:
 | (7) |
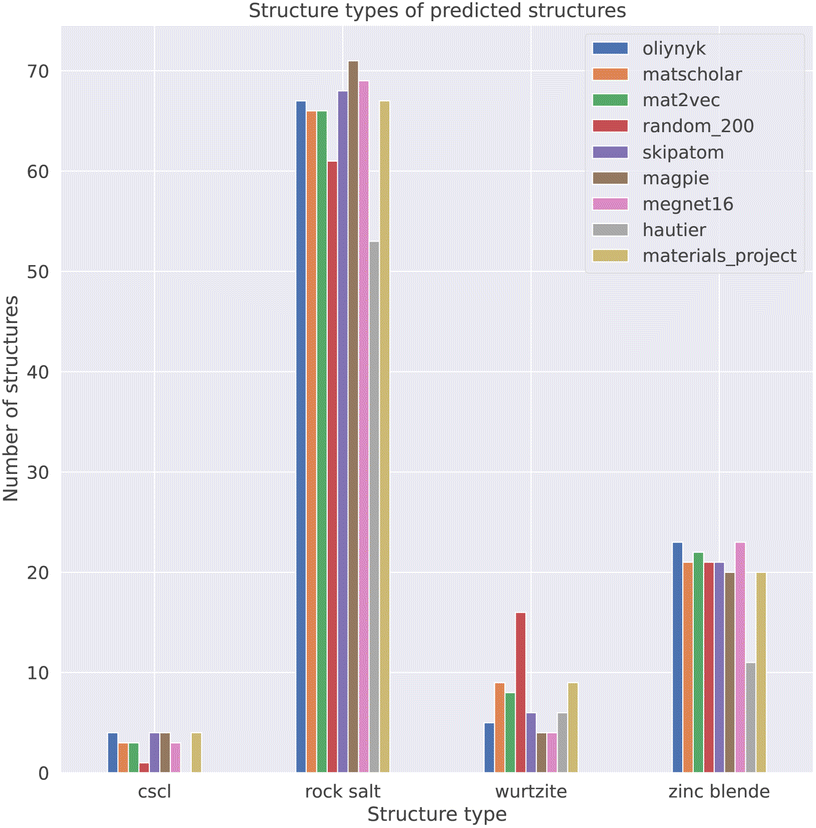 | ||
| Fig. 7 Performance of element representations at classifying the crystal structures of binary AB solids. The Materials Project bar refers to the ground truth label (structure at the bottom of the thermodynamic convex hull) for the 100 compositions in the dataset. | ||
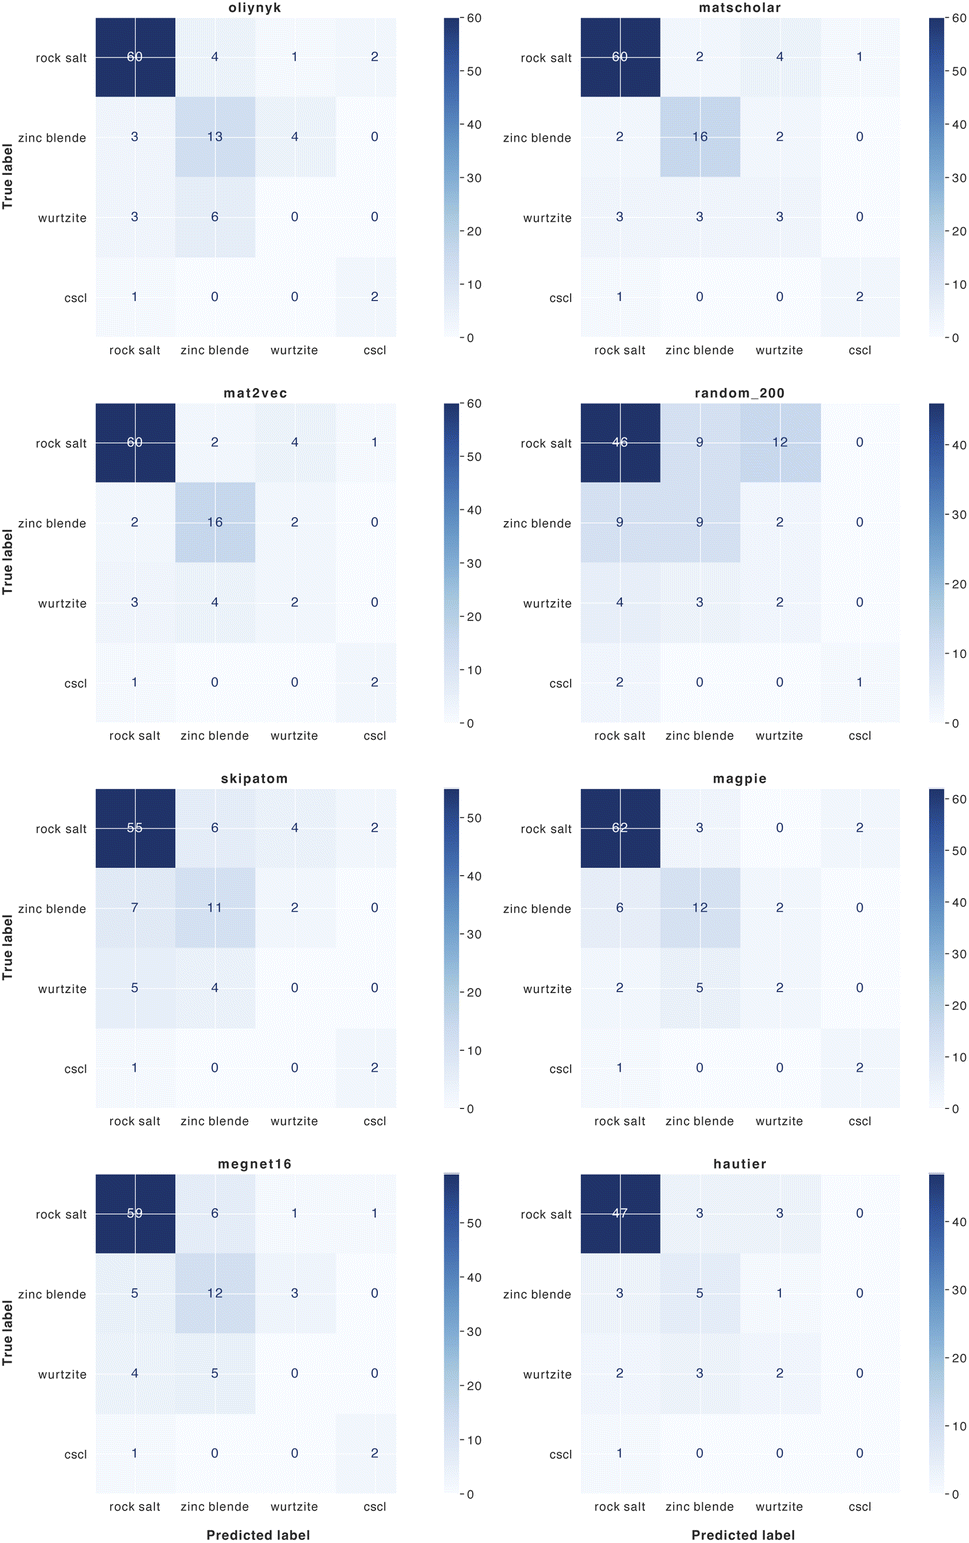 | ||
| Fig. 8 Confusion matrices for the classification of binary AB crystal structures for 8 element substitution (similarity) measures. | ||
We find that representations derived from literature word embeddings (MatScholar and Mat2Vec) have comparable performance with their confusion matrices being almost identical. Both capture similar correlations from the dataset of abstracts on which they were trained. The poorer performance of the original weights from Hautier et al.29 can be attributed to the absence of particular oxidation states, which led to some compositions not being assigned to a structure. This is a limitation of species-based measures as compared to those based on the element identity alone. As materials databases have grown compared to a decade ago, there should be a greater diversity of compounds not included in the original training of these weights, which could extend their functionality.
Finally, we note that while we can not exclude data leakage due to structure environments being present in the training data for some of the chosen element vectors, this particular use case has not been explicitly targeted in the training of the distributed representations.
3. Conclusion
In summary, by exploring high-dimensional representations of chemical elements derived from diverse sources, we have demonstrated the potential for enhanced similarity and correlation assessments. These descriptions can complement and even outperform traditional measures, as shown in the case of crystal structure prediction and classification for binary solids. Effective chemical representations can enhance our understanding and prediction of material properties and we hope that the associated Python toolkit provided will support these developments.Data availability
A repository containing the element embeddings and associated analysis code have been made available on Github (https://github.com/WMD-group/ElementEmbeddings) with a snapshot on Zenodo (DOI: https://doi.org/10.5281/zenodo.827741). The package is readily extendable to other elemental and material representations and similarity measures.Author contributions
The author contributions have been defined following the CRediT system. Conceptualisation: A. O., A. W. Investigation and Methodology: A. O., A. V. H., K. N. Software: A. O. Data curation: A. O. Supervision: A. O., K. T. B., A. W. Writing – original draft: A. O., A. W. Writing – review and editing: all authors. Resources and funding acquisition: A. W.Conflicts of interest
There are no conflicts to declare.Acknowledgements
A. O. thanks EPSRC for a PhD studentship (EP/T51780X/1). We are grateful to the UK Materials and Molecular Modelling Hub for computational resources, which is partially funded by EPSRC (EP/P020194/1 and EP/T022213/1).References
- L. Pauling, J. Chem. Soc., 1948, 1948, 1461–1467 RSC.
- H. J. Axon and W. Hume-Rothery, Proc. R. Soc. London, Ser. A, 1948, 193, 1–24 CAS.
- J. Phillips, Bonds and Bands in Semiconductors, Academic Press, New York, 1973 Search PubMed.
- D. G. Pettifor, J. Phys. C: Solid State Phys., 1986, 19, 285–313 CrossRef CAS.
- B. Sanchez-Lengeling and A. Aspuru-Guzik, Science, 2018, 361, 360–365 CrossRef CAS PubMed.
- K. T. Butler, D. W. Davies, H. Cartwright, O. Isayev and A. Walsh, Nature, 2018, 559, 547–555 CrossRef CAS PubMed.
- M. Ceriotti, J. Chem. Phys., 2019, 150, 150901 CrossRef PubMed.
- D. Jha, L. Ward, A. Paul, W.-k. Liao, A. Choudhary, C. Wolverton and A. Agrawal, Sci. Rep., 2018, 8, 17593 CrossRef PubMed.
- A. Seko, H. Hayashi and I. Tanaka, J. Chem. Phys., 2018, 148, 1711 CrossRef PubMed.
- R. E. A. Goodall and A. A. Lee, Nat. Commun., 2020, 11, 6280 CrossRef CAS PubMed.
- A. Y.-T. Wang, S. K. Kauwe, R. J. Murdock and T. D. Sparks, npj Comput. Mater., 2021, 7, 77 CrossRef.
- L. Ward, A. Agrawal, A. Choudhary and C. Wolverton, npj Comput. Mater., 2016, 2, 16028 CrossRef.
- L. Weston, V. Tshitoyan, J. Dagdelen, O. Kononova, A. Trewartha, K. A. Persson, G. Ceder and A. Jain, J. Chem. Inf. Model., 2019, 59, 3692–3702 CrossRef CAS PubMed.
- V. Tshitoyan, J. Dagdelen, L. Weston, A. Dunn, Z. Rong, O. Kononova, K. A. Persson, G. Ceder and A. Jain, Nature, 2019, 571, 95–98 CrossRef CAS PubMed.
- C. Chen, W. Ye, Y. Zuo, C. Zheng and S. P. Ong, Chem. Mater., 2019, 31, 3564–3572 CrossRef CAS.
- A. O. Oliynyk, E. Antono, T. D. Sparks, L. Ghadbeigi, M. W. Gaultois, B. Meredig and A. Mar, Chem. Mater., 2016, 28, 7324–7331 CrossRef CAS.
- L. M. Antunes, R. Grau-Crespo and K. T. Butler, npj Comput. Mater., 2022, 8, 44 CrossRef.
- T. Mikolov, K. Chen, G. Corrado and J. Dean, arXiv, 2013, preprint arXiv:1301.3781, DOI:10.48550/arXiv.1301.3781.
- https://github.com/kaaiian/cbfv .
- https://github.com/lrcfmd/elmd .
- C. R. Harris, K. J. Millman, S. J. van der Walt, R. Gommers, P. Virtanen, D. Cournapeau, E. Wieser, J. Taylor, S. Berg, N. J. Smith, R. Kern, M. Picus, S. Hoyer, M. H. van Kerkwijk, M. Brett, A. Haldane, J. Fernández del Río, M. Wiebe, P. Peterson, P. Gérard-Marchant, K. Sheppard, T. Reddy, W. Weckesser, H. Abbasi, C. Gohlke and T. E. Oliphant, Nature, 2020, 585, 357–362 CrossRef CAS PubMed.
- F. Pedregosa, G. Varoquaux, A. Gramfort, V. Michel, B. Thirion, O. Grisel, M. Blondel, P. Prettenhofer, R. Weiss, V. Dubourg, J. Vanderplas, A. Passos, D. Cournapeau, M. Brucher, M. Perrot and E. Duchesnay, J. Mach. Learn. Res., 2011, 12, 2825–2830 Search PubMed.
- C. J. Hargreaves, M. S. Dyer, M. W. Gaultois, V. A. Kurlin and M. J. Rosseinsky, Chem. Mater., 2020, 32, 10610–10620 CrossRef CAS.
- R.-Z. Zhang, S. Seth and J. Cumby, Digital Discovery, 2023, 2, 81–90 RSC.
- J. Maddox, Nature, 1988, 335, 201 CrossRef.
- A. Zunger, Phys. Rev. B: Condens. Matter Mater. Phys., 1980, 22, 5839–5872 CrossRef CAS.
- J. Dunitz and L. Orgel, Adv. Inorg. Chem. Radiochem., 1960, 2, 1–60 CrossRef CAS.
- L. C. Nathan, J. Chem. Educ., 1985, 62, 215 CrossRef CAS.
- G. Hautier, C. Fischer, V. Ehrlacher, A. Jain and G. Ceder, Inorg. Chem., 2011, 50, 656–663 CrossRef CAS PubMed.
- D. W. Davies, K. T. Butler, A. J. Jackson, A. Morris, J. M. Frost, J. M. Skelton and A. Walsh, Chem, 2016, 1, 617–627 CAS.
- D. W. Davies, K. T. Butler, A. J. Jackson, J. M. Skelton, K. Morita and A. Walsh, J. Open Source Softw., 2019, 4, 1361 CrossRef.
- A. Moriarty, K. Butler, A. J. Jackson, D. Davies, A. Onwuli, A. Walsh, J. Skelton, J. M. Frost, T. Gauntlet, L. A. Barba and M. Horton, Structure Prediction Updates, 2021, DOI:10.5281/zenodo.5553202.
- G. Bergerhoff, I. Brown and F. Allen, et al. , Int. Union Crystallogr., 1987, 360, 77–95 Search PubMed.
- H. Glawe, A. Sanna, E. K. U. Gross and M. A. L. Marques, New J. Phys., 2016, 18, 093011 CrossRef.
- H.-C. Wang, S. Botti and M. A. L. Marques, npj Comput. Mater., 2021, 7, 12 CrossRef CAS.
- M. Kusaba, C. Liu and R. Yoshida, Comput. Mater. Sci., 2022, 211, 111496 CrossRef CAS.
- A. Jain, S. P. Ong, G. Hautier, W. Chen, W. D. Richards, S. Dacek, S. Cholia, D. Gunter, D. Skinner, G. Ceder and K. A. Persson, APL Mater., 2013, 1, 011002 CrossRef.
- S. P. Ong, W. D. Richards, A. Jain, G. Hautier, M. Kocher, S. Cholia, D. Gunter, V. L. Chevrier, K. A. Persson and G. Ceder, Comput. Mater. Sci., 2013, 68, 314–319 CrossRef CAS.
- R. D. Shannon, Acta Crystallogr., Sect. A, 1976, 32, 751–767 CrossRef.
- J. George, D. Waroquiers, D. Di Stefano, G. Petretto, G. Rignanese and G. Hautier, Angew. Chem., 2020, 132, 7639–7645 CrossRef.
Footnote |
| † Electronic supplementary information (ESI) available. See DOI: https://doi.org/10.1039/d3dd00121k |
| This journal is © The Royal Society of Chemistry 2023 |