 Open Access Article
Platinum nanoparticles on 3D graphene-like zeolite-templated carbon for benzene hydrogenation†
Somayeh F.
Rastegar
a,
Radim
Pilar
a,
Jaroslava
Moravkova
a,
Galina
Sadovska
ab,
Vasile I.
Parvulescu
c,
Jana
Pastvova
a,
Jan
Plsek
a,
Dalibor
Kaucky
a,
Nikola
Kostkova
ab and
Petr
Sazama
 *a
*a
aJ. Heyrovsky Institute of Physical Chemistry, Academy of Sciences of the Czech Republic, Dolejskova 2155/3, 182 23 Prague, Czech Republic. E-mail: petr.sazama@jh-inst.cas.cz
bUniversity of Pardubice, Faculty of Chemical Technology, Doubravice 41, 53210, Pardubice, Czech Republic
cUniversity of Bucharest, Department of Organic Chemistry and Catalysis, B-dul Regina Elisabeta 4-12, 030016 Bucharest, Romania
First published on 28th July 2023
Abstract
The concentration and dispersion of metal clusters in metal-supported catalysts are essential for the performance of hydrogenation catalysts. In this study, very high concentrations (∼25 wt%) of well-dispersed Pt nanoparticles of the face-centred cubic crystal structure with a mean diameter of ∼1.7 nm were prepared in zeolite-templated carbon (Pt/Y-carbon). The defined 3D porous structure of Pt/Y-carbon formed by nanocasting of the zeolitic channel system and characterised by a specific surface area (∼2440 m2 g−1) comparable to the theoretical surface area of graphene and accessible through 3D organized pores accommodates Pt nanoparticles with high dispersion and specific activity in hydrogenation of benzene to cyclohexane at Pt loadings from 3 to 25 wt%. It provides a multiple increase in the concentration of active Pt sites and a corresponding increase in the TOF and conversions in the hydrogenation reaction. The productivity of the most active catalyst reaches a value of 1.06 × 10⁻³ mol gcat−1 s−1. The study demonstrates a novel concept for the creation of catalysts with a very high concentration of metal clusters dispersed on the support with readily accessible 3D organized pores for reactions catalysed heterogeneously by supported metal nanoparticles.
1. Introduction
Hydrogenation of aromatics is a catalytic process that is especially important for the production of caprolactam and adipic acid via cyclohexane1 and for the reduction of the content of aromatics in automotive and aviation fuels.2,3 The hydrogenation of aromatics and their subsequent dehydrogenation is also one of the promising ways of long-term storage of green hydrogen.4–7 The hydrogenation of benzene is significantly more difficult than the hydrogenation of alkenes or alkynes. The benzene molecule is characterized by delocalization of p-electrons in a p-electron sextet with uniform electron density and identical bond length between all adjacent carbon atoms.8 The conjugated double bond system in the benzene molecule is formal and double bonds are not present in the molecule.8 The bond length between carbon atoms in benzene of 0.139 nm is longer compared to the typical double bond length of 0.134 nm in alkenes. The delocalization of electrons in the benzene molecule compared to the theoretical analogue with conjugated bonds is associated with a delocalization energy of 151 kJ mol−1 and the molecule is much more stable compared to molecules with double bonds.9 The hydrogenation of benzene thus has a large activation energy, and its progress in the range of thermodynamically favourable temperatures for hydrogenation requires the presence of a highly active catalyst.The reaction of benzene hydrogenation is structurally sensitive, where the properties of the metal clusters in the catalyst affect the reaction rate and selectivity. Studies of single crystal and nanoparticle platinum with a defined shape have shown that hydrogenation of benzene on the Pt(100) surface leads to the formation of cyclohexene and cyclohexane, while the Pt(111) surface provides exclusive selectivity for cyclohexane.10 The significantly higher activity observed for Pt nanoparticles compared to the single crystal surface observed by Bratlie et al.11 was attributed to the presence of corner and edge sites on the nanoparticles or a change in the electronic structure of the deposited Pt nanoparticles. Bratlie et al. showed that the electronic and structural properties of the Pt cluster influence the adsorption strength of the benzene molecule on the Pt surface from physical adsorption to chemisorption, resulting in variations in catalytic properties.12
Traditional catalysts for hydrogenation under mild conditions for clean hydrogen sources are based on well-dispersed clusters of precious metals (Pt, Pd, and Rh), most often on activated carbon or alumina. In this study, we investigated the possibilities of using Pt clusters deposited on a 3D graphene-like organized structure of zeolite-templated carbon (ZTC) for the preparation of hydrogenation catalysts. ZTC materials are characterized by a very large specific surface area, structural stability, and accessibility of the entire surface due to the regular organization of the porous structure.13 The structure of ZTC materials at the molecular level was described by Kim et al.14 They showed that ZTC is built systematically from hexagonal rings of carbon atoms like a 3D graphene along the surfaces of zeolite pore walls with the presence of five- or seven-membered rings and various degrees of imperfections forming a 3D inverse replica of the zeolite channel structure. The unique properties of ZTC materials have already been used to develop nanostructured materials for the storage of hydrogen15–17 and CO2 adsorption13,18 and for the development of supercapacitors,19 whose properties significantly exceed those of other materials. The advantage of 3D graphene-like zeolite-templated materials is that they can be prepared in large volumes, enabling their use in catalytic processes.20 The potential of using ZTC for the development of heterogeneous catalysts has so far been investigated only to a very limited extent.21–23
We investigated the effect of a 3D carbon structure characterized by a very large specific surface area of ∼2400 m2 g−1 on the dispersity of Pt, as well as the effect of the interaction of Pt clusters and the 3D graphene-like carbon material on the specific activity of Pt in benzene hydrogenation, to obtain a hydrogenation catalyst, which, with its high activity, would help reduce the reaction temperature in benzene hydrogenation. This is important for an energetically more efficient hydrogen storage process in liquid hydrocarbons. The study shows that ZTC enables the creation of stable hydrogenation catalysts with an extraordinary concentration of active centres and a specific activity that is not achievable for traditional catalysts.
2. Experimental
2.1 Synthesis of Pt-catalysts
The nanocasting method using faujasite (FAU) zeolite (NH4+ form, Si/Al = 6, Zeolyst Int., PN CBV712, LN 712014001708) as a hard template and chemical vapour deposition with propylene (C3H6-CVD) was used to prepare the ZTC material denoted as Y-carbon. The ammonium form of the zeolite (0.5 g) was first treated in a quartz plug flow reactor with a zeolite bed height of 0.5 cm in a helium stream (95 ml min−1) at 750 °C for 15 min with a heating rate of 3 °C min−1; the He stream was then replaced by a stream of 5% C3H6 in He (100 ml min−1) for 2 h at the same temperature, after which the stream was replaced with a stream of pure helium and the temperature was increased to 900 °C for 3 h at a heating rate of 4 °C min−1. The resulting composite was cooled to RT in a stream of helium. The Y-carbon material was obtained by dissolving the zeolite template in the obtained carbon/zeolite composite in three steps. First, 0.5 g of the composite was mixed with a hanging stirrer in a plastic beaker with 175 ml of a 5% aqueous solution of hydrofluoric acid for 5 hours; after decantation, the material was stirred with 30 ml of a 42% aqueous solution of hydrofluoric acid for 1 hour and, after decantation, the material was finally stirred with 30 ml of 37% aqueous solution of hydrochloric acid for 1 hour. All leaching was performed at room temperature. The Y-carbon product was then separated by filtration and washed ten times on a Büchner funnel with a large quantity of demineralized water. Finally, the Y-carbon sample was dried in the air at 120 °C for 12 h. For a detailed description of the synthesis of the Y-carbon, see ref. 21. XFR analysis was employed to confirm the quantitative removal of the zeolite template. Pt/Y-carbon catalysts were prepared by a wet impregnation method. 100 mg of pre-dried Y-carbon material at 90 °C overnight was homogenized in a glass vial with 0.67 g of n-hexane containing the required amount of dissolved (1,5-cyclooctadiene) dimethylplatinum(II) (Pt(cod)(Me)2) to obtain the target Pt loading. The impregnated material was dried at 90 °C overnight and reduced in a stream of nitrogen or hydrogen at 250 °C at a heating rate of 3 °C min−1. Samples reduced in nitrogen and hydrogen were denoted as Pt/Y-carbon(N2) and Pt/Y-carbon(H2), respectively. Activated carbon (Sigma-Aldrich, PN 31616, LN BCCG4825) denoted as AC, alumina (Sasol-Disperal HP-14/2, PN 535100, LN 76674) calcined at 500 °C in air for 3 h and silica (Aerosil Evonik 200) were used to prepare the Pt/AC, Pt/Al2O3 and Pt/SiO2 catalysts. Platinum was introduced into these materials analogously to the preparation of Pt/Y-carbon catalysts.2.2 Characterization of materials
The structure was analysed by X-ray diffraction (XRD) using a MiniFlex600 diffractometer (Rigaku) working in Brag–Brentano (θ/2θ) geometry with a 1D D/teX Ultra silicon strip detector and Kβ filter. CuKα1 (λ = 0.15418 nm) and CuKα2 (λ = 0.15405 nm) radiation was used. The diffractograms were obtained for an angle of 2θ in the range of 2° to 80°, step size 0.01° and with data collection speed of 5° min−1. The porosity of the carbon materials was determined by nitrogen adsorption at the boiling temperature of liquid nitrogen (77 K). Before the adsorption experiments, the samples were degassed at 240 °C for at least 24 h to ensure complete surface cleaning. Experiments were performed using an ASAP2010 instrument (Micromeritics). The BET (Brunauer–Emmett–Teller) theory was used to evaluate the total surface areas. The porosity distribution was evaluated by the original density functional theory using the N2 – DFT model with non-negative regularization. High-resolution transmission electron microscopy (HR-TEM) analysis was carried out using a JEOL JEM 2010 instrument with an accelerating voltage of 200 kV, a La-B6 filament as an electron source, and a resolution of the lattice image of 0.14–0.2 nm. The ImageJ software was used to analyse the size distribution of the Pt clusters. The measurement of 200–500 Pt nanoparticles was used as a basis for the calculation of the mean particle diameter, d | (1) |
 | (2) |
 | (3) |
XPS measurements were made using a VG ESCA3 MkII electron spectrometer with a base pressure less than 10−9 mbar. Al Kα radiation was used for the excitation of electrons. The electrons were energy analysed using a hemispherical analyser operating at a constant pass energy of 20 eV. The spectra were calibrated by setting the C 1s peak that belongs to the sp2 component at a binding energy of 284.5 eV. The estimated error in the determination of the binding energy was ±0.1 eV. The determination of Pt concentration was performed by inductively coupled plasma ionization mass spectrometry (ICP-MS) on an Agilent 7900 spectrometer.
2.3 Analysis of benzene hydrogenation
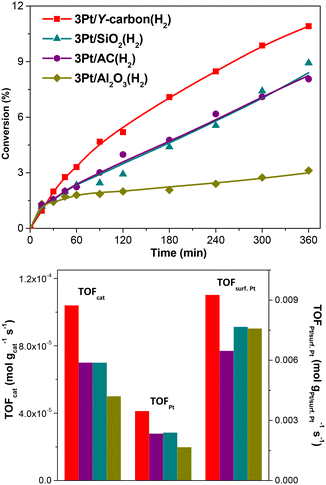
The hydrogenation of benzene was carried out in a 550 ml stirred, pressure batch reactor (Hastelloy C-22, VSK Pardubice) at a temperature of 100 °C and a pressure of 10 bar with n-heptane as a solvent. 190 ml of n-heptane, 10 ml of benzene and 10 mg of catalyst were introduced into the reactor. The reactor was purged with nitrogen and heated to a temperature of 100 °C. Then hydrogen was introduced with a total pressure of 10 bar, which was maintained at a constant value by replacing the consumed hydrogen. The reactor was stirred with a U-stirrer at 150 rpm. Samples were taken every 15 min during the first hour of reaction and every 60 min thereafter. The product analysis was performed using a gas chromatograph (Agilent 6850 Series) equipped with a capillary column (Rtx-volatile amines, 100 m × 0.32 mm × 5 μm) and an FID detector. Catalytic tests were carried out at least twice for all catalysts and a high measurement reproducibility of 3 rel% was achieved (Fig. S1†). To exclude the possible effects of external diffusion, the catalytic test was performed for the most active catalyst at speeds of 100, 150 and 200 rpm, where practically the same conversions were obtained for all speeds. The catalytic activity of each zeolite was defined in terms of conversion of benzene (xB), catalyst productivity calculated per gram of catalyst and the turnover frequency (TOF) calculated per amount of Pt in the catalyst (TOFPt), and per Pt available on the surface of the Pt clusters in the catalyst (TOFsurf. Pt) from low conversion values. The effect of internal diffusion was ruled out by the analysis of Pt/Y-carbon catalysts with different concentrations of active Pt clusters, when a linear dependence was found between the catalytic activity and the concentration of Pt clusters from the smallest to the largest concentration of Pt clusters used in the study.3. Results and discussion
3.1 Synthesis and structural analysis of zeolite-templated 3D graphene-like carbon material
The 3D graphene-like carbon material, denoted Y-carbon, was prepared using a zeolite with a structural topology of faujasite (Si/Al = 6) as a hard template and chemical vapour deposition with propene (C3H6-CVD) as a carbon source. The preparation of Pt/Y-carbon catalysts is illustrated in Fig. 1.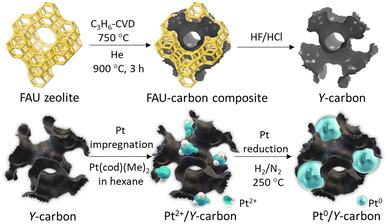 | ||
| Fig. 1 Synthesis scheme of zeolite-templated Y-carbon and subsequent deposition of Pt clusters on the Y-carbon surface. | ||
In the first step, carbon was introduced into the pores of zeolite using C3H6-CVD at a temperature of 750 °C, where C3H6 undergoes a complex catalytic transformation at the present acid centres to form polyaromatics that gradually fill the structure of the zeolite channel. In a subsequent step, at a temperature of 900 °C in a helium stream, the carbon confined in the zeolite channels is graphenized with the formation of a defective graphene-like layer around the walls of the zeolite channel. In the next step, zeolite is quantitatively removed from the resulting carbon/zeolite composite by dissolving it in hydrofluoric and hydrochloric acids to release the 3D graphene-like carbon material.
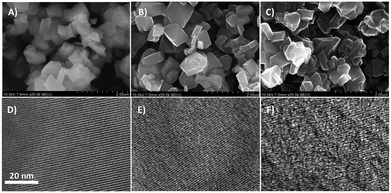
Fig. 2 shows representative HR-SEM and HR-TEM images of the zeolite faujasite used as a hard template, the carbon/zeolite composite, and the resulting Y-carbon material. HR-SEM images show the same external morphology of the zeolite crystals, the carbon/zeolite composite, and the resulting Y-carbon material characteristic of the preparation of carbon structures by nanocasting of a hard template. Fine crystal lattice fringes observed in the HR-TEM image of the carbon/zeolite composite indicate preservation of the zeolite structure during formation of the carbon structure during CVD and graphenisation at high temperatures. The HR-TEM image of Y-carbon shows the presence of less rendered lattice fringes, indicating regularity of the imprinted inverse channel structure of the zeolite into Y-carbon with the presence of defects and a lesser degree of regularity compared to the crystalline structure of the zeolite. The HR-TEM images also revealed that the layered structure of the stacked graphene layers is not present in a substantial amount on the surface of the crystals, indicating that the carbon material was exclusively formed in the channel structure of the zeolite where there is not enough space for the formation of multilayer graphite structures.14,21 The chemical analysis performed by XRF confirmed the absence of Al and Si in the resulting Y-carbon material within the sensitivity of the method. The X-ray diffraction pattern of Y-carbon (Fig. 3A) shows an intense signal at 6° 2 theta characteristic of the spacing between the basal diffraction planes given by the replication of the building units of the faujasite template in Y-carbon. The diffractogram is characteristic of a well-developed zeolite-templated carbon material14,21 and is consistent with TEM analysis; it does not show the presence of a graphitic phase. The spatial limitations imposed by the size of the channels do not allow graphitization of the carbon deposited in the channels even at high temperatures.25 The nitrogen adsorption–desorption isotherms at 77 K for the Y-carbon material are shown in Fig. 3B. The isotherms exhibit high adsorption at low relative pressures P/P0 ≤ 0.1 due to the filling of the micropores. Adsorption at higher pressures and hysteresis can be attributed to the filling of the mesopores created by imperfect replication of the zeolite structure and to adsorption on the external surface of the particles and in interparticle voids. The obtained specific surface area of 2443 m2 g−1 is close to the theoretical surface of graphene of 2630 m2 g−1 and the total pore volume of 1.33 cm3 g−1 with a predominance of micropores of 1.23 cm3 g−1 is close to the theoretical volume of a non-defective zeolite replica of the faujasite channel structure of 1.45 cm3 g−1 calculated by Kim et al.14 The specific surface area of Y-carbon is consistent with the formation of a monolayer structure without significant formation of stacked layers of carbon. The 13C MAS NMR spectra of the Y-carbon sample in Fig. 3C exhibit two peaks with chemical shift at 124.0 ppm and 129.3 ppm characteristic of sp2 hybridized carbon. The peak at 124.0 ppm can be attributed to six-membered-rings and the peak at 129 ppm can be assigned to five- or seven-membered rings.14 The signal attributable to sp3 hybridization is not present in the spectrum, which is consistent with the highly predominant graphene-like deformed planar Y-carbon structure without a significant presence of sp3 hybridized carbon with tetrahedral geometry.
Understanding the structure of zeolite-templated carbon materials at the molecular level has received considerable attention in the scientific literature. Ma et al.26 described the structure as curved graphene, whose curvatures resemble the spatial orientation of the inner zeolite nanochannel. Nishihara et al.27 described the structure of the carbon material as an assembly of individual nanometer-sized non-folded graphene fragments, which are curved like buckybowls resembling zeolite channels in their spatial orientation. Later, Nueangnoraj et al.28 depicted zeolite-templated carbon as a three-dimensionally ordered, cross-linked fullerene-like structure. Finally, the structure was solved at the molecular level by Kim et al.14 who showed that the carbon structure is systematically built from hexagonal rings of carbon atoms as 3D graphene spatially arranged as zeolite pore walls with the presence of many defects whose population depends on the method of synthesis. The analysis of Y-carbon using complementary HR-TEM, XRD, N2 adsorption and 13C MAS NMR methods showed that its structure is characterised by i) the inverse channel structure of zeolite with defects and a lower degree of regularity compared to zeolite, ii) the specific surface area of 2443 m2 g−1 close to the theoretical surface of graphene 2630 m2 g−1 and the total pore volume of 1.33 cm3 g−1 close to the theoretical volume of a non-defective zeolite replica of the faujasite channel structure of 1.45 cm3 g−1 (ref. 14) and iii) the predominant graphene-like deformed layers without significant formation of stacked layers of carbon and without a significant concentration of sp3 hybridized carbon with tetrahedral geometry.
3.2 Platinum nanoparticles in the zeolite-templated 3D graphene-like carbon material
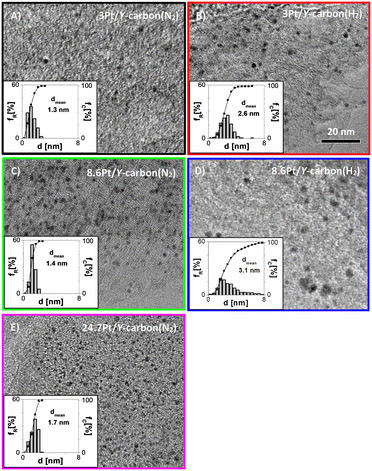
Platinum was introduced into the Y-carbon material by impregnation with a solution of (1,5-cyclooctadiene)dimethylplatinum(II) in n-hexane and subsequent reduction (Fig. 1). Fig. 4 shows representative HR-TEM images and the corresponding analyses of the distributions of the Pt cluster sizes of Pt/Y-carbon materials reduced in a stream of nitrogen or hydrogen at 250 °C. The mean particle diameters for nitrogen treated samples were 1.3 nm and 1.4 nm for 3Pt/Y-carbon and 8.6Pt/Y-carbon, respectively, and for those calcined in hydrogen 2.6 nm and 3.1 nm for 3Pt/Y-carbon and 8.6Pt/Y-carbon, respectively. Pt/Y-carbon with a very high Pt concentration of 24.7 wt% was prepared using the same method of impregnation and nitrogen reduction. A representative HR-TEM image and analysis of the platinum particle size distribution show the presence of uniform, very well dispersed Pt clusters with an average size of 1.7 nm. This indicates the extraordinary ability of the Y-carbon material to disperse a great number of metal nanoclusters. We assume that the high dispersity of Pt even with high Pt loading can be ensured by the very high surface of the carbon support and the very high concentration of defects (holes, vacancies) present on the support enabling the stabilization of Pt clusters. The Pt dispersion (D) was calculated from the volume-area mean diameter assuming a face centred cubic structure and the spherical Pt clusters typical of Pt nanoparticles24 and the characteristic of all measured samples are listed in Table 1. Determining the surface Pt atoms from the cluster size distribution overcome the problems associated with the use of titration of the surface Pt sites with H2. When analysing the hydrogen adsorption on the platinum-free Y-carbon surface, we observed significant hydrogen adsorption on the defect centres of the very large Y-carbon surface.21 The degree of hydrogen spillover is then further enhanced by the presence of Pt (ref. 29) and the large strength of the hydrogen bonds on the defect centres leads to difficulties in distinguishing adsorption on the various surfaces, leading to a non-negligible analysis error. On the contrary, careful analysis of the dispersion using HR-TEM microscopy provided a sufficiently accurate estimate of the dispersion of Pt.| Sample | Pt loading | d | d VA | D |
|---|---|---|---|---|
| Wt% | nm | nm | % | |
| a Reduced at 350 °C. b Mean particle diameter from HR-TEM analysis. c The mean diameter volume-area from HR-TEM analysis. d The Pt dispersion calculated with the assumption of the face-centred cubic crystal structure and spherical Pt clusters. | ||||
| 3Pt/Y-carbon(N2) | 3.0 | 1.3 ± 0.6 | 1.8 | 62.4 |
| 3Pt/Y-carbon(H2) | 3.0 | 2.6 ± 0.8 | 3.0 | 37.5 |
| 8.6Pt/Y-carbon(N2) | 8.6 | 1.4 ± 0.3 | 1.6 | 70.2 |
| 8.6Pt/Y-carbon(H2) | 8.6 | 3.1 ± 1.6 | 4.8 | 23.4 |
| 24.7Pt/Y-carbon(N2) | 24.7 | 1.7 ± 0.5 | 1.9 | 59.1 |
| 3Pt/AC(H2) | 3.0 | 2.3 ± 0.9 | 3.1 | 36.3 |
| 3Pt/SiO2(H2)a | 2.9 | 2.8 ± 1.0 | 3.6 | 31.2 |
| 3Pt/Al2O3(H2) | 2.8 | 2.6 ± 2.0 | 5.1 | 22.0 |
The XRD patterns of the samples treated in a stream of hydrogen and nitrogen are shown in Fig. 5. All the samples exhibit characteristic peaks of the (111), (200), (220) and (311) planes of the face-centred cubic (fcc) crystal structure of platinum.30 Samples processed in a hydrogen atmosphere exhibit much sharper peaks, reflecting the larger size of the platinum nanoparticles, in agreement with the results of the TEM analyses.
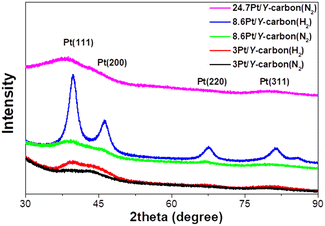 | ||
| Fig. 5 XRD analysis of the effect of the reducing atmosphere (N2 or H2 at 250 °C for 3 h) on Pt in Pt/Y-carbon materials. | ||
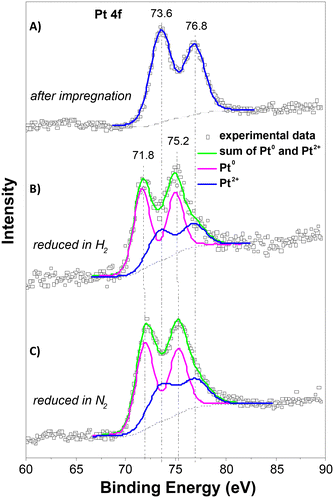
The XPS spectra of the Pt 4f lines were used to analyse the oxidation state of Pt. Fig. 6 depicts the spectra after impregnation with Pt2+ and after treatment in a nitrogen or hydrogen atmosphere at 250 °C. The spectrum of the impregnated sample exhibits a characteristic doublet with binding energy maxima at 73.6 and 76.8 eV, characteristic of Pt2+.31 Treatment in both atmospheres led to the formation of a doublet with maxima 71.8 and 75.2 eV, characteristic of metallic platinum.31 Deconvolution of the spectra shows that the reduction of Pt2+ to Pt0 occurred to the same extent in both atmospheres. This suggests that reduction in the nitrogen environment probably takes place with the participation of the hydrocarbon ligand in the Pt source or the Y-carbon support, and this leads to a much better dispersion of Pt compared to that of reduction in hydrogen.
The HR-TEM, XRD and XPS analyses showed that the Y-carbon material enables the accommodation of very high concentrations of well dispersed Pt clusters of the face-centred cubic crystal structure with a smaller mean diameter of Pt nanoparticles obtained by treatment in a nitrogen atmosphere (d ∼ 1.5 nm) compared to a hydrogen atmosphere (d ∼ 3 nm).
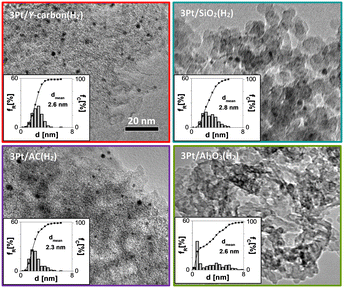
To analyse the properties of Pt/Y-carbon materials compared to those of commonly used Pt catalysts, we supported Pt on commercial oxide supports (alumina and silica) and also on activated carbon. We attempted to prepare a series of Pt-catalysts with the same Pt concentration and similar Pt dispersity, so that the effect of the Y-carbon support on the catalytic activity and selectivity could be analysed. The combination of XRD analysis and N2 adsorption for the used supports exhibited the characteristic structure of η-alumina and an amorphous silica structure with well-developed surfaces suitable for catalyst preparation (Fig. S2 and Table S1†). Activated carbon material is characterized by a well-developed porous structure and large specific surface area (Fig. S2 and Table S1†). Characteristic HR-TEM images for the series of 3Pt/Al2O3(H2), 3Pt/SiO2(H2), 3Pt/AC(H2) and 3Pt/Y-carbon(H2) catalysts with a particle size distribution of Pt are shown in Fig. 7. All materials are characterized by a similar mean particle size of Pt (2.3–2.8 nm) and a Pt concentration of 2.8–3 wt%. The X-ray diffraction patterns of the samples exhibit peaks characteristic of the planes (111), (200), (220) and (311) of the face-centred cubic (fcc) crystal structure of platinum with a similar half-width of the characteristic Pt bands, also indicating a similar size of the Pt clusters on all the supports (Fig. S3†).
3.3 Hydrogenation of benzene
| Sample | x B | Catalyst productivityb | TOFPtc | TOFsurf. Ptd |
|---|---|---|---|---|
| % | mol gcat−1 s−1 | mol gPt−1 s−1 | mol gsurf. Pt−1 s−1 | |
| a The conversion at a reaction time of 60 min. b Calculated per gram of catalyst. c Calculated per Pt in the catalyst. d Calculated per Pt available on the surface of the Pt clusters in the catalyst. | ||||
| 3Pt/Y-carbon(H2) | 3.4 | 1.0 × 10⁻⁴ | 3.4 × 10⁻³ | 9.1 × 10⁻³ |
| 3Pt/AC(H2) | 2.4 | 0.7 × 10⁻⁴ | 2.3 × 10⁻³ | 6.5 × 10⁻³ |
| 3Pt/SiO2(H2) | 2.3 | 0.7 × 10⁻⁴ | 2.4 × 10⁻³ | 7.7 × 10⁻³ |
| 3Pt/Al2O3(H2) | 1.7 | 0.5 × 10⁻⁴ | 1.7 × 10⁻³ | 7.6 × 10⁻³ |
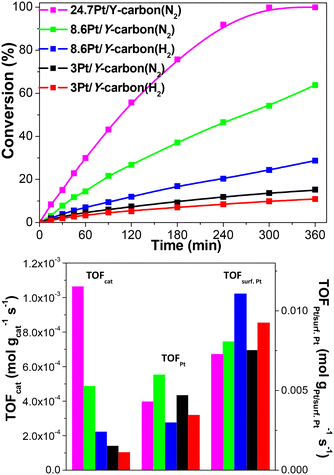 | ||
| Fig. 9 Effect of the Pt loading and the reducing atmosphere (N2 or H2 at 250 °C for 3 h) on the activity of Pt/Y-carbon catalysts in the hydrogenation of benzene to cyclohexane. | ||
| Sample | x B | Catalyst productivityb | TOFPtc | TOFsurf. Ptd |
|---|---|---|---|---|
| % | mol gcat−1 s−1 | mol gPt−1 s−1 | mol gsurf. Pt−1 s−1 | |
| a The conversion at a reaction time of 60 min. b Calculated per gram of catalyst. c Calculated per Pt in the catalyst. d Calculated per Pt available on the surface of the Pt clusters in the catalyst. | ||||
| 3Pt/Y-carbon(N2) | 4.6 | 1.4 × 10⁻⁴ | 4.7 × 10⁻³ | 7.5 × 10⁻³ |
| 3Pt/Y-carbon(H2) | 3.4 | 1.0 × 10⁻⁴ | 3.4 × 10⁻³ | 9.1 × 10⁻³ |
| 8.6Pt/Y-carbon(N2) | 14.9 | 4.8 × 10⁻⁴ | 5.6 × 10⁻³ | 8.0 × 10⁻³ |
| 8.6Pt/Y-carbon(H2) | 7.0 | 2.2 × 10⁻⁴ | 2.6 × 10⁻³ | 11.1 × 10⁻³ |
| 24.7Pt/Y-carbon(N2) | 29.9 | 10.6 × 10⁻⁴ | 4.3 × 10⁻³ | 7.3 × 10⁻³ |
The apparent activation energies (Ea) estimated for the 3Pt/Y-carbon(N2), 3Pt/Y-carbon(H2) and 3Pt/AC(H2) catalysts from the Arrhenius plots are shown in Fig. 10. The Ea for cyclohexane production for the two Pt/Y-carbon catalysts were very close, around 62 kJ mol−1, indicating a similar reaction mechanism, which is independent of the catalyst preparation procedures. A significantly lower Ea of 29.2 kJ mol−1 was obtained for Pt supported on activated carbon. The difference in Ea indicates that the incorporation of Pt clusters into the specific structure of the Y-carbon modifies the mechanism of the hydrogenation process. The higher Ea values for the 3Pt/Y-carbon catalysts compared to 3Pt/AC(H2) were compensated for by a three orders of magnitude larger pre-exponential factor, cf. ln![[thin space (1/6-em)]](https://www.rsc.org/images/entities/char_2009.gif) A −0.5 for 3Pt/AC(H2) vs. ln
A −0.5 for 3Pt/AC(H2) vs. ln![[thin space (1/6-em)]](https://www.rsc.org/images/entities/char_2009.gif) A 10.8 for 3Pt/Y-carbon(N2) and 3Pt/Y-carbon(H2). The Ea of 3Pt/Y-carbon is also higher than the Ea of 34.7 and 45.6 kJ mol−1 observed by Bratlie et al.11 for the hydrogenation of benzene in cuboctahedral and cubic Pt nanoparticles deposited in Si wafers.
A 10.8 for 3Pt/Y-carbon(N2) and 3Pt/Y-carbon(H2). The Ea of 3Pt/Y-carbon is also higher than the Ea of 34.7 and 45.6 kJ mol−1 observed by Bratlie et al.11 for the hydrogenation of benzene in cuboctahedral and cubic Pt nanoparticles deposited in Si wafers.
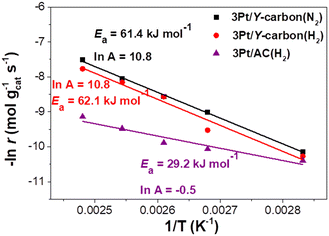 | ||
| Fig. 10 The Arrhenius plot for hydrogenation of benzene to cyclohexane over 3Pt/Y-carbon catalysts compared to 3Pt/AC(H2). | ||
To analyse the stability of the catalytic activity of the Pt/Y-carbon catalysts, catalytic performance was monitored with reused catalysts without any treatment or reactivation between three subsequent catalytic tests. Reuse of the 8.6Pt/Y-carbon(H2) catalyst gave catalyst productivity after 180 min of 1.87 × 10⁻⁴, 1.92 × 10⁻⁴ and 1.01 × 10⁻⁴ mol gcat−1 s−1, after the first, by the second and third use, respectively. After the third use, there was a noticeable decrease in the catalytic efficiency. The size of the Pt clusters present on the three times used catalyst was analysed by HR-TEM and no change in the size distribution was observed (Supplement S5†). Gradual deactivation during benzene hydrogenation on supported Pt catalysts was previously observed by Pushkarev et al.36 who explained the gradual decrease in activity by the accumulation of the polymeric surface carbon species, which are formed during reaction on the Pt clusters. Since we did not observe sintering of Pt clusters during the catalytic test, the observed gradual deactivation could be explained by the same mechanism. The polymeric surface carbon species can be removed in most cases and the initial activity restored by repeating the catalyst reduction treatment in hydrogen or steam,36 however, the investigation of suitable reactivation conditions is the subject of further studies.
Fig. 11 depicts the dependence of the initial catalyst productivity on the amount of surface Pt. The increase in the catalytic activity of the catalysts proportional to the increase in the concentration of Pt centres in a wide range of Pt concentrations from 3 to 24.7 wt% Pt indicates that the reaction is not limited by mass transport even at a very large concentration of active sites. The 3D porous structure given by the replication of the large pore 3D zeolite template enables good accessibility to all the active centres.
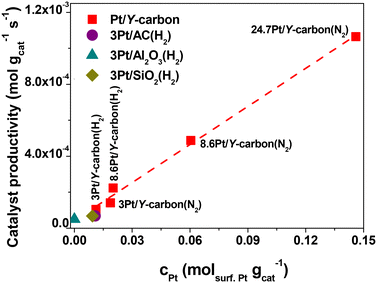 | ||
| Fig. 11 Dependence of the catalyst productivity on the amount of surface Pt in the hydrogenation of benzene to cyclohexane over Pt catalysts. | ||
A comparison of the activity of the 8.6Pt/Y-carbon catalyst with the commercial 10Pt/carbon catalyst based on activated carbon is depicted in Fig. S6.† The comparison shows higher conversions of benzene achieved on 8.6Pt/Y-carbon despite the slightly higher concentration of Pt in the commercial catalyst. The result is consistent with the higher activity observed for 3Pt/Y-carbon compared to the 3Pt/AC catalyst prepared by depositing Pt clusters on activated carbon in our study. The result is also consistent with the results reported by Liao et al.,37 who showed that nanometer-sized Pt clusters deposited on the surface of single-walled carbon nanotubes, which are formed like Y-carbon by a single layer of spatially ordered graphene, provide much greater catalytic activities compared to commercially available carbon-supported Pt catalysts.
Table S3† compares the productivity of the most active 24.7Pt/Y-carbon(N2) catalyst with Pt supported catalysts of various structures and compositions found in the literature. The productivity for the 24.7Pt/Y-carbon(N2) is 10.6 × 10⁻⁴ mol gcat−1 s−1, while for the Pt supported catalyst based on activated carbon, mesoporous silica and other oxide supports, it is typically in the 6.11 × 10⁻⁷–6.33 × 10⁻⁵ mol gcat−1 s−1 range.32,37–40 Although the conditions of the catalytic tests are different in individual studies, the Pt deposited on conventional supports generally exhibit lower productivity than the 24.7Pt/Y-carbon(N2). Comparison of the productivity of Pt/Y-carbon catalysts with the productivity of the prepared Pt catalysts with deposited Pt clusters on conventional supports (Table 2, Fig. 8) and with a commercial Pt carbon catalyst (Fig. S6†) and comparison with published data on benzene hydrogenation on Pt catalysts (Table S3†)32,37–40 show that the arrangement of the Pt clusters in the 24.7Pt/Y-carbon(N2) provides significantly higher activity compared to conventional Pt supported catalysts. This emphasizes the unique activity of the Pt active sites in the Pt/Y-carbon catalysts. To show the versatility of the Pt/Y-carbon catalyst, the hydrogenation of ethylbenzene was also performed. Comparison of the catalytic activity of 8.6Pt/Y-carbon(H2) in the hydrogenation of benzene and ethylbenzene in Fig. S7† shows a higher conversion achieved during the hydrogenation of ethylbenzene. A higher conversion of alkyl benzenes compared to benzene has been reported in the literature for some metal-supported catalysts.1,41
The Y-carbon material thus enabled the formation of catalysts with a unique large concentration of well-dispersed and fully functional Pt clusters, whose practical use, however, may be limited to special applications due to the high price of the precious metal. Nevertheless, the well-defined and functionally well-understood Pt catalysts illustrate a concept for the formation of catalysts with a very high concentration of supported metal clusters for heterogeneously catalysed reactions. The concentration and dispersion of supported metal nanoparticles are decisive for the functioning of a large number of important catalytic processes. It can be assumed that, as was shown for Pt/Y-carbon, the structure of ZTC materials can be exploited for the deposition of very high concentrations of other active metal nanoparticles.
4. Conclusions
Our findings suggest that 3D graphene-like microporous Y-carbon synthesized in a zeolite template with a specific surface area comparable to the theoretical surface area of graphene and curved surface accessible through the channel system enables accommodation of very large concentration of well dispersed Pt nanoparticles. With a comparable Pt loading in catalysts (∼3 wt%) and a similar size distribution of the Pt clusters, Pt/Y-carbon provides only slightly increased activity compared to Pt on standard Al2O3, SiO2 and activated carbon supports. However, Pt/Y-carbon catalysts can be prepared with a very wide range of metal loadings up to at least 25 wt% with very good dispersion of the metal particles. Due to the 3D-organised open porous structure that allows access to the active centres, the TOFPt values are comparable even for very large Pt loadings. The catalytic activity of Pt/Y-carbon is thus directly proportional to the Pt loading, and the high concentration of active Pt sites results in extraordinarily high activities in the hydrogenation of benzene to cyclohexane. The productivity of the most active catalyst reaches very high values of 1.06 × 10⁻³ mol gcat−1 s−1, exceeding by many times the common catalysts described in the literature, however, upon repeated use, the catalyst gradually deactivates, which is not caused by the sintering of Pt clusters, but may be associated with the formation of hydrocarbons deposits. The Pt nanoparticles supported on zeolite-templated Y-carbon are an example of a new class of ZTC metal-supported catalysts providing a very large concentration of metal sites on a readily accessible 3D-organized porous support.Author contributions
S. F. R., D. K., N. K.: investigation. R. P., J. M., G. S., J. P., J. P.: methodology and investigation. G. S.: methodology, investigation and writing – review & editing. V. I. P.: methodology, investigation and supervision. P. S.: conceptualization, funding acquisition, supervision, writing – original draft, writing – review & editing.Conflicts of interest
There are no conflicts to declare.Acknowledgements
This work was supported by the Czech Science Foundation under Project No. 21-07753S. The authors acknowledge the assistance provided by the Research Infrastructure NanoEnviCz (Projects No. LM2023066, EF18_046/0015586, LM2018124), supported by the Ministry of Education, Youth and Sports of the Czech Republic and The European Union – European Structural and Investments Funds in the frame of Operational Programme Research Development and Education.References
- A. Stanislaus and H. C. Barry, Catal. Rev.: Sci. Eng., 1994, 36, 75–123 CrossRef CAS.
- A. Corma, A. Martínez and V. Martínez-Soria, J. Catal., 1997, 169, 480–489 CrossRef CAS.
- C. Song and X. Ma, Appl. Catal., B, 2003, 41, 207–238 CrossRef CAS.
- H. Jorschick, P. Preuster, A. Bösmann and P. Wasserscheid, Sustainable Energy Fuels, 2021, 5, 1311–1346 RSC.
- E. Newson, T. Haueter, P. Hottinger, F. Von Roth, G. W. H. Scherer and T. H. Schucan, Int. J. Hydrogen Energy, 1998, 23, 905–909 CrossRef CAS.
- P. M. Modisha, C. N. M. Ouma, R. Garidzirai, P. Wasserscheid and D. Bessarabov, Energy Fuels, 2019, 33, 2778–2796 CrossRef CAS.
- M. S. Salman, N. Rambhujun, C. Pratthana, K. Srivastava and K. F. Aguey-Zinsou, Ind. Eng. Chem. Res., 2021 DOI:10.1021/acs.iecr.1c03970.
- T. C. Dinadayalane, U. D. Priyakumar and G. N. Sastry, J. Phys. Chem. A, 2004, 108, 11433–11448 CrossRef CAS.
- I. Heo, J. C. Lee, B. R. Özer and T. Schultz, J. Phys. Chem. Lett., 2022, 13, 8278–8283 CrossRef CAS PubMed.
- K. M. Bratlie, C. J. Kliewer and G. A. Somorjai, J. Phys. Chem. B, 2006, 110, 17925–17930 CrossRef CAS PubMed.
- K. M. Bratlie, H. Lee, K. Komvopoulos, P. Yang and G. A. Somorjai, Nano Lett., 2007, 7, 3097–3101 CrossRef CAS PubMed.
- K. M. Bratlie, M. O. Montano, L. D. Flores, M. Paajanen and G. A. Somorjai, J. Am. Chem. Soc., 2006, 128, 12810–12816 CrossRef CAS PubMed.
- H. Nishihara and T. Kyotani, Chem. Commun., 2018, 54, 5648–5673 RSC.
- K. Kim, T. Lee, Y. Kwon, Y. Seo, J. Song, J. K. Park, H. Lee, J. Y. Park, H. Ihee, S. J. Cho and R. Ryoo, Nature, 2016, 535, 131–135 CrossRef CAS PubMed.
- Z. Yang, Y. Xia, X. Sun and R. Mokaya, J. Phys. Chem. B, 2006, 110, 18424–18431 CrossRef CAS PubMed.
- Y. Xia, G. S. Walker, D. M. Grant and R. Mokaya, J. Am. Chem. Soc., 2009, 131, 16493–16499 CrossRef CAS PubMed.
- L. S. Blankenship and R. Mokaya, Mater. Adv., 2022, 3, 1905–1930 RSC.
- S. K. Lee, S. W. Han, G. Y. Cha, J. M. Park, H. Park, R. Ryoo and U. H. Lee, J. CO2 Util., 2022, 62 CAS.
- H. Nishihara and T. Kyotani, Adv. Mater., 2012, 24, 4473–4498 CrossRef CAS PubMed.
- H. C. Kwon, S. Choi, Y. Wang, R. Othman and M. Choi, Microporous Mesoporous Mater., 2020, 307 Search PubMed.
- P. Sazama, J. Pastvova, C. Rizescu, A. Tirsoaga, V. I. Parvulescu, H. Garcia, L. Kobera, J. Seidel, J. Rathousky, P. Klein, I. Jirka, J. Moravkova and V. Blechta, ACS Catal., 2018, 8, 1779–1789 CrossRef CAS.
- C. Jiang, K. Hara, K. Namba, H. Kobayashi, S. Ittisanronnachai, H. Nishihara, T. Kyotani and A. Fukuoka, Chem. Lett., 2014, 43, 1794–1796 CrossRef.
- P.-W. Chung, M. Yabushita, A. T. To, Y. Bae, J. Jankolovits, H. Kobayashi, A. Fukuoka and A. Katz, ACS Catal., 2015, 5, 6422–6425 CrossRef CAS.
- J. F. Scholten, Preparation of Catalysts II, Scientific Bases for the Preparation of Heterogeneous Catalysts, 1979, pp. 685–714 Search PubMed.
- Z. Yang, Y. Xia and R. Mokaya, J. Am. Chem. Soc., 2007, 129, 1673–1679 CrossRef CAS PubMed.
- Z. X. Ma, T. Kyotani, Z. Liu, O. Terasaki and A. Tomita, Chem. Mater., 2001, 13, 4413-+ CrossRef CAS.
- H. Nishihara, Q. H. Yang, P. X. Hou, M. Unno, S. Yamauchi, R. Saito, J. I. Paredes, A. Martinez-Alonso, J. M. D. Tascon, Y. Sato, M. Terauchi and T. Kyotani, Carbon, 2009, 47, 1220–1230 CrossRef CAS.
- K. Nueangnoraj, H. Nishihara, K. Imai, H. Itoi, T. Ishii, M. Kiguchi, Y. Sato, M. Terauchi and T. Kyotani, Carbon, 2013, 62, 455–464 CrossRef CAS.
- H. Nishihara, P. X. Hou, L. X. Li, M. Ito, M. Uchiyama, T. Kaburagi, A. Ikura, J. Katamura, T. Kawarada, K. Mizuuchi and T. Kyotani, J. Phys. Chem. C, 2009, 113, 3189–3196 CrossRef CAS.
- G.-W. Yang, G.-Y. Gao, G.-Y. Zhao and H.-L. Li, Carbon, 2007, 45, 3036–3041 CrossRef CAS.
- R. Yu, L. Chen, Q. Liu, J. Lin, K. L. Tan, S. C. Ng, H. S. O. Chan, G. Q. Xu and T. S. A. Hor, Chem. Mater., 1998, 10, 718–722 CrossRef CAS.
- S. D. Lin and M. A. Vannice, J. Catal., 1993, 143, 539–553 CrossRef CAS.
- P. Antonucci, N. van Truong, N. Giordano and R. Maggiore, J. Catal., 1982, 75, 140–150 CrossRef CAS.
- N. Alam and R. Mokaya, Microporous Mesoporous Mater., 2011, 142, 716–724 CrossRef CAS.
- X. Liu, Y. Han, J. W. Evans, A. K. Engstfeld, R. J. Behm, M. C. Tringides, M. Hupalo, H. Q. Lin, L. Huang, K. M. Ho, D. Appy, P. A. Thiel and C. Z. Wang, Prog. Surf. Sci., 2015, 90, 397–443 CrossRef CAS.
- V. V. Pushkarev, K. An, S. Alayoglu, S. K. Beaumont and G. A. Somorjai, J. Catal., 2012, 292, 64–72 CrossRef CAS.
- Y. J. Liao, H. B. Pan and C. M. Wai, J. Nanosci. Nanotechnol., 2011, 11, 8580–8585 CrossRef CAS PubMed.
- J. Lee, E. J. Jang and J. H. Kwak, Appl. Catal., A, 2019, 569, 8–19 CrossRef CAS.
- A. F. Flores, R. L. Burwell and J. B. Butt, J. Chem. Soc., Faraday Trans., 1992, 88, 1191–1196 RSC.
- V. Fouche, P. Magnoux and M. Guisnet, Appl. Catal., 1990, 58, 189–198 CrossRef CAS.
- P. Dufresne, P. H. Bigeard and A. Billon, Catal. Today, 1987, 1, 367–384 CrossRef CAS.
Footnote |
| † Electronic supplementary information (ESI) available. See DOI: https://doi.org/10.1039/d3cy00617d |
| This journal is © The Royal Society of Chemistry 2023 |

