 Open Access Article
Iron-doped Co3O4 catalysts prepared by a surfactant-assisted method as effective catalysts for malic acid oxidative decarboxylation
Gheorghiţa
Mitran
 *a,
Ştefan
Neaţu
 b,
Octavian Dumitru
Pavel
 a,
Adriana
Urdă
a,
Anca G.
Mirea
b,
Mihaela
Florea
a,
Adriana
Urdă
a,
Anca G.
Mirea
b,
Mihaela
Florea
 ab and
Florentina
Neaţu
 *b
*b
aDepartment of Inorganic, Organic Chemistry, Biochemistry & Catalysis, Faculty of Chemistry, University of Bucharest, 4-12, Blv. Regina Elisabeta, 030018 Bucharest, Romania. E-mail: geta.mitran@chimie.unibuc.ro; geta_mitran@yahoo.com
bNational Institute of Material Physics, 405A Atomiştilor Street, PO Box MG 7, 077125 Măgurele, Romania. E-mail: florentina.neatu@infim.ro
First published on 27th June 2023
Abstract
Iron-doped Co3O4 oxides prepared by a surfactant-assisted method exhibited good catalytic activity in malic acid conversion, and the oxygen defects associated with the presence of Co2+ played a key role in catalyst activation for pyruvic acid production. The most active catalyst, for which the malic acid conversion was 70% and the pyruvic acid yield was 24%, has an inverse spinel type structure (Fe3+ replaces Co2+ from tetrahedral sites, while Fe2+ replaces Co3+ from octahedral sites) as well as a small energy difference between the highest occupied orbital and the lowest unoccupied orbital (low band-gap, Eg). The catalyst with the highest Co2+ loading showed the highest yield of pyruvic acid.
1. Introduction
Malic acid is among the first 12 chemicals produced from renewable sources of carbohydrates, and can later be transformed into a variety of high-value biochemicals, so its world market reaches 200![[thin space (1/6-em)]](https://www.rsc.org/images/entities/char_2009.gif) 000 tons per year.1
000 tons per year.1
The L-malic acid enantiomer, known as “apple acid”, is the only one that exists in nature in fruits and vegetables, particularly in apples, while the D-malic acid enantiomer does not exist in nature. A mixture of DL-malic acid enantiomers is produced through industrial synthesis2,3 as well as by the enzymatic hydration of fumarate, the latter method being under development. Considering the global trend at the industrial level to find viable solutions for oil-based compounds, malic acid production through enzymatic fermentation has gained more attention. In this regard, the industrial interest in the production of malic acid by microbial fermentation has increased, especially through the classic tricarboxylic acid (TCA) cycle, which converts 1 mole of glucose into 2 moles of malic acid. There are also many other methods for malic acid production, some of them focusing on the use of glycerol as a raw material, but active microorganisms for this process are still sought after.4,5
Malic acid is primarily used as a substrate in the production of homo- and heteropolymers, such as polymalic acid (by ring-opening polymerization or polycondensation), a biodegradable, bioabsorbable, water soluble and innovative bio-polymer6 with medical applications by the introduction of drugs into its polymer chain. It also has applications in the pharmaceutical field as a component of the migraine drug almotriptan malate, in the semiconductor industry as a polishing and cleaning material, and also as an animal feed additive.7
Pyruvic and malonic acids can be obtained through photocatalytic oxidation of malic acid using a TiO2-coated optical fiber reactor8 or an illuminated aqueous suspension of TiO2.9 Pyruvic acid represents a precursor for pharmaceutical chemicals (such as tryptophan, tyrosine, cysteine, leucine, vitamin B12 and vitamin B6),10 a functional additive for beverages11 and a substrate for pesticide synthesis.12 The traditional route for pyruvic acid synthesis is tartaric acid pyrolysis, a method with several environmental and economic disadvantages. Malonic acid is widely used in the production of pharmaceuticals, petrochemicals and cosmetics. The traditional route for malonic acid production consists of petrochemical processes using fossil resources.13
Biomass-derived acid decarboxylation is applied in the chemical industry as a method for obtaining valuable products, such as alkanes, alkenes with fuel and synthetic applications,14 carbonyl compounds with applications as solvents and as feed for bulk chemicals,15 ethers, and nitriles.16,17
Transition metal oxides belonging to the iron series, such as Co3O4, have been developed and used as catalysts, particularly for the purpose of selective oxidation of alcohols,18–20 and oxygen reduction.21 These catalysts possess advantageous properties, such as redox properties, cost-effectiveness, eco-friendliness and uncomplicated synthesis methods.22–24
Many synthesis methods have been used to control the phase composition, homogeneity, purity and microstructure of Co3O4 materials;25,26 however, many challenges remain in terms of the synthesis method, the factors that influence the network structure and texture remaining to be determined. Organic surfactants were used in order to control the growth, taking into account the tendency of Co3O4 to form larger and irregular particles. Wang et al.27 reported the synthesis of Co3O4 using a surfactant-assisted method in the presence of cetyltrimethylammonium bromide (CTAB) yielding nanomaterials with diameters ranging from 15 to 25 nm. Deng et al.28 used a citrate gel combustion method to investigate the effect of changing the fuel ratio on the phase composition and morphology, an excess of fuel leading to a transformation from granular Co3O4 aggregates with a cubic structure to a mixture of cubic Co3O4 and tetragonal CoO phases. At the same time, Singhal et al.29 reported a solution combustion method in the presence of urea, obtaining particles around 50–70 nm in size, with a hexagonal morphology.
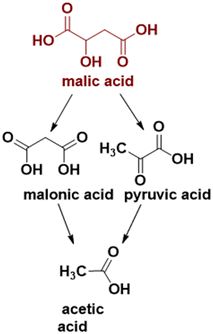
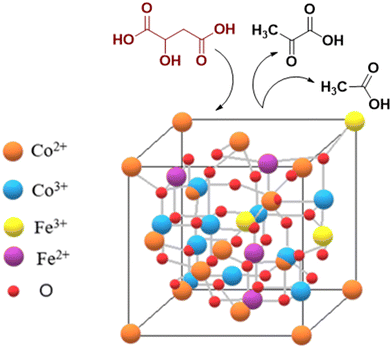
To the best of our knowledge, no study regarding the influence of iron doping on the catalytic properties of cobalt spinel oxides in malic acid oxidative dehydrogenation/decarboxylation exists in the literature so far. In the present study, we report the synthesis of iron-doped Co3O4 nanoparticles using a surfactant-assisted method, as well as the correlation of their physicochemical properties with the catalytic activity in the conversion of malic acid to pyruvic, acetic and malonic acids (see Scheme 1).
2. Experimental section
2.1. Catalyst preparation
Samples with the formula Fe0.15Co2.85O4 were synthesized by co-precipitation of cobalt and iron precursors with ammonium carbonate with and without surfactants, such as citric acid and cetyltrimethylammonium bromide (CTAB). In the first stage, two solutions were prepared, a mixed solution consisting of Fe(NO3)3·9H2O (AGR ACS Labbox) and Co(NO3)2·6H2O (AGR ACS Labbox), and a solution of surfactant, such that the molar ratio of surfactant/(Co + Fe) was 0.04. These two solutions were first separately prepared and magnetically stirred for 30 minutes (the CTAB solution was heated to 60 °C and then cooled) by using a stirring speed of 600 rpm and later were mixed together. In the second stage, to the above-mentioned mixture, a solution (0.5 M) of ammonium carbonate, (NH4)2CO3 (ROTH), was added dropwise, the final molar ratio of (Co + Fe)/NH4 being 1![[thin space (1/6-em)]](https://www.rsc.org/images/entities/char_2009.gif) :
:![[thin space (1/6-em)]](https://www.rsc.org/images/entities/char_2009.gif) 2. The precipitation took place at ambient temperature and at a pH value between 8 and 9.
2. The precipitation took place at ambient temperature and at a pH value between 8 and 9.
The product was later filtered, washed several times with distilled water, and then dried at 100 °C for 24 h. The resulting solid was calcined at 500 °C for 4 h, except for the two samples prepared in the absence of surfactants that were calcined both at 400 °C and 500 °C, respectively. The final solids were named as follows: FeCo400 (calcined 400), FeCo500 (calcined 500), FeCoCA (citric acid), and FeCoCT (CTAB).
2.2. Catalyst characterization
X-ray diffraction (XRD) analysis of the powders was carried out with a Bruker-AXS D8 Advance diffractometer (Bruker Corporation, Billerica, MA, USA) equipped with a LynxEye 1D type detector and a Cu-Kα (0.1541 nm) radiation source, in the 2θ range of 10–80°.The morphology of the samples was investigated by scanning electron microscopy (SEM) and the composition by energy dispersive X-ray spectroscopy (EDX) using a Zeiss EVO 50 XVP scanning electron microscope equipped with a Quantax Bruker 200 system as an attachment.
Diffuse reflectance UV-vis spectra were recorded on BaSO4 diluted powders using a Jasco V-650 spectrometer fitted with a D2/WI light source, with a JSV-9222 integrating sphere and built-in PMT detector, with a scan speed of 1000 nm min−1, a data interval of 0.5 nm and a measurement range of 900–200 nm.
The FTIR spectra of all prepared samples were acquired both in ATR and DRIFT mode by using a Jasco FT/IR 4700 type A infrared spectrometer, with a standard light source, a TGS detector, a resolution of 4 cm−1 and a scanning speed of 2 mm s−1.
A Kratos Ultra DLD Setup (Kratos Analytical Ltd., Manchester, UK) was used to record the XPS data. Al K radiation (1486.74 eV) was used as the radiation source, with a monochromated X-ray source with a total power of 300 W; for analyses a pressure of 1 × 10⁻⁷ Pa was used in the analysis chamber. For the binding-energy values, a signal-calibrating standard was used with C 1s at 284.8 eV.
All samples' Raman spectra were recorded at room temperature in the range of 100–800 cm−1 on a Horiba Jobin Yvon LabRAM HR Evolution spectrometer outfitted with a cooled Sincerity CCD Peltier-cooled detector and a 633 nm air-cooled He–Ne laser. The spectra were obtained by averaging 5 accumulations of 50 s of laser exposure. By adjusting the laser power (9.7 mW) with a 25% neutral density filter, the degradation of the samples was avoided.
2.3. Catalytic tests
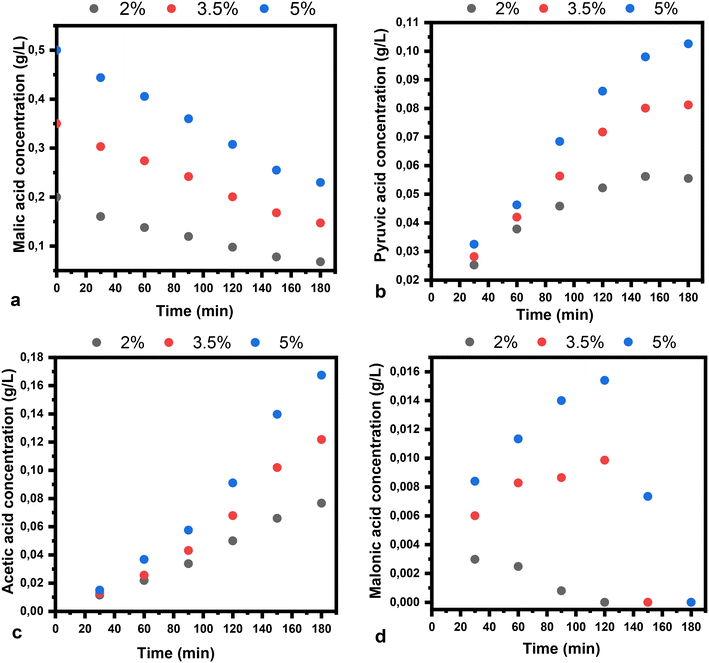
The catalytic tests were performed in the oxidative dehydrogenation/decarboxylation reactions of L-malic acid. The oxidative dehydrogenation/decarboxylation reactions were carried out in the liquid phase by using a two-necked flat bottomed boiling flask (25 mL) placed on a heated magnetic stirrer. Different solutions of malic acid in water or ethanol (with concentrations of 2, 3.5 and 5 wt%) were added in the flask and stirred, with a stirring speed of 400 rpm, in the presence of air as an oxidant (20 mL min−1), up to a temperature of 50 °C. Then, the catalyst (0.05 g) was added to start the reaction. Aliquots from the solution were taken out at regular time intervals and analyzed with the help of a gas-chromatograph (Thermo-Quest GC K072320) equipped with a flame ionization detector (FID).3. Results and discussion
3.1. Catalyst characterization
The XRD patterns are shown in Fig. 1 and can be linked to the presence of the AB2O4 cubic phase with a spinel structure, where A and B correspond to tetrahedral and octahedral cations sites, respectively. As shown, the main diffraction line of the (311) plane is situated at 2θ = 36.8°. The presence of a shoulder at lower values of 2θ degrees and even a splitting of this line in the case of the FeCoCT sample, can be correlated with the coexistence of both normal and inverse spinel phases.30,31 In the regular spinel, Fe3+ replaces the Co3+ ions from the octahedral sites; however, in the inverse spinel, Co2+ from the tetrahedral sites is replaced with Fe3+, while Co3+ cations from the octahedral sites are replaced by Fe2+ cations. When compared to other samples, the main diffraction line of the (311) plane for the sample FeCoCA is shifted towards the lower angle side; this could be due to defects induced in the crystalline structure in the presence of citric acid as a surfactant.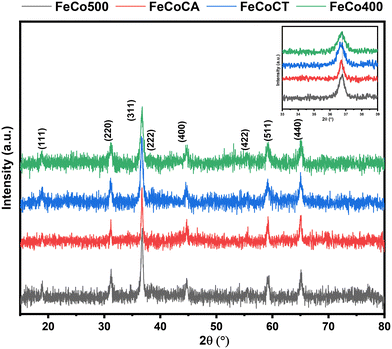 | ||
| Fig. 1 XRD patterns of Fe–Co spinel oxides: FeCo400 (calcined 400), FeCo500 (calcined 500), FeCoCA (citric acid), and FeCoCT (CTAB). | ||
The morphology of the samples was investigated by the SEM method (Fig. 2) and a granular structure can be observed for all samples. The different nanograins on the surface did not have large size variations and a porous structure between different grains was also evidenced.
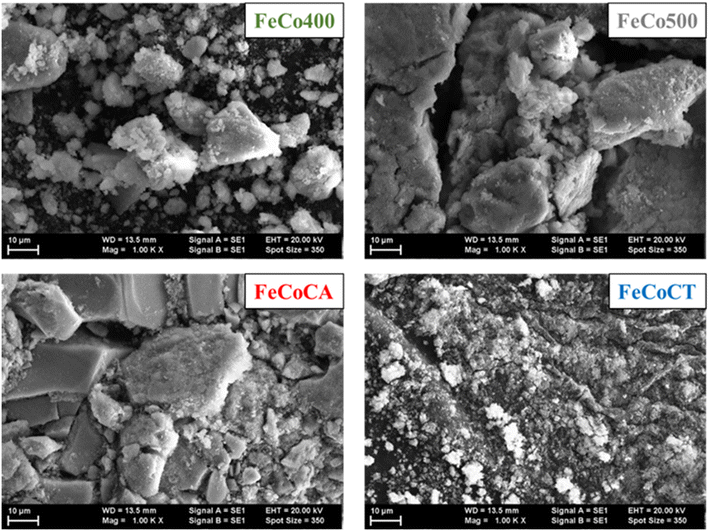 | ||
| Fig. 2 SEM images of Fe–Co spinel oxides: FeCo400 (calcined 400), FeCo500 (calcined 500), FeCoCA (citric acid), and FeCoCT (CTAB). | ||
The elemental composition of the samples was evaluated by analyzing different sample regions by the EDX technique. The composition data calculated from the EDX results are summarized in Table 1.
| Element/sample | Co | Fe | O |
|---|---|---|---|
| FeCo400 | 78.55 | 4.21 | 17.23 |
| FeCo500 | 75.78 | 3.9 | 20.31 |
| FeCoCA | 83.65 | 4.27 | 12.06 |
| FeCoCT | 66.67 | 3.54 | 29.77 |
The ratio between Fe and Co obtained by EDX is almost the same as the theoretical one for all samples, indicating that the co-precipitation was efficient with or without the surfactant.
The optical absorption spectra shown in Fig. 3a present two broad bands in the 400–500 nm and the 650–800 nm regions that are given by the O2− → Co2+ and the O2− → Co3+ charge-transfer transitions, respectively.32 The broad band in the region 650–800 nm showed three maxima located at 715 nm (Co3+), as well as at 745 and 770 nm corresponding to iron ions,33–35 visible especially on the FeCoCT catalyst.
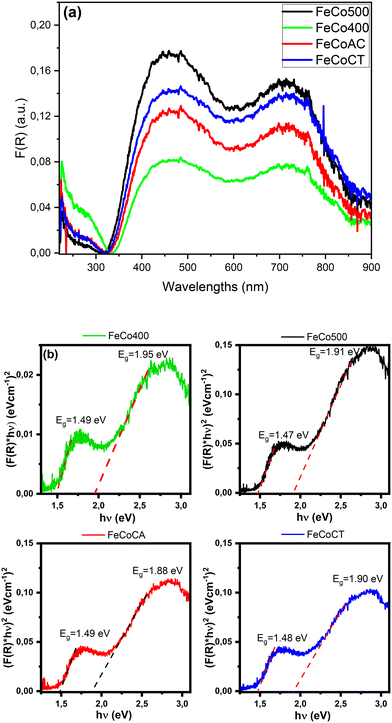 | ||
| Fig. 3 UV-vis absorption spectra of Fe–Co spinel oxides (a), and the absorption band gap Eg of the samples (b). | ||
In order to identify the centers responsible for the catalytic activity in mixed metal oxides, it is useful to know the chemical properties of both the metal centers and the oxygen. A factor that describes both the nature of the active oxygen centers and the tendency of the adjacent metal centers to gain electron density is represented by the ligand to metal charge transfer excitation energy (LMCT), which corresponds to the band-gap energy.36
The absorption band-gap Eg of the samples was determined using the following equation:
| (F(R)hν)n = a(hν − Eg) |
The energy gap values were given by the interception of the two straight line portions. The values are situated in the range of ∼1.47–1.49 eV for the lower energy side region and ∼1.88–1.95 eV for the higher energy side region, in good agreement with the literature data.38–40 The relatively high values highlight the presence of a small crystallite size and partial amorphous structure.
DRIFT studies (Fig. 4) were performed in order to confirm the nature of functional groups present on our samples. The band at 1290 cm−1 is assigned to carboxylate (COO−), and that at 1400 cm−1 to bicarbonate species (HCO3−), while the band located at 1525 cm−1 is assigned to carbonate species (CO32−) on the catalyst surface.41,42
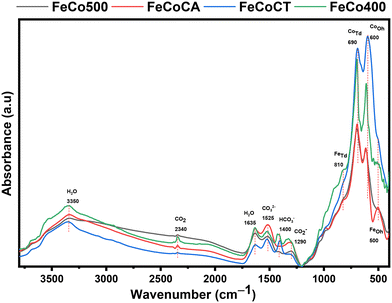 | ||
| Fig. 4 DRIFT spectra of Fe–Co spinel oxides: FeCo400 (calcined 400), FeCo500 (calcined 500), FeCoCA (citric acid), and FeCoCT (CTAB). | ||
The band of tetrahedral sites is located at a higher wavenumber than that of octahedral sites, due to the fact that tetrahedral positions have smaller bond lengths compared with the octahedral positions.43 The bands at 690 cm−1 and 600 cm−1 are assigned to vibrational modes of cobalt–oxygen, Co–O, in Co3O4.44 The absorption band at 500 cm−1 is linked with stretching modes of the Fe3+ octahedral sites and that at 810 cm−1 is associated with iron ion vibration in tetrahedral coordination.45
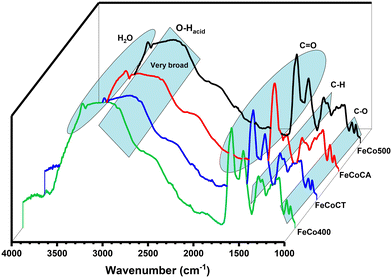
Fig. 5 depicts the FTIR-ATR spectra of the catalysts after malic acid conversion. The broad band in the 3000–3300 cm−1 range is associated with –OH groups of carboxyls and that at 3400 cm−1 with H2O molecule absorption.46 The carbonyl C![[double bond, length as m-dash]](https://www.rsc.org/images/entities/char_e001.gif) O species present bands at 1720–1750 cm−1, and the band at 1440 cm−1 is assigned to –CH bonds, while the bands at 1060 and 1100 cm−1 are assigned to C–O stretches.
O species present bands at 1720–1750 cm−1, and the band at 1440 cm−1 is assigned to –CH bonds, while the bands at 1060 and 1100 cm−1 are assigned to C–O stretches.
Raman spectroscopy was employed to check the presence of any non-crystalline secondary phases that might not be identified by XRD. The Raman spectra of the FeCo samples synthesized in this study are shown in Fig. 6. As revealed by the XRD analysis, the FeCo samples are not fully normal spinel type, with a mixture of both normal and inverse spinel types co-existing. As part of the space group Fd3m, the Co3O4 oxides crystallize in cubic structures, with such structures presenting five Raman active phonon modes, namely A1g, Eg and 3T2g. However, any cation redistribution in the tetrahedral and octahedral sites of the Co3O4 normal spinel will alter the symmetry of the crystal structure into the I41/amd space group that can show up to ten active vibrational modes in the Raman spectrum.
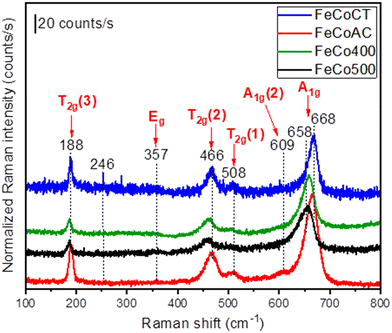 | ||
| Fig. 6 Raman spectra of Fe–Co oxides: FeCo400 (calcined 400), FeCo500 (calcined 500), FeCoCA (citric acid), and FeCoCT (CTAB). | ||
In our case, all samples show more than five peak maxima at 188, 357, 466, 508, 609 and 655 or 668 cm−1. In accordance with the literature, the frequencies above 600 cm−1 are due to A1g symmetry involving symmetric stretching of an oxygen atom with respect to the metal ion in the tetrahedral void, the so-called tetrahedral breath mode since only oxygen atoms are moving.47 The peak maxima located at 668 cm−1 (for the case of the FeCoCT and FeCoCA samples) and 658 cm−1 (for the case of the FeCo400 and FeCo500 samples) are characteristic for the cubic spinel-type structure, while the presence of an additional mode designated as the A1g(2) mode (located at 609 cm−1) is a characteristic of inverse as well as mixed spinel compounds. The average shift of ∼10 cm−1 between the peak maxima related to the A1g mode may be attributed to size effects or surface stress/strain.
At lower frequencies below 600 cm−1, the observed phonon modes (Eg and 3T2g modes located at 357 and 508, 466 and 188 cm−1, respectively) are attributed to the symmetric and antisymmetric bending of oxygen atoms in M–O bonds at octahedral voids.48,49
Besides these phonon modes, in the case of the FeCo500 sample, the presence of a secondary peak located at 246 cm−1 and attributed to the Eg mode of α-Fe2O3 (ref. 50) indicates the formation of a common impurity that typically is formed during the synthesis of spinel-type catalysts.51
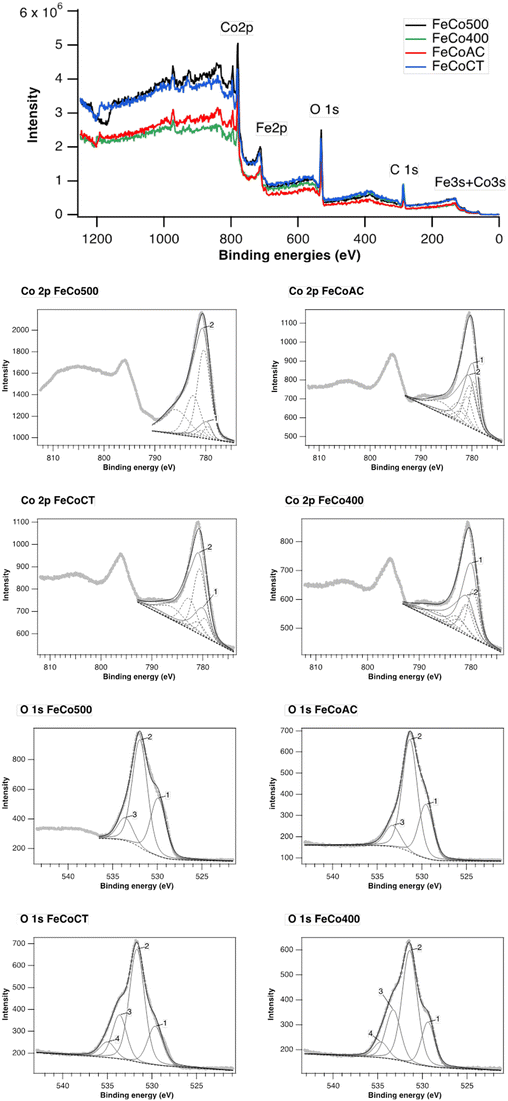
XPS spectra of all prepared samples are shown in Fig. 7. The general spectra show the presence of C, O, Co and Fe. The high-resolution spectra of Fe 2p and Fe 3s give us information about the existence of Fe, but unfortunately, no quantitative information about the oxidation states of Fe can be extracted, due to the auger lines of Co overlapping with the Fe 2p signal. Moreover, the Co 3s lines overlap with the Fe 3s signal. From the high-resolution spectrum of Co 2p, the presence of two fingerprints specific to different oxidation states of Co can be observed: the multiplet 1 Co3O4 footprint containing both Co(II) and Co(III) and the multiplet 2 footprint specific to CoO, with Co(II) surrounding the specific CoO structure. Different percentages of the two cobalt components are observed depending on the preparation method (see Table 2). Thus, FeCo500 and FeCoCT materials contain a small amount of up to ∼20% Co3O4 phase, while FeCo400 and FeCoCA materials show a mixture of the two components Co3O4 and CoO, respectively. The peak area of Co2+ is higher than that of Co3+ in FeCo500 and FeCoCT, which indicates the oxygen vacancy generation accompanying Co2+.52
| FeCo500 | FeCoCA | FeCoCT | FeCo400 | |
|---|---|---|---|---|
| Co3O4 – multiplet 1 | 9 | 45 | 23 | 58 |
| CoO – multiplet 2 | 91 | 55 | 77 | 42 |
Deconvolution of the O 1s spectra reveals the presence of three types of oxygen on the surface: the oxygen of carbonate species (peak 2) centered at 531.8 eV, along with two other peaks centered at 529.6 eV corresponding to lattice oxygen (peak 1) and at 533.5 eV, corresponding to hydroxyl groups (peak 3), the FeCoCT and FeCo400 having a higher amount of OH on the surface compared to the other two samples. In addition, in these two samples, a fourth peak appears at 534.8 eV, specific to water chemisorbed on the surface (peak 4).
3.2. Catalytic experiments
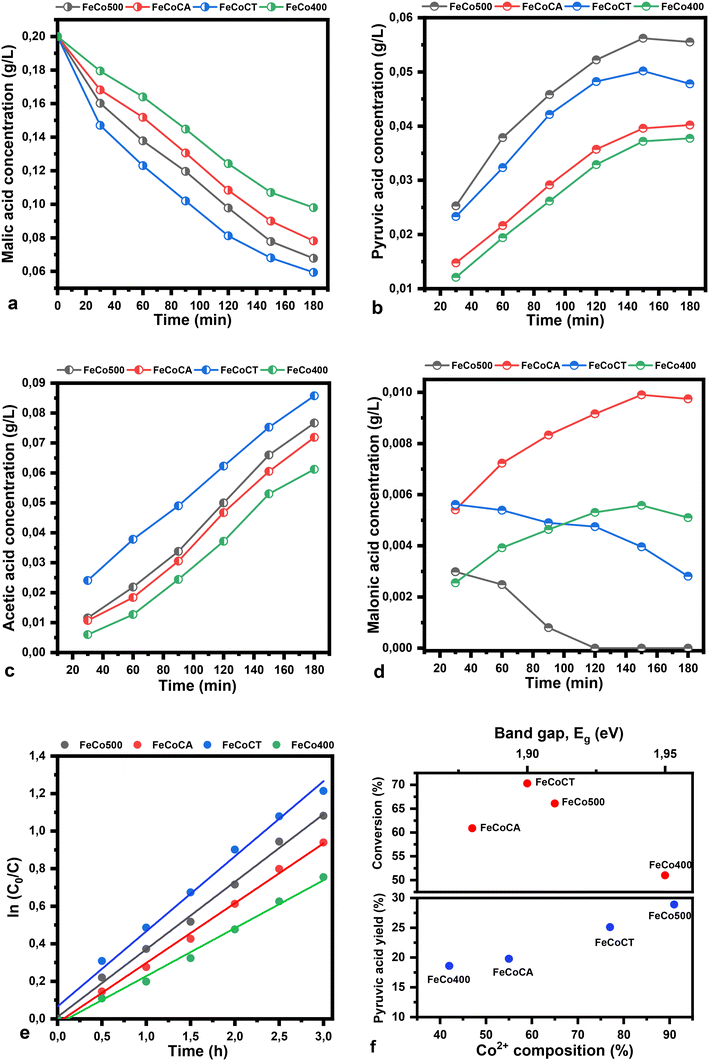
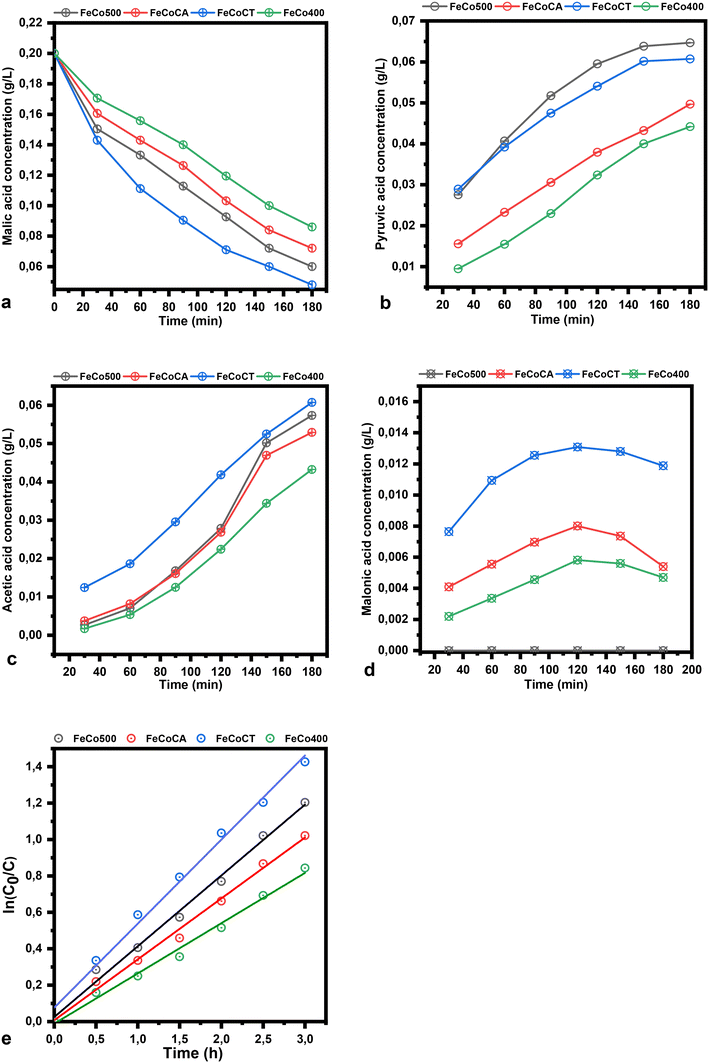
Under the applied conditions, the results follow first-order reaction kinetics, in agreement with the equation:
The plots of malic acid and product concentration in water as a solvent are illustrated in Fig. 9. The catalysts used have the same trend in water as in ethanol, but present a higher conversion of malic acid in water. The concentration of pyruvic acid when water is used as a solvent is higher compared to the use of ethanol, while the acetic acid concentration in the same conditions decreased. The rate constant in water has the following values: 3.9 × 10⁻¹ h−1, 3.3 × 10⁻¹ h−1, 4.6 × 10⁻¹ h−1 and 2.8 × 10⁻¹ h−1, respectively.
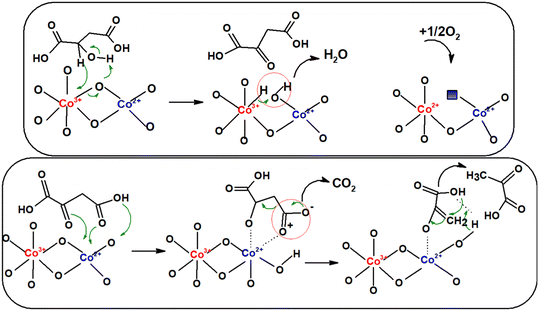
The mechanism of the reactions occurring during the oxidative dehydrogenation/decarboxylation of malic acid is shown in Scheme 3. We suppose that the reaction intermediate is oxaloacetic acid obtained in the oxidative dehydrogenation of alcohol function, through the transfer of electrons between Co3+ centers and the hydrogen bound to the carbon atom to which the hydroxyl group is located, and between the hydrogen of the OH group and the oxygen of the catalyst, with the appearance of an oxygen vacancy quickly filled with oxygen from the reaction medium. Since oxaloacetic acid was not found in our reaction products, we can infer that its transformation into pyruvic acid and later into acetic acid is fast. The transformation of oxaloacetic acid into pyruvic acid is done through a stable cycle of five atoms between Co2+ centers and the oxygen atoms of the carbonyl group and of the carboxyl group from the β position, the ketonic complex being the active species in the decarboxylation stage.
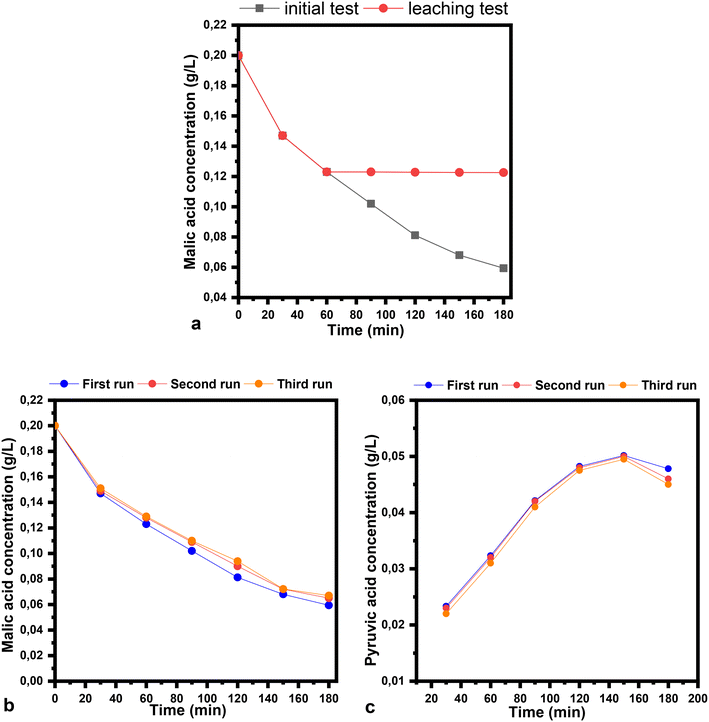
The stability and recyclability tests were performed over the CoFeCT samples in ethanol as a solvent (Fig. 11). The leaching studies were performed under optimized conditions. The removal of the catalyst from the reaction mixture was achieved after one hour, at a malic acid conversion of 38.5%. Inductively coupled plasma analysis of the reaction filtrate revealed that the presence of Co was <4 ppm, with no iron being detected. The reaction filtrate was stirred for a longer time, with almost no further conversion being detected (Fig. 11a). For the recyclability studies, three successive runs were carried out on the CoFeCT sample. The spent catalyst was washed with ethanol and dried at 100 °C for 12 h. The final concentrations of malic and pyruvic acid were very little affected in the second and third cycles compared to the initial study (Fig. 11b and c).
4. Conclusions
The transformation of malic acid into pyruvic acid and then into acetic acid was carried out using iron-doped Co3O4 spinel-type oxides that had been prepared using the coprecipitation method. The preparation procedure was carried out both with and without surfactants such as citric acid and cetyltrimethylammonium bromide (CTAB). The CoFeCT and CoFe500 samples, with a normal and inverse spinel structure induced by iron, have the highest level of activity (malic acid conversion 70% and 66%, respectively). This occurs as a direct consequence of the replacement of octahedral positions occupied by Co3+ ions with Fe2+ ions and of tetrahedral positions occupied by Co2+ ions with Fe3+ ions. A good correlation was also observed between the activity of the catalysts, the optical band gap energy and the presence of additional Co2+ sites on the surface. The conversion of malic acid has been correlated with the electron mobility increasing, whereas the yield of pyruvic acid (27.8%-CoFe500; 20%-CoFeCA; 24%-CoFeCT; 18.8%-CoFe400) has a linear association with oxygen defects, corresponding to the existence of Co2+ ions from CoO, which are responsible for their presence.Conflicts of interest
There are no conflicts to declare.Acknowledgements
This work was supported by a grant from the Romanian Ministry of Education and Research, CNCS – UEFISCDI, project number PNIII-P4-ID-PCE-2020-0580, within PNCDI III. FN, MF and SN acknowledge the Ministry of Research, Innovation and Digitization, CNCS – UEFISCDI for financial support through project no. PN-III-P4-ID-ERC-2021-0007 and the Core Program 2023–2026 (contract PC3-PN23080303).References
- Y. Xu, Y. Zhou, W. Cao and H. Liu, Improved Production of Malic Acid in Aspergillus niger by Abolishing Citric Acid Accumulation and Enhancing Glycolytic Flux, ACS Synth. Biol., 2020, 9, 1418–1425, DOI:10.1021/acssynbio.0c00096.
- W. Lu, X. Sun, L. Gao, X. Hu, H. Song and B. Kong, Study on the characteristics and mechanism of DL-malic acid in inhibiting spontaneous combustion of lignite and bituminous coal, Fuel, 2022, 308, 122012, DOI:10.1016/j.fuel.2021.122012.
- L. Yao, H. S. Yao, G. X. Xi and Y. Feng, Recycling and synthesis of LiNi1/3Co1/3Mn1/3O2 from waste lithium ion batteries using DL-malic acid, RSC Adv., 2016, 6(22), 17947–17954, 10.1039/C5RA25079J.
- B. Bharathiraja, I. A. E. Selvakumari, J. Jayamuthunagai, R. P. Kumar, S. Varjani, A. Pandey and E. Gnansounou, Biochemical conversion of biodiesel by-product into malic acid: A way towards sustainability, Sci. Total Environ., 2020, 709, 136206, DOI:10.1016/j.scitotenv.2019.136206.
- X. L. Chen, Y. C. Wang, X. X. Dong, G. P. Hu and L. M. Liu, Engineering rTCA pathway and C4-dicarboxylate transporter for L-malic acid production, Appl. Microbiol. Biotechnol., 2017, 101, 4041–4052, DOI:10.1007/s00253-017-8141-8.
- B. Samira, M. J. Nurhidayatullaili and A. Y. Wageeh, Catalytic conversion of biodiesel derived raw glycerol to value added products, Renewable Sustainable Energy Rev., 2015, 41, 113–127, DOI:10.1016/j.rser.2014.08.031.
- A. Kövilein, C. Kubisch, L. Cai and K. Ochsenreither, Malic acid production from renewables: a review, J. Chem. Technol. Biotechnol., 2020, 95, 513–526, DOI:10.1002/jctb.6269.
- A. Danion, J. Disdier, C. Guillard and N. Jaffrezic-Renault, Malic acid photocatalytic degradation using a TiO2-coated optical fiber reactor, J. Photochem. Photobiol., A, 2007, 190, 135–140, DOI:10.1016/j.jphotochem.2007.03.022.
- W. Irawaty, D. Friedmann, J. Scott and R. Amal, Relationship between mineralization kinetics and mechanistic pathway during malic acid photodegradation, J. Mol. Catal. A: Chem., 2011, 335, 151–157, DOI:10.1016/j.molcata.2010.11.027.
- P. Xu, J. H. Qiu, C. Gao and C. Q. Ma, Biotechnological routes to pyruvate production, J. Biosci. Bioeng., 2008, 105, 169–175, DOI:10.1263/jbb.105.169.
- Y. Qin, C. Johnson, L. Liu and J. Chen, Introduction of heterogeneous NADH reoxidation pathways into Torulopsis glabrata significantly increases pyruvate production efficiency, Korean J. Chem. Eng., 2011, 28, 1078, DOI:10.1007/s11814-010-0483-1.
- R. C. Kerber and M. S. Fernando, α-Oxocarboxylic Acids, J. Chem. Educ., 2010, 87, 1079–1084, DOI:10.1021/ed1003096.
- S. Gu, Z. Zhao, Y. Yao, J. Li and C. Tian, Designing and Constructing a Novel Artificial Pathway for Malonic Acid Production Biologically, Front. Bioeng. Biotechnol., 2022, 9, 820507, DOI:10.3389/fbioe.2021.820507.
- B. S. Chen, Y. Y. Zeng, L. Liu, L. Chen, P. Duan, R. Luque, R. Ge and W. Zhang, Advances in catalytic decarboxylation of bioderived fatty acids to diesel-range alkanes, Renewable Sustainable Energy Rev., 2022, 158, 112178, DOI:10.1016/j.rser.2022.112178.
- T. Li, G. Sun, L. Xiong, B. Zheng, Y. Duan, R. Yu, J. Jiang, Y. Wang and W. Yang, Transition-metal-free decarboxylation of D-glucaric acid to furan catalyzed by SnCl4 in a biphasic system, Mol. Catal., 2021, 516, 111958, DOI:10.1016/j.mcat.2021.111958.
- K. Avasthi, A. Bohre, M. Grilc, B. Likozar and B. Saha, Advances in catalytic production processes of biomass-derived vinyl monomers, Catal. Sci. Technol., 2020, 10, 5411–5437, 10.1039/D0CY00598C.
- A. Bohre, U. Novak, M. Grilc and B. Likozar, Synthesis of bio-based methacrylic acid from biomass-derived itaconic acid over barium hexa-aluminate catalyst by selective decarboxylation reaction, Mol. Catal., 2019, 476, 110520, DOI:10.1016/j.mcat.2019.110520.
- Y. Teng, L. X. Song, L. B. Wang and J. Xia, Face-Raised Octahedral Co3O4 Nanocrystals and Their Catalytic Activity in the Selective Oxidation of Alcohols, J. Phys. Chem. C, 2014, 118, 4767–4773, DOI:10.1021/jp412175t.
- R. Zhong, Q. Wang, L. Du, Y. Pu, S. Ye, M. Gu, Z. C. Zhang and L. Huang, Ultrathin polycrystalline Co3O4 nanosheets with enriched oxygen vacancies for efficient electrochemical oxygen evolution and 5-hydroxymethylfurfural oxidation, Appl. Surf. Sci., 2022, 584, 152553, DOI:10.1016/j.apsusc.2022.152553.
- C. Chen, Z. Zhou, J. Liu, B. Zhu, H. Hu, Y. Yang, G. Chen, M. Gao and J. Zhang, Sustainable biomass upgrading coupled with H2 generation over in-situ oxidized Co3O4 electrocatalysts, Appl. Catal., B, 2022, 307, 121209, DOI:10.1016/j.apcatb.2022.121209.
- P. Jia, T. Yang, Q. Liu, J. Yan, T. Shen, L. Zhang, Y. Liu, X. Zhao, Z. Gao, J. Wang, Y. Tang and J. Huang, In-situ imaging Co3O4 catalyzed oxygen reduction and evolution reactions in a solid state Na-O2 battery, Nano Energy, 2020, 77, 105289, DOI:10.1016/j.nanoen.2020.105289.
- D. W. Wang, Q. H. Wang and T. M. Wang, Morphology controllable synthesis of cobalt oxalates and their conversion to mesoporous Co3O4 nanostructures for application in supercapacitors, Inorg. Chem., 2011, 50, 6482–6492, DOI:10.1021/ic200309t.
- X. W. Lou, D. Deng, J. Y. Lee, J. Feng and L. A. Archer, Self supported formation of needle like Co3O4 nanotubes and their application as lithium-ion battery electrodes, Adv. Mater., 2008, 20, 258–262, DOI:10.1002/adma.200702412.
- A. L. Bhatti, A. Tahira, A. Gradone, R. Mazzaro, V. Morandi, U. Aftab, M. I. Abroc, A. Nafady, K. Qi, A. Infantes-Molina, A. Vomiero and Z. H. Ibupoto, Nanostructured Co3O4 electrocatalyst for OER: The role of organic polyelectrolytes as soft templates, Electrochim. Acta, 2021, 398, 139338, DOI:10.1016/j.electacta.2021.139338.
- M. Salavati-Niasari and A. Khansari, Synthesis and characterization of Co3O4 nanoparticles by a simple method, C. R. Chim., 2014, 17, 352–358, DOI:10.1016/j.crci.2013.01.023.
- A. Rumplecker, F. Kleitz, E. L. Salabas and F. Schüth, Hard templating pathways for the synthesis of nanostructured porous Co3O4, Chem. Mater., 2007, 19, 485–496, DOI:10.1021/cm0610635.
- Y. Wang, J. C. Shi, J. L. Cao, G. Sun and Z. Y. Zhang, Synthesis of Co3O4 nanoparticles via the CTAB-assisted method, Mater. Lett., 2011, 65, 222–224, DOI:10.1016/j.matlet.2010.09.090.
- J. Deng, L. Kang, G. Bai, Y. Li, P. Li, X. Liu, Y. Yang, F. Gao and W. Liang, Solution combustion synthesis of cobalt oxides(Co3O4 and Co3O4/CoO) nanoparticles as supercapacitor electrode materials, Electrochim. Acta, 2014, 132, 127–135, DOI:10.1016/j.electacta.2014.03.158.
- A. Singhal, A. Bisht, A. Kumar and S. Sharma, One pot, rapid synthesis of Co3O4 by solution combustion method and its electrochemical properties in different electrolytes, J. Electroanal. Chem., 2016, 776, 152–161, DOI:10.1016/j.jelechem.2016.07.004.
- K. Kim, H. Kim, Y. Park, G. Ahn, C. Kim and J. Park, Evolution of structural and magnetic properties and the electronic structure of spinel FexCo3xO4 thin films, IEEE Trans. Magn., 2005, 41(10), 3478–3480, DOI:10.1109/TMAG.2005.854914.
- V. O'Shea, R. Nafria, P. Ramírez and N. Homs, Development of robust Co-based catalysts for the selective H2-production by ethanol steam-reforming. The Fe-promoter effect, Int. J. Hydrogen Energy, 2008, 33, 3601–3606, DOI:10.1016/j.ijhydene.2007.10.049.
- Q. Yang, P. Cui, Q. Ye, S. Chen and Z. Wu, X-ray absorption study of the geometry structure of Co2+/Co3+ in ammonia solution, J. Mol. Struct., 2015, 1098, 306–310, DOI:10.1016/j.molstruc.2015.06.034.
- A. Gallo-Cordova, J. Ovejero, A. Pablo-Sainz-Ezquerra, J. Cuya, B. Jeyadevan, S. Veintemillas-Verdaguer, P. Tartaj and M. del Puerto Morales, Unravelling an amine-regulated crystallization crossover to prove single/multicore effects on the biomedical and environmental catalytic activity of magnetic iron oxide colloids, J. Colloid Interface Sci., 2022, 608, 1585–1597, DOI:10.1016/j.jcis.2021.10.111.
- M. A. Garcia, F. Jiménez-Villacorta, A. Quesada, J. de la Venta, N. Carmona, I. Lorite, J. Llopis and J. F. Fernández, Surface magnetism in ZnO/Co3O4 mixtures, J. Appl. Phys., 2010, 107, 043906, DOI:10.1063/1.3294649.
- A. Djemai, G. Calas and J. P. Muller, Role of structural Fe(III) and iron oxide nanophases in mullite coloration, J. Am. Ceram. Soc., 2001, 84(7), 1627–1631, DOI:10.1111/j.1151-2916.2001.tb00887.x.
- A. B. Getsoian, Z. Zhai and A. T. Bell, Band-Gap Energy as a Descriptor of Catalytic Activity for Propene Oxidation over Mixed Metal Oxide Catalysts, J. Am. Chem. Soc., 2014, 136, 13684–13697, DOI:10.1021/ja5051555.
- X. Wang, X. Chen, L. Gao, H. Zheng, Z. Zhang and Y. Qian, One-Dimensional Arrays of Co3O4 Nanoparticles: Synthesis, Characterization, and Optical and Electrochemical Properties, J. Phys. Chem. B, 2004, 108, 16401–16404, DOI:10.1021/jp048016p.
- L. Qiao, H. Y. Xiao, H. M. Meyer, J. N. Sun, C. M. Rouleau, A. A. Puretzky, D. B. Geohegan, I. N. Ivanov, M. Yoon, W. J. Weber and M. D. Biegalski, Nature of the band gap and origin of the electro−/photo-activity of Co3O4, J. Mater. Chem. C, 2013, 1, 4628, 10.1039/C3TC30861H.
- R. M. Obodo, A. Nwanya, A. B. C. Ekwealor, I. Ahmad, T. Zhao, R. U. Osuji, M. Maaza and F. I. Ezema, Influence of pH and annealing on the optical and electrochemical properties of cobalt(III) oxide(Co3O4) thin films, Surf. Interfaces, 2019, 16, 114–119, DOI:10.1016/j.surfin.2019.05.006.
- C. M. Jiang, L. R. Baker, J. M. Lucas, J. Vura-Weis, A. P. Alivisatos and S. Leone, Characterization of Photo-Induced Charge Transfer and Hot Carrier Relaxation Pathways in Spinel Cobalt Oxide(Co3O4), J. Phys. Chem. C, 2014, 118, 22774–22784, DOI:10.1021/jp5071133.
- L. Wang, E. Guan, Y. Wang, L. Wang, Z. Gong, Y. Cui, X. Meng, B. C. Gates and F. S. Xiao, Silica accelerates the selective hydrogenation of CO2 to methanol on cobalt catalysts, Nat. Commun., 2020, 11, 1033, DOI:10.1038/s41467-020-14817-9.
- U. Caudillo-Flores, I. Barba-Nieto, M. Muñoz-Batista, A. Kubacka and M. Fernández-García, Characterization of photo-catalysts: from traditional to advanced approaches, Top. Curr. Chem., 2019, 377, 24, DOI:10.1007/s41061-019-0248-1.
- A. Pradeep, P. Priyadarshini and G. Chandrasekaran, Structural, magnetic and electrical properties of nanocrystalline zinc ferrite, J. Alloys Compd., 2011, 509, 3917–3923, DOI:10.1016/j.jallcom.2010.12.168.
- I. Luisetto, F. Pepe and E. Bemporad, Preparation and characterization of nano cobalt oxide, J. Nanopart. Res., 2008, 10, 59–67, DOI:10.1007/s11051-008-9365-4.
- S. J. Kashyap, R. Sankannavar and G. M. Madhu, Iron oxide(Fe2O3) synthesized via solution-combustion technique with varying fuel-to-oxidizer ratio: FT-IR, XRD, optical and dielectric characterization, Mater. Chem. Phys., 2022, 286, 126118, DOI:10.1016/j.matchemphys.2022.126118.
- M. Ziemba, C. Schilling, M. V. Ganduglia-Pirovano and C. Hess, Toward an Atomic-Level Understanding of Ceria-Based Catalysts: When Experiment and Theory Go Hand in Hand, Acc. Chem. Res., 2021, 54, 2884–2893, DOI:10.1021/acs.accounts.1c00226.
- S. M. Ansari, K. C. Ghosh, R. S. Devan, D. Sen, P. U. Sastry, Y. D. Kolekar and C. V. Ramana, Eco-Friendly Synthesis, Crystal Chemistry, and Magnetic Properties of Manganese-Substituted CoFe2O4 Nanoparticles, ACS Omega, 2020, 5, 19315–19330, DOI:10.1021/acsomega.9b02492.
- S. M. Ansari, B. B. Sinha, K. R. Pai, S. K. Bhat, Y. R. Ma, D. Sen, Y. D. Kolekar and C. V. Ramana, Controlled surface/interface structure and spin enabled superior properties and biocompatibility of cobalt ferrite nanoparticles, Appl. Surf. Sci., 2018, 459, 788–801, DOI:10.1016/j.apsusc.2018.08.063.
- K. B. Modi, P. Y. Raval, S. J. Shah, C. R. Kathad, S. V. Dulera, M. V. Popat, K. B. Zankat, K. G. Saija, T. K. Pathak, N. H. Vasoya, V. K. Lakhani, U. Chandra and P. K. Jha, Raman and Mossbauer Spectroscopy and X-ray Diffractometry Studies on Quenched Copper–Ferri–Aluminates, Inorg. Chem., 2015, 1, 2851–2859, DOI:10.1021/ic502497a.
- G. Mitran, A. Urda, O.-D. Pavel, S. Neatu, M. Florea and F. Neatu, A green way for pyruvic acid synthesis from biomass-derived L-malic acid on tetrahedral versus octahedral cobalt sites/hematite, Biomass Convers. Biorefin., 2022 DOI:10.1007/s13399-022-02513-1.
- N. A. Rashid, C. Haw, W. Chiu, N. H. Khanis, A. Rohaizad, P. S. Khiew and S. A. Rahman, Structural-and optical-properties analysis of single crystalline hematite(α-Fe2O3) nanocubes prepared by one-pot hydrothermal approach, CrystEngComm, 2016, 18, 4720–4732, 10.1039/C6CE00573J.
- R. K. Bera, H. Parka and R. Ryoo, Co3O4 nanosheet on zeolite-templated carbon as an efficient oxygen electrocatalyst for zinc-air battery, J. Mater. Chem. A, 2019, 7, 9988–9996, 10.1039/C9TA01482A.
- P. M. Kouotou, A. El Kasmi, L. N. Wu, M. Waqas and Z. Y. Tian, Particle size-band gap energy-catalytic properties relationship of PSE-CVD-derived Fe3O4 thin films, J. Taiwan Inst. Chem. Eng., 2018, 93, 427–435, DOI:10.1016/j.jtice.2018.08.014.
- A. El Kasmi, Z. Y. Tian, H. Vieker, A. Beyer and T. Chafik, Innovative CVD synthesis of Cu2O catalysts for CO oxidation, Appl. Catal., B, 2016, 186, 10–18, DOI:10.1016/j.apcatb.2015.12.034.
- B. Y. Jibril, Catalytic performances and correlations with metal oxide band gaps of metal-tungsten mixed oxide catalysts in propane oxydehydrogenation, React. Kinet. Catal. Lett., 2005, 86, 171–177, DOI:10.1007/s11144-005-0309-z.
- A. Danion, J. Disdier, C. Guillard and N. Jaffrezic-Renault, Malic acid photocatalytic degradation using a TiO2-coated optical fiber reactor, J. Photochem. Photobiol., A, 2007, 190, 135–140, DOI:10.1016/j.jphotochem.2007.03.022.
| This journal is © The Royal Society of Chemistry 2023 |

