
Synergetic effect of metal–support for enhanced performance of the Cu–ZnO–ZrO2/UGSO catalyst for CO2 hydrogenation to methanol†
Thi Thanh Nguyet
Vu
a,
Alex
Desgagnés
a,
Pascal
Fongarland
b,
Laurent
Vanoye
 b,
Frédéric
Bornette
b and
Maria C.
Iliuta
*a
b,
Frédéric
Bornette
b and
Maria C.
Iliuta
*a
aChemical Engineering Department, Université Laval, 1065 Avenue de la Médecine, Québec, QC G1V 0A6, Canada. E-mail: maria-cornelia.iliuta@ghc.ulaval.ca
bCP2M/CNRS/CPE Lyon, Université Claude-Bernard Lyon 1, Villeurbanne, France
First published on 21st November 2022
Abstract
Novel Cu–ZnO–ZrO2/UGSO catalysts for CO2 hydrogenation to methanol were developed using a metallurgical residue (UGSO) as the catalytic support, with special focus on understanding the effect of (i) synergy between Cu/Zn/Zr and UGSO composition on the catalytic activity and stability, and (ii) UGSO modification on the structure–activity relationship of the developed catalysts. Zr acts as a structure promoter to enhance Cu dispersion and facilitates CO2 conversion. The highest methanol yield is achieved for CZ9Zr/UGSO (10 wt% Cu, 7.5 wt% Zn, 9 wt% Zr), attributable to the highest (i) Mg/Cu surface ratio and (ii) interfacial contact Cu–ZrO2. Further modification of UGSO by H2O2 (UGSO-H) increases by 3 times the surface area and endows CZ9Zr/UGSO-H with the best CO2 conversion and 57% higher methanol yield at 240 °C/20 bar compared to a commercial Cu–ZnO-based catalyst. These findings may pave the way for effective utilization of the no-marketable-value residue as a catalytic support in other CO2 conversion processes.
1. Introduction
The unprecedented improvement in industrialization has undoubtedly led to the deterioration of natural resources and intensified many environmental problems such as the ceaseless emission of anthropogenic greenhouse gases. The main contributor of greenhouse gases, CO2, is considered as a cheap and abundant C1-compound that can be converted into chemicals and fuels.1 Among them, methanol is not only a clean alternative fuel but a crucial raw material in the chemical and energy industries owing to its usage as a building block to produce other chemicals such as dimethyl ether, light olefins, dimethyl carbonate, formaldehyde, methyl tert-butyl ether, etc. It can be also used as a liquid energy-carrier in transportation and fuel cell application.2 The transformation of CO2 into methanol through the CO2 hydrogenation process has become an appealing research interest in recent decades.3,4 Three catalyst categories have been widely used in CO2 hydrogenation into methanol synthesis, namely: Cu-based, noble metal-based (such as Pd, Ag) and bimetallic catalysts (such as Ni–Ga, Pt–Co).5 Due to their hydrogen spill-over ability, long-term stability and sintering resistance, precious metal-based materials have remained attractive catalysts.6,7 However, compared to Cu-based catalysts, their lower methanol selectivity, expensive cost and rare availability are the main factors that limit their utilization.8 Bimetallic materials are among other competitive catalysts because of their high thermal and mechanical stability although their lower activity in methanol synthesis compared to Cu-based catalysts is one of their drawbacks.9 Therefore, among catalysts that have been extensively used in this process, the upsurge of copper catalysts rooted from their high activity, low cost and wide availability has been widely reported.3Despite having high activity, Cu particles are thermally unstable and easily subjected to sintering and agglomeration. Numerous strategies have been attempted to overcome this drawback including the incorporation of suitable promoters. Among them, ZrO2 is considered as an appealing candidate because it can (i) act as a texture promoter which enhances Cu dispersion and redox ability,10,11 (ii) improve the basicity which facilitates CO2 adsorption and activation,12–14 and (iii) create oxygen vacancies to favor the activation of CO2 and the transformation of formate to methoxy.15 It was reported that the appropriate addition of Zr (1 wt%) to the CuO–Fe2O3 catalyst could not only lower the reduction temperature from 209 to 198 °C of CuO species by increasing the exposure of Cu on the catalytic surface, but also help prevent CuO agglomeration.11 As a result, CO2 conversion increased by a factor of 4 and methanol selectivity improved by 15-fold. Similarly, Xaba et al. reported that Zr addition offers a 3-fold higher methanol yield due to a better CO2 adsorption capacity and strength, better H2 uptake, and higher Cu reducibility.16 L'hospital et al.17 revealed a 3-fold increase in methanol yield through the addition of 23.8 wt% ZrO2, attributed to the interaction between ZnO and ZrO2 that improves Cu dispersion. In addition, the interaction between Cu species and metal oxides can create active sites for methanol formation.18–20 Stangeland et al. found that the incorporation of 1 mol% of Zr into the Cu/ZnO catalyst leads to the formation of Cu–ZrO2 interface sites and enhances the methanol formation rate from 14.7 to 15.6 mmol gcat−1 h−1 (at 230 °C, 30 bar, and 38![[thin space (1/6-em)]](https://www.rsc.org/images/entities/char_2009.gif) 000 cm3 gcat−1 h−1).20 Palomino et al.21 have found that the rate of methanol formation of the deposited ZnO on Cu(100) was 15–45 times higher than that of Cu(100), being attributed to the ZnO–Cu interface stimulating the formation and binding of formate species, which are finally hydrogenated into methanol. Other studies have reported that the atomic hydrogen needed for the hydrogenation of adsorbed carbonate was transferred from the Cu to ZnO surface at the Cu/ZnO interface.22,23 The same conclusion was drawn by Larmier et al.24 who highlighted that the Cu–ZrO2 boundary was essential for the formation of formate species, which further transforms into methoxy, and finally methanol. Understanding the impact of ZrO2 and interfacial sites between Cu species and metal oxides is thus crucial for achieving optimum methanol production in CO2 hydrogenation.
000 cm3 gcat−1 h−1).20 Palomino et al.21 have found that the rate of methanol formation of the deposited ZnO on Cu(100) was 15–45 times higher than that of Cu(100), being attributed to the ZnO–Cu interface stimulating the formation and binding of formate species, which are finally hydrogenated into methanol. Other studies have reported that the atomic hydrogen needed for the hydrogenation of adsorbed carbonate was transferred from the Cu to ZnO surface at the Cu/ZnO interface.22,23 The same conclusion was drawn by Larmier et al.24 who highlighted that the Cu–ZrO2 boundary was essential for the formation of formate species, which further transforms into methoxy, and finally methanol. Understanding the impact of ZrO2 and interfacial sites between Cu species and metal oxides is thus crucial for achieving optimum methanol production in CO2 hydrogenation.
A cost-effective catalytic support plays a crucial role in developing an effective catalyst for large scale application, as it not only enhances the active site properties, but also meets the objective of economic sustainability. Also, the implementation of environmentally friendly policies addressing the severe issues related to industrial residues has led to a surge of interest in the exploitation of solid waste as heterogeneous catalysts for the transformation of chemicals.25 Salient examples of this are CaO rooted from metallurgical wastes and fly ash for biodiesel production,26,27 iron oxides derived from red mud for hydrogen production28 and slag-based geopolymer for reverse water-gas shift reaction.29 Currently, at Rio Tinto Fer & Titane Company situated in Sorel-Tracy (Québec, Canada), the so-called Upgraded Titania-rich slag (UGS®), containing 94.5% of titanium dioxide, is produced from hemo-ilmenite ore (FeTiO3–Fe2O3) by a high-pressure and high temperature acid leaching process (T > 900 °C and P > 5 bar).30 At the end of this process, the beads of the metal oxides, containing mainly Fe, Mg, and Al in the form of magnetite (Fe3O4), magnesioferrite (MgFe2O4), hercynite (FeAl2O4) and free periclase (MgOH), are generated, crystalized, discarded, and referred to as UGS oxide (UGSO) residue. This waste has zero marketable use and is being disposed of in a mining waste site. Its use as the main component of heterogeneous catalytic materials would be a low cost and environmentally friendly concept. As example, our recent studies on hydrogen production by glycerol steam reforming31–33 revealed a superior performance of Ni/UGSO catalysts in terms of glycerol conversion and H2 yield in comparison with the commercial catalyst. These findings open therefore a door to the prospective use of this waste as a potential catalytic support and promoter in other patterns. In particular, the UGSO features made us believe that it could be a good candidate in CO2 hydrogenation into methanol because of (1) thermal and mechanical resistance, since it is produced under high temperature and pressure conditions, and (2) the presence of MgO that could favor methanol formation owing to the preferable adsorption of formate species, which further hydrogenate into methanol rather than dissociate into CO on basic sites.34,35 On the other hand, given that the surface area of the support dictates the dispersion of active metals, it becomes highly appealing to shed light on the possibility of a simple but efficient treatment of UGSO with the aim of increasing its surface area. In this respect, certain studies have found that treating solid materials with H2O2 could result in a substantial increase in surface area.36–39 As an example, Jain et al.36 reported an increase by 2 times in the mesopore area of activated carbon by employing H2O2-mediated hydrothermal pre-treated coconut shells.
In the contexts mentioned above, novel Cu–ZnO–ZrO2/UGSO catalysts for CO2 hydrogenation into methanol have been developed using a metallurgical residue as the catalytic support, with special focus on the understanding of the effect of (i) synergy between Cu/Zn/Zr and UGSO on the catalytic activity and stability, and (ii) UGSO modification on the structure–catalytic activity relationship. First, Cu and Zn fractions are fixed at 10 and 7.5 wt%, respectively, while the Zr content is varied from 3 to 12 wt% to identify the optimized Zr loading for methanol synthesis. Then, with the aim to increase the surface area of the support, we propose a simple modification of UGSO by H2O2 treatment. To elucidate the effect of UGSO modification and the relationship between the catalytic structure and activity of Cu–ZnO–ZrO2 deposited over raw (as-received) and modified UGSO supports, numerous characterization techniques are employed, such as X-ray diffraction (XRD), H2 temperature programmed reduction (H2-TPR), CO2 temperature programmed desorption (CO2-TPD), N2 physisorption, N2O chemisorption, X-ray photoelectron spectroscopy (XPS), scanning electron microscopy (SEM), and transmission electron microscopy (TEM). To the best of the authors' knowledge, no similar investigation on the utilization of UGSO as a support for the development of Cu–ZnO–ZrO2-based catalysts for CO2 hydrogenation into methanol is available in the open literature.
2. Experimental
2.1. Catalyst preparation
To evaluate the influence of different supports (as-received and H2O2-modified UGSO) on CO2 hydrogenation, a catalyst containing 10 wt% Cu, 7.5 wt% Zn, and 9 wt% Zr was prepared using the deposition–coprecipitation described in section 2.1.1., where the UGSO was substituted by UGSO-H. The obtained catalyst was denoted as CZ9Zr/UGSO-H.
2.2. Catalyst characterization
Elemental chemical composition was analysed by X-ray fluorescence (XRF) using a Thermo Niton XL3t 980 GOLDD+ (2 W power) apparatus equipped with a Ag anode. Major elements were presented in weight percentage (wt%) while trace elements were expressed in ppm (parts per million).The X-ray diffraction (XRD) patterns were recorded on a Bruker D8 Advance, using Cu Kα radiation (λ = 1.542 Å) operated at 40 kV and 40 mA. The catalysts were scanned from 10° to 90° (2θ) with a step size of 0.01° and a time/step of 0.5 s. Phase identification was performed using DIFFRAC.EVA software.
The Brunauer–Emmett–Teller (BET) surface area and Barrett–Joyner–Halenda (BJH) pore size distribution were measured by N2 physisorption at −196 °C using a Micromeritics ASAP 2020 analyser. Prior to the analysis, the sample was degassed under vacuum at 250 °C for 3 h.
The morphology properties were examined by transmission electron microscopy (TEM) using a JEOL electron microscope (JEM 1230) with an accelerating voltage of 80 kV. Before characterization, the catalysts were dispersed in ethanol and deposited on a carbon film. The samples were then dried naturally at room temperature.
The surface chemical composition and electronic states of the element in the calcined and reduced catalysts were evaluated by X-ray photoelectron spectroscopy (XPS) analysis and the X-ray induced Auger spectra of Cu species were obtained by atomic emission spectroscopy (AES) using a Kratos Axis Ultra spectrometer equipped with a monochromatic Al Kα X-ray radiation source operating at 300 W. The binding energy (BE) scale was corrected internally by setting the BE of C 1s at 284.8 eV. Peak fitting and calculation of relative atomic concentrations were performed using the Origin software.
The surface morphology was observed by scanning electron microscopy (SEM-VEGA3) via a retractable solid state backscattered electron detector. The working distance of the SEM was 10 mm with a 10.0 kV accelerating voltage and a 6 A beam current. Prior to the analysis, the sample was coated with gold and palladium to prevent the charging effect.
The reducibility of the developed materials was evaluated by temperature program reduction (H2-TPR) using a Micromeritics Autochem II 2920. Prior to the measurement, the sample was loaded in a U-shape tube reactor and pre-treated in a pure Ar flow (50 mL min−1) for 10 min. Subsequently, the gas was switched to 10.2 vol% H2/N2 flow (50 mL min−1) and the sample was heated from room temperature to 900 °C at a heating rate of 10 °C min−1 and held at 900 °C for 30 min to get the baseline. H2 consumption was monitored using a thermal conductivity detector (TCD).
Temperature programmed desorption (CO2-TPD) was conducted on the same apparatus to analyse the surface basicity of catalysts. A pre-reduction of the sample at 350 °C was first performed in a nitrogen-diluted hydrogen stream for 2 h (10.2 vol% H2/N2 flow, 50 mL min−1). After the reduction step, the sample was cooled down to 40 °C under a pure He flow and then saturated with CO2 for 1 h under a 10.0 vol% CO2/He flow (50 mL min−1) for 1 h. Afterward, the flow was switched back to He (50 mL min−1) to eliminate any physiosorbed CO2 on the catalyst surface. The temperature was subsequently increased to 700 °C under the same He flow with a heating rate of 5 °C min−1. The desorbed CO2 signal was continuously monitored by a TCD.
The copper surface area was analysed by N2O chemisorption using the same apparatus. Approximately 30 mg of catalyst was first reduced at 350 °C in a flow of 10.2 vol% H2/N2 (50 mL min−1). After reduction, the sample was cooled down to 60 °C in pure He flow (50 mL min−1) and exposed to N2O flow (50 mL min−1, 10 vol% N2O/He) for 1 h at the same temperature so that Cu0 in the surface can be oxidized into Cu2O. Then the sample was flowed with pure Ar flow for 30 min in order to remove the physically adsorbed N2O. Subsequently, the catalyst was reduced again following the procedure mentioned above.
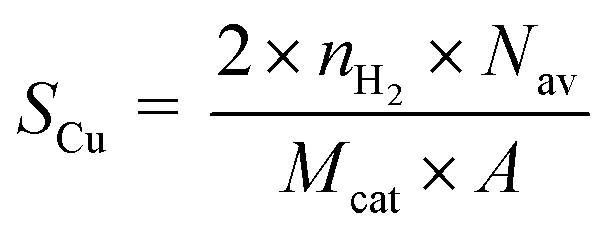
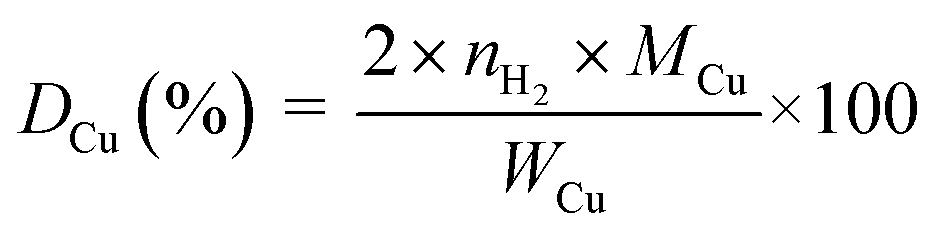
The copper surface area SCu (m2 gCu−1) and dispersion DCu (%) are determined based on the following equations:40
 | (1) |
 | (2) |
2.3. Catalyst evaluation in methanol synthesis
Methanol synthesis was carried out in a milli-fixed bed stainless steel reactor (inner diameter of 6.35 mm and a length of 27 cm) placed in a thermostated chamber. The reaction tube was loaded with 0.5 g of catalyst (<90 μm) installed above quartz wool in the center of the tube. The temperature of the reactor was measured by a thermocouple located inside the catalytic bed. Prior to CO2 hydrogenation, the catalyst was reduced at 350 °C for 2 h in a 50 vol% H2/N2 flow (50 N mL min−1). After reduction, the temperature was cooled down to the reaction temperature under a N2 flow (50 N mL min−1). When the reaction temperature was reached, a mixture of H2/CO2/N2 (9/3/1) was fed to the reactor at 20 bar (gas space velocity (GHSV) of 5000 N mL gcat−1 h−1). The reaction stream was analyzed online using an Agilent 6890N GC equipped with a thermal conductivity detector connected with a SUPELCO Carboxen 1010 plot column (30.0 m × 320 μm × 50.0 μm) for H2, CO2, N2 and CO analysis, and a flame ionization detector connected with an Agilent JW CP-PoraBond Q column (25 m × 320 μm × 45.0 μm) for methanol analysis. The reactant and carrier gaseous flows were controlled using mass flow controllers (Bronkhorst®). Methanol and CO were the only detected products of the reaction. The catalyst activity was analysed in a temperature range between 200 and 300 °C with gaps of 20 °C. Three different as-received UGSO batches were used to evaluate the possible influence of the UGSO source on the catalytic performance. The results are consistent, indicating that fluctuation in raw UGSO from batch-to-batch is not a significant factor influencing catalytic activity.Limitations related to the external diffusion and internal diffusion in the catalyst pores were considered negligible due to the moderate conversions reported in this study, which support a reaction-limited regime.41
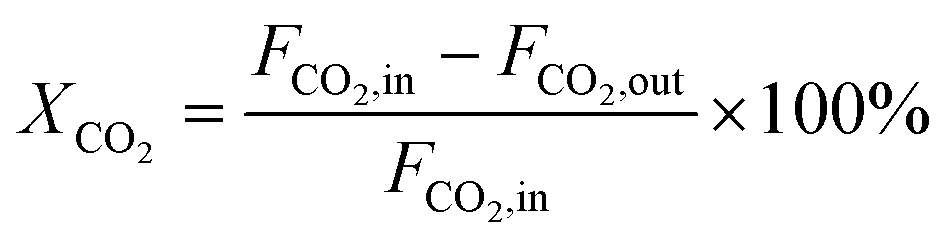
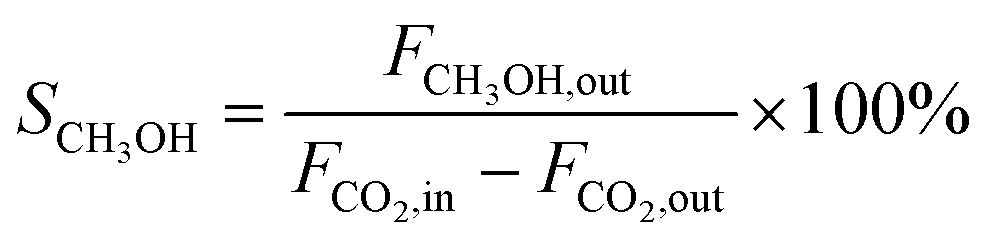
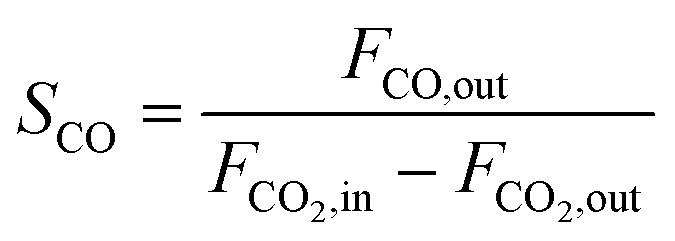
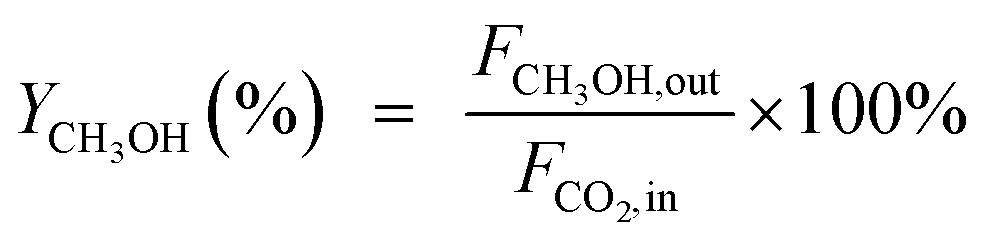
CO2 conversion (XCO2, %), CO selectivity (SCO, %), methanol selectivity (SCH3OH, %), and methanol yield (YCH3OH, %) were determined based on eqn (3)–(6).
 | (3) |
 | (4) |
 | (5) |
 | (6) |
3. Results and discussion
3.1. Effect of Zr content
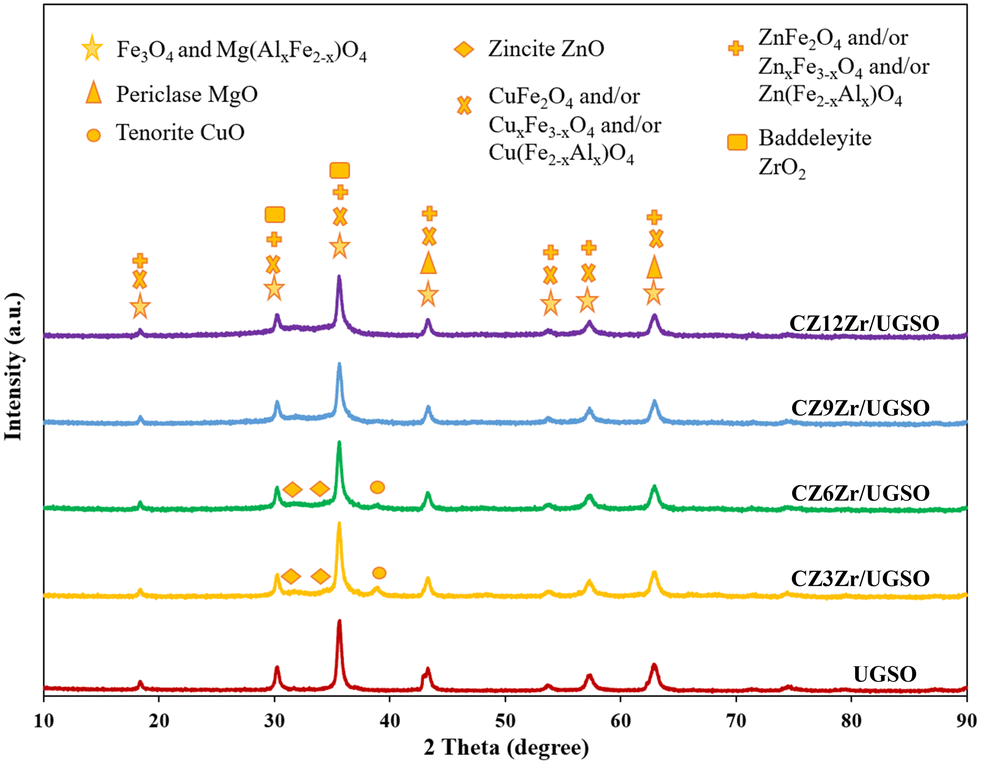 | ||
| Fig. 1 XRD patterns of UGSO and CZxZr/UGSO catalysts. | ||
The textural properties of the prepared samples were investigated using the N2 adsorption–desorption isotherms which are displayed in Fig. S1.† As shown, the isotherm of UGSO is a classical type II, characteristic of a non-porous or macroporous material according to IUPAC (International Union of Pure and Applied Chemistry) classification. The presence of mesopores in small quantity is indicated by a slight hysteresis loop with a steep desorption branch.46 After the deposition–coprecipitation of Cu, Zn, and Zr into UGSO, the N2 adsorption–desorption isotherms of CZxZr/UGSO catalysts show a typical type II, accompanied by a well-defined hysteresis loop with steep adsorption and desorption branches that belong to the H3 type, indicating the presence of mesopores with aggregates of plate-like particles with slit-shaped pores.46 The pore size distribution is determined by the BJH method from the adsorption branch of the isotherms (Fig. S1B†). It is observed that a small quantity of intrinsic pores of UGSO centers at around 3 nm. For CZxZr/UGSO catalysts, the increase of Zr content creates more pores also centered at 3 nm. With the increase of Zr content from 3 to 12 wt%, the BET surface area of CZxZr/UGSO increases significantly from 35.0 to 100.9 m2 g−1, together with the increase of pore volume from 0.14 to 0.23 m3 g−1 (Table 1). The increase in surface area and pore volume could be an indication of the new pores created by the addition of Zr. This can be beneficial for the dispersion of CuO particles, as evidenced by the XRD results described above, in which the diffraction peak of CuO is weaker with the addition of Zr.
| Sample | S BET (m2 g−1) | Pore volumea (m3 g−1) | Pore diametera (nm) | S Cu (m2 g−1) | D Cu (%) |
|---|---|---|---|---|---|
| a Determined from the BJH pore size distribution adsorption branch. | |||||
| Fresh UGSO | 5.6 | 0.04 | 26.7 | — | — |
| CZ3Zr/UGSO | 35.0 | 0.14 | 16.1 | 14.9 | 20.7 |
| CZ6Zr/UGSO | 43.2 | 0.14 | 12.4 | 15.9 | 22.0 |
| CZ9Zr/UGSO | 53.8 | 0.15 | 10.9 | 17.1 | 25.7 |
| CZ12Zr/UGSO | 100.9 | 0.23 | 9.0 | 21.1 | 33.5 |
The metallic Cu surface area was determined by N2O chemisorption and the results are presented in Table 1. With the increase of Zr loading content, SCu increases from 14.9 to 21.1 m2 g−1 and DCu rises from 20.7 to 33.5%. These results are clearly consistent with the XRD and N2 physisorption analyses presented above, indicating that Zr can act as a physical promoter to enhance the dispersion of Cu species.
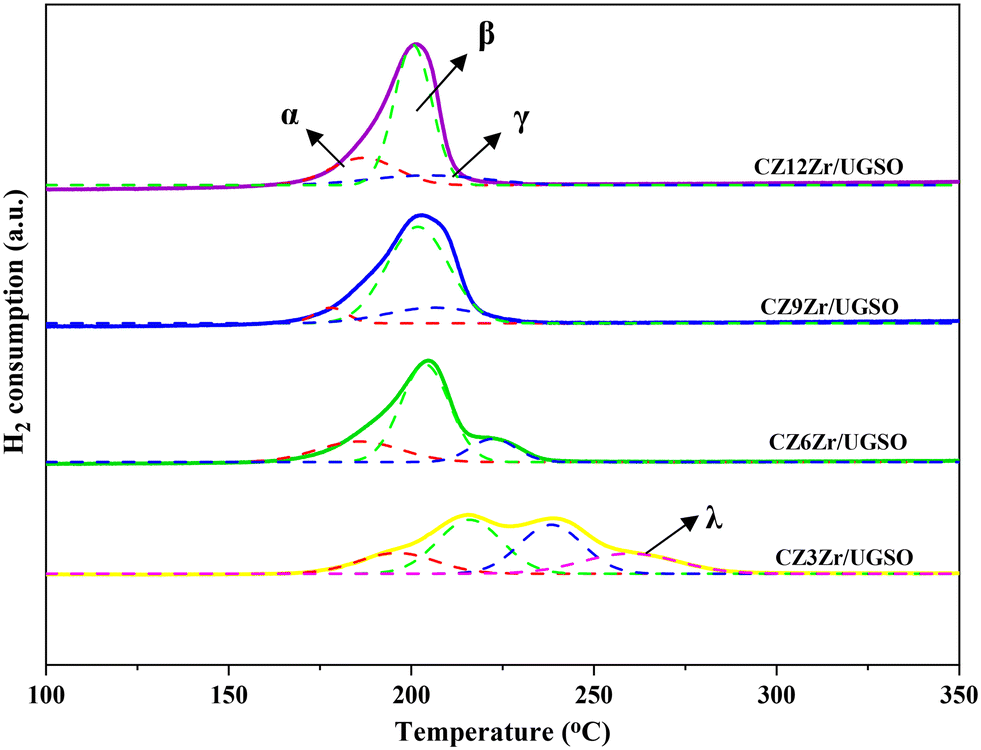 | ||
| Fig. 2 H2-TPR profiles of CZxZr/UGSO catalysts. Solid lines indicate raw data while dotted lines present separated peaks. The α peak is assigned to the reduction of CuFe2O4, the β peak is appointed to the reduction of highly dispersed CuO species, the γ peak is ascribed to the reduction of separated CuO species, and λ is associated with the reduction of larger-sized bulk CuO particles. | ||
The XPS spectra are shown in Fig. 3 to assess the oxidation state, surface composition, and electronic interaction between Fe, Cu and Zr species present in the calcined CZxZr/UGSO samples. Fe 2p, Cu 2p and Zr 3d spectra were all peak-fitted into several peaks using the Gaussian distribution. Considering the spectra of Fe 2p for the UGSO (Fig. 3A), the dominant peak at BE of 710.1 eV can be assigned to Fe 2p3/2, while the peak at BE of 724 eV can be associated with Fe 2p1/2. The satellite band at around 719 eV can characterize the presence of Fe3+.54,55 After the deposition of Cu, Zn and Zr, the 2p3/2 peak can be fitted into two peaks at 710–712 eV and 712–714 eV, which are assigned to the presence of Fe3+ in octahedral sites (in Fe3O4 and ZnFe2O4) and Fe3+ in tetrahedral sites (in Fe3O4 and CuFe2O4), respectively.56,57 As shown in Fig. 3B, the Zr 3d spectra displays two characteristic peaks at 181.7 and 183.4 eV, being attributed to Zr 3d5/2 and Zr 3d3/2 of Zr4+ species.58 Regarding Cu 2p3/2 (Fig. 3C), the BE at 933.8 eV and the satellite band in the region of 940 and 945 eV indicate the presence of Cu2+ in the mixed iron copper oxides and CuO structure, respectively.45,59 In addition, it was reported that the change in chemical environment is predicted by the shift of binding energy.60 The Cu 2p spectra of the calcined CZxZr/UGSO catalysts shift to higher BE value with the incorporation of Zr from 3 to 9 wt% and slightly decrease to a lower binding energy value for 12 wt% Zr. The inverse tendency is, however, noted for the Zr 3d spectra, with the lowest binding energy value observed for the CZ9Zr/UGSO catalyst. These positive and negative binding energy shifts could be attributed to the electron transfer from Cu to Zr at the Cu–ZrOx interfaces, indicating a strong interaction between Cu and Zr in CZxZr/UGSO samples.61 The appropriate addition of Zr into Cu–ZnO/UGSO (9 wt% Zr) could promote the synergetic effect between Cu and Zr, resulting in the highest amount of dispersed CuO species which are in close contact with ZrO2, as confirmed by H2-TPR analysis.
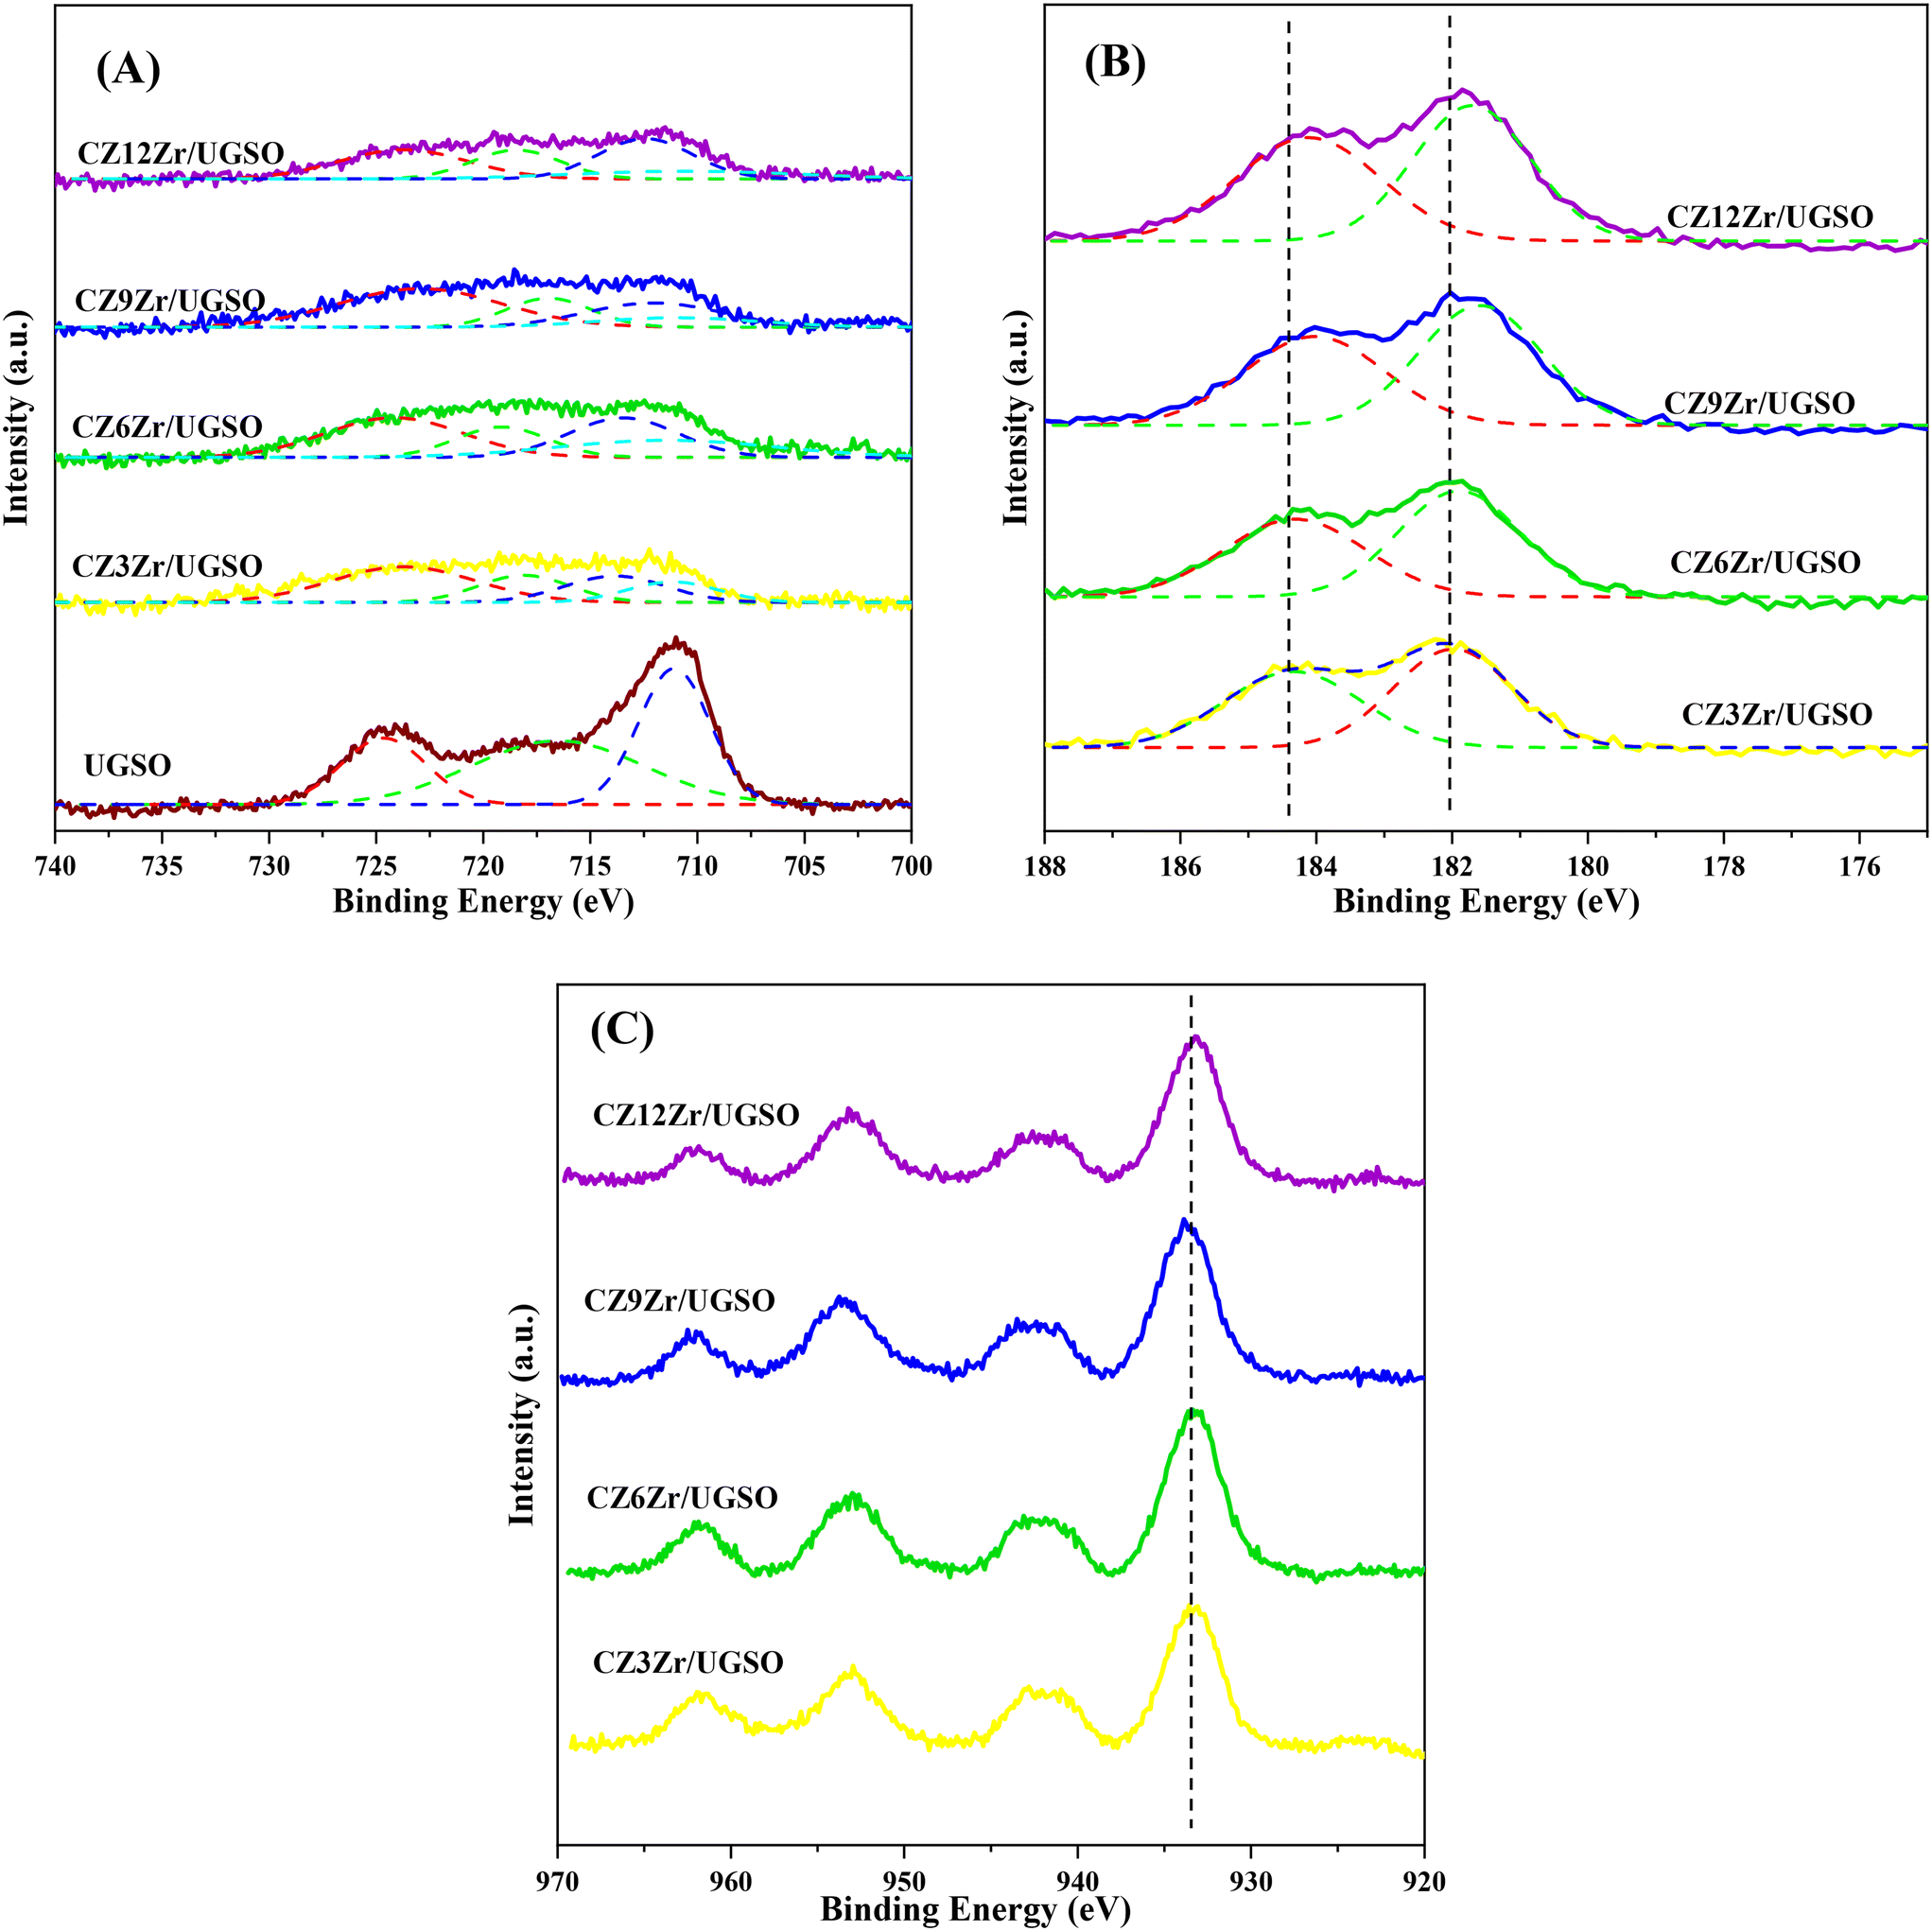 | ||
| Fig. 3 XPS spectra of surface elements of calcined samples: (A) Fe 2p, (B) Zr 3d, (C) Cu 2p. Solid brown, yellow, green, blue, and purple lines indicate raw data while dotted green, red, and blue lines are separated peaks. | ||
The relative atomic surface ratios of different elements in the calcined and reduced samples are presented in Table 2. As shown, the surface atomic Zn/Cu ratio of all the samples is considerably higher than their nominal atomic value, which is 0.74. The value of the Zn/Cu atomic ratio decreases with the increase of Zr, proposing that the addition of Zr leads to a partial separation of Cu onto the surface of the samples.62 This confirms that the addition of Zr results in a higher amount of Cu exposed on the surface, as proved by N2O chemisorption results (Table 1).
| Sample | Zn/Cu | Mg/Cu |
|---|---|---|
| CZ3Zr/UGSO | 3.55 | 0.11 |
| CZ6Zr/UGSO | 2.73 | 0.17 |
| CZ9Zr/UGSO | 2.25 | 0.37 |
| CZ12Zr/UGSO | 2.16 | 0.13 |
The surface basicity of the catalysts was analyzed by temperature programmed desorption of CO2 (CO2-TPD) and their profiles are presented in Fig. S3.† Based on the strength of basic sites, the basicity can be divided into three categories. The weakly basic sites (50–200 °C) are assigned to the OH– group, the moderately basic sites (200–500 °C) are attributed to the metal oxygen M–O pairs (M: Zr, Mg, Cu or Zn) and the strongly basic sites are associated with the unsaturated O2 anion (>500 °C).20 The variation in the proportion of the moderately strong basic area to the total basic area (CZ9Zr/UGSO (0.51) > CZ6Zr/UGSO (0.49) > CZ12Zr/UGSO (0.41) > CZ3Zr/UGSO(0.4)) follows a similar order of the Mg/Cu ratio (Table 2). The highest amount found for CZ9Zr/UGSO suggests that the presence of MgO is related to the surface moderately basic strength. In addition, the highest fraction of moderately strong basic sites to the total basic sites and the highest amount of the dispersed CuO species strongly interacting with the ZnO and ZrO2 observed for CZ9Zr/UGSO, as provided by H2-TPR results, indicate that the moderately strong basicity can also be related to the interface between Cu–ZnO and Cu–ZrO2.63 Since the moderately basic strength is associated with CH3OH formation,35 CZ9Zr/UGSO is expected to have the highest methanol yield among the CZxZr/UGSO samples. Moreover, an increasing trend in the area and desorption temperature of strong basic sites for the catalyst containing higher Zr loading suggests a similar order of CO2 adsorption capacity for these catalysts.
3.2. Effect of UGSO modification by H2O2
| Sample | Al | Mg | Fe | Mn | Si | Ca | Cr | V | Cu | Zn | Zr |
|---|---|---|---|---|---|---|---|---|---|---|---|
| UGSO | 7.20 | 16.73 | 42.44 | 3.55 | 0.11 | 1.35 | 0.45 | 0.87 | — | — | — |
| UGSO-H | 6.46 | 15.33 | 39.30 | 3.27 | 0.15 | 0.76 | 0.42 | 0.84 | — | — | — |
| CZ9Zr/UGSO | 3.06 | 4.53 | 23.58 | 1.78 | 0.21 | 0.15 | — | — | 9.93 | 7.15 | 8.41 |
| CZ9Zr/UGSO-H | 4.44 | 6.62 | 23.78 | 1.10 | 0.19 | 0.12 | — | — | 11.38 | 7.61 | 9.45 |
Considering the as-received UGSO, the main elements detected were Fe (42.44 wt%), followed by Mg (16.73 wt%), Al (7.20 wt%) and Mn (3.55 wt%). Other elements such as Si, Ca, Cr and V were observed below 2 wt%, while the weight percentage of O was the rest. After H2O2 activation, the weight percentages of the main elements in UGSO slightly decreased (Fe (39.30 wt%), Mg (15.33 wt%), Al (6.46 wt%) and Mn (3.27 wt%)), indicating that the weight percentage of O increased. This can be attributed to the partial oxidation of these metal oxides by H2O2.64
The morphology and topography of the calcined samples were observed by scanning electron microscopy and their images are presented in Fig. 4. As shown in Fig. 4A and B, the average diameter of UGSO particles is 22.3 μm (particle sizes ranging from 3.1 to 85.1 μm), while it is 17.0 μm for UGSO-H particles (particle sizes ranging from 2.0 to 78.2 μm), demonstrating a decrease in particle sizes. It is observed that H2O2-activated UGSO particles maintain a similar block-like morphology to the as-received UGSO particles. However, higher magnification images show that the surface of UGSO particles presents an overall platelet-like morphology (Fig. 4C), while a sphere-like morphology is observed for UGSO-H (Fig. 4D). This indicates a slight change of the particles from platelet to a more spherical shape after H2O2 activation. In addition, a rougher and more porous surface is observed for UGSO-H in comparison with UGSO. This could be related to the transformation of magnesium oxide into its correspondent peroxide caused by its interaction with H2O2.65,66 MgO2 can be decomposed into MgO through the thermal treatment because O2˙− is destroyed at temperature higher than 200 °C.66 The more porous and defect-containing surface of USGO-H leads to its higher surface area in comparation with its counterpart, which is in good agreement with the N2 physisorption results. Similarly, after deposition of Cu, Zn and Zr, the surface of CZ9Zr/UGSO-H consisted of rougher sphere-like particles in comparison to CZ9Zr/UGSO (Fig. 4E and F).
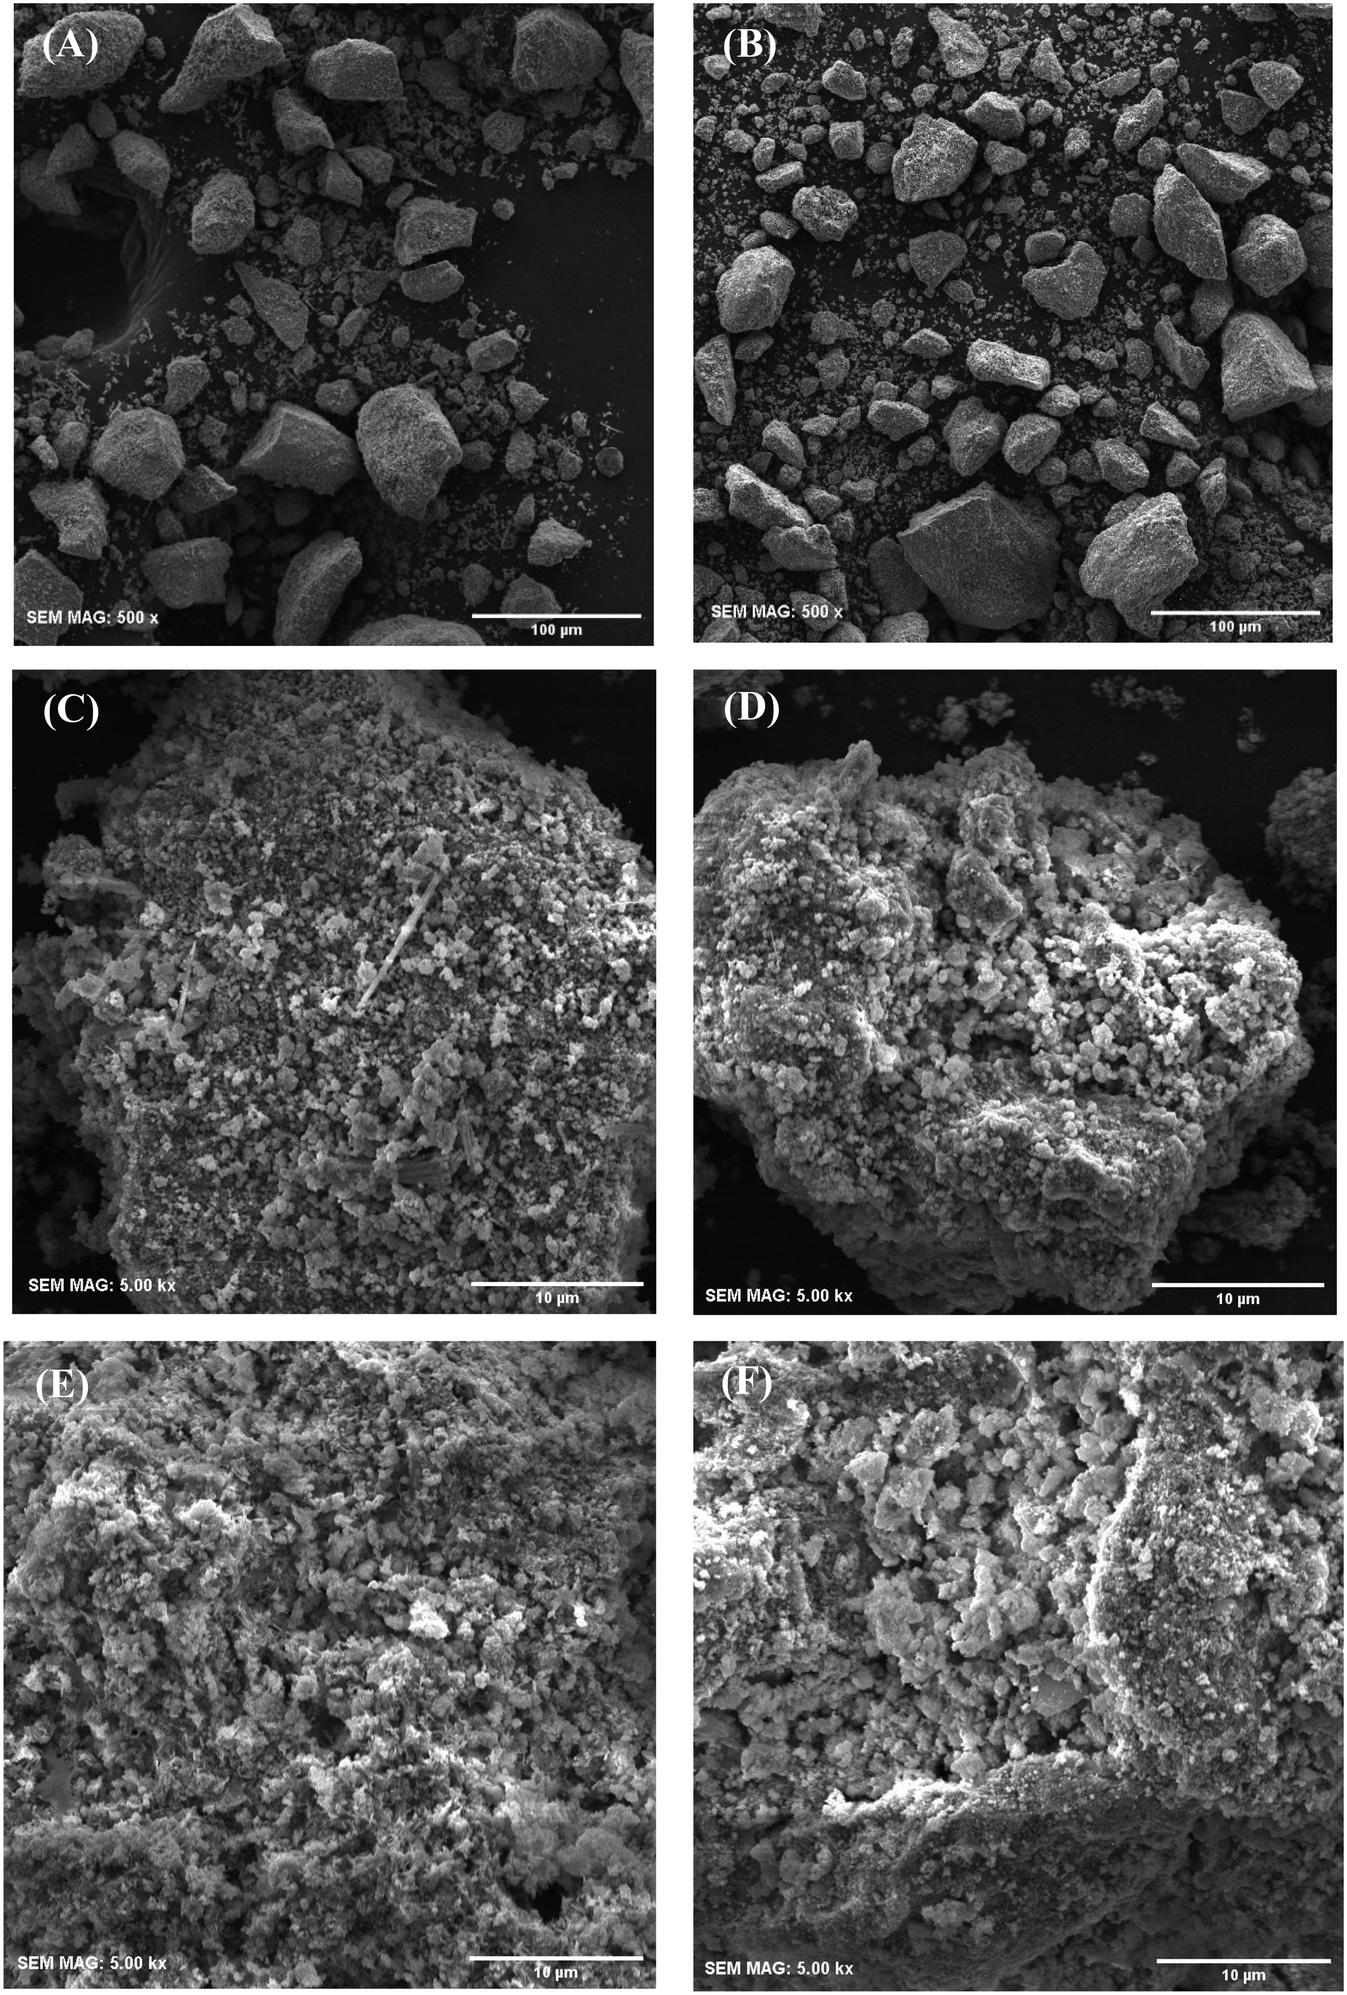 | ||
| Fig. 4 Scanning electron microscopy of UGSO (A) and (C), UGSO-H (B) and (D), CZ9Zr/UGSO (E) and CZ9Zr/UGSO-H (F). | ||
The influence of H2O2 treatment on the structure properties of the supports and their corresponding catalysts was investigated by XRD analysis. Fig. S4A† shows the XRD patterns of the calcined UGSO, UGSO-H, CZ9Zr/UGSO and CZ9Zr/UGSO-H catalysts. As can be seen, the diffraction peaks of all phases in UGSO-H are similar to those of UGSO, indicating no major change in crystalline phase by H2O2 activation.
In order to investigate the structures of the samples prior to the reaction, the reduced CZ9Zr/UGSO and CZ9Zr/UGSO-H samples (which were treated in a mixture of 50 vol% H2/N2 prior to the CO2 hydrogenation reaction) were characterized by XRD and their patterns are presented in Fig. S4B.† The diffraction peak at 2θ = 43.3° is observed for the two reduced samples, indicating the presence of Cu (PDF: 04-004-0836)) and/or CuZn alloy (such as Cu5Zn8, PDF 04-007-1117). The average crystal sizes of Cu particles (which is estimated using Scherrer equations at 2θ = 43.3°) are 16.2 nm and 15.7 nm for the reduced CZ9Zr/UGSO and CZ9Zr/UGSO-H, respectively.
The N2 adsorption–desorption isotherms of UGSO, UGSO-H and their corresponding catalysts (Fig. 5A) show type II, characteristic of macroporous or non-porous materials according to the IUPAC classification. The well-defined hysteresis loops with steep adsorption and desorption branches at high relative pressure (P/P0 = 0.6–0.9) belong to the H3-type, suggesting the presence of mesopores with aggregates of plate-like particles accompanied by slit-shaped pores.46 After H2O2 activation, the BET surface area of the support increases by 135%, which is well consistent with the literature36–39 showing that H2O2 activation can lead to the improvement in BET surface area of the sample. In addition, the presence of mesopores over the wide range size of 5–35 nm (Fig. 5B) means that the H2O2 treatment creates a new pore type for the UGSO-H support, as proved by SEM images, resulting in an increased total pore volume of nearly two fold compared to that of the as-received UGSO (Table 4). After the deposition of Cu, Zn and Zr into the modified UGSO, the pore sizes increased and recentered at 5 nm, resulting in an increase of 40% in the BET surface area and 60% in the pore volume of CZ9Zr/UGSO-H in comparison to CZ9Zr/UGSO.
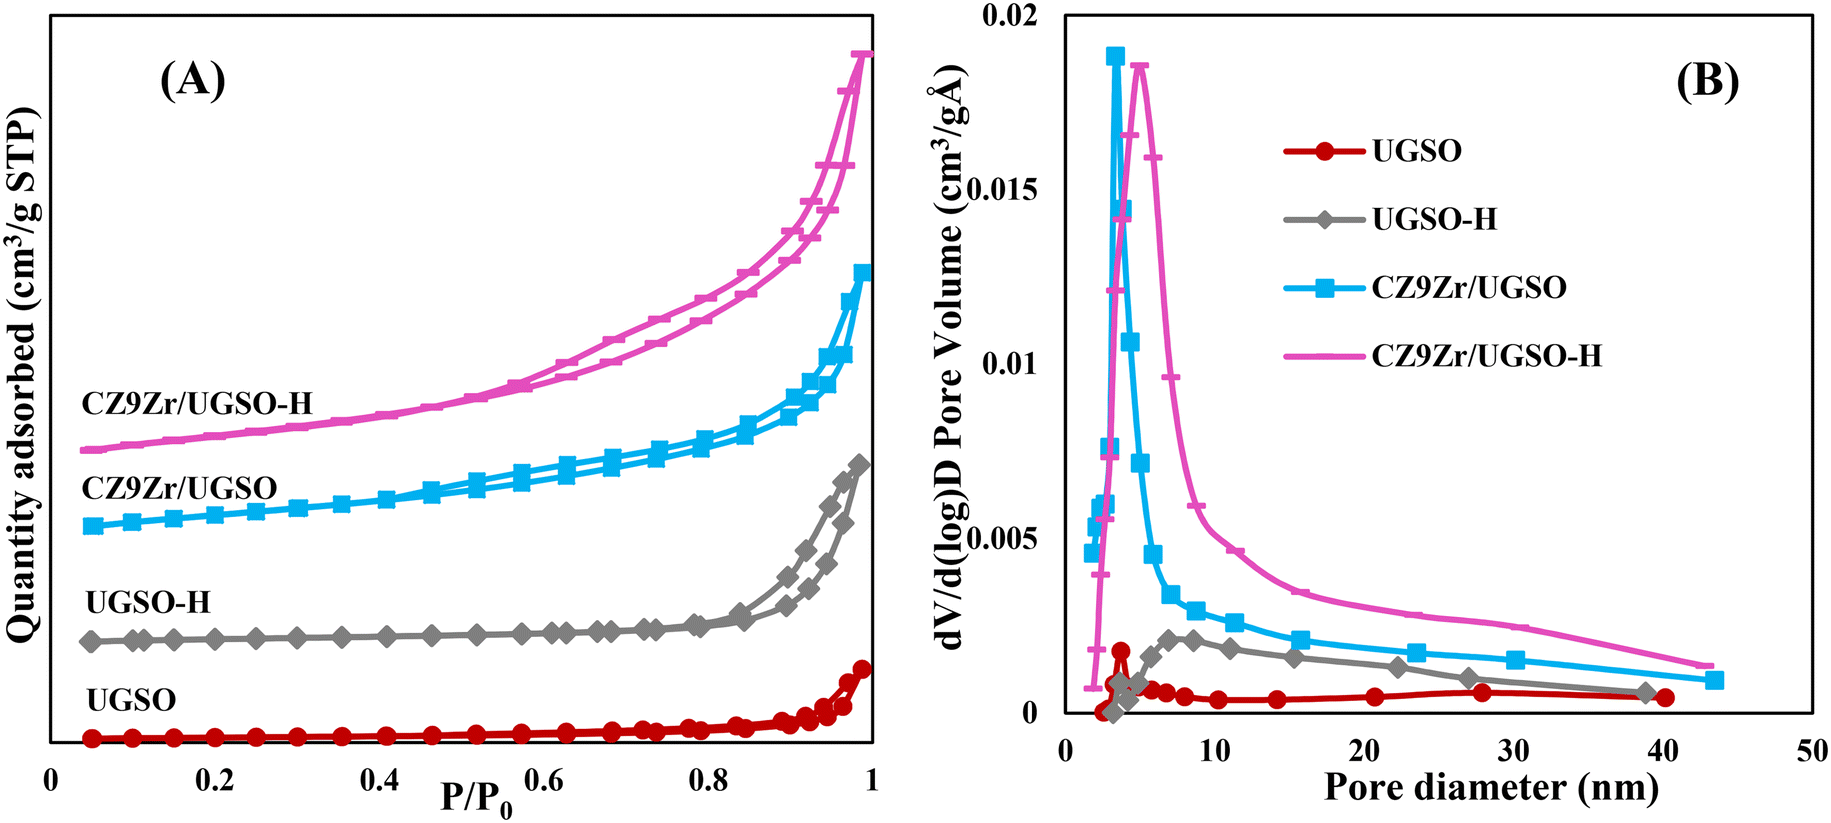 | ||
| Fig. 5 N2 adsorption–desorption curves (A) and pore size distributions (B) of samples. | ||
Table 4 presents the metallic Cu surface area of the catalysts. As shown, SCu increases by 12% for CZ9Zr/UGSO-H, being mainly assigned to the higher BET surface area of modified UGSO, which facilitates the dispersion of CuO species. As a result, Cu dispersion increases by 21% for this catalyst in comparison with its counterpart.
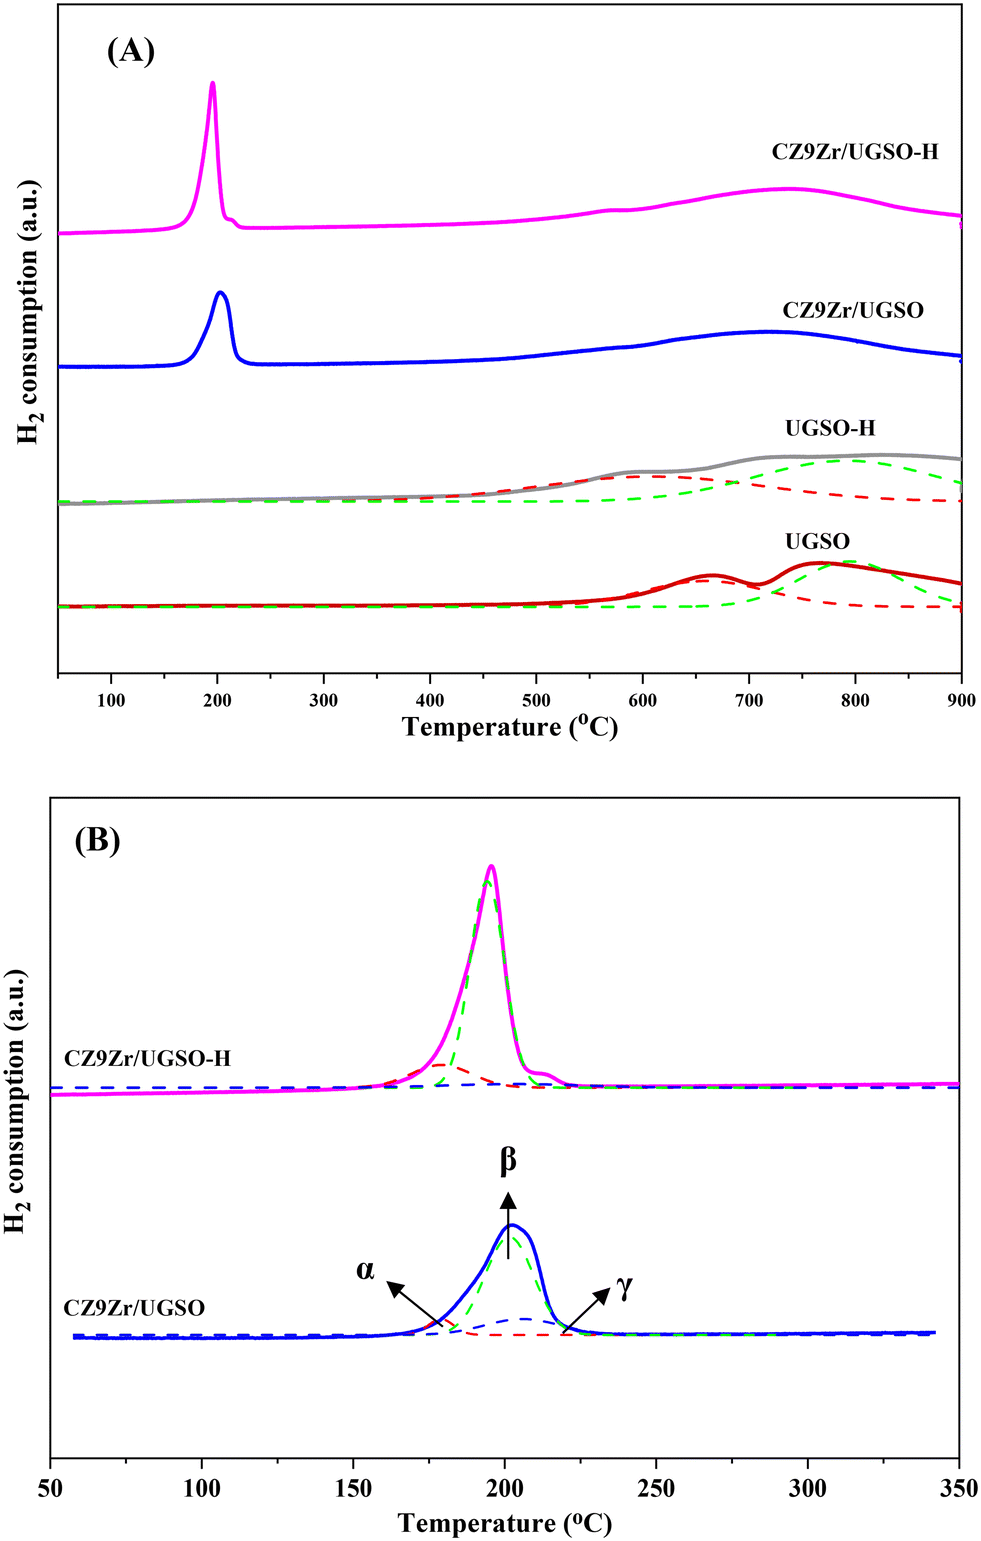 | ||
| Fig. 6 H2-TPR profiles of the samples (A) from 50 to 900 °C and (B) from 50 to 350 °C. Solid lines indicate raw data while dotted lines present separated peaks. The α peak is assigned to the reduction of CuFe2O4, the β peak is appointed to the reduction of highly dispersed CuO species, and the γ peak is ascribed to the reduction of separated CuO species. | ||
| Sample | Peak α | Peak β | Peak γ | |||
|---|---|---|---|---|---|---|
| T (°C) | % area | T (°C) | % area | T (°C) | % area | |
| CZ9Zr/UGSO | 178 | 6.3 | 202 | 74.9 | 206 | 18.7 |
| CZ9Zr/UGSO-H | 179 | 15.2 | 194 | 79.3 | 203 | 5.5 |
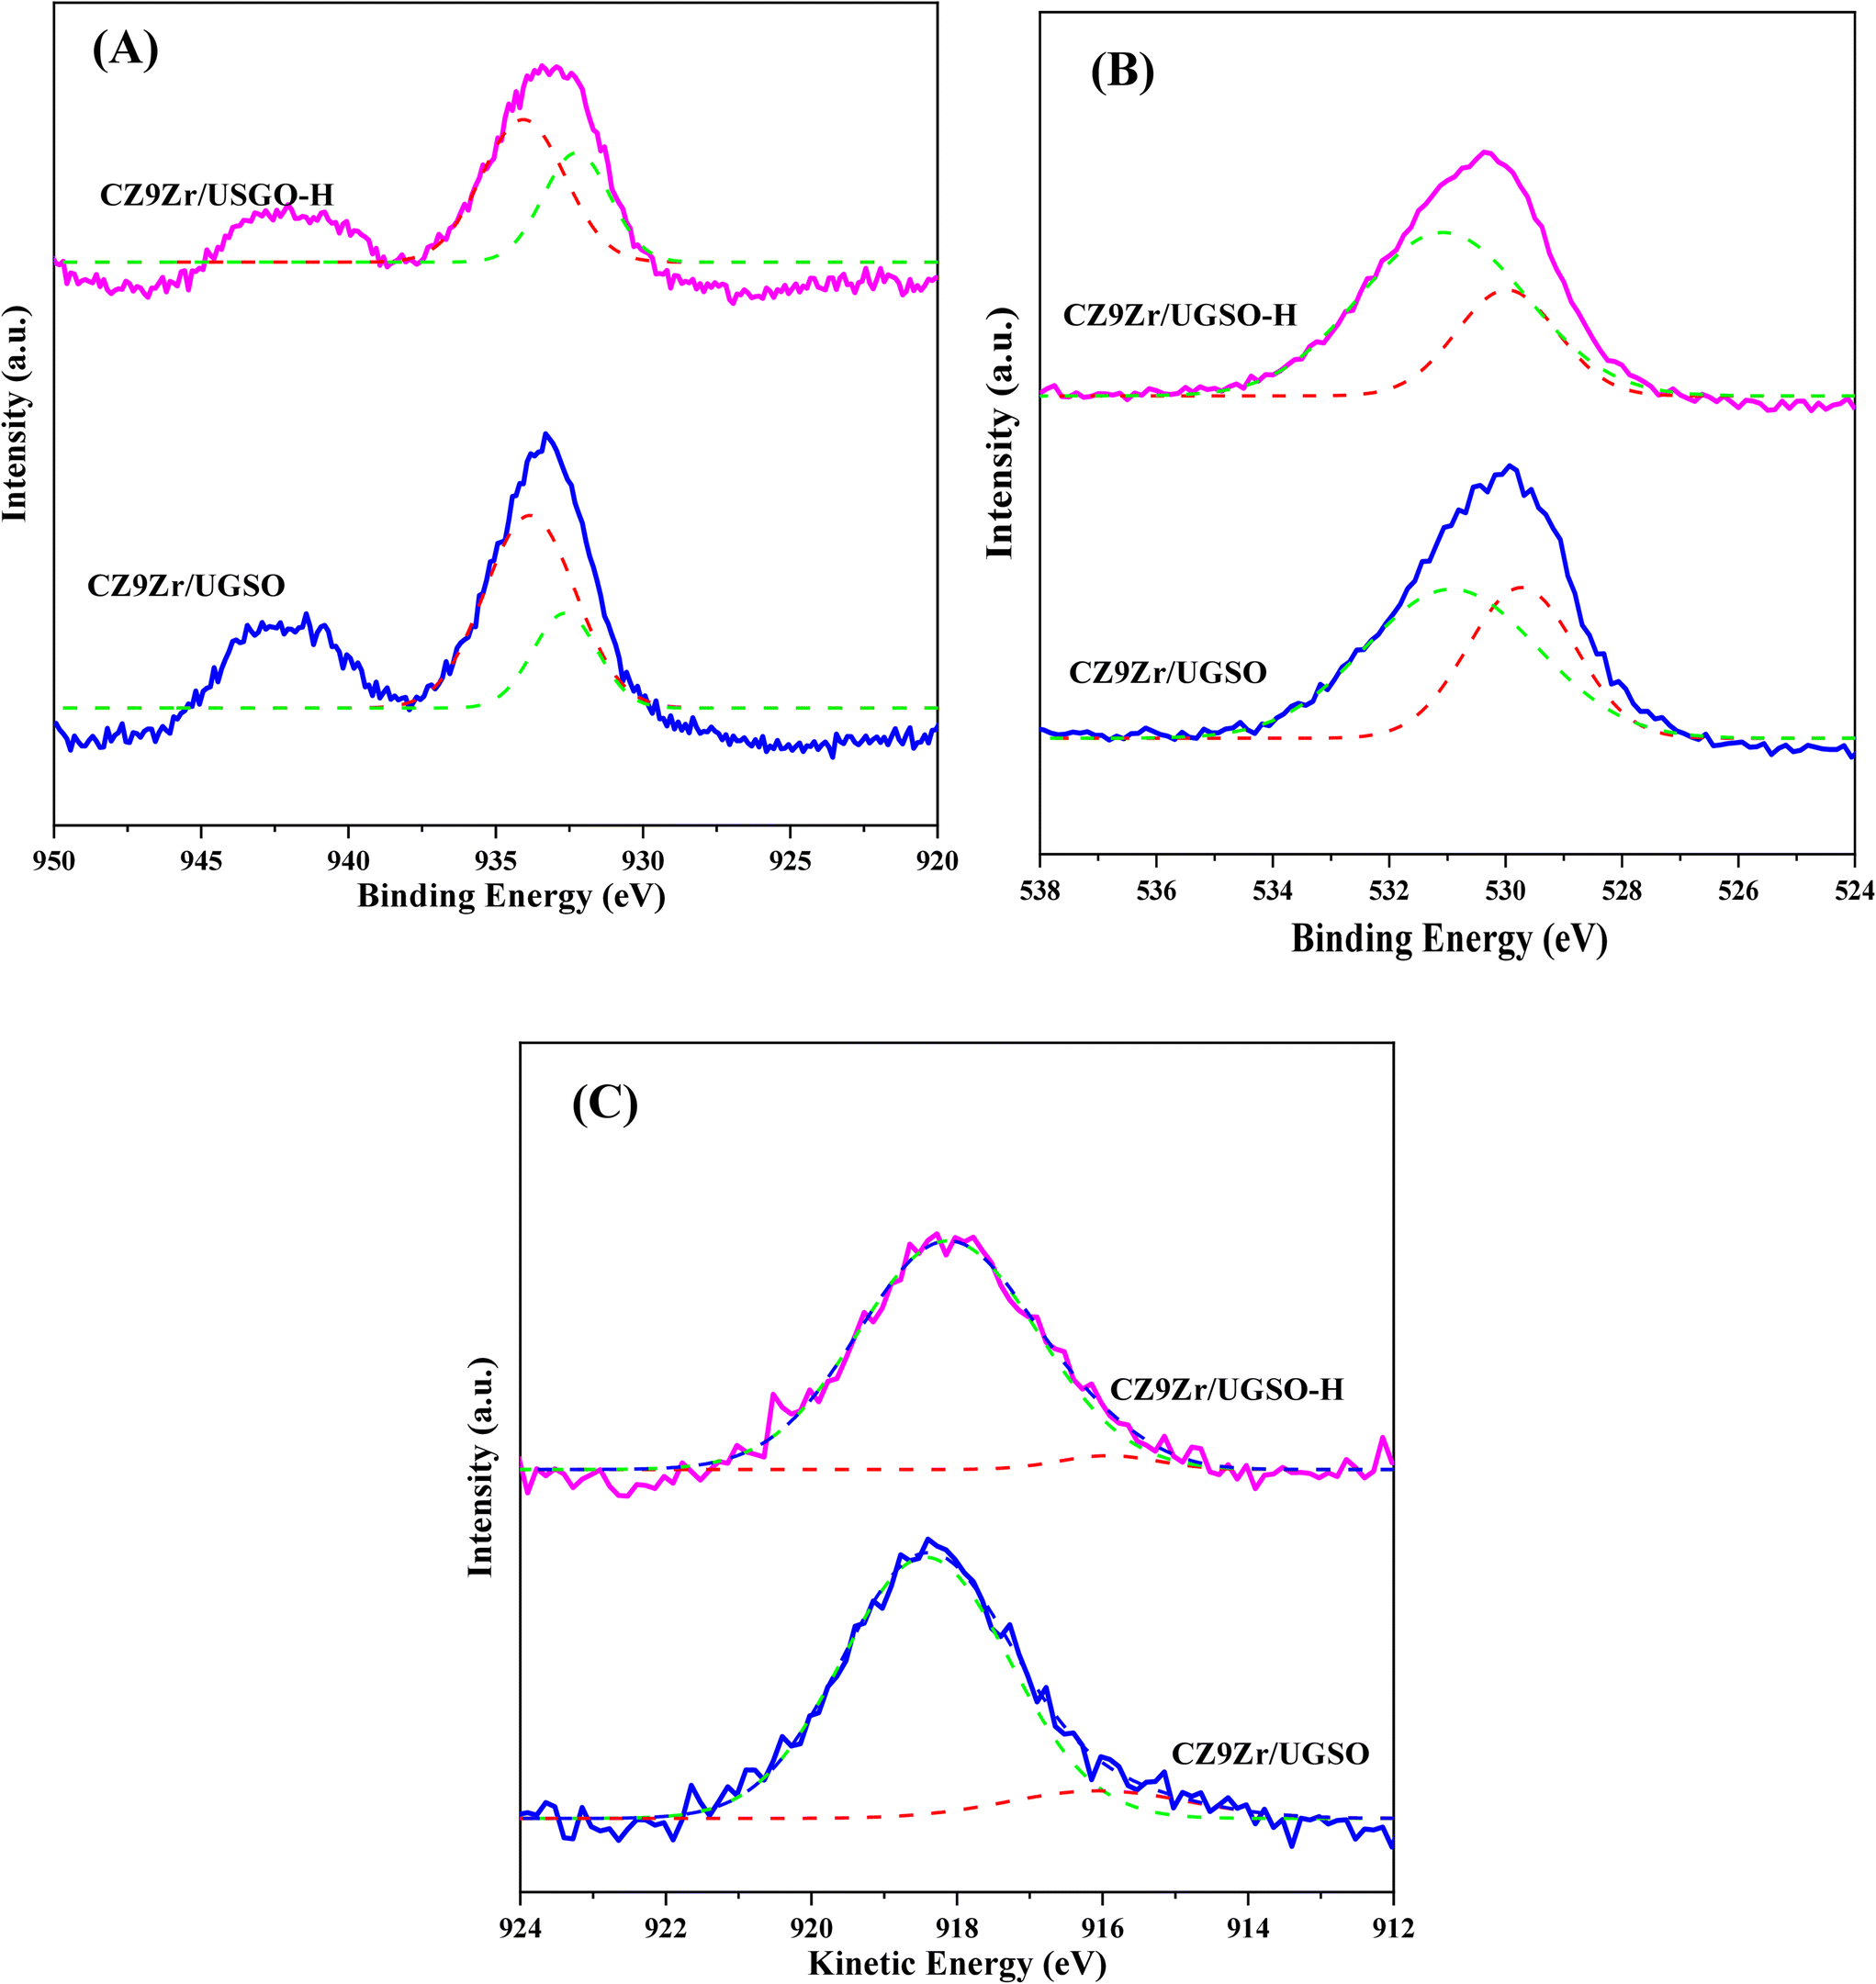
The influence of H2O2 on the surface oxidation state, chemical composition and electronic interaction of elements in the samples was investigated by XPS analysis. The spectra are presented in Fig. 7 and S5.† The Fe 2p, Cu 2p, Zr 3d, and O 1s spectra were all fitted into several peaks using Gaussian distribution. Concerning the UGSO support, the main peak of the Mg 2p spectra (Fig. S5A†) at 49.2 eV is attributed to Mg2+ in the form of MgO or MgFe2O4 structure.55,67 When compared to the Mg 2p spectra of UGSO-H (49.4 eV), a slight chemical shift to higher BE is observed, which can be deduced from the partial oxidation of Mg by the H2O2 activation.68 The same tendency is observed for Fe (Fig. S5B†), in which the BEs of Fe 2p shift to higher values for UGSO-H, suggesting that the Fe species in the as-received UGSO were partially oxidized by H2O2. After the deposition–coprecipitation, the presence of two peaks at 710–712 eV and 712–714 eV in CZ9Zr/UGSO and CZ9Zr/UGSO-H suggests the presence of Fe3+.56,57
 | ||
| Fig. 7 XPS spectra of surface elements in reduced samples (A) Cu 2p, (B) O 1s, (C) XAES spectra of Cu LMM. Solid red, grey, blue, and pink lines indicate raw data while dotted green, red, and blue lines are separated peaks. | ||
Considering the reduced CZ9Zr/UGSO and CZ9Zr/UGSO-H catalysts (ex situ reduced in 50% H2/N2, at 350 °C, for 2 h, i.e., the reduction condition as prior to the methanol synthesis reaction), the peak at 933.7 eV and the satellite band in the region of 940 and 945 eV demonstrate the presence of the Cu2+ ion69 (Fig. S5C†). The additional peak at ∼932.6 eV can be attributed to the existence of Cu0 or Cu+ from the reduction of Cu2+ species (Fig. 7A).70 Due to the overlapping peaks of Cu0 and Cu+ in XPS, the X-ray induced Auger spectrum was used to distinguish Cu valences. The spectra of Cu LMM (Fig. 7C) are fitted into two peaks at 918.1 eV and 915.8 eV, which are assigned to Cu0 and Cu+, respectively.61,71 This result further confirms the existence of both Cu+ and Cu0 in the reduced catalysts. The Cuα/(Cuα + Cu2+) ratio (α = 0 or 1+) of CZ9Zr/UGSO (26%) is lower than that of CZ9Zr/UGSO-H (38%), indicating the higher concentration of Cuα in the latter. This could be attributed to the higher surface area of CZ9Zr/UGSO-H, which facilitates the dispersion and reducibility of the Cu species. Since both Cu0 and Cu+ are reported as active sites for the CO2 hydrogenation reaction,72,73 the higher concentration of (Cu0 + Cu+) in CZ9Zr/UGSO-H is expected to lead to the higher CO2 conversion of this catalyst. Concerning the O 1s spectra of the reduced catalysts (Fig. 7B), the main peak is divided into 2 fitted peaks: (1) the peak at BE of 529.8 eV is assigned to the lattice oxygen (OI) and (2) the peak at BE of 531.0 eV is appointed to the surface-adsorbed oxygen (OII) (which is related to the presence of oxygen vacancies on the sample surface).74 The relative contribution of OII (OII/(OI + OII)) of CZ9Zr/UGSO (61.4%) is lower than that of CZ9Zr/UGSO-H (71.9%), indicating the higher concentration of oxygen vacancies on the latter. As the oxygen vacancies on the catalyst surface are considered as active sites for CO2 adsorption and activation,75 CZ9Zr/UGSO-H containing a higher concentration of oxygen vacancies is expected to have higher CO2 adsorption and conversion.
Fig. 8 shows the CO2-TPD profiles of the two catalysts with the three divided regions as discussed in §3.1.2. As can be seen, after UGSO modification, there is a slight increase in the area of moderately and strong basic sites. The higher fraction of moderately strongly basic sites of CZ9Zr/UGSO-H, which is attributed to the higher Mg/Cu (0.46 for CZ9Zr/UGSO-H versus 0.37 for CZ9Zr/UGSO), and its higher amount of the dispersed CuO species strongly interacting with ZnO and ZrO2, suggest a higher methanol formation for this catalyst. In addition, the significant increase in the area of strongly basic sites when UGSO-H is used as a support reveals a relationship between basicity strength and CO2 adsorption onto oxygen vacancies on the catalyst surface.75 As a result, CZ9Zr/UGSO-H, which has a higher number of strongly basic sites than CZ9Zr/UGSO, is expected to exhibit higher CO2 conversion than CZ9Zr/UGSO.
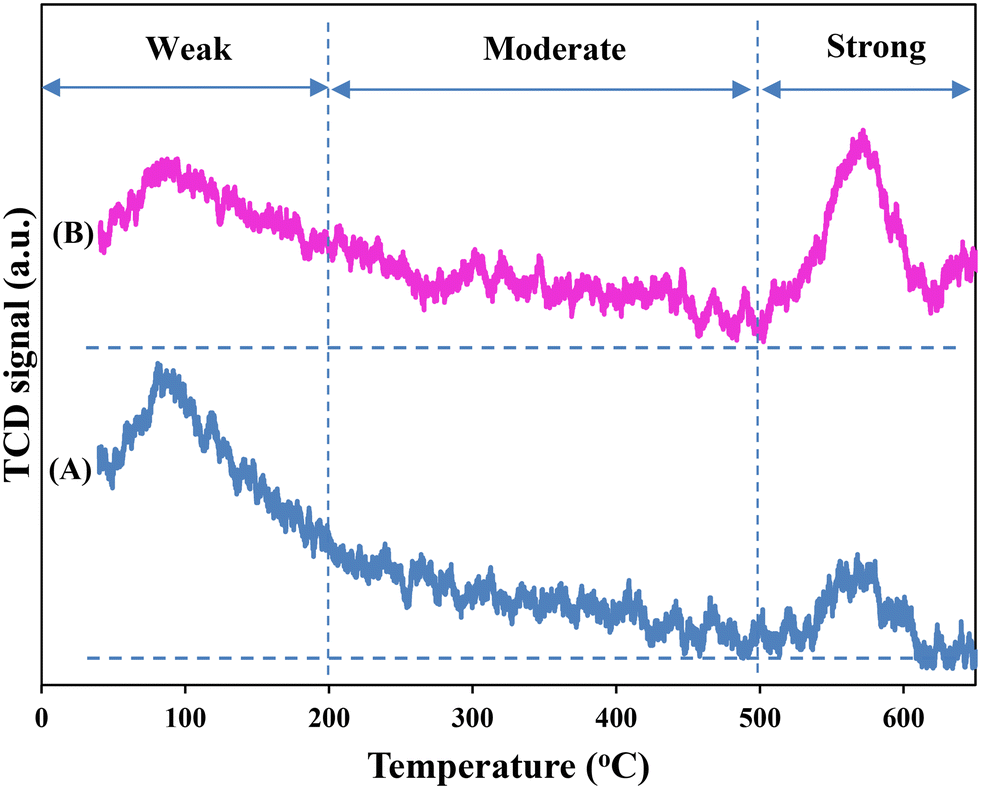 | ||
| Fig. 8 CO2-TPD profiles of (A) CZ9Zr/UGSO and (B) CZ9Zr/UGSO-H catalysts. | ||
3.3. Catalyst performance in CO2 hydrogenation
 | (R1) |
 | (R2) |
As shown in Fig. 9A, CO2 conversion is found to increase from 2.9 to 5.3% with the increase of Zr content from 3 to 12%. This can probably be attributed to (i) the enhancement in BET surface area of the catalysts, which facilitates the dispersion of active sites, (ii) the increase in Cu surface area, and (iii) the increase in CO2 adsorption capacity. Meanwhile, methanol selectivity decreases from 45 to 26.1% with the increase of Zr content. As a result, the methanol yield follows a volcanic shape with the increase of Zr loading, reaching the highest value at 1.51% for CZ9Zr/UGSO, because the acceleration in CO2 conversion is higher than the decrease in methanol selectivity. The methanol yield obtained over the CZxZr/UGSO catalysts shows no linear relationship with the Cu surface area, indicating that SCu is not the key factor in methanol formation.
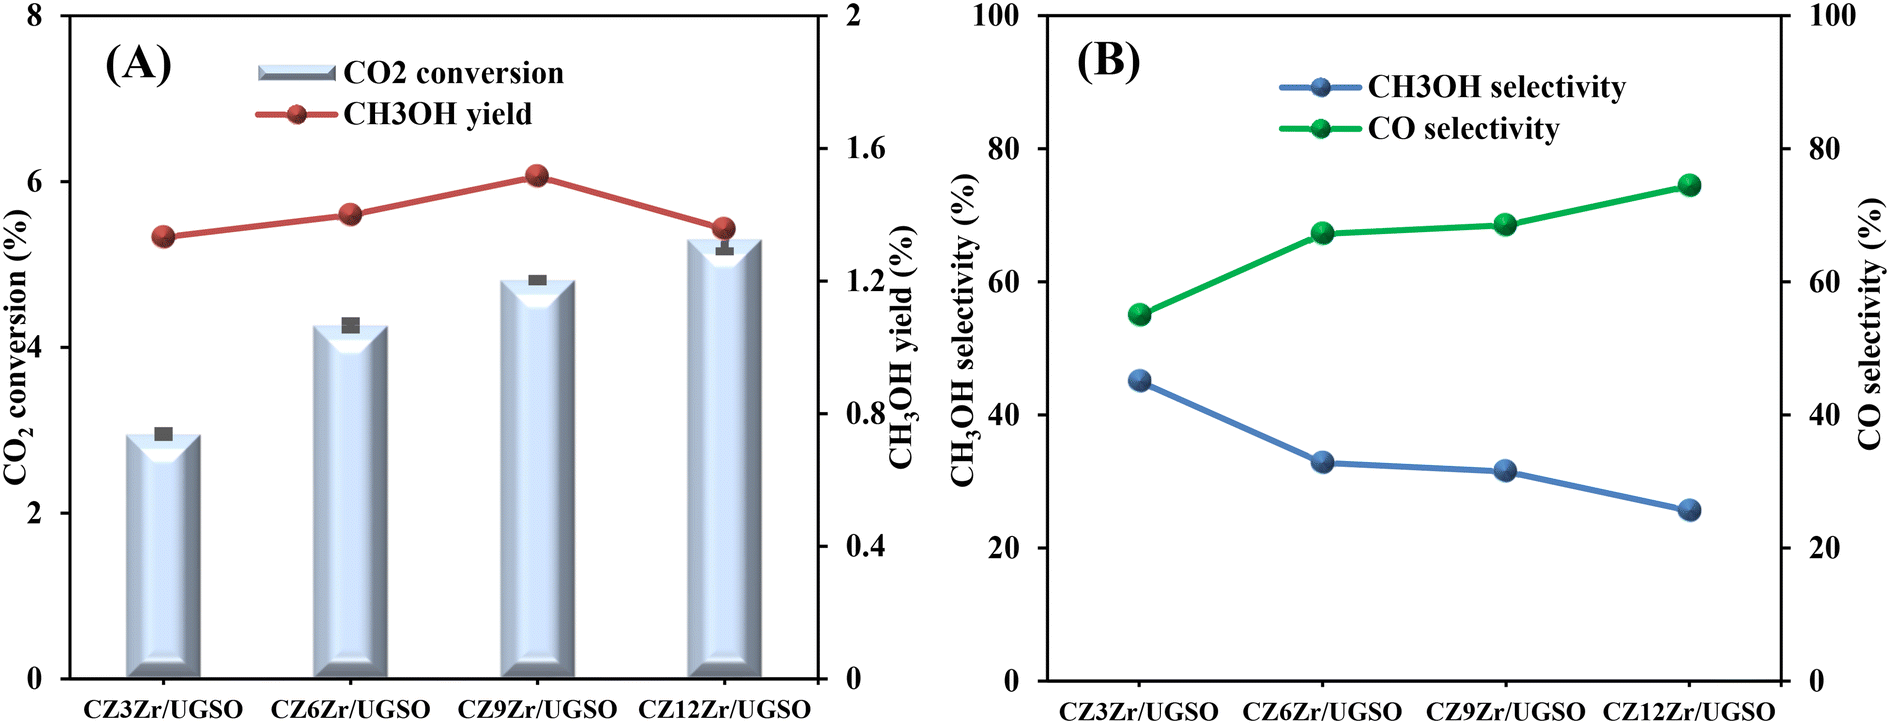 | ||
| Fig. 9 (A) CO2 conversion and CH3OH yield, (B) CH3OH and CO selectivity of CZxZr/UGSO catalysts. Reaction conditions: P = 20 bar, T = 240 °C, H2/CO2 = 3, GHSV = 5000 N mL gcat−1 h−1. | ||
CO2-TPD results (§3.1.2) and Fig. 9B suggest that CZ9Zr/UGSO (with the highest Mg/Cu ratio and proportion of moderately strong basic area) shows the highest methanol yield among the CZxZr/UGSO samples. Therefore, Mg/Cu is one of the factors determining the methanol yield. In addition, it was pointed out that the interfaces between Cu–ZrO2 and/or Cu–ZnO are the main active sites for methanol formation, while the RWGS is primarily favored on the metallic Cu surface.18,24,76 As confirmed by H2-TPR and XPS analysis, the strongest synergy between Cu and Zr leading to the highest interfacial contact between Cu–ZnO and Cu–ZrO2 observed for CZ9Zr/UGSO could explain the maximum methanol yield of this catalyst.
To evaluate the activity–temperature relationship of the prepared samples, the catalytic performance was evaluated at 200–280 °C under the same pressure and space velocity conditions (20 bar, GHSV = 5000 N mL gcat−1 h−1). A commercial Cu–ZnO-based methanol synthesis catalyst (Alfa Aesar, ThermoFisher (Kandel) GmbH, containing CuO (64 wt%), ZnO (24 wt%), Al2O3 (10 wt%) and MgO (2 wt%)) was tested under the same reaction conditions to compare with our prepared catalysts. The CO2 conversion at equilibrium is determined from reaction (R1) and (R2) using ProSim software. The CO2 conversion, methanol yield, methanol and CO selectivity are plotted in Fig. 10. As shown in Fig. 10A, the CO2 conversion of CZxZr/UGSO samples increases with the addition of Zr. However, under all reaction conditions, it is lower than that obtained from thermodynamic simulation, indicating that the reactions worked under the prevailing kinetic regime.77 Evidently, as temperature increases from 260–280 °C, CO2 conversion shifts to a higher value and gradually reaches near equilibrium, suggesting that CO2 conversion can be kinetically enhanced with the elevation of temperature. Generally, methanol selectivity decreases with the increase of Zr loading, while CO selectivity shows the opposite tendency. Concerning the effect of temperature, all the samples show a decreasing methanol selectivity (Fig. 10C) and an increasing CO selectivity (Fig. 10D) when the temperature increases from 200–280 °C, due to the exothermic and endothermic nature of reactions (R1) and (R2), respectively. As an example, as temperature rises from 200–280 °C, the methanol selectivity of CZ3Zr/UGSO and CZ12Zr/UGSO decreases from 100% and 82.7% to 12.8% and 5.8%, respectively. Notably, the methanol selectivity of CZxZr/UGSO catalysts is significantly higher than that of the commercial Cu–ZnO-based methanol synthesis catalyst at the reaction temperature (200–280 °C). For all the samples, the methanol yield (Fig. 10B) shows a volcanic shape with the increase of reaction temperature. The highest values are observed for CZ9Zr/UGSO at all investigated reaction temperatures, which are indeed higher than those of the commercial Cu–ZnO-based methanol synthesis catalyst. The highest methanol yield over CZ9Zr/UGSO is attributed to (1) the highest Mg/Cu ratio, which facilitates methanol formation, and (2) the highest amount of interfacial sites between Cu–ZnO and Cu–ZrO2 which are considered as active sites for methanol synthesis.
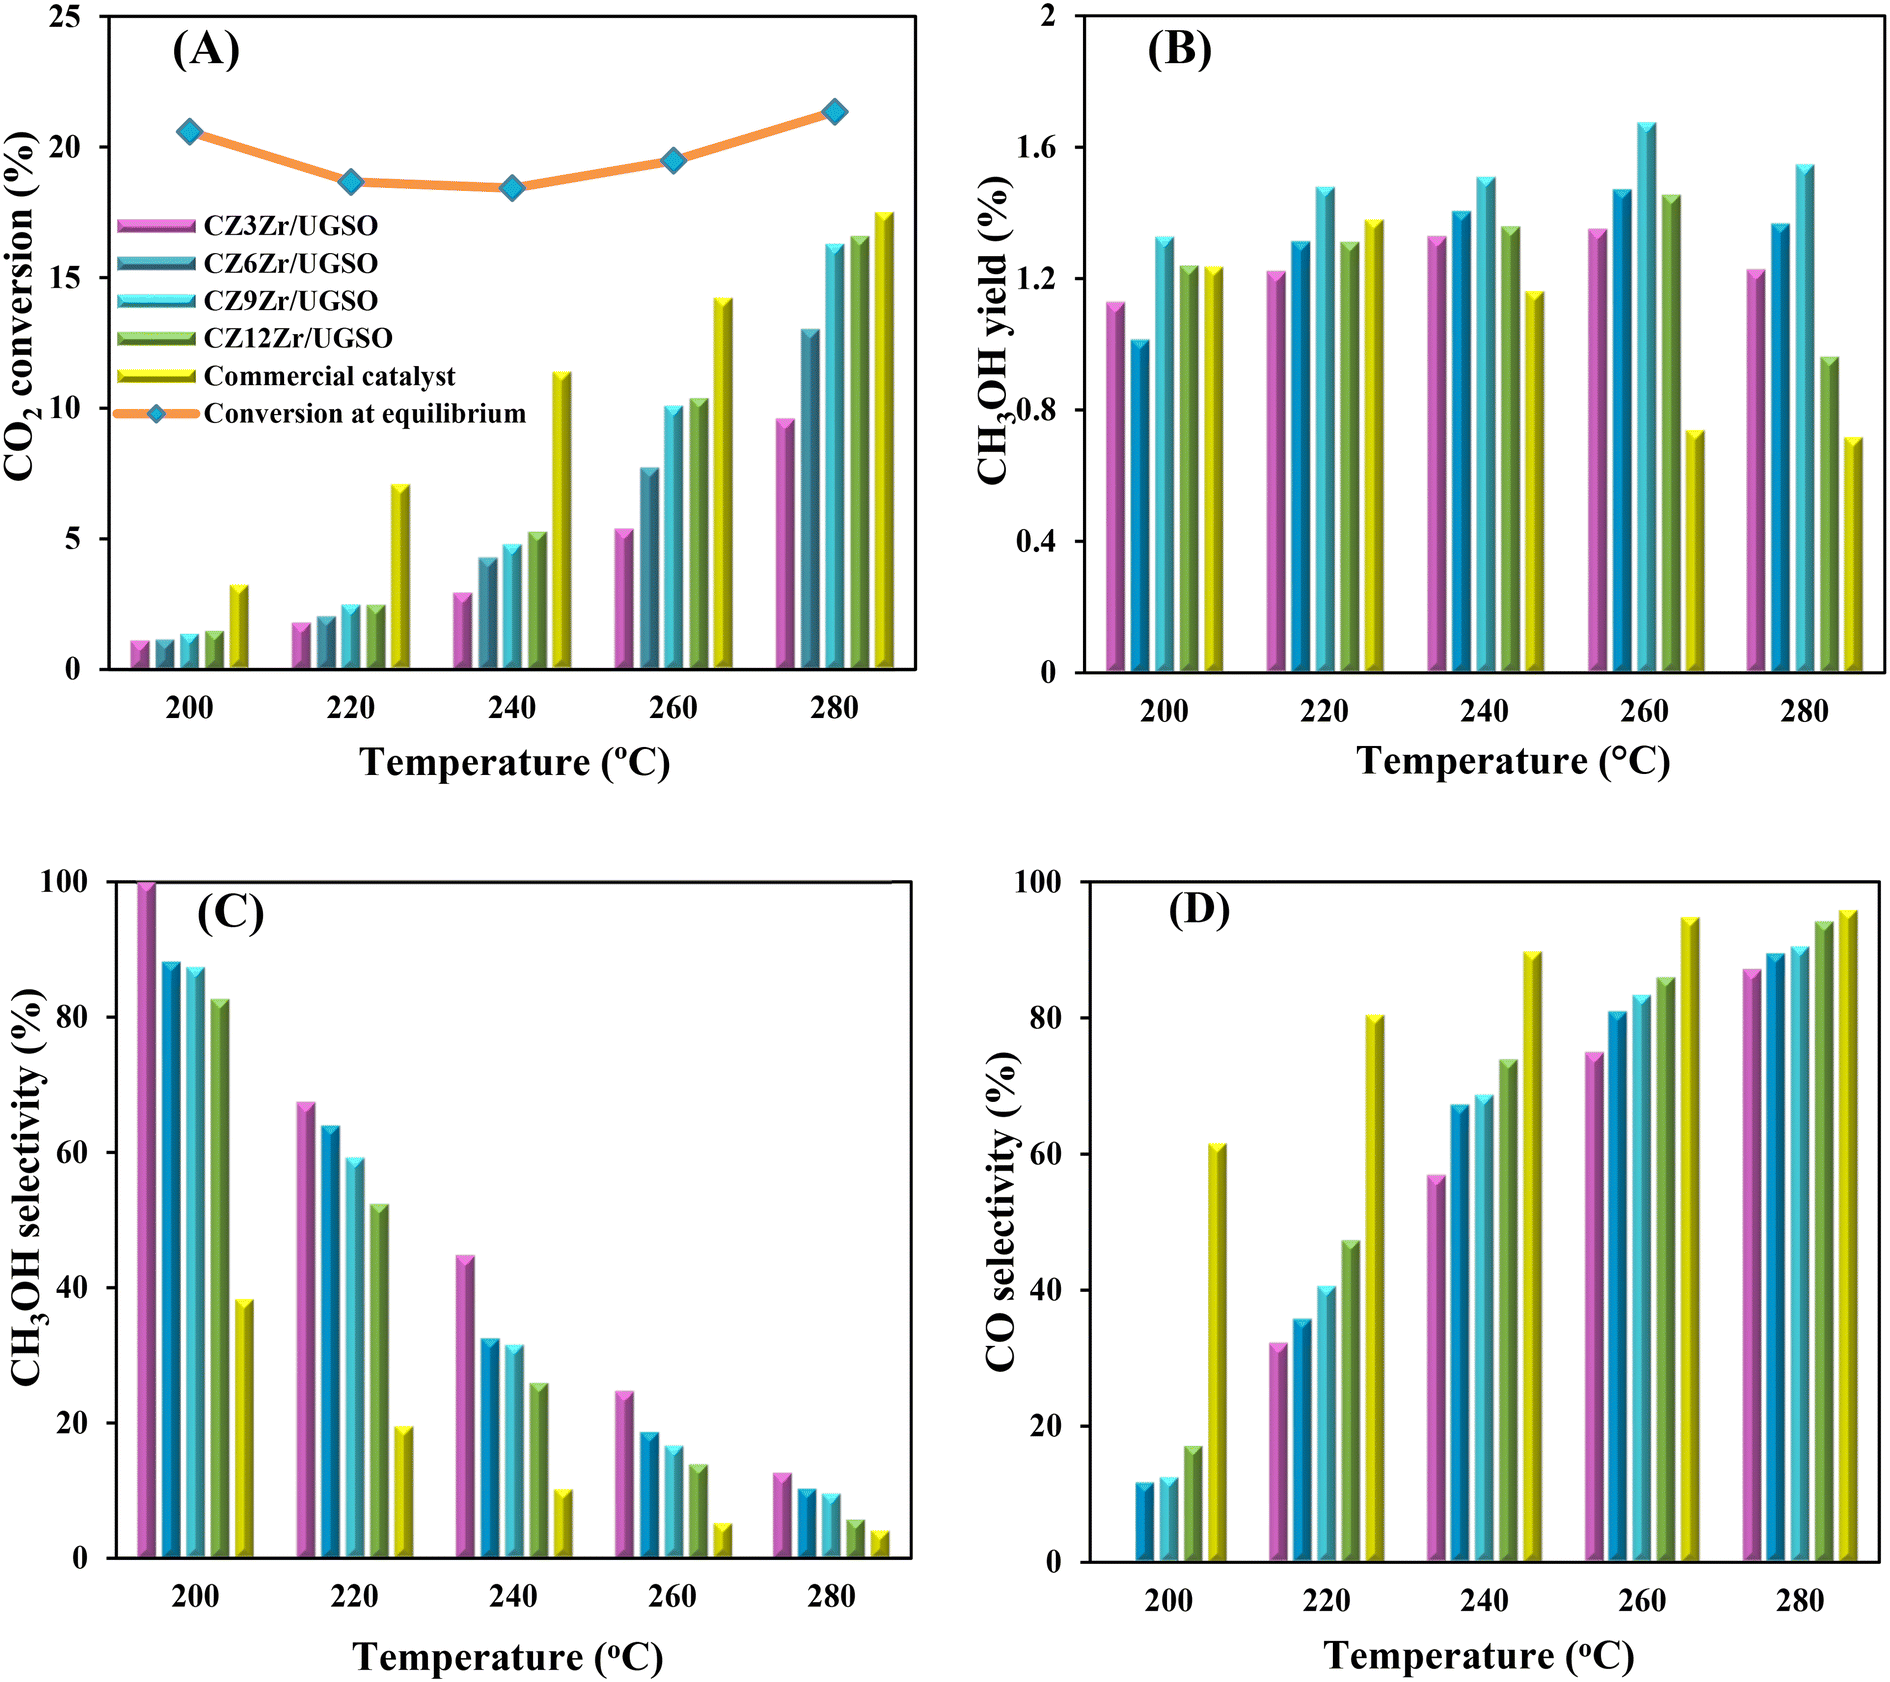 | ||
| Fig. 10 (A) CO2 conversion, (B) CH3OH yield, (C) CH3OH selectivity and (D) CO selectivity as a function of reaction temperatures for CZxZr/UGSO and commercial Cu–ZnO-based methanol synthesis catalyst. Reaction conditions: P = 20 bar, T = 240 °C, H2/CO2 = 3, GHSV = 5000 N mL gcat−1 h−1. | ||
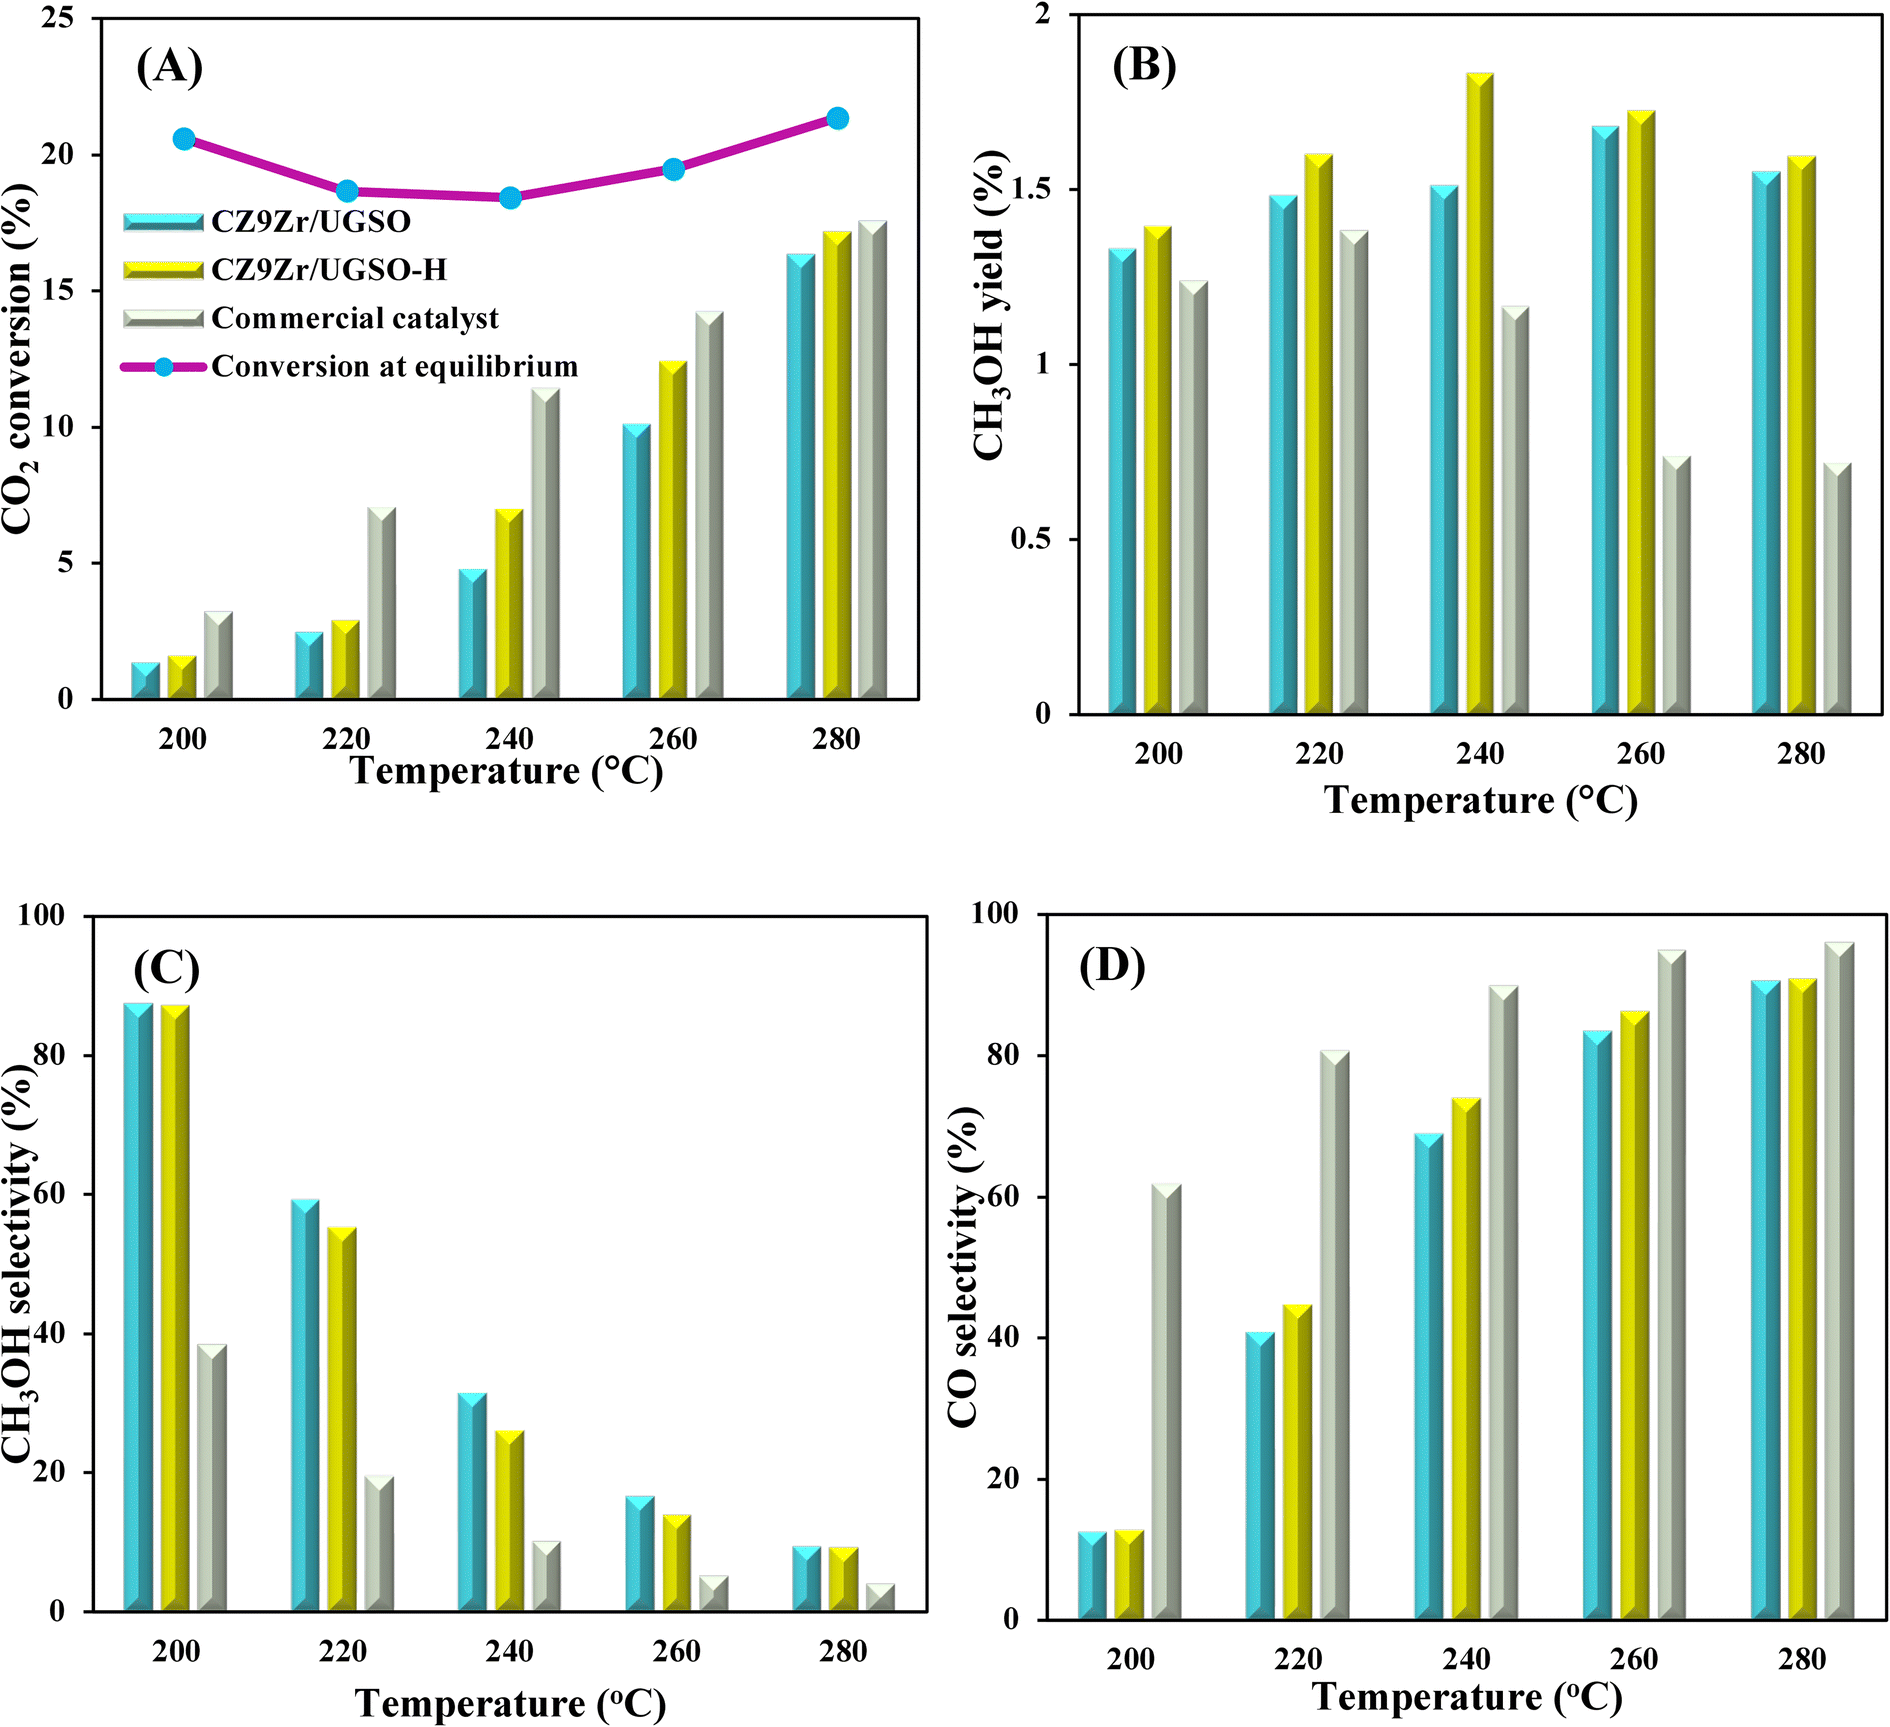 | ||
| Fig. 11 (A) CO2 conversion, (B) CH3OH yield, (C) CH3OH selectivity, and (D) CO selectivity as a function of reaction temperatures for CZ9Zr/UGSO, CZ9Zr/UGSO-H and the commercial Cu–ZnO-based methanol synthesis catalyst. Reaction conditions: P = 20 bar, T = 240 °C, H2/CO2 = 3, GHSV = 5000 N mL gcat−1 h−1. | ||
Stability is a crucial indicator that determines whether the prepared catalyst can be used for the CO2 hydrogenation to methanol process in long term operation. Herein, we tested CZ9Zr/UGSO and CZ9Zr/UGSO-H for a long run (30 h, 20 bar, T = 240 °C) to access the stability of the catalysts. Fig. 12 shows the CO2 conversion and methanol selectivity versus the time-on-stream over the two catalysts. For CZ9Zr/UGSO, the CO2 conversion only slightly decreases from 4.8 to 4.5%, which is 93.7% of the initial value (Fig. 12A), while it is 95.4% of the initial value for CZ9Zr/UGSO-H (Fig. 12B). This observation suggests that the latter is slightly more stable and resistant to catalytic deactivation. It is widely reported that the Cu-based catalysts are commonly deactivated by the agglomeration of Cu particles.3 The higher stability of CZ9Zr/UGSO-H compared to CZ9Zr/UGSO therefore could be attributed to the higher surface area of the UGSO-H support, which facilitates Cu dispersion.
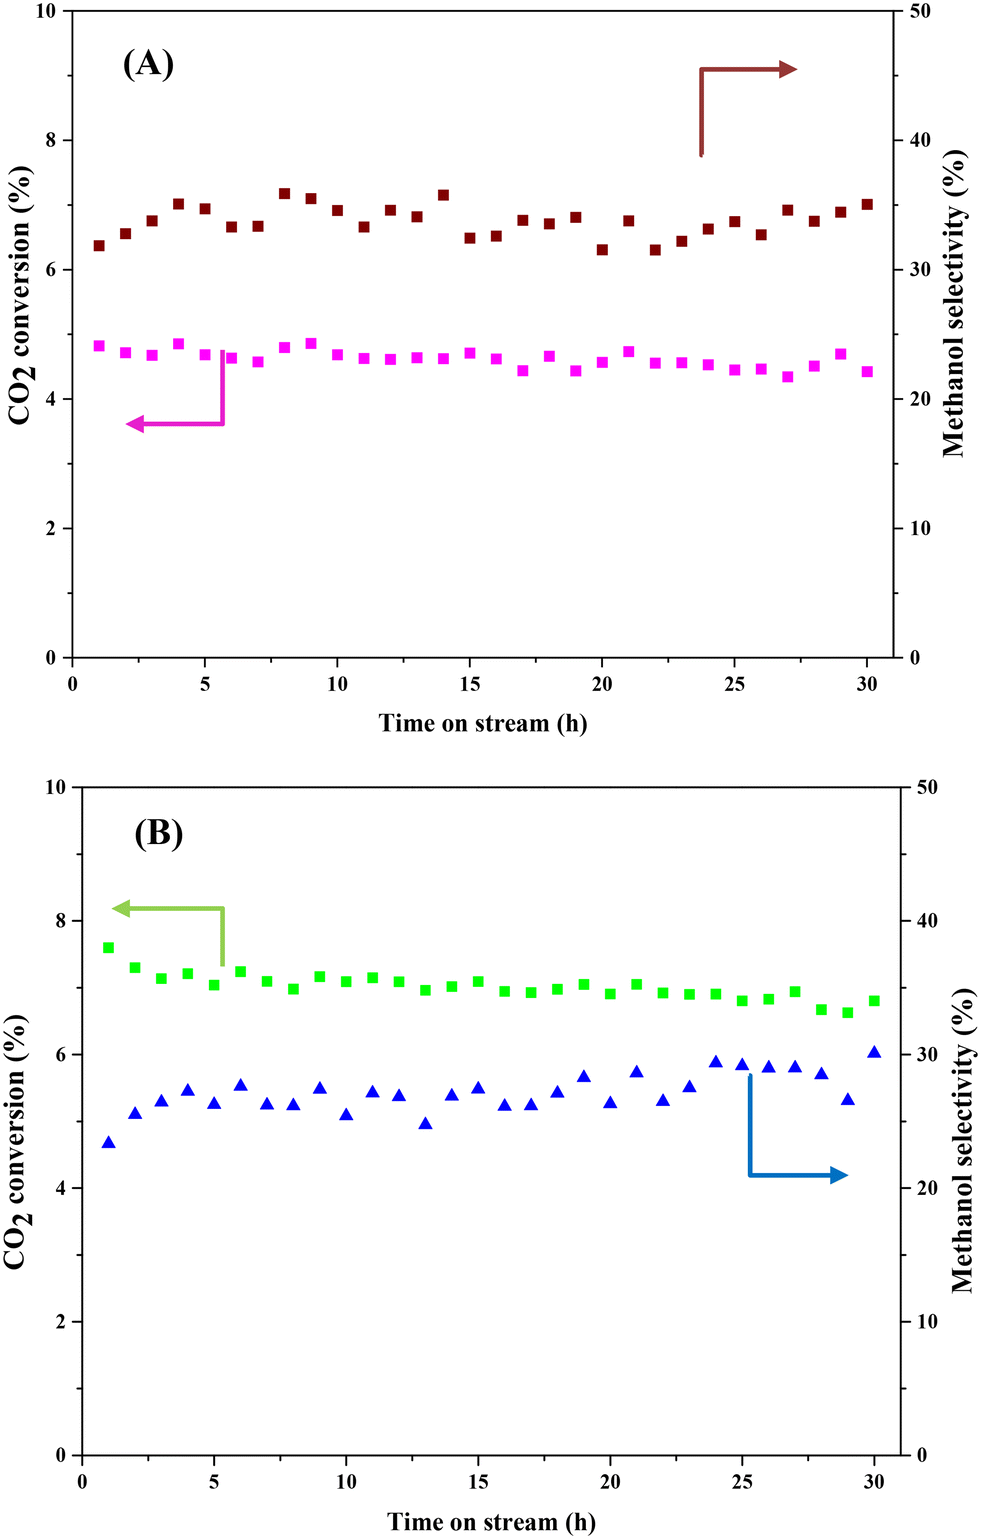 | ||
| Fig. 12 Catalyst activity of CZ9Zr/UGSO (A) and CZ9Zr/UGSO-H (B) with time-on-stream at P = 20 bar, T = 240 °C, H2/CO2 = 3, GHSV = 5000 N mL gcat−1 h−1. | ||
3.4. Structural changes in reduced and used catalysts
Investigation of the microstructure properties of the reduced (ex situ reduced in 50 vol% H2/N2, at 350 °C, for 2 h) and spent catalysts (after 4 h and 30 h on stream) was carried out by TEM analysis and the images are presented in Fig. 13. The bright void spaces between particles are attributed to the interparticle mesopores for both CZ9Zr/UGSO and CZ9Zr/UGSO-H samples, which is proved by N2 physisorption results. It is clearly seen that the morphology of the spent samples (after 4 h and 30 h on stream) is almost the same as the reduced ones. As presented in the particle size histograms, spherical particles with an average of 15.4 nm were formed after reducing CZ9Zr/UGSO, in comparison with the reduced CZ9Zr/UGSO-H, where smaller spherical particles with a particle size of 13.3 nm were created. The smaller particle size of CZ9Zr/UGSO-H compared to that of CZ9Zr/UGSO can be assigned to the higher surface area of the UGSO-H support. After 4 and 30 h in reaction, the average particle size of spent CZ9Zr/UGSO increased to 16.1 nm and 19.1 nm, while an increase to 14.1 nm and 15.8 m is observed for spent CZ9Zr/UGSO-H, respectively. This growth in particle sizes might be attributed to the agglomeration of Cu particles.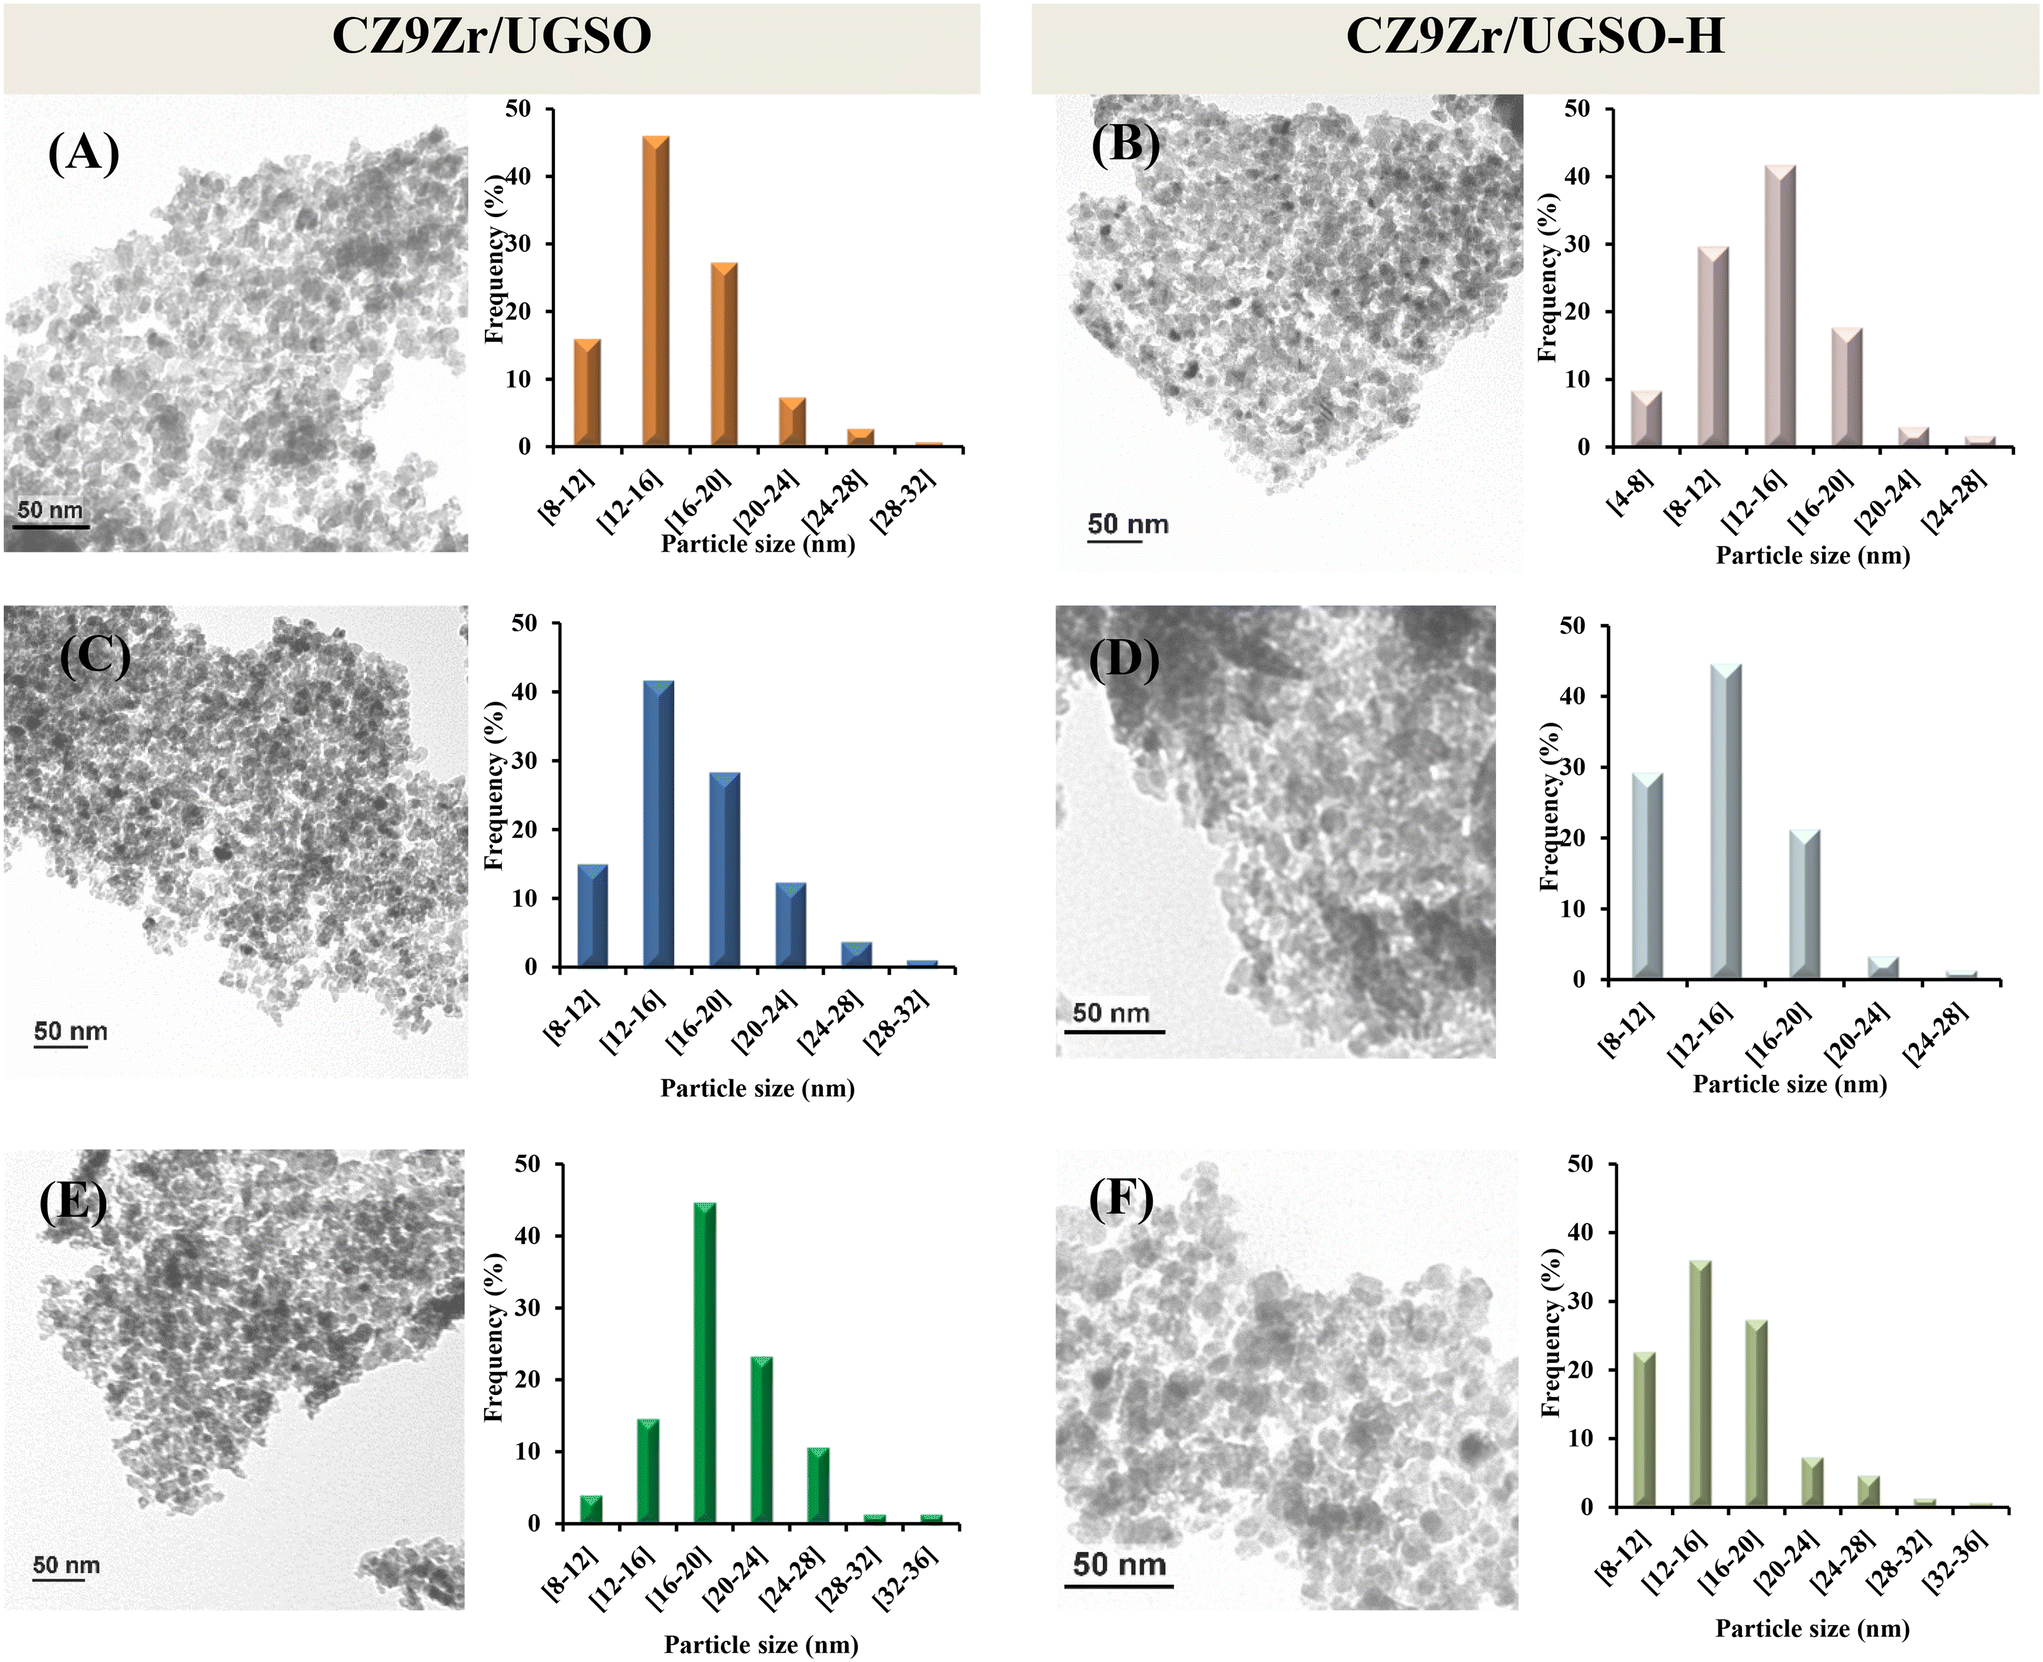 | ||
| Fig. 13 TEM images and particle size distributions of the CZ9Zr/UGSO and CZ9Zr/UGSO-H samples. (A) and (B) reduced, (C) and (D) spent 4 h, and (E) and (F) spent 30 h. | ||
4. Conclusion
Based on the concept of a sustainable development, a series of new Cu–ZnO–ZrO2/UGSO catalysts for CO2 catalytic valorization into methanol were developed using a metallurgical residue (UGSO) as the catalytic support. The study was centered on the understanding of the effect of synergy between Cu/Zn/Zr and UGSO composition on the catalytic activity and stability, as well as the UGSO modification by H2O2 (proposed to increase the surface area of the support) on the structure–activity relationship of the developed catalyst.Concerning the CZxZr/UGSO catalysts, with the increase of Zr content from 3 to 12 wt%, the BET surface area of the CZxZr/UGSO increased significantly, being beneficial to Cu dispersion and the increase of CO2 conversion. Further modification of UGSO by H2O2 (UGSO-H) increases by 3 times the surface area and endows CZ9Zr/UGSO-H with a higher CO2 conversion, attributable to (1) the higher surface area of the UGSO-H support (which resulted in a higher dispersion and reducibility of Cu species), (2) higher ratio of Cuα/(Cuα + Cu2+) (α = 0 or 1+) and Cu metallic area on the surface of reduced CZ9Zr/UGSO-H, and (3) higher concentration of oxygen vacancies and number of strongly basic sites on the surface of reduced CZ9Zr/UGSO-H. The methanol yield, on the other hand, was found to depend on the Mg/Cu ratio and the amount of the dispersed CuO species that strongly interact with ZnO and ZrO2. As a result, CZ9Zr/UGSO-H offered 57% higher methanol yield at 240 °C and 20 bar in comparison with the commercial Cu-ZnO-based methanol synthesis catalyst. In addition, the developed catalyst exhibited good stability during 30 hours of operation (CO2 conversion above 95% of its initial value).
These findings can pave a way for the design and development of efficient catalysts for other CO2 catalytic conversion processes.
Author contributions
Thi Thanh Nguyet Vu: conceptualization, methodology, investigation, visualization, writing – original draft preparation. Alex Desgagnés: investigation, visualization, writing – original draft preparation. Pascal Fongarland: resources, funding acquisition, review. Laurent Vanoye: assistance with laboratory work. Frédéric Bornette: assistance with laboratory work. Maria C. Iliuta: conceptualization, methodology, validation, project administration, resources, writing-review & editing, funding acquisition.Conflicts of interest
There are no conflicts to declare.Acknowledgements
Financial support from the Ministère de l'Europe et des Affaires Étrangères (Campus France program) and the Natural Sciences and Engineering Research Council of Canada (NSERC) is gratefully acknowledged.References
- A. Álvarez, A. Bansode, A. Urakawa, A. V. Bavykina, T. A. Wezendonk, M. Makkee, J. Gascon and F. Kapteijn, Chem. Rev., 2017, 117, 9804–9838 CrossRef.
- G. A. Olah, A. Goeppert and G. S. Prakash, J. Org. Chem., 2009, 74, 487–498 CrossRef.
- T. T. N. Vu, A. Desgagnés and M. C. Iliuta, Appl. Catal., A, 2021, 118119 CrossRef.
- S. Mbatha, R. C. Everson, N. M. Musyoka, H. W. Langmi, A. Lanzini and W. Brilman, Sustainable Energy Fuels, 2021, 5, 3490–3569 RSC.
- J. Niu, H. Liu, Y. Jin, B. Fan, W. Qi and J. Ran, Int. J. Hydrogen Energy, 2022, 47(15), 9183–9200 CrossRef.
- Z. Ou, J. Ran, J. Niu, C. Qin, W. He and L. Yang, Int. J. Hydrogen Energy, 2020, 45, 6328–6340 CrossRef CAS.
- X. Yang, S. Kattel, S. D. Senanayake, J. A. Boscoboinik, X. Nie, J. Graciani, J. A. Rodriguez, P. Liu, D. J. Stacchiola and J. G. Chen, J. Am. Chem. Soc., 2015, 137, 10104–10107 CrossRef CAS PubMed.
- X.-Y. Meng, C. Peng, J. Jia, P. Liu, Y.-L. Men and Y.-X. Pan, J. CO2 Util., 2022, 55, 101844 CrossRef CAS.
- O. Martin, A. J. Martín, C. Mondelli, S. Mitchell, T. F. Segawa, R. Hauert, C. Drouilly, D. Curulla-Ferré and J. Pérez-Ramírez, Angew. Chem., Int. Ed., 2016, 55, 6261–6265 CrossRef CAS PubMed.
- N. Kanoun, M. Astier and G. Pajonk, Catal. Lett., 1992, 15, 231–235 CrossRef CAS.
- R.-w. Liu, Z.-z. Qin, H.-b. Ji and T.-m. Su, Ind. Eng. Chem. Res., 2013, 52, 16648–16655 CrossRef CAS.
- P. Gao, F. Li, H. Zhan, N. Zhao, F. Xiao, W. Wei, L. Zhong, H. Wang and Y. Sun, J. Catal., 2013, 298, 51–60 CrossRef CAS.
- F. Arena, G. Italiano, K. Barbera, S. Bordiga, G. Bonura, L. Spadaro and F. Frusteri, Appl. Catal., A, 2008, 350, 16–23 CrossRef CAS.
- J. Xiao, D. Mao, X. Guo and J. Yu, Appl. Surf. Sci., 2015, 338, 146–153 CrossRef CAS.
- K. Samson, M. Sliwa, R. P. Socha, K. Góra-Marek, D. Mucha, D. Rutkowska-Zbik, J. Paul, M. Ruggiero-Mikołajczyk, R. Grabowski and J. Słoczynski, ACS Catal., 2014, 4, 3730–3741 CrossRef.
- B. Xaba, A. Mahomed and H. Friedrich, J. Environ. Chem. Eng., 2021, 9, 104834 CrossRef.
- V. L'hospital, L. Angelo, Y. Zimmermann, K. Parkhomenko and A.-C. Roger, Catal. Today, 2021, 369, 95–104 CrossRef.
- L. Li, D. Mao, J. Yu and X. Guo, J. Power Sources, 2015, 279, 394–404 CrossRef.
- S. Tada, S. Kayamori, T. Honma, H. Kamei, A. Nariyuki, K. Kon, T. Toyao, K.-i. Shimizu and S. Satokawa, ACS Catal., 2018, 8, 7809–7819 CrossRef.
- K. Stangeland, H. H. Navarro, H. L. Huynh, W. M. Tucho and Z. Yu, Chem. Eng. Sci., 2021, 238, 116603 CrossRef CAS.
- R. M. Palomino, P. J. Ramírez, Z. Liu, R. Hamlyn, I. Waluyo, M. Mahapatra, I. Orozco, A. Hunt, J. P. Simonovis and S. D. Senanayake, J. Phys. Chem. B, 2018, 122, 794–800 CrossRef CAS.
- J. Nakamura, I. Nakamura, T. Uchijima, Y. Kanai, T. Watanabe, M. Saito and T. Fujitani, J. Catal., 1996, 160, 65–75 CrossRef CAS.
- C. Tisseraud, C. Comminges, T. Belin, H. Ahouari, A. Soualah, Y. Pouilloux and A. Le Valant, J. Catal., 2015, 330, 533–544 CrossRef CAS.
- K. Larmier, W. C. Liao, S. Tada, E. Lam, R. Verel, A. Bansode, A. Urakawa, A. Comas-Vives and C. Copéret, Angew. Chem., Int. Ed., 2017, 56, 2318–2323 CrossRef CAS.
- J. A. Bennett, K. Wilson and A. F. Lee, J. Mater. Chem. A, 2016, 4, 3617–3637 RSC.
- R. Chakraborty, S. Bepari and A. Banerjee, Chem. Eng. J., 2010, 165, 798–805 CrossRef CAS.
- K. Wilson, C. Hardacre, A. F. Lee, J. M. Montero and L. Shellard, Green Chem., 2008, 10, 654–659 RSC.
- M. Balakrishnan, V. Batra, J. Hargreaves, A. Monaghan, I. Pulford, J. Rico and S. Sushil, Green Chem., 2009, 11, 42–47 RSC.
- L. Deng, Q. Su, Q. Ye, H. Wan, Y. He and X. Cui, Sustainable Energy Fuels, 2022, 6, 1436–1447 RSC.
- M. Guéguin and F. Cardarelli, Miner. Process. Extr. Metall. Rev., 2007, 28, 1–58 CrossRef.
- O. A. Z. Sahraei, F. Larachi, N. Abatzoglou and M. C. Iliuta, Appl. Catal., B, 2017, 219, 183–193 CrossRef.
- M. Aissaoui, O. A. Z. Sahraei, M. S. Yancheshmeh and M. C. Iliuta, Int. J. Hydrogen Energy, 2020, 45, 18452–18465 CrossRef CAS.
- O. A. Sahraei, A. Desgagnés, F. Larachi and M. C. Iliuta, Appl. Catal., B, 2020, 279, 119330 CrossRef.
- C. Zhong, X. Guo, D. Mao, S. Wang, G. Wu and G. Lu, RSC Adv., 2015, 5, 52958–52965 RSC.
- C. Liu, X. Guo, Q. Guo, D. Mao, J. Yu and G. Lu, J. Mol. Catal. A: Chem., 2016, 425, 86–93 CrossRef CAS.
- A. Jain, R. Balasubramanian and M. Srinivasan, Chem. Eng. J., 2015, 273, 622–629 CrossRef.
- K. Sonu, M. Sogani, Z. Syed, A. Dongre and G. Sharma, Environ. Prog. Sustainable Energy, 2021, ep13638 Search PubMed.
- Z. Tan, X. Zhang, L. Wang, B. Gao, J. Luo, R. Fang, W. Zou and N. Meng, Environ. Pollut. Bioavailability, 2019, 31, 198–207 CrossRef.
- C. Moreno-Castilla, M. Ferro-Garcia, J. Joly, I. Bautista-Toledo, F. Carrasco-Marin and J. Rivera-Utrilla, Langmuir, 1995, 11, 4386–4392 CrossRef.
- X. Dong, F. Li, N. Zhao, F. Xiao, J. Wang and Y. Tan, Appl. Catal., B, 2016, 191, 8–17 CrossRef.
- H. S. Fogler, Elements of Chemical Reaction Engineering, Prentice Hall, 5th edn, 2016 Search PubMed.
- X. Lin, R. Li, Y. Zhang, Y. Zhan, C. Chen, Q. Zheng and J. Ma, Int. J. Hydrogen Energy, 2015, 40, 1735–1741 CrossRef CAS.
- Y. H. Choi, E. C. Ra, E. H. Kim, K. Y. Kim, Y. J. Jang, K. N. Kang, S. H. Choi, J. H. Jang and J. S. Lee, ChemSusChem, 2017, 10, 4764–4770 CrossRef CAS.
- D. S. Mathew and R.-S. Juang, Chem. Eng. J., 2007, 129, 51–65 CrossRef CAS.
- R. Dhanda and M. Kidwai, RSC Adv., 2016, 6, 53430–53437 RSC.
- K. S. Sing, Pure Appl. Chem., 1985, 57, 603–619 CrossRef CAS.
- X. Mou, Y. Li, B. Zhang, L. Yao, X. Wei, D. S. Su and W. Shen, Eur. J. Inorg. Chem., 2012, 2012, 2684–2690 CrossRef CAS.
- M. Zhu, P. Tian, J. Chen, M. E. Ford, J. Xu, I. E. Wachs and Y. F. Han, AIChE J., 2020, 66, e16846 CAS.
- W. Wang, Y. Xie, S. Zhang, X. Liu, M. Haruta and J. Huang, Catalysts, 2018, 8, 60 CrossRef.
- R.-x. Zhou, T.-m. Yu, X.-y. Jiang, F. Chen and X.-m. Zheng, Appl. Surf. Sci., 1999, 148, 263–270 CrossRef CAS.
- S.-C. Yang, W.-N. Su, S. D. Lin, J. Rick, J.-H. Cheng, J.-Y. Liu, C.-J. Pan, D.-G. Liu, J.-F. Lee and T.-S. Chan, Appl. Catal., B, 2011, 106, 650–656 CrossRef CAS.
- X. Guo, D. Mao, G. Lu, S. Wang and G. Wu, J. Catal., 2010, 271, 178–185 CrossRef CAS.
- P. Gao, F. Li, F. Xiao, N. Zhao, N. Sun, W. Wei, L. Zhong and Y. Sun, Catal. Sci. Technol., 2012, 2, 1447–1454 RSC.
- M. Zhu, J. Chen, L. Shen, M. E. Ford, J. Gao, J. Xu, I. E. Wachs and Y.-F. Han, Appl. Catal., B, 2020, 271, 118943 CrossRef.
- N. Huo, Y. Yin, W. Liu, J. Zhang, Y. Ding, Q. Wang, Z. Shi and S. Yang, New J. Chem., 2016, 40, 7068–7074 RSC.
- B. Zheng, S. Wu, X. Yang, M. Jia, W. Zhang and G. Liu, ACS Appl. Mater. Interfaces, 2016, 8, 26683–26689 CrossRef.
- H. Guo, Q. Li, H. Zhang, F. Peng, L. Xiong, S. Yao, C. Huang and X. Chen, Mol. Catal., 2019, 476, 110499 CrossRef.
- A. S. Malik, S. F. Zaman, A. A. Al-Zahrani, M. A. Daous, H. Driss and L. A. Petrov, Catal. Today, 2020, 357, 573–582 CrossRef CAS.
- F. Cocco, B. Elsener, M. Fantauzzi, D. Atzei and A. Rossi, RSC Adv., 2016, 6, 31277–31289 RSC.
- Q. Zhang, H. Wang, P. Ning, Z. Song, X. Liu and Y. Duan, Appl. Surf. Sci., 2017, 419, 733–743 CrossRef CAS.
- T. Liu, X. Hong and G. Liu, ACS Catal., 2019, 10, 93–102 CrossRef.
- R. Ladera, F. J. Pérez-Alonso, J. M. González-Carballo, M. Ojeda, S. Rojas and J. L. G. Fierro, Appl. Catal., B, 2013, 142, 241–248 CrossRef.
- C. Huang, J. Wen, Y. Sun, M. Zhang, Y. Bao, Y. Zhang, L. Liang, M. Fu, J. Wu and D. Ye, Chem. Eng. J., 2019, 374, 221–230 CrossRef CAS.
- C. M. Lousada and M. Jonsson, J. Phys. Chem. C, 2010, 114, 11202–11208 CrossRef CAS.
- E. Giamello, P. Rumori, F. Geobaldo, B. Fubini and M. C. Paganini, Appl. Magn. Reson., 1996, 10, 173–192 CrossRef CAS.
- A. Amorelli, J. C. Evans and C. C. Rowlands, J. Chem. Soc., Faraday Trans. 1, 1988, 84, 1723–1728 RSC.
- Y. Cao, L.-J. Wang, C. Feng, J.-Y. Zhang, F. Yang, S.-W. Li, S.-L. Jiang, Y. Liu, G. Yang and C.-J. Zhao, Mater. Lett., 2014, 137, 351–353 CrossRef CAS.
- B. Taleatu, E. Omotoso, C. Lal, W. Makinde, K. Ogundele, E. Ajenifuja, A. Lasisi, M. Eleruja and G. Mola, Surf. Interface Anal., 2014, 46, 372–377 CrossRef.
- M. Zhu, P. Tian, M. E. Ford, J. Chen, J. Xu, Y.-F. Han and I. E. Wachs, ACS Catal., 2020, 10, 7857–7863 CrossRef.
- S. Chawla, N. Sankarraman and J. Payer, J. Electron Spectrosc. Relat. Phenom., 1992, 61, 1–18 CrossRef.
- J. Yu, M. Yang, J. Zhang, Q. Ge, A. Zimina, T. Pruessmann, L. Zheng, J.-D. Grunwaldt and J. Sun, ACS Catal., 2020, 10, 14694–14706 CrossRef.
- M. Huš, D. Kopač, N. S. Štefančič, D. L. Jurković, V. D. Dasireddy and B. Likozar, Catal. Sci. Technol., 2017, 7, 5900–5913 RSC.
- X.-M. Liu, G. Lu, Z.-F. Yan and J. Beltramini, Ind. Eng. Chem. Res., 2003, 42, 6518–6530 CrossRef CAS.
- S. Chen, J. Zhang, P. Wang, X. Wang, F. Song, Y. Bai, M. Zhang, Y. Wu, H. Xie and Y. Tan, ChemCatChem, 2019, 11, 1448–1457 CrossRef CAS.
- A. M. Bahmanpour, F. Héroguel, M. Kılıç, C. J. Baranowski, P. Schouwink, U. Röthlisberger, J. S. Luterbacher and O. Kröcher, Appl. Catal., B, 2020, 266, 118669 CrossRef CAS.
- E. L. Kunkes, F. Studt, F. Abild-Pedersen, R. Schlögl and M. Behrens, J. Catal., 2015, 328, 43–48 CrossRef CAS.
- Q. Jiang, Y. Liu, T. Dintzer, J. Luo, K. Parkhomenko and A.-C. Roger, Appl. Catal., B, 2020, 269, 118804 CrossRef.
- L. Gao and C. Au, J. Catal., 2000, 189, 1–15 CrossRef CAS.
- M. Huš, V. D. Dasireddy, N. S. Štefančič and B. Likozar, Appl. Catal., B, 2017, 207, 267–278 CrossRef.
- L. Yao, X. Shen, Y. Pan and Z. Peng, J. Catal., 2019, 372, 74–85 CrossRef CAS.
- S. Tada, K. Larmier, R. Büchel and C. Copéret, Catal. Sci. Technol., 2018, 8, 2056–2060 RSC.
- D. L. Chiavassa, J. Barrandeguy, A. L. Bonivardi and M. A. Baltanás, Catal. Today, 2008, 133, 780–786 CrossRef.
- N. Koizumi, X. Jiang, J. Kugai and C. Song, Catal. Today, 2012, 194, 16–24 CrossRef.
Footnote |
| † Electronic supplementary information (ESI) available. See DOI: https://doi.org/10.1039/d2cy01317g |
| This journal is © The Royal Society of Chemistry 2023 |