 Open Access Article
Creative Commons Attribution 3.0 Unported Licence
Photoinduced electron transfer (PeT) based fluorescent probes for cellular imaging and disease therapy†
Huiyu
Niu
a,
Junwei
Liu
a,
Helen M.
O’Connor
 b,
Thorfinnur
Gunnlaugsson
 *b,
Tony D.
James
 *ac and
Hua
Zhang
 *a
*a
aKey Laboratory of Green Chemical Media and Reactions, Ministry of Education, Henan Key Laboratory of Organic Functional Molecule and Drug Innovation, School of Chemistry and Chemical Engineering, Henan Normal University, Xinxiang, 453007, P. R. China. E-mail: zhanghua1106@163.com
bSchool of Chemistry, Trinity Biomedical Sciences Institute (TBSI), Trinity College Dublin, The University of Dublin, 152-160 Pearse Street, Dublin 2, Ireland. E-mail: gunnlaut@tcd.ie
cDepartment of Chemistry, University of Bath, Bath, BA2 7AY, UK. E-mail: t.d.james@bath.ac.uk
First published on 22nd February 2023
Abstract
Typical PeT-based fluorescent probes are multi-component systems where a fluorophore is connected to a recognition/activating group by an unconjugated linker. PeT-based fluorescent probes are powerful tools for cell imaging and disease diagnosis due to their low fluorescence background and significant fluorescence enhancement towards the target. This review provides research progress towards PeT-based fluorescent probes that target cell polarity, pH and biological species (reactive oxygen species, biothiols, biomacromolecules, etc.) over the last five years. In particular, we emphasise the molecular design strategies, mechanisms, and application of these probes. As such, this review aims to provide guidance and to enable researchers to develop new and improved PeT-based fluorescent probes, as well as promoting the use of PeT-based systems for sensing, imaging, and disease therapy.
1. Introduction
Photoinduced electron transfer (PeT), a classical electron transfer process, is commonly used in the construction of fluorescent probes. In 1985, the first PeT based fluorescent sensor was developed by de Silva et al.1 Subsequently, de Silva generalised PeT in the development of fluorescent sensors and molecular logic gate-based systems.2 After nearly 40 years of development, PeT-based fluorescent probes have attracted significant interest by chemical, biological and medical researchers due to their high signal-to-noise ratios. For clarity, we have categorised the systems discussed in this review as probes to reflect their use as tools for imaging. Moreover, the term sensor is synonymous with reversible recognition-based interactions, yet many probes discussed in this review rely on reaction-based mechanisms (activity-based sensors).3 Additionally, we have abbreviated photoinduced electron transfer as PeT since this distinguishes it from positron emission tomography (PET)4 and PeT was the preferred abbreviation used by Roger Tsien. In the beginning of PeT, this ambiguity was not a problem since the term was used to describe molecules used as sensors (chemosensors), however, these molecules are now commonly used for the fluorescence imaging of biological systems, hence the need to clearly indicate the difference.A typical PeT-based fluorescent probe consists of three important elements: fluorophores, appropriate linkers, and recognition/activating groups.5 There are, however, other key factors that must be considered in the design of PeT probes: (1) the Gibbs free energy which is governed by the Rehm–Weller equation, is also distance dependent, and can be influenced by local environmental features, e.g., structures that possess internal charge transfer (ICT) excited states. (2) PeT is also directional, as seen in natural systems (e.g. the photosynthetic reaction centre) and is particularly directional when ICT-based fluorophores are employed.
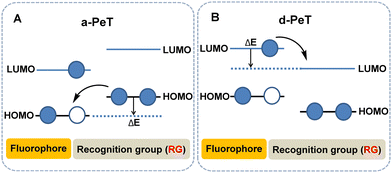
In order to better understand the structure–property relationship that governs this phenomenon, significant effort has been devoted in the development of large ranges of structurally varied compounds. Resulting from these studies, PeT can be sub-divided into two types based on the direction of electron transfer between the fluorophore and the recognition element, namely acceptor-excited PeT (a-PeT, Fig. 1A) and donor-excited PeT (d-PeT, Fig. 1B).2b
For a-PeT, the electron transfer occurs from the recognition/activating group to the fluorophore, since the highest occupied molecular orbital (HOMO) energy level of the recognition/activating group lies between the HOMO and lowest unoccupied molecular orbital (LUMO) levels of the fluorophore (for convenience we will refer to these as the “empty” HOMO and LUMO rather than the singly occupied molecular orbital (SOMO) in the discussion below). As a result of this, the electron in the HOMO of the recognition/activating group can be transferred to the “empty” HOMO of the excited state fluorophore. Thereafter, the electron in the LUMO of the fluorophore cannot return to its ground state which results in fluorescence quenching (Fig. 1A).
Conversely, for d-PeT, the recognition/activating group is in an electronic-deficient state and its LUMO lies between the HOMO and LUMO energy levels of the fluorophore, meaning that the electron is transferred from the fluorophore to the recognition/activating group. In other words, after the fluorophore is excited, an electron from its HOMO is transferred to its LUMO, and then immediately passes through a non-radiative transition into the vacant LUMO of the recognition/activating group, leading to fluorescence quenching (Fig. 1B). Irrespective of the type of electron transfer during the PeT process, it is important to note that fluorescence quenching occurs.
PeT is a particularly important design strategy for the development of “off–on” or “on–off” fluorescent probes.6–9 During the recognition process, the recognition/activating group binds to a target analyte and either PeT is restricted and the fluorescence is turned on (“off–on”), or PeT is activated and the fluorescence is turned off (“on–off”). Furthermore, the occurrence of PeT is closely associated with the chemical properties of the target analyte because the target analyte is responsible for the variation of the HOMO–LUMO energy levels of the recognition/activating group.10
The oxidation/reduction potential can express the ability to gain and lose electrons. PeT occurs because there is electron transfer between the fluorophore and recognition/activating group. Therefore, the design of PeT-based fluorescent probes can usually be divided into four types according to the changes in oxidation/reduction potential of the recognition/activating unit during the recognition process (Fig. 2). (1) The oxidation potential of the recognition/activating group increases after recognition and is unable to act as an effective electron donor, resulting in a situation where a-PeT is prohibited after binding with the target (Fig. 2A).11 (2) A decrease of the oxidation potential for the recognition/activating group makes it incapable of accepting electrons efficiently, resulting in a situation where d-PeT is forbidden (Fig. 2B).12 (3) The recognition/activating group can be cleaved by an analyte, resulting in a situation where a-PeT can no longer occur (Fig. 2C).13 (4) The recognition/activating group can be cleaved by an analyte, resulting in a situation where d-PeT can no longer occur (Fig. 2D).14 In all four cases, the fluorophore can be linked to more electron-deficient or electron-rich groups, acting as an electron donor or acceptor, and allowing both d-PeT or a-PeT processes to occur, respectively. As a result of this, the same fluorophore can be used for both “off–on” and “on–off” detection, meaning a finite supply of fluorophores can be used for the development of a large range of PeT-based probes.10
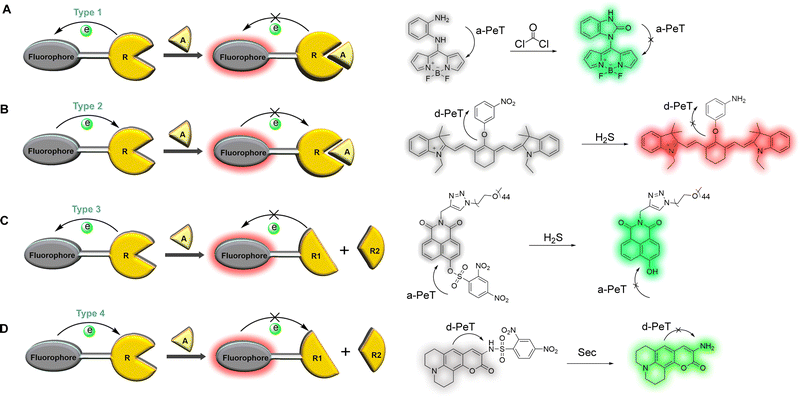 | ||
| Fig. 2 The four design types of PeT-based fluorescent probes: (A) Type 1, after binding to the target, the oxidation potential of the recognition/activating group increases and a-PeT is prohibited;11 (B) Type 2, after binding to the target, the oxidation potential of the recognition/activating group decreases and d-PeT is prohibited;12 (C) Type 3, the recognition/activating group can be cleaved and a-PeT is prohibited;13 (D) Type 4, the recognition/activating group can be cleaved and d-PeT is prohibited.14 R: Recognition group; A: Analyte. | ||
In recent years, PeT-based fluorescent probes formed from the above design strategies have been widely applied for the detection and imaging of intracellular processes. Amongst others, this includes the understanding of the cell microenvironment, reactive bioactive small molecules (reactive oxygen species, gaseous small molecules and biothiols), and reactive biological macromolecules.15–23 More recently, this understanding has led to their use in the diagnosis and treatment of diseases, especially cancer.
In this review, we will focus on the role of the PeT mechanism for the development of fluorescent probes with applications in recognition-detection, microscopic imaging, and disease therapy. We will also provide personal perspectives on the opportunities for the advancement of PeT-based systems and their improved practical translation into the clinic. Finally, we will outline some key challenges that need to be overcome for the continued and improved development of PeT-based systems.
2. PeT-based fluorescent probes for the cellular microenvironment
An organism exists in a balanced and complex state, and every aspect of the microenvironment is strictly regulated. An imbalance of the cell microenvironment (i.e. polarity, pH, ion-flux, etc.), which refers to the pathophysiological microenvironments, can cause cell dysfunction and induce the development of various diseases.24–27 One of the difficulties in treating most clinical diseases is that they cannot be diagnosed in a timely manner, resulting from the fact that many clinical symptoms do not appear until the middle and/or late stages of the disease. Cell microenvironments, however, begin to change at the early stage of disease development and continue to change during disease progression. Therefore, the real-time detection, preferably using non-invasive approaches, of the pathophysiological microenvironment provides valuable information for the early diagnosis, monitoring, and prognosis of pathophysiological processes such as inflammation, neurodegenerative diseases, and cancer.27 In recent years, a large number of PeT-based fluorescent probes have been reported for the detection of microenvironmental changes in living cells, including polarity changes and pH imbalance.19,20,28–31 Herein, we provide an insight into the latest advances for the diagnosis of cellular microenvironment related diseases using PeT-based fluorescent probes to target cellular polarity and pH.2.1 PeT-based fluorescent probes for cellular polarity
Polarity is both important and complex at the cellular level,32 involving a series of non-covalent interactions which includes polarisability, hydrophobic interactions, and hydrogen bonding. Indeed, it has been shown to be required in a large number of physiological processes, such as membrane fusion and enzyme allosteric regulation.27,33,34 Additionally, abnormal changes in polarity within different subcellular compartments is associated with the development of many diseases such as neurodegenerative diseases and cancer, to name just a few.35 Therefore, the measurement of cellular polarity holds great promise for the diagnosis and tracking of such disease progression.Fluorescent probes that are sensitive to polarity provide a unique opportunity for the non-invasive, in situ determination of the cellular polarity in biological systems.36 Peng and co-workers have developed a series of “off–on” polarity-responsive fluorescent probes (probes 1–4, Fig. 3A).27 The fluorophore of probes 1–4 is based on boron-dipyrromethene (BODIPY), wherein the BODIPY-derived moiety is connected to a quaternary ammonium salt via an alkyl-spacer of varying length. In these systems, the “off–on” mechanism arises from the relationship between the redox potential of the quaternary ammonium salts and the solvent polarity. In non-polar media, the quaternary ammonium ion has a low negative reduction potential meaning reduction is favourable. As a result, it can act as an effective electron acceptor for the BODIPY-based fluorophore, quenching its fluorescence through a d-PeT process. Upon an increase in solvent polarity, the charge–dipole interaction between the ammonium ion and the polar solvent molecules causes a decrease in the reduction potential of the ammonium ion. This reduces the ability of the ammonium ion to accept electrons, blocking the d-PeT process and allowing for an increase in fluorescence. Further verification of this process was also provided through electrochemical and theoretical studies (Fig. 3C).
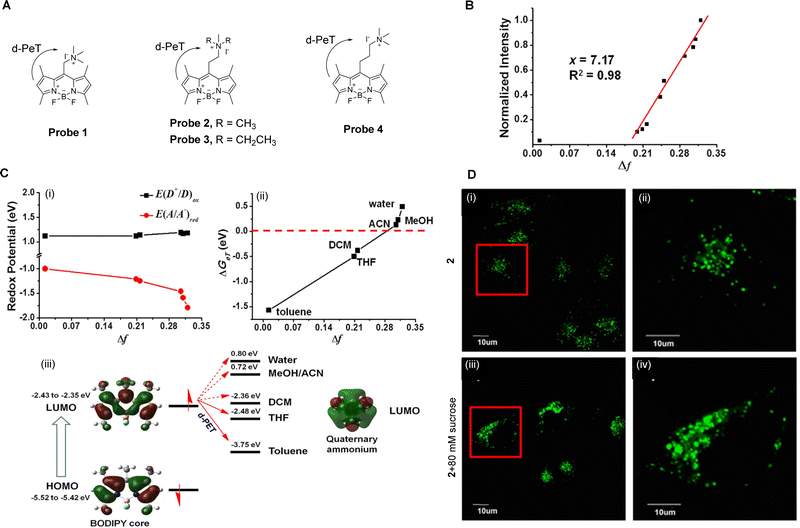 | ||
| Fig. 3 (A) The chemical structure of probes 1–4. (B) Normalized fluorescence intensities of probe 2 as a function of the solvent orientational polarity parameter Δf. (C) Electrochemical and theoretical studies of (i) E(D+/D)ox and E(A/A−)red against solvent polarity; (ii) changes in ΔGeT as a function of Δf; (iii) frontier orbital energy representation of the d-PeT process in probe 2 in different solvents. (D) Fluorescence confocal images of MCF-7 cells stained with probe 2 (5 μM) (i and ii) before and (iii and iv) after the addition of sucrose (80 mM) and (ii and iv) enlarged images of representative cells (red squares) in (i and iii). Reproduced from ref. 28 with permission from Springer Nature, copyright 2016. | ||
Peng and co-workers have also investigated the effects of varying the spacer lengths and quaternary ammonium substituents on the ability of probes 1–4 to detect changes in polarity. They discovered that an ethyl-spacer was the best for electron transfer, and that the small size of the trimethylammonium ion facilitates a better interaction with polar molecules. Thus, among the developed probes, probe 2 exhibits the best polarity sensing ability, providing a linear response (Fig. 3B) and high sensitivity and specificity. It is also worth noting that probe 2 was further investigated for the monitoring of local hydrophilicity under lysosome dysfunction (Fig. 3D).
2.2 PeT-based fluorescent probes for cellular pH
pH homeostasis plays an important role in the regulation of various biological processes such as cell metabolism, tissue regeneration, and ion transport.37 Abnormal changes in intracellular pH can lead to a disruption in pH homeostasis, resulting in free radical production, membrane shrinkage, improper apoptosis, and necrosis, amongst other effects. In turn, these changes can aid in the development of cystic fibrosis, strokes, Parkinson's disease, Alzheimer's disease, and cancer.38–40 Monitoring pH changes in living cells is of great significance for the in-depth understanding of cellular events and hence, in the diagnosis of related diseases. The ability, therefore, to monitor and visualise the modulation of pH in real-time using non-invasive fluorescence probes is an urgent requirement.41 Over the past few years, a large number of pH-activated PeT-based probes have been used for the diagnosis and therapy of related diseases.As discussed in the introduction, the occurrence of PeT is closely associated with the variation of the HOMO and LUMO energy levels of the fluorophore and the recognition/activating group, which was established by de Silva and co-workers for the first (named) example of a PeT sensor, using pH modulation.1 The ability to exploit the relative electron density differences between the fluorophore and the recognition/activating group is an important strategy in the design of PeT probes. Ge, Sun and co-workers have developed a series of “off–on” and “on–off” pH fluorescent probes utilising the relative electron density differences between pyronines and various nitrogen-based heterocycles (Fig. 4A).10 For example, when the pyronine moiety is attached to the electron-rich indolyl-based group (probe 5a in Fig. 4A), the a-PeT process is activated, resulting in a quenching of the fluorescence. However, when the indolyl-based group is protonated and becomes an electron-deficient indolium ion, the oxidation potential is increased and PeT is disabled, resulting in an enhancement in fluorescence. That is, as the pH decreases, the fluorescence of probe 5a exhibits an “off–on” response (pKa = 1.41) and the relative fluorescence intensity increases 15-fold (Fig. 4B).
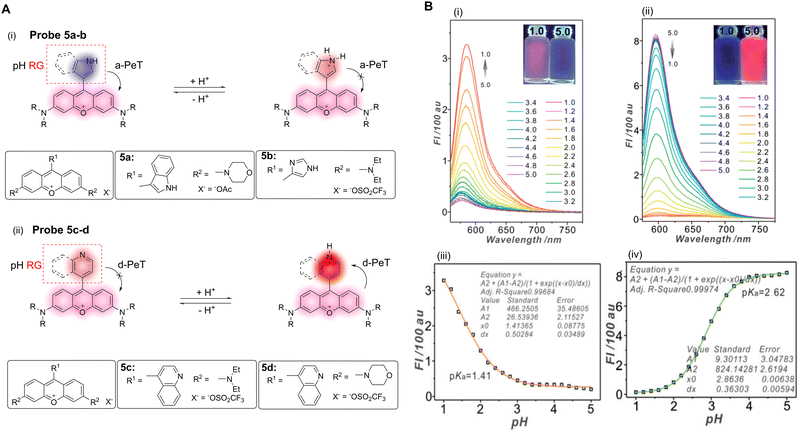 | ||
| Fig. 4 (A) The mechanism and structures of of a-PeT or d-PeT pyronine-based probes 5a–d. (B) Fluorescence spectra and fluorescence intensities of (i and iii) probe 5a and (ii and iv) probe 5d towards varying pH. (RG = Recognition Group) Reproduced from ref. 10 with permission from the Royal Society of Chemistry, copyright 2017. | ||
In contrast to probe 5a, probe 5b contains an imidazole-pyronine skeleton and does not exhibit a typical PeT fluorescence response as a function of pH. This indicates that the reduced electron density of the imidazole group compared with the indolyl-group causes it to be unable to promote electron transfer, and as such, a-PeT does not occur. When the pyronine moiety is connected to an electron-deficient quinolinyl-group (probes 5c–d), a-PeT is prohibited. However, when the heterocyclic ring is protonated to the more electron-deficient quinolinium ion upon decreasing the pH, d-PeT is allowed (probes 5c–d in Fig. 4A). This is shown in Fig. 4B(ii and iv), whereby there is a 46-fold decrease in the relative fluorescence intensity of probe 5d upon a decrease in pH over a range of 5.0–1.0. In addition to this photophysical study, the potential biomedical application of probes 5a–d was further evaluated using confocal fluorescence imaging. These studies show that probe 5d exhibits an excellent lysosome targeting ability for V79 and HeLa cells, due to an appropriate pKa and good biocompatibility. This demonstrates the potential use of such systems as a diagnostic tool for diseases related to pH abnormalities.
The surgical resection of malignant tumours is one of the most common and effective treatments of cancer.42 During this course of treatment, one of the most important problems is the specific identification of malignant tissue. As such, tumour-specific fluorescence probes, due to their high sensitivity and spatial resolution, have become a powerful tool in helping surgeons identify and resect tumour tissues.41,43 In particular, Yin, Wang, Zhu and co-workers have reported a lysosomal targeting PeT fluorescent probe (probe 6, Fig. 5A) for tumour identification.44 It uses a BODIPY-derived fluorophore that exhibits tuneable long wavelength emissions, and a N,N-dimethylaniline derivative as the pH-sensitive group. Probe 6 can be readily protonated and deprotonated, and can thereby exist as the non-fluorescent base and fluorescent acid, respectively. The energy of the HOMO of the unprotonated N,N-dimethylaniline derivative enables a-PeT quenching of the BODIPY fluorescence at neutral or alkaline pH. However, upon protonation, the HOMO of the N,N-dimethylaniline derivative reduces in energy, switching off the a-PeT process and leading to the recovery of the fluorescence (Fig. 5Bii).45,46 In the same way, the ground state properties of the probe molecule are also changed, resulting in changes in the UV-vis absorption spectra (Fig. 5Bi). Both in vitro (Fig. 5C) and in vivo (Fig. 5D) imaging was performed using probe 6. The results indicate that both tumour cells and tumour tissues could clearly be distinguished by the naked eye, meaning that probe 6 has the potential to be used for tumour resection surgery.
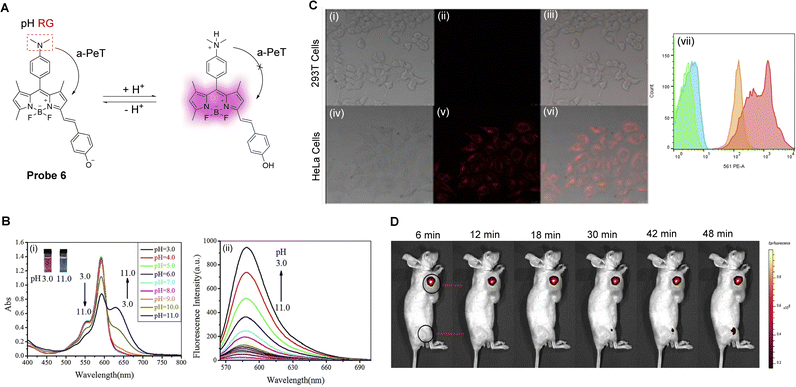 | ||
| Fig. 5 (A) The detection mechanism of probe 6 towards varying pH. (B) (i) The absorption spectra and (ii) fluorescence spectra of probe 6 as the pH is decreased from 11.0 to 3.0. (C) Fluorescence confocal images of (i–iii) 293T cells and (iv–vi) HeLa cells stained with probe 6, and (vii) flow cytometry of probe 6 in 293T cells and HeLa cells. (D) Representative fluorescence imaging of the tumour area (the front flank) and non-tumour area (posterior leg), injected with probe 6 (100.0 μL × 20.0 μM), of nude mouse. (RG = Recognition Group) Reproduced from ref. 44 with permission from Elsevier, copyright 2017. | ||
It has been reported that lysosomal pH correlates with the metastasis and apoptosis of cancer cells.47,48 The detection of lysosome pH changes in cancer cells is therefore helpful in analysing the progression of tumours, and in evaluating the role of lysosomes in tumour invasion and metastasis. Lin and co-workers have developed a tumour-targeting and lysosomal-specific two-photon PeT fluorescent probe (probe 7a) for imaging pH changes (Fig. 6A).49Probe 7a was constructed with a 1,8-naphthalimide as the fluorophore, biotin as the tumour targeting group, with a morpholine group also introduced as the lysosome targeting unit and pH responsive group.
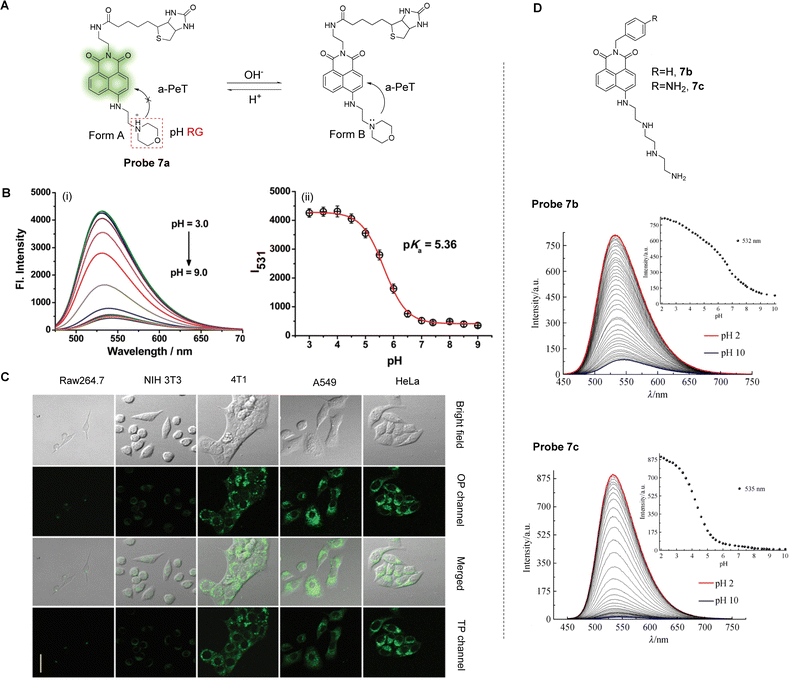 | ||
| Fig. 6 (A) The detection mechanism of probe 7a during changes in pH. (B) (i) Fluorescence spectra and (ii) fluorescence intensity of probe 7a (5.0 μM) at different pH at 531 nm. (C) Fluorescence confocal images for HeLa cells, A549 cells, 4T1 cells, NIH 3T3 cells and Raw 264.7 cells stained with probe 7a (10.0 μM), respectively. Reproduced from ref. 48 with permission from the Royal Society of Chemistry, copyright 2017. (D) The naphthalimide 7b and 7c, developed as pH probes for use as liposomal cellular imaging agents, and the change in the fluorescence emission spectra of the two probes as a function of pH, showing the aniline derivative giving rise to wide pH-range dependent emission changes. (RG = Recognition Group) Reproduced from ref. 50 with permission from Springer Nature, copyright 2020. | ||
Spectral and theoretical analysis suggest that probe 7a exhibits a rapid and reversible response to pH through the PeT process. Under relatively strong acidic conditions, the nitrogen atom of the morpholine is protonated (Form A, Fig. 6A), meaning the a-PeT process cannot occur. This results in the switching on of the fluorescence of the naphthalimide-unit, which is a behaviour that is commonly observed for such ICT-based naphthalimide fluorophores. As the pH changes from acidic to alkaline, the morpholine unit of Form A of probe 7a undergoes deprotonation (Form B, Fig. 6A) and the a-PeT process can occur, resulting in quenching of the fluorescence of the naphthalimide. Theoretical calculations using MarvinSketch software further confirm that at low pH, Form A dominates over Form B, and that Form A slowly converts to Form B as the pH increases. This interconversion is evidenced by the fluorescence measurements of probe 7a under varying pH (Fig. 6B). Furthermore, the inclusion of the biotin unit for enhanced tumour targeting means that probe 7a exhibits a strong single-photon and two-photon fluorescence response to the lysosomal pH of cancer cells but exhibits a weak fluorescence response in normal cells (Fig. 6C). These characteristics indicate that probe 7a is a promising candidate for monitoring pH and for aiding in the facilitation of cancer diagnosis.
Martínez-Calvo, Gunnlaugsson and co-workers have recently developed pH-dependent PeT probes for use as liposomal cellular imaging agents.50 These systems, based on probe 7b (Fig. 6D) are pH responsive over a large pH-range, with the level of response highly dependent on the nature of the imide substituent. In particular, the aniline derivative 7c gives rise to wide range pH dependence in the emission spectra, as shown in Fig. 6D. Using real-time confocal fluorescence microscopy imaging within HeLa cells, these probes demonstrate liposomal and to a lesser extent, mitochondria localisation, with the former showing pH-dependent emission changes.
Extensive research has indicated that endoplasmic reticulum (ER) stress can trigger autophagy. This leads to ER acidification and disruption of homeostasis,51–53 which in turn triggers various metabolic diseases including obesity, insulin resistance, and diabetes.54,55 Li, Zhang and co-workers have developed a pH-sensitive fluorescent probe (probe 8, Fig. 7A) to visualise the acidification of ER under stress in real-time.56Probe 8 was constructed using a 1,8-naphthalimide fluorophore and a piperazine derivative as the pH response unit. To facilitate ER targeting, additional methylbenzyl chloride and tosyl-derived units were also introduced, with the former added for covalent reaction with sulfhydryl-units present on the ER.
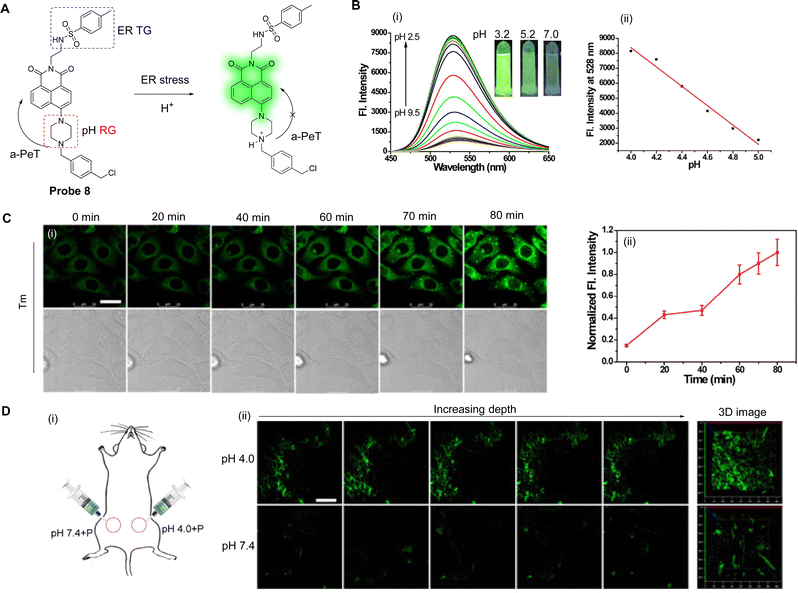 | ||
| Fig. 7 (A) The detection mechanism of probe 8 for pH. (B) (i) Fluorescence spectra and (ii) the linear relationship of fluorescence intensity of probe 8 (10.0 μM) at different pH values. Inset: Fluorescence images of probe 8 under a 365 nm laser. (C) (i) Fluorescence confocal images and (ii) the output of normalised average fluorescence intensity from (i) of HepG 2 cells incubated with probe 8 (10.0 μM) for 30 min then treated with tunicamycin (Tm, 10 μg mL−1; Tm is an inhibitor of protein N-glycosylation and can a trigger ER stress). (D) (i) The schematic image of the treated mice and (ii) TP fluorescence confocal imaging of pH difference in abdominal tissues of mice (Left: The selected fluorescence images of abdominal tissues incubated with probe 8 (100.0 μM) at PBS (pH 7.4 or 4.0); Right: The 3D stack images). (RG = Recognition Group; TG = Targeting Group) Reproduced from ref. 56 with permission from Elsevier, copyright 2018. | ||
At neutral pH, the a-PeT process of probe 8 results in quenching of the 1,8-naphthalimide-based fluorescence. Contrary to this, under an acidic pH environment, partial protonation of the piperazine unit occurs, which inhibits the a-PeT process (Fig. 7A). This means that the fluorescence of probe 8 is enhanced under acidic conditions, as is shown in the fluorescence studies in Fig. 7B. Acidification is a condition that occurs under ER stress, and due to its structural design, probe 8 could be located in the ER and used to track acidification during the stress event in vitro (Fig. 7C). Additionally, probe 8 was used for the in vivo pH-dependent fluorescence imaging of zebrafish and mice (Fig. 7D). In conclusion, probe 8 exhibits great potential as a practical tool for the real-time monitoring of ER acidification, which may help unravel the pathogenesis of ER stress-related diseases.
Increased CO2 production through the pentose pathway produces carbonic acid (H2CO3), which is an important source of protons in cancer cells. Within cancer cells, protons flow from intracellular organelles to extracellular niches, creating an acidic microenvironment. Therefore, fluctuations in the extracellular pH are a key indicator to help identify cancer cells. Maiti, Bhuniya and co-workers have developed two pH-sensitive probes, probe 9a and probe 9b, based once again on the 1,8-naphthalimide fluorophore, with a tertiary amine of varying alkyl-length used as the a-PeT dependent pH-sensitive moiety (Fig. 8A).57 In alkaline conditions, a-PeT occurs, but at acidic pH, the tertiary amine is protonated, and the a-PeT process is prevented. This results in the recovery of the 1,8-naphthalimide fluorescence intensity, as discussed above for probe 7 and probe 8.
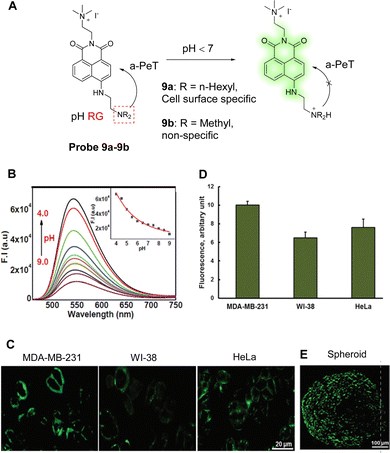 | ||
| Fig. 8 (A) The detection mechanism of probe 9a-9b for pH. (B) Fluorescence intensity changes of probe 9a (5.0 μM) as a function of pH (4.0–9.0). (C) Fluorescence confocal images of cell type-dependent pH studies of probe 9a (5.0 μM) on MDA-MB-231, HeLa, and WI-38 cells for 15.0 min. Scale bar, 20 mm. (D) Quantification of fluorescence intensity. Data are the mean ± SD of three independent experiments. (E) Fluorescence images of HeLa spheroids after incubation with probe 9a (5.0 μM) for 15.0 min. (RG = Recognition Group) Reproduced from ref. 57 with permission from the Royal Society of Chemistry, copyright 2021. | ||
Amongst these two probes, probe 9a was used both to report on the pH fluctuations of the plasma/extra cellular region, and to detect the pH in the plasma membrane of tumour cells. During a decrease in pH at physiological temperatures, it exhibits an enhancement in fluorescence at 550 nm (Fig. 8B). As the quaternary ammonium motif of the probe can also interact with the lipid bilayer on the plasma surface, probe 9a can be selectively located on the plasma membrane. This means it can be used to report proton flux changes as glucose concentrations are changed. In addition, probe 9a can be used to differentiate cancer cells based on metastatic potential (Fig. 8C and D), given that highly aggressive tumours contain more protons in their plasma membrane. Finally, probe 9a was successful in the labelling of the surface of HeLa spheroids (Fig. 8E), promoting its use as a surface marker for tumour tissues.
Fluorescent probes that emit within the visible region of the electromagnetic spectra are widely used to detect pH due to their high sensitivity and specificity. There is still, however, a demand for fluorophores that emit at longer wavelength, and hence, significant effort has been made recently to develop near-infrared fluorescent probes with large Stokes shifts. As such, probe 10 was designed by Zhu and co-workers for the detection of intracellular pH and exhibits a large Stokes shift (290 nm).58 The probe consists of N-ethylpiperazine as the pH response unit and a naphthyl-based dicyanisophorone as the fluorophore (Fig. 9A). In an alkaline environment, probe 10 exhibits a-PeT, resulting in fluorescence quenching. When the environment becomes more acidic, the piperazine is protonated, the a-PeT process is “switched off”, and the fluorescence recovers. Fluorescence studies clearly show that the fluorescence intensity at 730 nm increases sharply as the pH decreases (Fig. 9B), with a linear relationship between pH and fluorescence intensity over a pH range from 5.0 to 9.0. Theoretical calculations using Gaussian 09 indicate that the “deprotonated” form of probe 10 exhibits similar electron distribution in the HOMO and LUMO, with the electron density almost exclusively concentrated on the dicyanoisophorone unit (Fig. 9C, left). When probe 10 is protonated, however, the electron density of the HOMO and LUMO are concentrated on the dicyanoisophorone and piperazine-based moieties, respectively (Fig. 9C, right). The HOMO–LUMO energy difference of the protonated form is 0.5 eV, which is the main reason for the large Stokes shift, and the “off–on” fluorescence response. Notably, probe 10 has been applied for the monitoring of pH changes in the lysosomes of living cells.
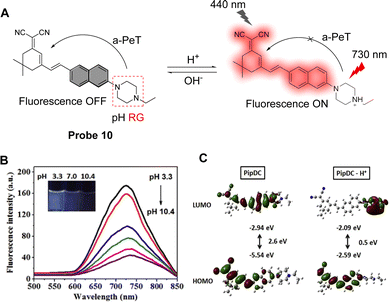 | ||
Fig. 9 (A) The pH-response mechanism of probe 10. (B) Fluorescence intensity of probe 10 at different pH values. ACN![[thin space (1/6-em)]](https://www.rsc.org/images/entities/char_2009.gif) : :![[thin space (1/6-em)]](https://www.rsc.org/images/entities/char_2009.gif) PBS = 1 PBS = 1![[thin space (1/6-em)]](https://www.rsc.org/images/entities/char_2009.gif) : :![[thin space (1/6-em)]](https://www.rsc.org/images/entities/char_2009.gif) 1 (10 mM, 1% DMSO); Ex = 440 nm, Em = 730 nm. ACN, acetonitrile; PBS, phosphate-buffered saline. (C) Molecular theoretical orbital amplitude plots of HOMO and LUMO energy levels of probe 10. (RG = Recognition Group) Reproduced from ref. 57 with permission from Elsevier, copyright 2020. 1 (10 mM, 1% DMSO); Ex = 440 nm, Em = 730 nm. ACN, acetonitrile; PBS, phosphate-buffered saline. (C) Molecular theoretical orbital amplitude plots of HOMO and LUMO energy levels of probe 10. (RG = Recognition Group) Reproduced from ref. 57 with permission from Elsevier, copyright 2020. | ||
3. PeT-based fluorescent probes for bioactive small molecules
Small bioactive molecules such as reactive oxygen species and biothiols are indispensable to our survival because they play a vital role in a range of physiological and pathological processes.59,60 Amongst them, molecules such as nitric oxide (NO), hydrogen sulfide (H2S) and carbon monoxide (CO) are important signalling molecules in inflammatory and neurotransmitter transduction processes.61,62 Excessive reactive oxygen species can cause cell damage, and can affect the normal physiological and biochemical functions of the body, resulting in various diseases, such as Parkinson's disease, Alzheimer's disease, and other immune diseases.63–65 Additionally, intracellular biothiols (cysteine, homocysteine, and glutathione) are important biomarkers for disease diagnosis, and act as target molecules for key treatments.66 Consequently, determining the concentration and location of these small bioactive molecules with high spatial resolution may enhance the understanding of cellular biochemistry and disease diagnosis.60Amongst the numerous advanced imaging and detection methods, small molecule-based fluorescent probes have attracted significant attention as they can be easily internalised into living cells to monitor biological processes in real-time.67 During recent years, researchers have made significant progress in the development of advanced fluorescence probes in order to obtain the concentration and distribution of bioactive small molecules within living cells.68–70 In this section, we will detail the specific application of PeT-based probes for the cellular imaging of bioactive small molecules (gaseous molecules, reactive oxygen species, and biothiols) for disease diagnosis.
3.1 PeT-based fluorescent probes for gaseous molecules
Small gaseous molecules, such as H2S, NO and CO, have important biological activities and are involved in a variety of physiological and pathological processes. These small molecules are distributed throughout the cell and their abnormal levels are often closely related to the occurrence and development of various diseases.61 Therefore, it is necessary to monitor any changes to their levels in vivo in real-time in order to better understand their biological function in cells, and to help develop better monitoring tools. PeT-based fluorescent probes have been widely used for the cellular imaging of gaseous small molecules (NO, H2S) in vivo, and for disease diagnosis.H2S can cause membrane instability of lysosomes, which can result in autophagy and cell death.71,72 The detection of H2S through a-PeT or d-PeT processes has been achieved through the development of various probes.73,74 For example, Zhao, Zhang and co-workers have developed two novel fluorescent probes (probe 11 and 12, Fig. 10A) to detect H2S in lysosomes.75 BODIPY was used as the core fluorophore, and a dinitrophenoxy-moiety (DNP) or dinitrobenzenesulfonyl-moiety (DNBS) were incorporated into probe 11 and probe 12, respectively. In particular, DNBS was selected because reaction with H2S could result in the cleavage of the group, exposing an electron rich phenol which in biological media becomes a phenolate group. Hence, in its sulfonyl-form, the inherent fluorescence of the BODIPY moiety is “switched off” but upon reacting with H2S, the d-PeT process is prevented, and the fluorescence is “switched on”. Indeed, the H2S titration results indicate that when H2S is added, the BODIPY-phenol-based derivative is formed, which results in enhanced fluorescence (Fig. 10B). The formation of this species in the presence of H2S was further corroborated by mass spectrometry. Additionally, the d-PeT process was verified by DFT calculations, which show that for probe 12, the HOMO is located on the BODIPY fluorophore and extends to the styrene linker (C![[double bond, length as m-dash]](https://www.rsc.org/images/entities/char_e001.gif) C), while the LUMO is mainly distributed on the DNBS unit, which is a strong electron-withdrawing group.76 Thus, the electron can transfer from the BODIPY fluorophore to the DNBS unit, leading to a d-PeT process and therefore weak fluorescence. Comparing the response of probe 11 and 12 towards H2S, it was found that probe 12 exhibits a faster response (60 s), lower detection limit (51 nM), and higher sensitivity and selectivity than that of probe 11. Finally, it was also shown that probe 12 was able to detect both exogenous and endogenous H2S in living cells and exhibited excellent lysosomal targeting ability (Fig. 10C).
C), while the LUMO is mainly distributed on the DNBS unit, which is a strong electron-withdrawing group.76 Thus, the electron can transfer from the BODIPY fluorophore to the DNBS unit, leading to a d-PeT process and therefore weak fluorescence. Comparing the response of probe 11 and 12 towards H2S, it was found that probe 12 exhibits a faster response (60 s), lower detection limit (51 nM), and higher sensitivity and selectivity than that of probe 11. Finally, it was also shown that probe 12 was able to detect both exogenous and endogenous H2S in living cells and exhibited excellent lysosomal targeting ability (Fig. 10C).
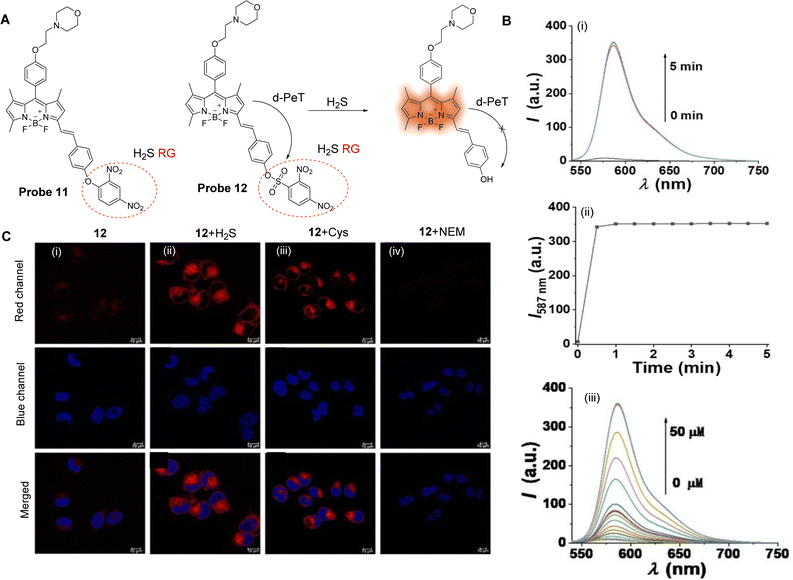 | ||
| Fig. 10 (A) The chemical structures of probe 11 and 12 and mechanism of probe 12 for the detection of H2S. (B) (i) Fluorescence spectra of probe 12 (5 μM) with 10 eq. H2S over 5 min; (ii) time-dependent fluorescence intensity of probe 12; (iii) fluorescence spectra of probe 12 (5 μM) upon titration with H2S (0–50 μM) for 60 s. (C) Confocal fluorescence images of H2S in HeLa cells: Top: (i) cells were stained with probe 12 (Red channel, 10 μM) for 30 min; (ii) cells were preincubated with H2S (100 μM) for 30 min then stained with probe 12 (10 μM) for 30 min; (iv) cells were preincubated with Cys (100 μM) for 30 min then stained with probe 12 (10 μM) for 30 min, and (iv) cells were pretreated with NEM (200 μM) for 60 min then stained with probe 12 (10 μM) for 30 min, respectively. Middle: The nuclei were stained using Hoechst 33342 (Blue channel). Bottom: The overlay of respective red channel and blue channel. (RG = Recognition Group) Reproduced from ref. 75 with permission from Wiley, copyright 2021. | ||
Li, Li and co-workers have developed a two-photon fluorescent probe (probe 13, Fig. 11A) to detect H2S in lysosomes using a dual lock system.77 That is, there is a dual PeT process and dual reaction sites in probe 13.78 In the molecular design, a 1,8-naphthalimide fluorophore was used,79,80 while a nitrobenzoxadiazole (NBD) unit was chosen to selectively react with H2S. Morpholine was also incorporated as a pH dependent reaction site. a-PeT and d-PeT exist simultaneously in probe 13, with a-PeT occurring from the electron-rich morpholine group to the naphthalimide fluorophore, and d-PeT occurring from the naphthalimide fluorophore to the electron-deficient NBD group. Under neutral pH conditions, probe 13 is non-fluorescent due to both these PeT processes occurring. In acidic media, protonation of the morpholine unit occurs and the a-PeT process cannot occur. The d-PeT process, however, still occurs and therefore there is almost no change in the fluorescence. When H2S is added under non-acidic conditions, cleavage of the NBD fragment occurs by thiolysis, and the d-PeT process is removed. In this case, the a-PeT processes from both the morpholine group and the newly formed piperazine group to the naphthalimide still operate, which quenches the fluorescence. When both H2S and H+ are present in solution, both protonation and cleavage of the NBD fragment occur, and as such, both the a-PeT and d-PeT processes are removed. This results in the green fluorescence of the naphthalimide fluorophore to be “switched on” (Fig. 11B). 1H NMR spectroscopy, mass spectrometry and density functional theory (DFT) calculations were used to further confirm this response mechanism. Cell imaging experiments indicate that probe 13 can be used for the tracking and detection of endogenous H2S in the lysosomes of living cells and tissues (Fig. 11C).
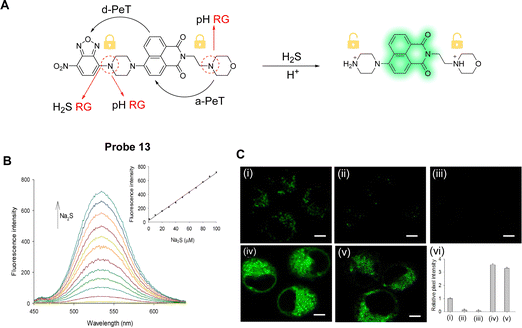 | ||
| Fig. 11 (A) The detection mechanism of probe 13 for H2S. (B) Fluorescence spectra of probe 13 (10 μM) upon the addition of Na2S at different concentrations (0–100 μM). Inset: Fluorescent intensity changes versus Na2S concentration. (C) TP fluorescence images in HeLa cells for H2S: (i) cells were stained with probe 13; (ii) cells were treated with PMA and then stained with probe 13; (iii) cells were treated with BFA and then stained with probe 13, before finally being incubated with Na2S; (iv) cells were stained with probe 13 and then incubated with Na2S; (v) cells were stained with probe 13 and then incubated with Cys; (vi) relative pixel intensity obtained from images (i–iv). (RG = Recognition Group) Reproduced from ref. 77 with permission from Elsevier, copyright 2018. | ||
H2S is closely associated with physiological processes such as mitochondrial ATPase activity and antioxidant stress.81,82 Therefore, the regulation of H2S levels has great potential in the prevention, diagnosis, and treatment of microcystic diseases. With this in mind, Li, Yin and co-workers have developed a PeT-based mitochondrial targeting near-infrared probe (probe 14), with good selectivity and high sensitivity for H2S (Fig. 12A).83Probe 14 contains a near-infrared cyanine dye as the fluorophore, with an azido group acting as the H2S specific recognition site and fluorescence quencher. In addition, the lipophilic cationic cyanin derivative was selected due to its potential to target mitochondria.84–86Probe 14 was shown to be non-fluorescent due to an active d-PeT mechanism between the fluorophore and the azido group, which are separated by a carbonate linker. When probe 14 reacts with H2S, it is reduced to the corresponding amino compound. It then undergoes a further cleavage and release of the fluorophore with associated fluorescence recovery at 736 nm (Fig. 12B). The detection limit of probe 14 for H2S was 20 nM, showing its high sensitivity towards H2S. Significantly, probe 14 could be used to monitor the levels of H2S in the mitochondria of MCF-7 cells (Fig. 12C), and it was also used to track H2S in nude mice. These findings help probe the biological and pathological role of mitochondrial H2S in living systems.
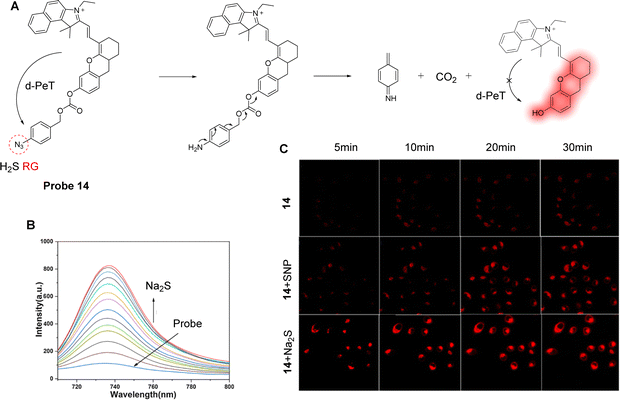 | ||
| Fig. 12 (A) The detection mechanism of probe 14 for H2S. (B) Fluorescence emission spectra of probe 14 (10 μM) upon the addition of Na2S (0–40 μM) in HEPES-EtOH buffer solution. (C) Fluorescence confocal images of probe 14 towards H2S in MCF-7 human breast cancer cells incubated with probe 14 (10 μM) at different times. Top row: The cells were incubated with probe 14 (10 μM) at 5, 10, 20, 30 min. Middle row: The cells were incubated with SNP (50 μM) at 5, 10, 20, 30 min, and then stained with probe 14 (10 μM). Bottom row: The cells were incubated with Na2S (50 μM) at 5, 10, 20, 30 min and then stained with probe 14 (10 μM). (RG = Recognition Group) Reproduced from ref. 83 with permission from Elsevier, copyright 2019. | ||
Ever increasing evidence indicates that dysregulation of H2S is closely related to many diseases. Since H2S cannot be administered directly, several H2S prodrugs have been developed for treatment. To explore the release efficiency of H2S prodrugs in drug development and clinical applications, Liu and co-workers have developed the PeT near-infrared fluorescent probe 15 to monitor H2S in real-time (Fig. 13A).87 The fluorescein-inspired near-infrared fluorescent dye (NFL-OH) was selected as the fluorophore due to its unique conjugated structure and structural variability, while 1-bromo-3,5-dinitrobenzene was introduced as the reaction site for H2S. In the absence of H2S, a d-PeT process exists between the nitrobenzene unit and the fluorophore, resulting in fluorescence quenching. However, when probe 15 reacts with H2S, the ether bond is selectively cleaved, and the NFL-OH fragment is released, resulting in the switching on of the fluorescence (Fig. 13B). In vitro experiments show that probe 15 exhibits good fluorescence enhancements as the H2S concentration is increased under excitation at 680 nm (Fig. 13C), with the detection limit determined to be 23.0 nM. From in vivo imaging experiments, the maximum fluorescence intensity was detected 60 minutes after intraperitoneal injection of ADT-OH (the prodrug of H2S) in nude mice. Therefore, when applied in vitro and in vivo, probe 15 was able to assess the release rate of the H2S prodrug through fluorescence imaging.
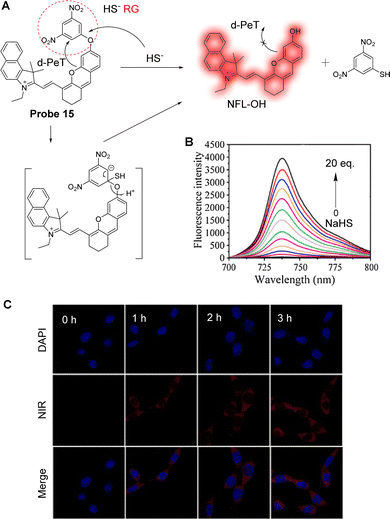 | ||
| Fig. 13 (A) The detection mechanism of probe 15 with NaHS. (B) Fluorescence spectra of probe 15 (10 μM) after adding NaHS (0–20 eq.), λex = 680 nm. (C) Fluorescence confocal images of A549 cells incubated with probe 15 (10 μM) for 0, 1, 2, and 3 h after incubating with the prodrug for 30 min. (RG = Recognition Group) Reproduced from ref. 87 with permission from Elsevier, copyright 2021. | ||
ER stress induced by NO may be involved in the pathogenesis of several vascular diseases.88,89 Li, Li and co-workers have developed a fluorescent probe (probe 16) for NO imaging (Fig. 14A).90Probe 16 was constructed using three components: a 1,8-naphthalimide fluorophore, an o-phenylenediamino NO-recognition group, and a methylsulfonamide ER-targeting group. The energy of the HOMO of o-phenylenediamino (−5.388 eV) is higher than that of the naphthalimide fluorophore (−6.147 eV) and therefore, a-PeT can occur from the o-phenylenediamino to the naphthalimide moiety which results in the quenching of the fluorescence. However, after the addition of DEA·NONOate, a NO-releasing reagent, the o-phenylenediamino moiety undergoes a chemical reaction that results in the formation of the corresponding benzotriazole compound. As the HOMO energy of the benzotriazole moiety (−6.317 eV) is lower than that of the naphthalimide fluorophore (−6.147 eV), the a-PeT process from the benzotriazole unit to the naphthalimide fluorophore is blocked, causing an enhancement in the fluorescence. When the concentration of DEA·NONOate is increased to 20 μM, the fluorescence of the probe is increased by 22-fold (Φ = 0.214, Fig. 14B). Probe 16 exhibits a relatively rapid (six minutes) conversion to the benzotriazole compound in the presence of NO, and it was found to be highly selective for NO in biological samples. Cellular imaging studies showed that probe 16 was localised specifically in the ER and can be used to track endogenous and exogenous NO in cells and tissues (Fig. 14C).
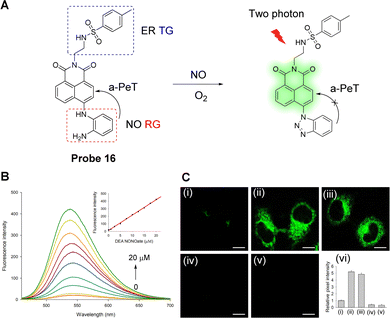 | ||
| Fig. 14 (A) The detection mechanism of probe 16 for NO. (B) Fluorescence spectra of probe 16 (10 μM) to DEA·NONOate (NO-releasing reagent) in PBS buffered solution. Inset: Fluorescence intensity of the probe vs. NO concentration. (C) TP fluorescence images of HeLa cells (i) incubated with probe 16 (10 μM); (ii) cells were treated with DEA·NONOate (20 μM) for 20 min and then stained by probe 16 (10 μM); (iii) cells were incubated with LPS (20 μg mL−1) for 12 h, and then stained with probe 16 (10 μM), (iv) cells were incubated with L-NAME (10 μM) for 12 h and then stained by probe 16 (10 μM); (v) cells were treated with AG (0.5 mM) for 12 h and then stained with probe 16 (10 μM); (vi) relative pixel intensity for images (i–v). (RG = Recognition Group; TG = Targeting Group) Reproduced from ref. 90 with permission from the American Chemical Society, copyright 2018. | ||
Recently, nitric oxide synthase (NOS) and the accumulation of NO have been associated with the evolution of myocardial fibrosis (MF).91–93 Inducible nitric oxide synthase (iNOS) is one of three NOS subtypes that catalyses the formation of nitric oxide (NO) from L-arginine. Induction of iNOS may lead to the production of a large amount of NO for a period of time, with the iNOS-NO system activated in cardiomyocytes. Furthermore, iNOS is the only subtype of NOS in cardiac fibroblasts,94 though the role of NO in MF still needs to be fully evaluated. Therefore, Zhao, Liang, Xu and co-workers have developed a highly sensitive and selective probe (probe 17) for the real-time detection of NO.95 Pyridazinone was selected as one part of the fluorophore,96–98 with o-phenylenediamine (OPD) used as the NO “recognition group”, both due to its high selectivity and ability to quench the fluorescence via the PeT process (Fig. 15A).99–101 A thiophene group was also introduced into the design of the probe to extend the emission wavelength,102 while a morpholine group was incorporated to facilitate lysosome targeting.103,104 Initially, probe 17 exhibits negligible fluorescence due to an active a-PeT mechanism from the OPD group. However, once the OPD unit is converted into a triazole by NO, the a-PeT process is blocked and there is a significant fluorescence enhancement (Fig. 15B). Probe 17 was shown to exhibit a rapid response to both exogenous (Fig. 15C) and endogenous (Fig. 15D) NO in cells and animal tissues. Thus, probe 17 can act as a suitable probe for the monitoring of NO-related biological processes.
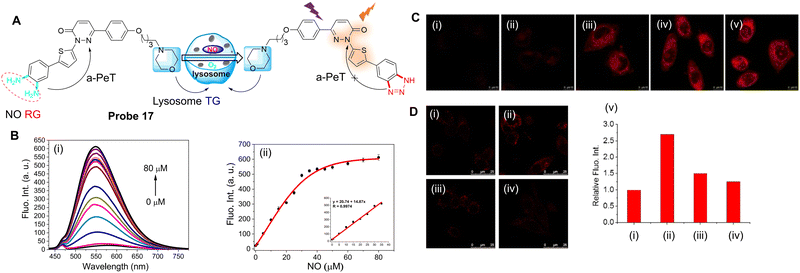 | ||
| Fig. 15 (A) The detection mechanism of probe 17 for NO. (B) (i) Fluorescence spectra and (ii) plot of the fluorescence intensity of probe 17 in the presence of NO (0–80 μM); (inset) linear relationship between the fluorescence intensity of probe 17 and the NO concentration (0–35 μM). (C) Fluorescence confocal imaging of exogenous NO in SH-SY5Y cells stained with probe 17 (5 μM) and then incubated with (i) 0, (ii) 10, (iii) 50, (iv) 100 and (v) 200 μM NO. (D) Fluorescent confocal images of endogenous NO in RAW 264.7 cells (i) incubated with probe 17 (5 μM); (ii) cells were pre-incubated with NO stimulant (20 μg mL−1 LPS, 200 U mL−1 IFN-γ and 0.5 mg mL−1L-Arg) for 14 h and then incubated with probe 17; (iii) cells were pre-incubated with NO stimulants together with L-NNA (10 μM), then incubated with probe 17; (iv) cells were pre-incubated with NO stimulants, then incubated with Carboxy-PTIO (0.5 mM), and then incubated with probe 17; (v) relative fluorescence intensity for images (i–iv). (RG = Recognition Group; TG = Targeting Group) Reproduced from ref. 95 with permission from the American Chemical Society, copyright 2020. | ||
Tumour-associated macrophages (TAMs) account for 50% of solid tumours and typically exhibit a pre-tumour M2 phenotype and an anti-tumour M1 phenotype.105–107 Significantly, M1 macrophages express higher levels of iNOS than M2 macrophages.105,108–114 Guo and co-workers have developed the BODIPY-based NO probes 18a and 18b (Fig. 16A) in order to distinguish between M1 and M2 macrophages in terms of the difference in the iNOS, and therefore NO levels.114 The electron-rich aromatic secondary amine N-benzyl-4-methoxyaniline was introduced to act as both the reaction site and as the PeT electron donor. These two probes have the unique ability to react simultaneously with two secondary oxides of NO, namely N2O3 and ONOO−. Using probe 18a as a representative, the fluorescence of this probe in solution at 518 nm was low (Fig. 16B and C), which may be attributed to the a-PeT process between the N-benzyl-4-methoxy-aniline moiety and the BODIPY fluorophore. However, after treatment with excess NO solution to produce N2O3, a significant fluorescence enhancement (880-fold) was observed due to reaction with probe 18a and the subsequent blocking of the a-PeT process. Importantly, when probe 18a was treated with excessive ONOO− under the same conditions, a fast and strong “off–on” response was also observed, which was almost identical to the fluorescence intensity dynamics with N2O3. Probe 18a (as a representative) and probe 18b were successful in (1) distinguishing between M1 and M2 macrophages (Fig. 16D and E), (2) evaluating the repolarisation of TAMs from the pre-tumour M2 phenotype to the anti-tumour M1 phenotype, and (3) visualising NO communication during the immunophagocytosis of M1 macrophages. These results indicate that these probes have great potential for imaging applications in NO-related tumour immunotherapy studies and related anticancer drug screening.
 | ||
| Fig. 16 (A) The detection mechanism of probe 18a and 18b with NO and the potential imaging applications. (B and C) Fluorescence spectra of probe 18a (4 μM) treated with and without NO or ONOO− under aerobic conditions. Inset: The time-dependent fluorescence intensity changes of probe 18a (4 μM) treated with and without NO or ONOO− (20 μM). (D) Macrophages can be differentiated starting from the human monocytic cell line THP-1. Once differentiated in the presence of PMA, they can be polarised into M1 and M2 macrophages by IFN-γ/LPS and IL-4/IL-13 treatment, respectively. M1 macrophages could also be produced by the polarisation of M2 macrophages by IFN-γ/LPS. (E) Confocal fluorescence images of M1 or M2 macrophages treated with probe 18a in the absence and presence of AG or IFN-γ/LPS. Emission was collected at 493–600 nm (λex = 488 nm). Scale bar: 10 μm. (RG = Recognition Group) Reproduced from ref. 114 with permission from the Royal Society of Chemistry, copyright 2019. | ||
NO is a basic signalling molecule that regulates many key diseases, including diabetes, Alzheimer's disease and cancer, amongst others. Therefore, the development of methodology and tools that can quickly, sensitively, and selectively track NO production in biological systems are vital to uncover the precise role of NO in health and disease. Guo and co-workers have developed a Si-rhodamine deoxylactam derivative as a near-infrared fluorescent probe (probe 19) to selectively detect NO in living cells with high senstivity.115 When the probe exists in its ring opened-form, an effective a-PeT mechanism operates between the o-phenylenediamine (OPD) moiety and the Si-rhodamine fluorophore, which results in fluorescence emission quenching (Fig. 17A). However, when the OPD group reacts with NO to generate the triazole derivative, the a-PeT process is inhibited which in turn activates the fluorescence, with a significant fluorescence enhancement of up to 6300-fold at 680 nm. The detection limit for NO was determined to be as low as 0.12 nM (Fig. 17B), showing its promise in detecting trace amounts of intracellular NO. The excellent detection properties, combined with good cell permeability and low cytotoxicity, enabled probe 19 to be used to image endogenous NO in RAW 264.7 macrophages, pancreatic β-cells, and endothelial EA.hy926 cells (Fig. 17C and D), and in living mouse models. As such, this probe was shown to be a helpful imaging tool for studying NO-related physiological and pathological functions.
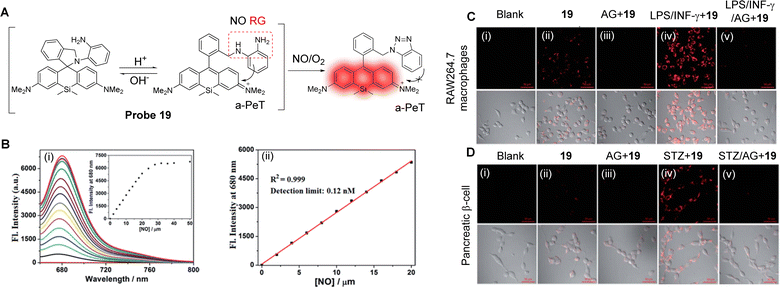 | ||
| Fig. 17 (A) The detection mechanism of probe 19 with NO. (B) (i) Fluorescence spectra changes of probe 19 (4 μM) when treated with increasing concentrations of NO (0–50 μM), and (ii) the plot of the fluorescence intensities of probe 19 (4 μM) at 680 nm as a function of the NO concentration (0–20 μM). (C) The confocal images of NO in RAW 264.7 macrophages or (D) pancreatic β-cells under different conditions. (i) No treatment. (ii) For imaging of intracellular basal NO, the cells were treated with probe 19 (2 μM, 20 min) only. (iii) The cells were pretreated with the NO synthase inhibitor amino-guanidine (AG; 0.5 mM) and then treated with probe 19 (2 μM, 20 min). (iv) For imaging of stimulator-induced NO, the cells were pretreated with stimulators LPS (20 μg mL−1, 6 h)/INF-γ (150 units per mL, 6 h, C) or STZ (0.5 mM, 12 h, D), and then treated with probe 19 (2 μM, 20 min). (v) For the inhibition assays, the cells were pretreated with LPS (20 μg mL−1, 6 h)/INF-γ (150 units per mL, 6 h, C) or STZ (0.5 mM, 12 h, D) in the presence of AG (0.5 mM) and then treated with probe 19 (2 μM, 20 min). The emission images were collected at 650–750 nm (λex = 633 nm). The scale bar: 50 μm. (RG = Recognition Group) Reproduced from ref. 115 with permission from the Royal Society of Chemistry, copyright 2017. | ||
3.2 PeT-based fluorescent probes for reactive oxygen species
Reactive oxygen species (ROS) are a class of one-electron reduction products of oxygen in living organisms, which includes hydrogen peroxide (H2O2), hypochlorite/hypochlorite (HOCl/ClO−), peroxynitrite (ONOO−), etc.116 ROS play a key role in maintaining normal physiological functions and cellular homeostasis, as well as being involved in various signal transduction and pathological processes. However, overexpression of ROS can be harmful to the organism because it can cause oxidative stress and lead to cell death by inducing oxidation of DNA, proteins or lipids.117 As such, elevated ROS levels are considered biomarkers for various diseases, such as Alzheimer's disease, Parkinson's disease, inflammation, and cancer.118–120 The monitoring of ROS levels in living cells and tissues is critical for monitoring body function and for assessing biological processes.With the arrival of fluorescent probes and cellular imaging technology, remarkable progress has been achieved in this area.121,122 Amongst the fluorescence-based tools that have been developed, fluorescent probes for ROS based on the PeT mechanisms are highly attractive because they can help reveal the physiological and pathological functions of these highly reactive, interactive, and switchable molecules associated with various biological events.123 As an example, abnormal levels of H2O2 in cells can interfere with the normal function of cells,124 and lead to oxidative stress followed by apoptosis, which is associated with many diseases.125–127 Therefore, Qian and co-workers have developed a novel lysosomal-targeting fluorescent probe (probe 20, pKa = 4.78) for H2O2 (Fig. 18A).128 The probe is comprised of a selenomorpholine-moiety and a BODIPY fluorophore, with the two separated by a methylene spacer. Selenomorpholine was selected as both the lysosomal targeting group and as the H2O2 responsive group. In a neutral or alkaline environment, probe 20 is only weakly fluorescent due to an active a-PeT mechanism between the selenomorpholine and BODIPY moieties. However, in an acidic environment, the amine group of the selenomorpholine structure becomes protonated, which inhibits the a-PeT process, and the fluorescence of the probe is turned on. In addition, due to the inclusion of the selenomorpholine unit, probe 20 can be oxidised selectively by H2O2, resulting in a change of the valence state of Se from Se(II) to Se(IV), which is accompanied by a marked enhancement in fluorescence (Fig. 18B). Probe 20 was used to monitor the H2O2 levels in the lysosomes of cancer cells and zebrafish (Fig. 18C–E), where the two PeT-inhibited processes resulted in a significant fluorescence signal enhancement.
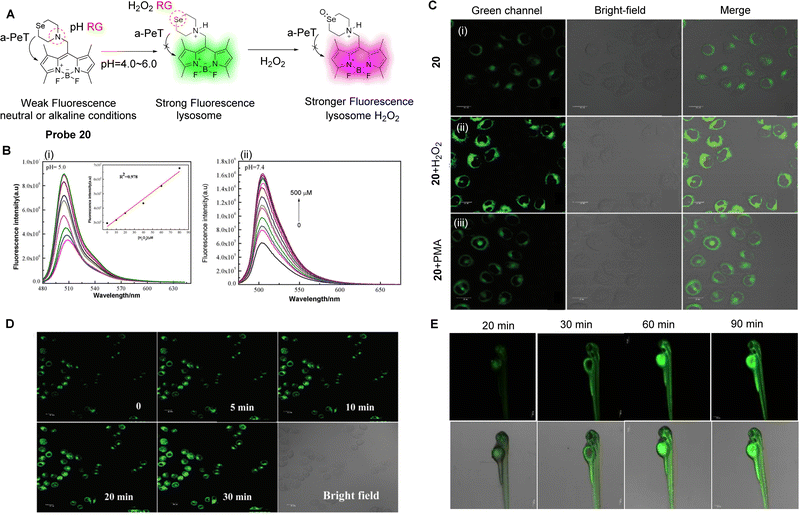 | ||
| Fig. 18 (A) The detection mechanism of probe 20. (B) Fluorescence spectra of probe 20 with varying concentrations of H2O2 (0–500 μM) in EtOH-PBS solution, (i) pH = 5.0, (ii) pH = 7.4. Inset: Linear relationship between fluorescence intensity and H2O2 concentration from 0–80 μM. (C) Fluorescence confocal images in HepG 2 cells (i) incubated with probe 20 (2 μM); the cells were treated with (ii) H2O2 (10 μM) or (iii) stimulant PMA (25 ng mL−1) for 20 min before (ii) and (iii) were incubated with probe 20 (2 μM). (D and E) Fluorescence confocal images in MCF-7 cells and zebrafish incubated with probe 20 and subsequently treated with H2O2 (10 μM) for various amounts of time. (RG = Recognition Group) Reproduced from ref. 128 with permission from the Royal Society of Chemistry, copyright 2019. | ||
Elevated H2O2 concentrations can lead to oxidative damage to cellular proteins, which can lead to aging and disease. In particular, lysosomes are organelles that are primarily affected by H2O2. With this in mind, Kaur, Kumar and co-workers have developed a lysosomal targeting fluorescent probe (probe 21) (Fig. 19A).129 For probe 21, 1,8-naphthalimide was chosen as the core fluorophore, a catechol was chosen as the reaction centre for H2O2, and a morpholine unit was added to target lysosomes. Initially, according to theoretical calculations, the HOMO of probe 21 is located on the catechol and the LUMO is located on the electron-deficient naphthalimide in both the ground state and the excited state. This facilitates an active a-PeT process from the catechol to the naphthalimide, leading to a degree of quenching in the fluorescence emission. Hence, probe 21 only exhibits weak fluorescence emission when excited at 450 nm in water at pH 7.4. However, In the presence of H2O2, the catechol of probe 21 is oxidised to o-quinone, thereby inhibiting the a-PeT process, and enhancing the fluorescence emission (Fig. 19B). Cell imaging studies indicate that probe 21 can be used as a fluorescent imaging agent for monitoring the dynamic levels of H2O2 in lysosomes (Fig. 19C), brain tissues, and living nematodes. In other words, probe 21 has the potential to be a tool for monitoring levels of H2O2 and for examining its associated pathological reactions in living systems.
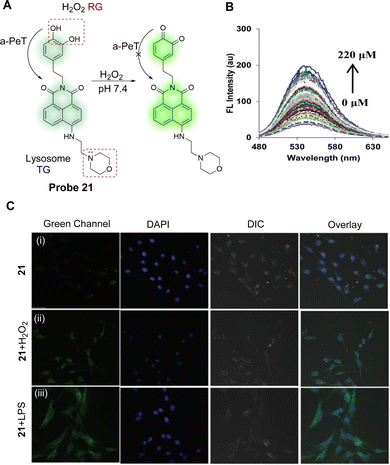 | ||
| Fig. 19 (A) Detection mechanism of probe 21 for monitoring H2O2. (B) Fluorescence emission spectra of probe 21 (5.0 μM) upon increasing concentration of H2O2 (0–220 μM) in PBS (50 mM), pH = 7.4 (0.5% DMSO was used). (C) Representative fluorescence images of the C6 glioma cells labelled with probe 21: (i) cells were incubated with probe 21 (2.0 μM) for 1 h; (ii) probe treated cells were exposed to H2O2 (100 μM) for 1 h exogenously; and (iii) cells were pretreated with lipopolysaccharide (LPS, 2 μg mL−1) for 24 h and then incubated with probe 21 for 1 h. Images were captured using an A1R Nikon Confocal Microscope at the 488 nm channel using 60× magnification. (RG = Recognition Group; TG = Targeting Group) Reproduced from ref. 129 with permission from the Royal Society of Chemistry, copyright 2017. | ||
Hypochlorite (ClO−) is another ROS and excessive production can induce a variety of diseases, such as atherosclerosis, rheumatoid arthritis, and even cancer.130,131 Piao, Zhou and co-workers have developed probe 22 as a highly sensitive and selective “off–on” fluorescent probe for ClO− (Fig. 20A).132 In their design, BODIPY was chosen as the core fluorophore and the electron-rich phenothiazinyl-group was used as the recognition/reactive site for ClO−. In the absence of ClO−, probe 22 is non-fluorescent because of an active a-PeT process from the phenothiazinyl-group to the BODIPY. However, after reaction with ClO−, the S atom is oxidised, creating a sulfinyl-group, and the a-PeT process is blocked in a similar manner to that seen for probe 20. This results in a gradual enhancement in green fluorescence at 515 nm as the concentration of ClO− is increased (Fig. 20B). The detection limit of probe 22 for ClO− was determined to be 1.7 nM, which indicates high sensitivity of this probe towards ClO−. Importantly, probe 22 could be used to visualise exogenous ClO− in the mitochondria of HeLa cells (Fig. 20C).
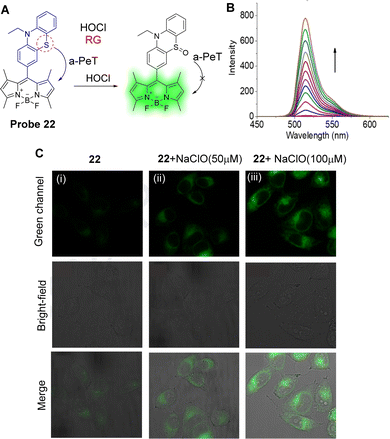 | ||
| Fig. 20 (A) The mechanism of probe 22 for the detection of ClO−. (B) Fluorescence spectra of probe 22 (1 μM) upon addition of NaClO (0–9 μM) in PBS-EtOH. (C) Fluorescence confocal images of probe 22: (i) HeLa cells stained with probe 22 (5 μM) for 10 min; (ii) HeLa cells were then incubated with NaClO (50 μM) for 15 min; (iii) HeLa cells were then incubated with NaClO (100 μM) for 15 min. (RG = Recognition Group) Reproduced from ref. 132 with permission from Elsevier, copyright 2020. | ||
As mentioned above, abnormal levels of intracellular ClO− is associated with atherosclerosis,133,134 and therefore Han and co-workers have developed probe 23 to detect changes of ClO− associated with this disease.135 The probe is based on the use of 1,8-naphthalimide as the fluorophore and p-aminophenol as the reactive group. Before oxidation, the maximum absorption wavelength of probe 23 is centred around 460 nm and is non-fluorescent due to an a-PeT process between the p-aminophenol and naphthalimide moieties. This indicates that the p-aminophenol is twisted out of the plane with the ICT-based fluorophore. The p-aminophenol group can be oxidised by using ClO− (Fig. 21A), which results in cleavage of this group from the naphthalimide. This means there is no longer any mechanism available for PeT processes and only the ICT of the 4-amino-1,8-naphthalimide remains. On reaction with ClO−, the maximum absorption peak is shifted from 460 to 468 nm and a significant fluorescence emission “turn-on” response is observed at 540 nm (Fig. 21B). In terms of cell studies, probe 23 was shown to accumulate in the ER and was used for the detection of ClO− in atherosclerosis disease-associated macrophages (Fig. 21C and D).
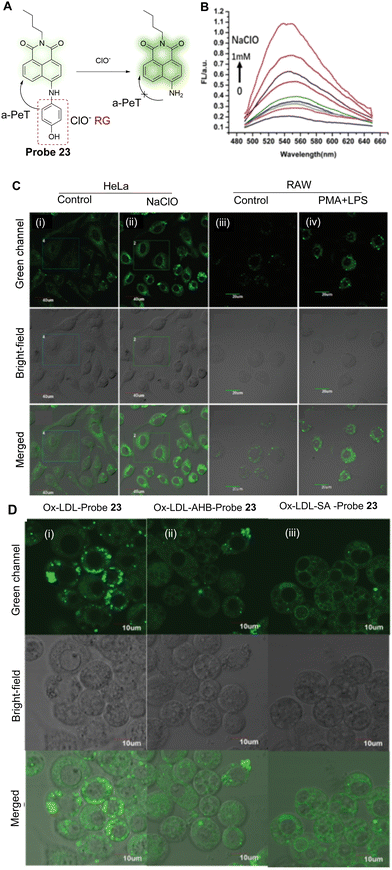 | ||
| Fig. 21 (A) The mechanism of probe 23 for the detection of ClO−. (B) Fluorescence spectra of probe 23 (20 μM) upon addition of NaClO (0–1 mM). (C) Fluorescence confocal images of HeLa cells and RAW 264.7 cells: (i and ii) detection of exogenous ClO− in the absence or presence of NaClO with probe 23; (iii and iv) endogenous ClO− produced by LPS/PMA in the macrophage; (i and iii) probe 23 only (10 μM); (ii) cells stained with probe 23 (10 μM) and incubated for 30 min in the presence of NaClO (100 μM); (iv) cells treated with LPS (1 μg mL−1) for 4 h and PMA (0.5 μg mL−1) for 30 min and then incubated with probe 23 (10 μM) for another 30 min. (D) Fluorescence confocal images of foam cells incubated with probe 23 (10 μM) after treatment with (i) the inhibitor AHB (10 μg mL−1) or (ii) SA (50 μg mL−1) for 30 min and then treated with (iii) Ox-LDL (20 μg mL−1) for another 24 h. (RG = Recognition Group) Reproduced from ref. 135 with permission from the Royal Society of Chemistry, copyright 2020. | ||
Endogenous HClO, due to its strong oxidative properties, is an effective in vivo antibacterial agent. Its abnormal abundance is related to a series of diseases such as rheumatoid arthritis, cancer, cardiovascular disease, and neurodegeneration. HClO is mainly derived from mitochondria, and thus, Yin, Huo and co-workers have developed probe 24 as a mitochondria targeting “off–on” fluorescent probe for the rapid imaging of intracellular HClO (Fig. 22A).136 A benzene-conjugated benzopyrylium moiety (BB) was selected as the fluorophore due to its long emission wavelength (623 nm), with the positive charge enabling mitochondria targeting. A dimethylthiocarbamoyl-group was selected as the specific recognition/reactive site for HClO and was linked to BB by the O atom of the dimethylthiocarbamoyl-group. Initially, the fluorescence is quenched via a-PeT between the recognition group and the fluorophore. However, when HClO attacks the C![[double bond, length as m-dash]](https://www.rsc.org/images/entities/char_e001.gif) S double bond of probe 24, hydrolysis occurs, which results in cleavage of the dimethylthiocarbamoyl-group. Impressively, probe 24 shows an ultra-fast response time to HClO, with “off–on” fluorescence within five seconds (Fig. 22B). In addition, probe 24 was found to localise within the mitochondria, and the levels of HClO in HeLa cells was determined to be higher than that seen within normal healthy cells (Fig. 22C). Probe 24 was also successfully applied for the visualisation of HClO in zebrafish and nude mice, and as such, probe 24 is expected to have practical applicability for the analysis of HClO-related pathological processes and the prevention of biologically related physiological diseases.
S double bond of probe 24, hydrolysis occurs, which results in cleavage of the dimethylthiocarbamoyl-group. Impressively, probe 24 shows an ultra-fast response time to HClO, with “off–on” fluorescence within five seconds (Fig. 22B). In addition, probe 24 was found to localise within the mitochondria, and the levels of HClO in HeLa cells was determined to be higher than that seen within normal healthy cells (Fig. 22C). Probe 24 was also successfully applied for the visualisation of HClO in zebrafish and nude mice, and as such, probe 24 is expected to have practical applicability for the analysis of HClO-related pathological processes and the prevention of biologically related physiological diseases.
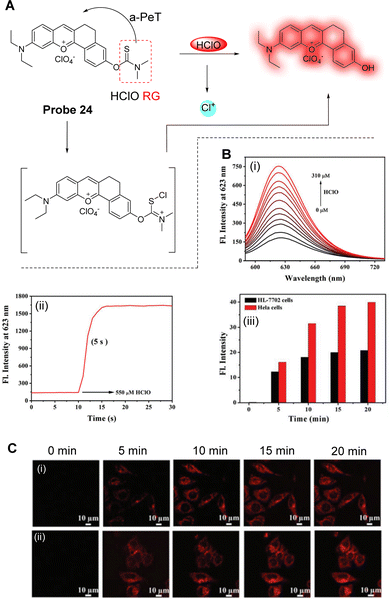 | ||
| Fig. 22 (A) The detection mechanism of probe 24 for HClO. (B) (i) Fluorescence titration of probe 24 (10 μM) with different concentrations of HClO (0–310 μM); (ii) the response time of probe 24 towards HClO (550 μM; conditions: PBS solution at pH 7.4, λex = 567 nm, and slit: 5 nm/5 nm). (C) (i and ii) Time-dependent images of HL-7702 and HeLa cells incubated with probe 24 (10 μM) after 5 min; (iii) the corresponding average fluorescence intensities of the red channel (λex = 561 nm, λem = 600–650 nm). (RG = Recognition Group) Reproduced from ref. 136 with permission from the Royal Society of Chemistry, copyright 2021. | ||
Excessive ONOO− can destroy biomolecules, cause damage to the cell inner membrane structure and ultimately lead to diseases, such as inflammation and liver damage.137 During liver injury, the levels of ONOO− are enhanced and can be used as a biomarker for the disease.138 Ma, Tang and co-workers have developed a novel two-photon fluorescent probe (probe 25, Fig. 23A) to monitor the changes of ONOO− in organisms.139Probe 25 uses 1,8-naphthalimide as the fluorophore, 1,4-dihydroxybenzene as the reactive group, and the HLKPLQSKL peptide as the peroxisome targeting group, due to the high affinity with the peroxisome membrane protein (PAS8p).140–142 Initially, an a-PeT mechanism operates between the 1,4-dihydroxybenzene and the 1,8-naphthalimide, resulting in the quenching of the fluorescence of probe 25. However, on reaction with ONOO−, the 1,4-dihydroxybenzene is oxidised and consequently cleaved, meaning there is no longer any mechanism for PeT to occur. The resulting hydroxyl-group activates the ICT of the fluorophore which results in fluorescence recovery for probe 25. It exhibits a good linear relationship with changing concentrations of ONOO−, and the detection limit was determined to be 6.2 nM. It was also used to detect the levels of ONOO− in the peroxisome of living cells induced by SIN-1 under two-photon excitation at 800 nm (Fig. 23B). More importantly, probe 25 could be used for the in situ imaging of ONOO− in the liver of mice with carbon tetrachloride induced acute liver injury (Fig. 23C).
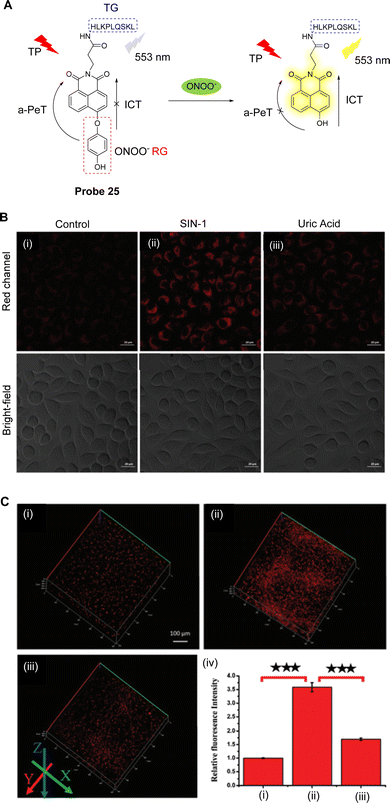 | ||
| Fig. 23 (A) The detection mechanism of probe 25 for ONOO−. (B) TP fluorescence confocal images of ONOO− in SMMC-7721 cells (i) stained with probe 25 (5 μM, 30 min); (ii) exposed to SIN-1 (1 mM, 30 min) and then incubated with probe 25 (5 μM, 30 min); (iii) exposed to SIN-1 (1 mM, 30 min) and then treated with uric acid (100 μM, 2 h), followed by incubation with probe 25 (5 μM, 30 min). (C) TP fluorescence confocal images of ONOO− in the livers of mice: (i) control; (ii) livers of the mice with CCl4; (iii) livers of the mice with uric acid; (iv) the relative fluorescence intensities of (i–iii). (RG = Recognition Group; TG = Targeting Group) Reproduced from ref. 139 with permission from the Royal Society of Chemistry, copyright 2019. | ||
3.3 PeT-based fluorescent probes for biological thiols
Biothiols, including cysteine (Cys), homocysteine (Hcy) and glutathione (GSH), are widely distributed in living organisms and are involved in many physiological and pathological processes.122,143–147 Cys, Hcy and GSH are the most abundant low molecular weight endogenous biothiols and play an important role in controlling the damage of free radicals and toxins to biological systems, and in maintaining bioredox homeostasis.148 The level of biological thiols in cells is related to the incidence and development of many diseases, such as liver damage, Alzheimer's disease, and cancer.149–151 Therefore, the biological and chemical functions of biothiols in organisms has attracted significant attention. However, identification of such biothiols remains a significant challenge due to their similar structures and chemical properties.152–154Numerous fluorescent probes that exhibit selective responses towards Cys/Hcy/GSH have been developed. For example, the selective detection of Cys/Hcy can be achieved through cyclisation with aldehydes and conjugate addition cyclisation with acrylate. In addition, there are probes that can distinguish GSH from Cys based on aromatic substitution rearrangements and native chemical ligation (NCL).155–157 However, in order to elucidate the interrelationships of biothiols in complex physiological processes, the development of a fluorescent probe that can simultaneously selectively identify and detect biothiols remains relatively unexplored.
Cys is one of the most important sulfur-containing amino acids in cells, and abnormal changes have been associated with the occurrence and development of various diseases, such as Alzheimer's disease and cardiovascular disease.147 With this in mind, Lu and co-workers have developed a simple fluorescent probe (probe 26) for the specific detection of Cys.158 The “on–off” strategy uses BODIPY and acrylate as the fluorophore and reactive group, respectively, with the occurrence of a-PeT quenching of the probe upon Cys recognition (Fig. 24A). In the absence of Cys, probe 26 exhibits green fluorescence at 525 nm (λex = 500 nm), however, on addition of Cys, the acrylate moiety of probe 26 hydrolyses to form a hydroxyl-group, resulting in a-PeT and subsequent fluorescence quenching (Fig. 24B). This probe exhibits excellent selectivity and sensitivity for Cys with a detection limit of 37 nM, and due to its low cytotoxicity and good membrane permeability, probe 26 was used for the monitoring and imaging of Cys in living cells (Fig. 24C).
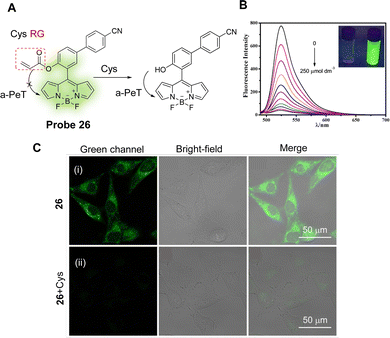 | ||
| Fig. 24 (A) The detection mechanism of probe 26 for Cys. (B) Fluorescence spectra of probe 26 (5 μM) upon addition of Cys (0–250 μM) in ACN/H2O solution. (C) Fluorescence confocal images of Cys detection in live A375 cells using probe 26 (20 μM) (i) incubated for 30 min and (ii) further incubated with Cys (1 mM) for 30 min. (RG = Recognition Group) Reproduced from ref. 158 with permission from Elsevier, copyright 2017. | ||
It is well known that a large Stokes shift is beneficial to avoid measurement errors caused by self-quenching and autofluorescence. Wu, Liu, Hao and co-workers have developed a novel phenothiazine benzothiazole-based fluorescent probe (probe 27) for the detection of biothiols (Fig. 25A).159 2-(Benzothiazol-2-yl)phenol and its derivatives have been widely employed because of their good photostability, large Stokes shift, good membrane permeability and low toxicity. The 2,4-dinitrobenzenesulfonate (DNBS) moiety was selected as a reactive group and a reaction switch for biothiols. In the absence of biothiols, the maximum absorption of probe 27 is centred at 384 nm (Fig. 25Bi), and the fluorescence is weak due to a d-PeT process to the DNBS group. After reaction with Cys, the DNBS group is cleaved and there is an associated removal of the d-PeT process, which results in a strong fluorescence response at 530 nm (Fig. 25Bii). Probe 27 exhibits a good linear relationship with changing concentrations of Cys (0.0–10 μM), and the detection limit for Cys was determined to be 0.12 μM. Additionally, the detection limits for Hcy and GSH were determined to be 0.14 and 0.21 μM, respectively. Probe 27 was successfully used to image the biothiols Cys, Hcy and GSH in A549 cells with good selectivity, high sensitivity, a large Stokes shift (117 nm), and with a significant “off–on” fluorescence signal response (148-fold).
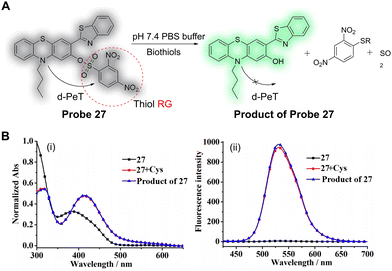 | ||
| Fig. 25 (A) The detection mechanism of probe 27 for biothiols. (B) (i) Normalised absorption and (ii) fluorescence emission spectra of probe 27 (5 μM), probe 27 (5 μM) with Cys (100 μM) with 15 min of reaction time, and the product of probe 27 (5 μM) in the solution containing PBS buffer (pH = 7.4, 50.0 mM) and 20% DMSO (λex = 413 nm). (RG = Recognition Group) Reproduced from ref. 159 with permission from MDPI, copyright 2019. | ||
Both Cys and Hcy play essential roles in many biological processes and are related to the occurrence and development of many diseases, such as cardiovascular diseases and osteoporosis. Yang and co-workers have developed the highly sensitive and selective fluorescent probe 28 (Fig. 26A).160 A pyrazolyl-coumarin was selected as the fluorophore and a propynamide was introduced as the recognition group for the detection of Cys/Hcy. Initially, there is electron transfer from the coumarin to the pyrazole unit, resulting in a d-PeT process and weak fluorescence in an aqueous medium. However, in the presence of Cys/Hcy, a Michael addition and subsequent intermolecular rearrangement occurs, which results in the fluorescence being “switched on”, as outlined in Fig. 26A. Moreover, due to the participation of the sulfhydryl-group and the adjacent amino group of Cys/Hcy, probe 28 exhibits higher sensitivity for Cys/Hcy than for GSH and other amino acids (Fig. 26B). The detection limits of probe 28 with Cys and Hcy are 49 and 51 nM, respectively, indicating the sensitivity of this probe for the assessment of the concentration of Cys/Hcy in biological systems. As a result of this sensitivity, probe 28 was used to evaluate the concentration of endogenous Cys/Hcy in different cell lines (Fig. 26C). Moreover, the two-photon fluorescence properties of the probe enabled deep tissue monitoring and imaging of Cys.
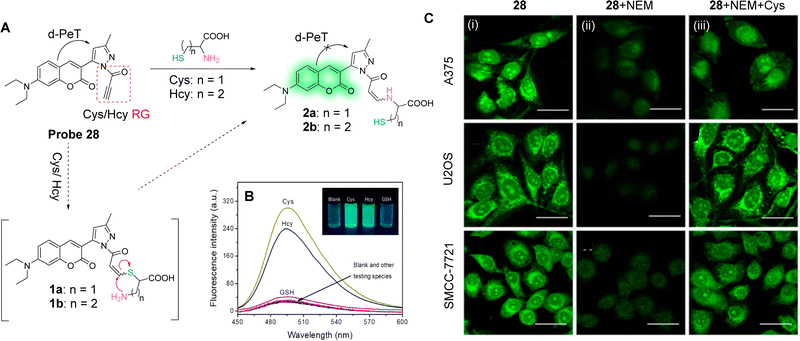 | ||
| Fig. 26 (A) The detection mechanism of probe 28 for Cys/Hcy. (B) Fluorescence spectra of probe 28 (2 μM) with the addition of various species (1 mM for glucose and GSH, 10 μM for Cys, Hcy, Pro, Arg, Val, Met, Thr, Glu, Gln, Ala, Asp, Ile, Lys, Trp, Phe, Leu, cystine, ascorbic acid, and DTT) in phosphate buffer solution. Inset: Images of probe 28 upon addition of Cys, Hcy, and GSH under UV light (365 nm). (C) Fluorescence confocal images of Cys in A375, U2OS, and SMCC-7721 cells: (i) cells incubated with probe 28 (5 μM); (ii) cells pretreated with NEM (1.0 mM) for 30 min and then incubated with probe 28 (5 μM) for 10 min; (iii) cells pretreated with 1 mM NEM for 30 min, then treated with Cys (50 μM) for 30 min, and finally incubated with probe 28 (5 μM) for 10 min. (RG = Recognition Group) Reproduced from ref. 160 with permission. from the American Chemical Society, copyright 2019. | ||
GSH, the most abundant biothiol in cells, can protect cellular components from free radicals and ROS.161 Therefore, abnormal levels of GSH in living organisms is associated with disease states, such as cancer.162 Additionally, it has been confirmed that drug resistance is correlated with intracellular GSH levels.163,164 With the view of achieving selective detection of GSH, Zhang and co-workers have developed six fluorescent probes based on o-phenylenediamine (OPD), with different leaving groups.165 Only probe 29 (Fig. 27A) showed high selectivity for GSH, with the p-aminobenzene behaving as the electron donor and the OPD as the electron acceptor. In the absence of any GSH, the p-aminophenyl-group quenches the OPD fluorescence via an a-PeT process. However, in the presence of GSH, probe 29 undergoes a specific recognition reaction with GSH, the a-PeT process is prohibited, and the fluorescence is “switched on” (Fig. 27B). Impressively, probe 29 could selectively detect GSH with a detection limit of 23 nM in the presence of multiple amino acids. Probe 29 was used for the detection and imaging of GSH in K562 and in D. magna cells (Fig. 27C and D) and, more importantly, it was used for imaging and the quantitative analysis of GSH in imatinib-resistant tumour cells.
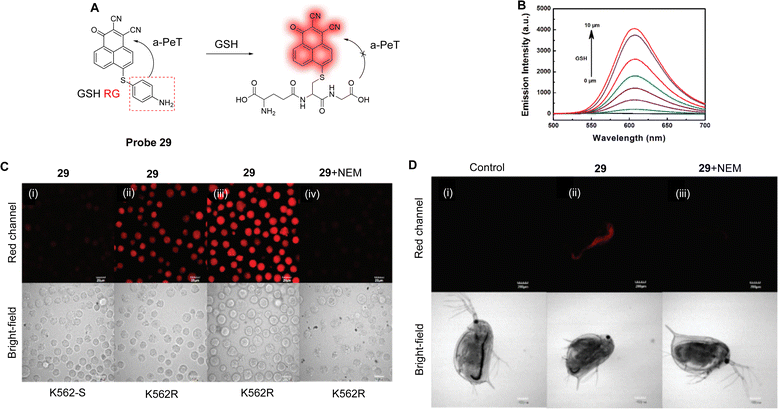 | ||
| Fig. 27 (A) The mechanism of detection of probe 29. (B) Fluorescence spectra of probe 29 (10.0 μM) after addition of GSH (100.0 μM) in PBS. (C) Fluorescence confocal imaging in K562-S and K562R cells. (i) K562-S cells; (ii) K562R with imatinib cells (0.50 μM); (iii) K562R with imatinib cells (1.0 μM) incubated with probe 29 (5.0 μM) in PBS; (iv) K562R (1.0 μM imatinib) cells were pretreated with NEM (500.0 μM) for 30 min and then further incubated with probe 29 (5.0 μM) for 30 min. (D) Fluorescence confocal images of D. magna: (i) without any treatment; (ii) D. magna incubated with probe 29 (5.0 μM); (iii) D. magna were pretreated with NEM (50.0 μM) for 1 h and then further incubated with probe 29 (5.0 μM) for 1 h. (RG = Recognition Group) Reproduced from ref. 165 with permission from the Royal Society of Chemistry, copyright 2019. | ||
One particularly effective strategy for designing cancer chemotherapeutic drug delivery systems is to use increased GSH levels to trigger drug release. 7-Ethyl-10-hydroxycamptothecin (SN-38) is the active metabolite of irinotecan (CPT-11) and is considered to be the most effective anti-tumour agent among the derivatives of camptothecin (CPT). As such, Jo and co-workers have developed the dual-function SN-38 prodrug labelled probe 30, which is highly sensitive towards GSH-triggered activation/drug release (Fig. 28A).166 Here, a 2,4-dinitrobenzenesulfonyl-(DNS) group is linked to SN-38 and can be cleaved by the nucleophilic addition of sulfhydryl-groups such as GSH and Cys. The strong electron-accepting ability of the DNS group facilitates a d-PeT process, quenching the intrinsic fluorescence of the SN-38 fluorophore. However, in the presence of GSH, the DNS group of probe 30 is cleaved and the fluorophore is released, meaning the fluorescence is restored. Probe 30 exhibits efficient prodrug activation and real-time monitoring of drug distribution and cytotoxicity comparable to SN-38 (Fig. 28B and C). Therefore, it was determined that probe 30 shows great potential as a stimuli-sensitive anti-cancer prodrug for both diagnostic and therapeutic applications.
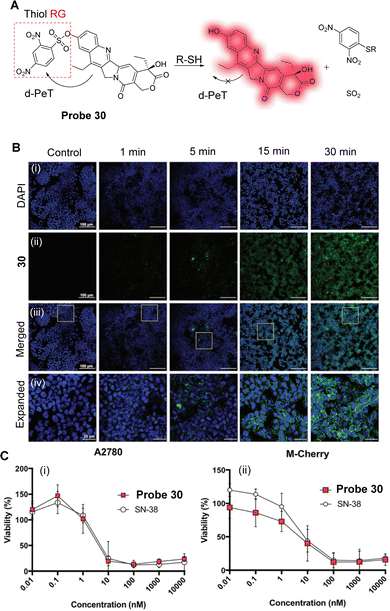 | ||
| Fig. 28 (A) Schematic illustration of probe 30's fluorescence activation mechanism in the presence of biothiols. (B) Confocal microscopic images of B16F10 cells incubated with 10 μM of probe 30 at different time-points (1, 5, 15, and 30 min) for fluorescence intensity analysis. (i) The nuclei were stained with DAPI (blue); (ii) the green fluorescence shows the location of activated probe 30; (iv) the expanded images represent the regions of interest (ROI) in yellow boxes in (iii). Scale bars of DAPI, probe 30, and merged images represent 100 mm. Scale bars of the expanded images represent 20 mm. (C) (i) 24 hour cell viability profiles for the A2780 cell line treated with either probe 30 or SN-38 at varying concentrations (nM); (ii) 24 hour cell viability profiles for the mCherry + OCSC1-F2 cell line treated with either probe 30 or SN-38 at varying concentrations (nM). The error bars represent standard deviation (n = 6). (RG = Recognition Group) Reproduced from ref. 166 with permission from the Royal Society of Chemistry, copyright 2018. | ||
The simultaneous identification of different sulfhydryl-amino acids is important for the early diagnosis of some diseases and the assessment of disease progression. Zhao, Liu and co-workers have developed a near-infrared probe (probe 31) based on an aza-BODIPY fluorophore (>700 nm) to simultaneously detect Cys, Hcy and GSH (Fig. 29A).167 Two 7-nitrobenzo-2-oxa-1,3-diazole (NBD) groups were introduced to both act as the leaving groups on reaction with thiols, and to allow for the initial “switched off” fluorescent state of the probe via a d-PeT process between the NBD and aza-BODIPY moieties. Unsurprisingly, in the presence of Cys/Hcy, the thiol group cleaves the NBD group preventing the d-PeT process from occurring. Both the NBD and aza-BODIPY fluorophores were released simultaneously with concomitant dual response fluorescence emission enhancements seen at both 540 and 730 nm, respectively. In the presence of GSH, however, the fluorescence at 540 nm was reduced by the formation of the thio-NBD instead of the proximal amino group, and only the aza-BODIPY fluorophore was released with fluorescence enhancement only seen at 730 nm. Probe 31 can simultaneously detect Cys/Hcy and GSH through dual emission channels (Fig. 29B), with detection limits of 0.08 μM for Cys, 0.17 μM for Hcy, and 0.05 μM for GSH. Furthermore, probe 31 could be used to simultaneously detect and distinguish Cys/Hcy and GSH in living cells (Fig. 29C).
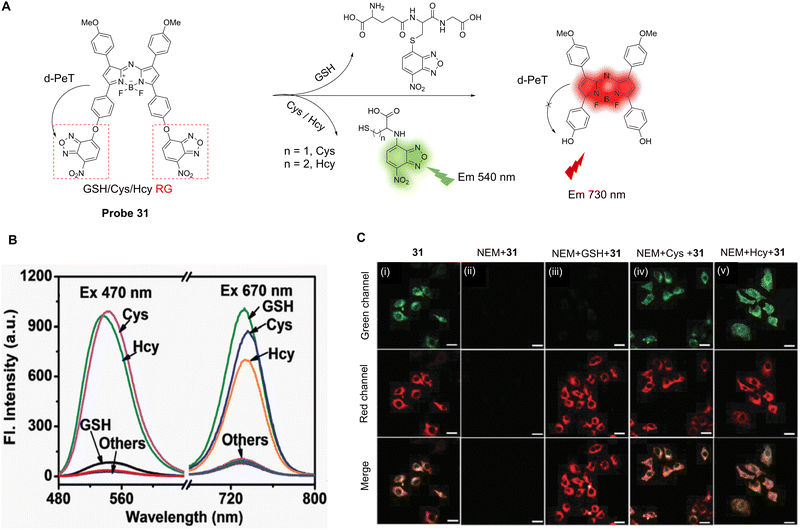 | ||
| Fig. 29 (A) The response mechanism of probe 31 for Cys, Hcy and GSH. (B) Fluorescence spectra of probe 31 (5.0 μM) in the presence of Cys, Hcy, GSH, and other amino acids (100.0 μM) in phosphate buffer. (C) Fluorescence confocal images of (i) probe 31 (5.0 μM) incubated HeLa cells for 1 h; (ii) HeLa cells pretreated with NEM (1.0 mM) for 0.5 h and then incubated with probe 31 (5.0 μM) for 1 h; (iii) HeLa cells pretreated with NEM (1.0 mM) for 0.5 h then incubated with GSH (100.0 μM); (iv and v) Cys (iv, 100.0 μM) and Hcy (v, 100.0 μM) for 1 h and then treated with probe 31 (5.0 μM) for 1 h. (RG = Recognition Group) Reproduced from ref. 167 with permission from the Royal Society of Chemistry, copyright 2017. | ||
As mentioned above, DNBS has been extensively used as an effective recognition site for biological thiols.22,151,168 Dai, Lou and co-workers have developed the curcumin-based donor–acceptor–donor (D–A–D) probe 32 for the imaging of biological thiols in living cells.149Probe 32 has a symmetric structure with curcumin boron difluoride as the fluorophore, while the DNBS group acts as the recognition (R) site creating a R–D–A–D–R system. Initially, the DNBS groups quench the fluorescence of the curcumin-based fluorophore through a d-PeT process, leading to a relatively “low background” emission. However, after the nucleophilic substitution by a biothiol occurs, the DNBS group, and consequently the d-PeT process, is removed. This results in the recovery of the red fluorescence at 610 nm. Furthermore, the ICT-effect is enhanced by the synergistic relationship of the β-diketone group and the boron difluoride moiety, which results in the generation of a longer wavelength emission. Probe 32 exhibits high sensitivity and selectivity for Cys, Hcy, and GSH (Fig. 30B), and the detection limits were determined to be 0.59 μM for Cys, 2.25 μM for Hcy, and 3.38 μM for GSH. Due to the “low background” and “off–on” response, probe 32 could be used to image endogenous biological thiols in living cells (Fig. 30C).
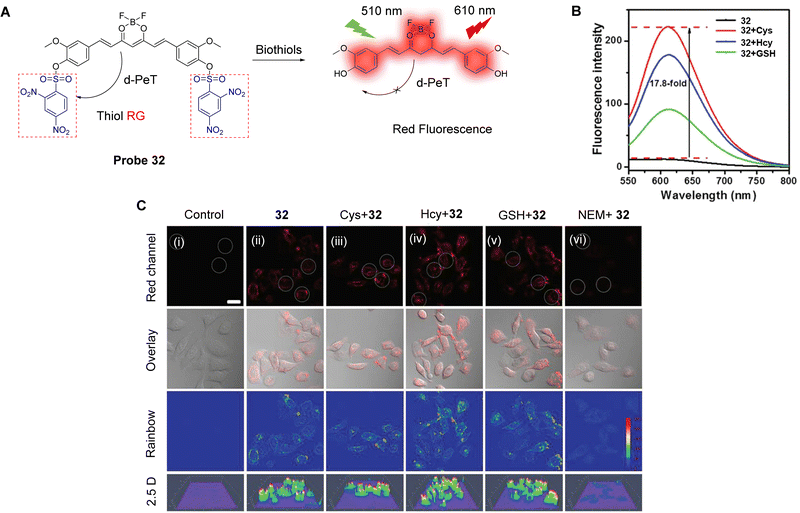 | ||
| Fig. 30 (A) The response mechanism of probe 32 for Cys, Hcy, and GSH. (B) Fluorescence spectra of probe 32 with biothiols (100 μM) in ethanol/HEPES buffer. (C) Fluorescence confocal images of living HeLa cells: (i) control; (ii) cells were incubated with probe 32 (20 μM) for 60 min; (iii–vi) cells were pretreated with Cys (iii, 100 μM), Hcy (iv, 100 μM), GSH (v, 100 μM) and NEM (vi, 1 mM) for 60 min before incubation with probe 32 for 60 min. (RG = Recognition Group) Reproduced from ref. 149 with permission from the Royal Society of Chemistry, copyright 2018. | ||
Using a similar design strategy, Chen and co-workers have also developed a novel long wavelength emitting fluorescent probe for the imaging of biothiols. The system (probe 33) was designed using DNBS once again as the electron-withdrawing and recognition group,169 with 2-(2-(2-(4′-cyano-4-hydroxybipheny-3-yl)vinyl)-6-methyl-4H-pyran-4-ylidene)malononitrile (BPMOH) used as the electron-donating group and the fluorophore (Fig. 31A). The d-PeT process between the BPMOH and DNBS moieties results in the quenching of the fluorescence of probe 33 in the absence of thiols. When Cys was added, the DNBS group was once again cleaved, and probe 33 was rapidly converted to BPMOH which resulted in red fluorescence at 645 nm (Fig. 31B). In addition, probe 33 exhibits high selectivity for biothiols, with detection limits of 17.2 nM for Cys, 21.5 nM for GSH, and 27.8 nM for Hcy. Importantly, due to its high sensitivity and large Stokes shift (133 nm), probe 33 could be used to detect and image exogenous and endogenous thiols in MCF-7 and MGC-803 cells, and in zebrafish (Fig. 31C).
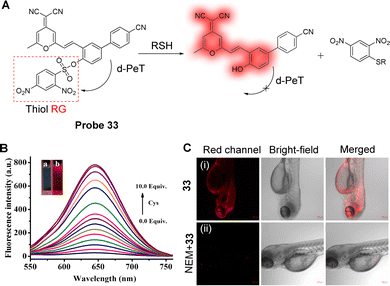 | ||
| Fig. 31 (A) The response mechanism of probe 33 for thiols. (B) Fluorescence response of probe 33 (10 μM) towards Cys (0–100 μM) in PBS buffer. Inset: The corresponding fluorescence images of probe 33 (10 μM) in the absence (left) and presence (right) of Cys (100 μM) under a 365 nm UV lamp. (C) Fluorescence confocal images of thiols in zebrafish: (i) zebrafish incubated with probe 33 (10 μM) for 30 min, and (ii) zebrafish pretreated with NEM (1 mM) for 30 min, then incubated with probe 33 (10 μM) for another 30 min. (RG = Recognition Group) Reproduced from ref. 169 with permission from Elsevier, copyright 2020. | ||
4. PeT-based fluorescent probes for biomacromolecules
Biomacromolecules are macromolecules with biological activity that exhibit complex spatial arrangements in living organisms, including proteins, nucleic acids and polysaccharides.170 Biomacromolecules are not only the components of biological organisms, but they are also the functional carriers of biological organisms.171 Compared with inorganic molecules or small biological molecules, biomacromolecules have the characteristics of large molecular weights, complex structures, wide diversity, and most importantly, multiple biological functions.171 Together with other substances in cells, they participate in many important biological functions and maintain the normal operation of the body. In addition, biomacromolecules are related to the occurrence and development of certain diseases, so they can be used as biomarkers for those diseases. Therefore, monitoring the activity of biomacromolecules is essential for understanding the progression of diseases including diabetes, cardiovascular disease, and cancer.172–175The use of fluorescent probes provides a powerful tool to help study many of the important properties of biomacromolecules,176,177 by offering a means to transform invisible physiological and pathological processes into visible ones.178–181 Over the past several years, a number of PeT-based fluorescent chemical probes have been developed for monitoring biomacromolecular activity and the diagnosis-treatment of related diseases. Some selective examples of these probes will be discussed in the following sections.
4.1 PeT-based fluorescent probes for the detection and imaging of biomacromolecules
Given that the environment of biomacromolecules is complex and changeable, control of any background noise and improvement of the visibility of the target signal is vital to realising an ideal biomacromolecular fluorescent probe (or sensor).171 As such, PeT-based fluorescent probes with high signal-to-noise ratios and “off–on” response mechanisms have been widely used for the detection and imaging of intracellular biomacromolecules. Recently, Elmes and co-workers reviewed the area of the use of 1,8-naphthalimide-based systems for monitoring enzymatic processes in real-time. This review demonstrated the wide variety of structures and targets that have been developed in recent years, using this one type of fluorophore alone.182Tyrosinase (TYR) can catalyse the synthesis of melanin by converting phenol derivatives into quinones in the presence of molecular oxygen.183 When melanin is overexpressed in cells, it can lead to the development of melanoma, which increases the risk of skin cancer.184 In addition, TYR-induced dopamine neurotoxicity and neurodegeneration have been associated with Parkinson's disease.185,186 Therefore, the development of a highly sensitive and selective TYR probe is required to help understand its role in various biochemical and pathological processes. One potential fluorescence response mechanism for the development of TYR selective fluorescent probes is the inhibition of PeT after reaction with TYR, leading to enhanced fluorescence of the probe.187 As such, Qu, Kim, Bhuniya and co-workers have developed the two-photon a-PeT-based probe (probe 34) for the detection of TYR activity. The probe uses BODIPY as the fluorophore and electron acceptor, and catechol as the recognition group and electron donor (Fig. 32A).188 In the absence of TYR, the a-PeT process between the catechol and BODIPY results in quenched fluorescence. However, in the presence of TYR, the –OH groups of the catechol are oxidised to o-quinone and the a-PeT process is inhibited, resulting in a 12.5-fold fluorescence enhancement at 450 nm (Fig. 32B). Furthermore, probe 34 exhibits good stability over a physiological pH range and can detect endogenous TYR activity using single/two-photon cell imaging (Fig. 32C).
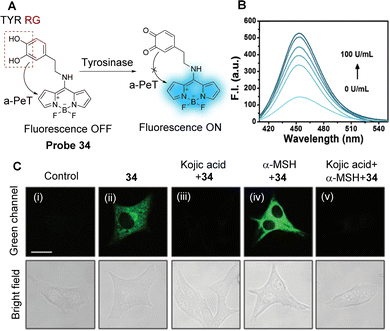 | ||
| Fig. 32 (A) The response mechanism of probe 34 for TYR. (B) Fluorescence spectra of probe 34 (5 μM) with TYR (0–100 U mL−1) in PBS buffer (pH = 7.4; 1% DMSO) at 37 °C. (C) TP fluorescence confocal images in B16F10 cells: (i) cells only (control); (ii) cells incubated with probe 34 (10 μM) for 2 h; (iii) cells pretreated with kojic acid (100 μM) for 2 h and then incubated with probe 34 for 2 h; (iv) cells pretreated with α-MSH (200 nM) for 2 h and then incubated with probe 34 for 2 h; (v) cells pretreated α-MSH and kojic acid for 2 h and then incubated with probe 34 for 2 h. (RG = Recognition Group) Reproduced from ref. 188 with permission from the Royal Society of Chemistry, copyright 2017. | ||
Using a similar design strategy, Ouyang and co-workers have developed a near-infrared fluorescent probe (probe 35) for TYR (Fig. 33A).184 To improve the targeting ability of the probe for TYR and melanosome, m-hydroxybenzyl- and morpholine groups were added to the salicyladazine skeleton, respectively. In the absence of TYR, the a-PeT process between the m-hydroxybenzyl-group and the fluorophore results in weak fluorescence. However, in the presence of TYR, the phenol is oxidised to o-quinone and the a-PeT process is inhibited, resulting in significant enhancement of the fluorescence. Probe 35 exhibits good near-infrared characteristics (λabs/λem = 480/675 nm) and has a large Stokes shift (195 nm), which effectively reduces self-quenching of fluorescence and any interference caused by excitation and scattered light.
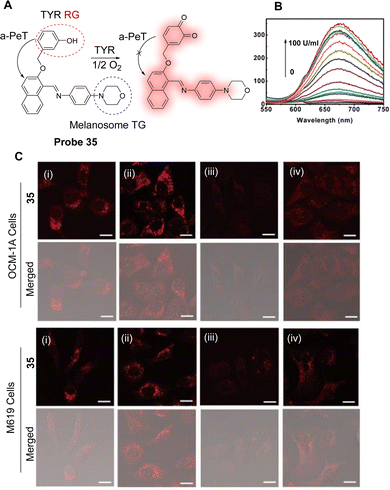 | ||
| Fig. 33 (A) The response mechanism of probe 35 for TYR. (B) Fluorescence spectra of probe 35 (30 μM) towards TYR (concentrations: 0–100 U mL−1) in PBS buffer. (C) Fluorescence confocal images of OCM-1A cells and M619 cells with probe 35: (i) cells were incubated with probe 35 (10 μM); (ii) cells were pretreated with 8-methoxypsoralen (50 μM) for 12 h, and then exposed to ultraviolet A with a dose of 1 J cm−2, and finally incubated with probe 35 (10 μM); (iii) cells were stimulated with kojic acid (a TYR inhibitor, 100 μM) for 3 h and incubated with probe 35 (10 μM); (iv) cells were pretreated with 8-methoxypsoralen (50 μM) for 12 h and exposed to ultraviolet A with a dose of 1 J cm−2, and then stimulated with kojic acid (100 μM) for 3 h, and finally incubated with probe 35 (10 μM). (RG = Recognition Group; TG = Targeting Group) Reproduced from ref. 184 with permission from the American Chemical Society, copyright 2018. | ||
Significantly, the fluorescence intensity of probe 35 (Fig. 33B) increases with increasing TYR concentrations, and the detection limit was determined as 0.5 U mL−1. Therefore, probe 35 could be used to quantitatively detect the activity of endogenous TYR in living cells. More importantly, probe 35 could be used to distinguish uveal melanoma cells with different invasive behaviours, based on the difference in levels of TYR expression. Moreover, probe 35 was used to evaluate the effect of drugs on the activity of TYR in melanoma cells (Fig. 33C). These results indicate that probe 35 can be an effective tool for monitoring diseases related to abnormal melanin and for screening drugs for TYR disorders.
Nitroreductase (NTR) is a bacterial enzyme containing flavin, which is widely present in bacteria and cells.189 In the presence of the electron donating reduced nicotinamide adenine dinucleotide (NADH), NTR can catalyse the single electron transfer of nitroaromatic compounds to generate nitro radical anions, which are then reduced to the corresponding hydroxylamine or amino compounds.190,191 Studies have shown that the activity of NTR increases when cells are under hypoxia caused by tumour overgrowth.192,193 Therefore, Sun, Ge and co-workers have developed a pyronine-pyridinium-based mitochondria targeted fluorescent probe (probe 36, Fig. 34A) for the detection and imaging of intracellular NTR.194 The nitrofuran moiety was also chosen as a recognition group for NTR. Initially, d-PeT occurs between the pyronine and the pyridinium units, resulting in fluorescence quenching. However, in the presence of NADH, NTR reduces the nitro group of the nitrofuran to generate the corresponding amino compound. The pyridine skeleton is cleaved, which removes the d-PeT pathway, and the fluorescence is consequently restored. In the presence of NADH, the fluorescence at 604 nm gradually enhances as a function of increasing NTR concentration (Fig. 34B). It exhibits a good linear relationship with NTR concentration over a range from 0–0.4 μg mL−1, with a detection limit of 2.2 ng mL−1. Probe 36 was used to selectively detect NTR in the mitochondria of living cells and enabled the monitoring of cancer cell hypoxia (Fig. 34C).
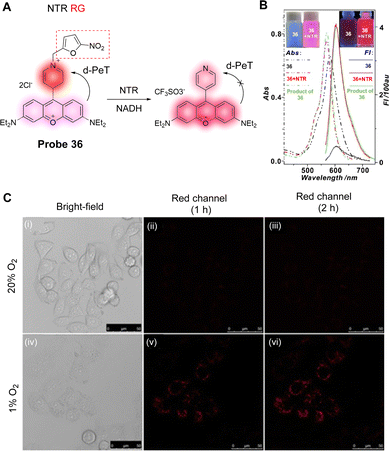 | ||
| Fig. 34 (A) The response mechanism of probe 36 for NTR. (B) Fluorescence spectra of probe 36 with NADH (100 μM) in the presence of NTR (0–4 μg mL−1). (C) Fluorescence confocal images of HeLa cells with probe 36 (200 nM) under the normoxic condition (20% O2) for (ii) 1 h and (iii) 2 h, and under the hypoxic condition (1% O2) for (v) 1 h and (vi) 2 h. (RG = Recognition Group) Reproduced from ref. 194 with permission from Elsevier, copyright 2018. | ||
Zhang, Hu and co-workers have developed an NTR-activated fluorescent probe (probe 37) based on using a cyanine dye (Cy5) as the fluorophore and electron donor (Fig. 35A),195 with a p-nitrobenzene group as an NTR recognition group and electron acceptor. Initially, there is a d-PeT process between Cy5 and the p-nitrobenzene group, which results in fluorescence quenching of probe 37. On addition of NTR in the presence of NADH, the nitro group is once again reduced to the corresponding amino group, thus removing the d-PeT mechanism, and causing a significant fluorescence enhancement. The probe exhibits a good linear correlation over a 1.0–5.0 μg mL−1 range (Fig. 35B), with a detection limit of 36.9 ng mL−1. Cellular imaging indicated that the probe could selectively detect NTR, and it could be used to image NTR activity in live bacterial pathogens in real-time (Fig. 35C). Therefore, probe 37 exhibits great potential as a rapid and non-invasive detection method for the diagnosis of infections and for guiding the selection of antimicrobial agents.
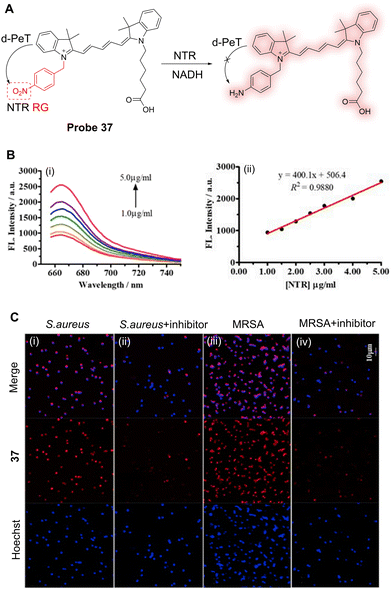 | ||
| Fig. 35 (A) The response mechanism of probe 37 for NTR. (B) (i) Fluorescence spectra of probe 37 (10 μM) reacting with NTR in the presence of NADH (500 μM) at 37 °C for 60 min; (ii) the linear correlation between the concentration of NTR and the fluorescence intensity of probe 37. (C) Fluorescence confocal images of (i and ii) S. aureus and (iii and iv) MRSA incubated with probe 37 (10 μM) in the (i and iii) absence or (ii and iv) presence of NTR inhibitor (dicoumarin [0.1 mM]), respectively. The DNA was stained with Hoechst 33258 (blue); Red: probe 37 signals. (RG = Recognition Group) Reproduced from ref. 195 with permission from Elsevier, copyright 2019. | ||
Pim serine protein kinases are pathogenic enzymes and have been recognised as potential diagnostic markers for cancer.196,197 Pim-1 kinase is highly expressed and secreted in a variety of cancers, including head and neck, prostate, breast and gastric cancers.192,198,199 Given its close association with the occurrence of cancer, Pim-1 has attracted considerable attention in recent years. As such, Fan and co-workers have developed an “off–on” fluorescent probe (probe 38) for Pim-1 (Fig. 36A).200 Nile blue (NB) was selected as the fluorophore and electron acceptor due to its long excitation/emission wavelengths, high fluorescence quantum yield, and good light stability. 5-Bromobenzofuran-2-carboxylic acid (BF) was selected due to its ability to act as both an inhibitor of Pim-1 and as an electron donor. The NB and BF groups are connected via a hexamethylenediamine linker, with a distance between the two calculated to be 1.0 nm. It was proposed by the authors that the inclusion of this linker allows for probe 38 to exist in a folded state in aqueous solution.
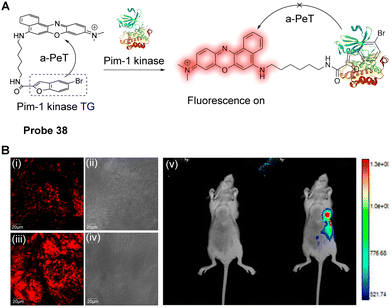 | ||
| Fig. 36 (A) The response mechanism of probe 38 for Pim-1 kinase. (B) Fluorescence images of probe 38 in live tissues and nude mice: (i and ii) normal tissues and (iii and iv) breast cancer tissues were stained with probe 38 (8 μM) for 5 min at 37 °C; (v) mice were treated with probe 38 (200 μM/100 μL PBS) via subcutaneous injection and incubated for 30 min. (TG = Targeting Group) Reproduced from ref. 200 with permission from the American Chemical Society, copyright 2018. | ||
The oscillator strength between the HOMO and LUMO of probe 38 is only 0.059, so electron transfer cannot occur, however, an a-PeT process can occur between the fluorophore (NB) and the inhibitor (BF), which results in fluorescence quenching of the probe. Once BF is inserted into the hydrophobic cavity of Pim-1, however, probe 38 becomes unfolded and a-PeT is inhibited which results in fluorescence recovery. Probe 38 exhibited good selectivity for Pim-1 and can distinguish between tumour and healthy tissue. Additionally, the probe can be used for tumour labelling and imaging in vivo (Fig. 36B).
Human serum albumin (HSA) is the most abundant transporter in the human circulatory system.201 Abnormal HSA concentrations are associated with diabetes, kidney disease, and cancer, amongst other diseases.202,203 Therefore, the quantitative detection and biological imaging of HSA is of great significance for monitoring many physiological and pathological processes. Duan, Zhang, Qian and co-workers have developed two fluorescent probes (probes 39 and 40) to specifically detect the expression of HSA in cancer cells.204 The probes are based on connecting a coumarin fluorophore with indomethacin through the use of different linker lengths (Fig. 37A). Initially, the probes emit weak fluorescence due to the d-PeT process between the coumarin and indomethacin when in a folded conformation. However, when the indomethacin moiety binds to the hydrophobic cavity of HSA, any d-PeT processes between the coumarin and indomethacin are inhibited, resulting in a significantly enhanced fluorescence with notable blue-shifts (from 550 to 475 nm). Evaluation of the spectral response to HSA indicates that probe 40 exhibits a ratiometric fluorescent response to HSA, while probes 39 exhibits an “off–on” fluorescence response to HSA. The detection limits of probes 39 and probe 40 for HSA were determined to be 8.1 × 10⁻⁷ M and 1.15 × 10⁻⁵ M, respectively. Probe 39 and probe 40 could be used to differentiate cancer cells from normal cells by confocal fluorescence imaging (Fig. 37B and C).
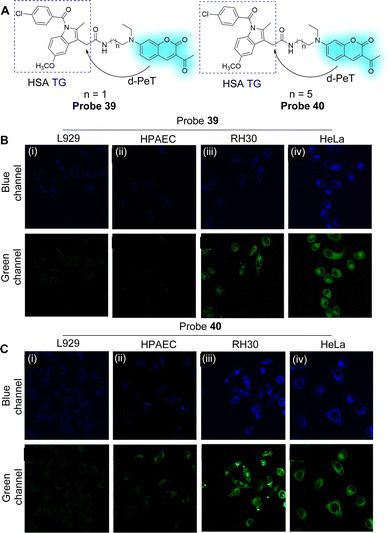 | ||
| Fig. 37 (A) The chemical structures of probe 39 and probe 40. (B) Fluorescence confocal imaging of (i) L929, (ii) HPAEC, (iii) RH30, and (iv) HeLa cells stained with probe 39 (5.0 μM). (C) Fluorescence confocal imaging of (i) L929, (ii) HPAEC, (iii) RH30, and (iv) HeLa cells stained with probe 40 (5.0 μM). (TG = Targeting Group) Reproduced from ref. 204 with permission from Elsevier, copyright 2020. | ||
A prostate-specific membrane antigen (PSMA) is specifically and highly expressed in prostate cancer.205,206 As such, it has received extensive attention as an imaging and therapeutic target for this type of cancer, with the carboxypeptidase of PSMA used as a specific target. Kamiya, Urano and co-workers have developed a series of fluorescent probes which are activated by carboxypeptidase.207 Amongst them, probe 41 was developed by linking an aryl-glutamate (Glu) to a xanthene-derived fluorophore through an azoformyl- (AF) moiety (Fig. 38A). By using Glu–AF–Ph as the recognition group and electron acceptor, the fluorescence of probe 41 is quenched by a d-PeT process from the electron donating xanthene-derived fluorophore. When probe 41 interacts with the carboxypeptidase of PSMA, hydrolysis occurs, the azoformylglutamate group is cleaved, and the d-PeT process is inhibited. This is concurrent with the release of the xanthene moiety which allows for the fluorescence of the probe to be restored. Not only was probe 41 successfully used to detect the activity of carboxypeptidase PSMA-expressing cells (Fig. 38B), but after the specimens of prostate cancer patients were incubated with probe 41, a significant fluorescence activation in the cancer regions was observed (Fig. 38C).
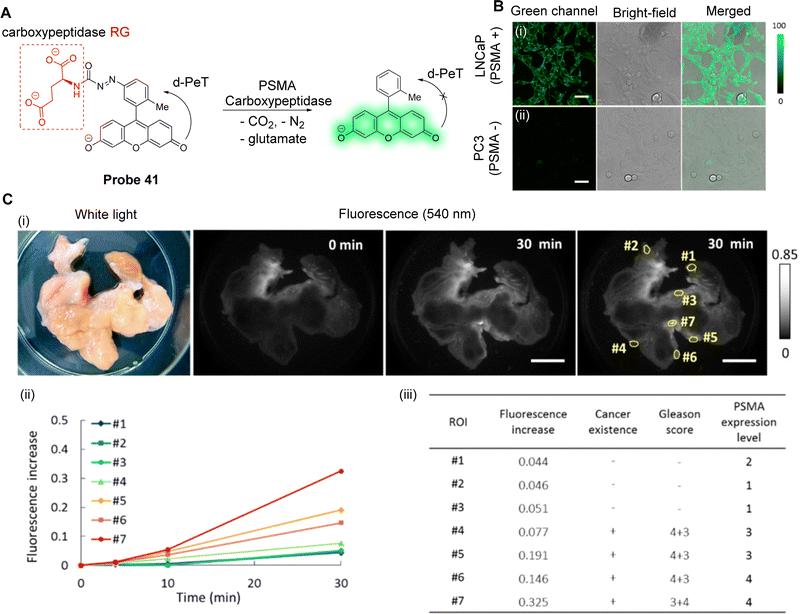 | ||
| Fig. 38 (A) The response mechanism of probe 41 for PSMA carboxypeptidase. (B) Fluorescence confocal imaging of LNCaP cells and PC3 cells treated with probe 41 (10.0 μM) for 5 h at 37 °C. (C) (i) White-light and fluorescence images of resected tissue after incubation with probe 41 for 0 and 30 min. The specimen was incubated with a solution of probe 41 (50 μM) in tris-buffered saline, pH 7.4, for 30 min on a heating plate (40 °C). (ii) Time course of fluorescence activation during incubation for 30 min with probe 41 at the regions of interest indicated in (i). (iii) Table of fluorescence increase, cancer existence, Gleason score, and PSMA expression level at each region of interest indicated in (i). (RG = Recognition Group) Reproduced from ref. 207 with permission from the American Chemical Society, copyright 2019. | ||
4.2 Enzyme-targeted PeT fluorescent probes for disease diagnosis and treatment
Chemotherapy is currently one of the most effective treatments for cancer, however, due to the low bioavailability of conventional chemotherapeutics, the treatment efficiency is low and the side effects can be significant.208 Therefore, improving the selectivity for tumour cells and the therapeutic effect is essential for effective cancer chemotherapy.209,210 One approach to chemotherapy makes use of molecular prodrugs combined with fluorescent dyes to help realise the early diagnosis and real-time monitoring of the activation process of prodrugs in the treatment of cancer.211,212 In recent years, some enzyme-activated prodrug fluorescent probes have been developed that release toxic anti-cancer drugs upon enzymatic reaction, with these probes having been used to help visualise and selectively kill cancer cells.213,214Fan and co-workers have reported an aminopeptidase N (APN)-activated theranostic prodrug (probe 42) for fluorescence-based cancer diagnosis and tumour therapy (Fig. 39A).208 The probe uses an electron donating melphalan analogue as the recognition group for APN, and the electron accepting NB as the fluorophore, with the two groups linked by hexamethylenediamine. Initially, there is an a-PeT process between the melphalan and NB fluorophore, which results in the weak fluorescence of probe 42 at 680 nm. However, after being activated by APN, the amide bond is hydrolysed which inhibits the a-PeT process and enables enhancement of the fluorescence at 680 nm. At the same time, the non-toxic prodrug is converted into the highly toxic free melphalan which can induce cell death. There is a good linear relationship between the fluorescence intensity of probe 42 and the concentration of APN in the range of 0–7 ng mL−1 (Fig. 39B), with a calculated detection limit of 0.75 ng mL−1. Probe 42 could be used for the in situ tracking of drug release in a tumour-bearing mouse model and exhibited effective tumour suppression (Fig. 39C and D). As such, probe 42 represents a new platform for tumour diagnosis and therapy.
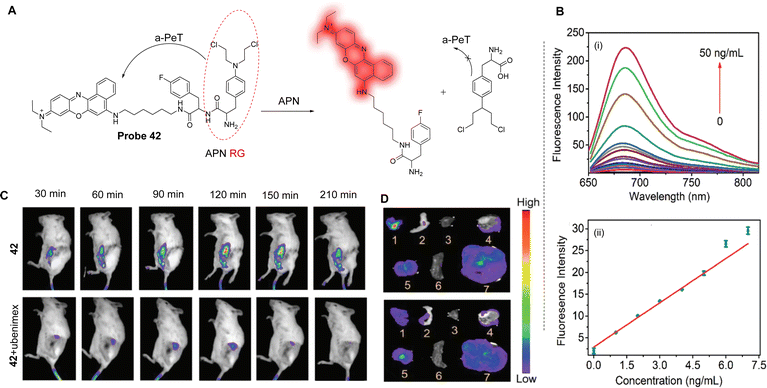 | ||
| Fig. 39 (A) The response mechanism of probe 42 for APN. (B) (i) Fluorescence emission spectra of probe 42 after treatment with APN (0–50 ng mL−1); (ii) the linear fit of fluorescence intensity at 680 nm versus the concentration of APN from 0–7.0 ng mL−1. (C) Fluorescence imaging of probe 42 in B16/BL6 tumour-bearing mice pretreated with (bottom) and without (top) ubenimex. (D) Activation of probe 42 in different organs after intravenous injection (1. tumour, 2. intestinal, 3. heart, 4. lung, 5. kidney, 6. spleen, 7. liver). (RG = Recognition Group) Reproduced from ref. 208 with permission from Wiley, copyright 2018. | ||
DT-diaphorase is a cytoplasmic flavanase, which is overexpressed in many tumour cells/tissues such as in breast, non-small cell lung, colorectal and cervical cancers. As a result, DT-diaphorase substrates have attracted considerable attention as candidate enzymes for cancer diagnosis. With this in mind, Zeng, Wu and co-workers have developed a pro-prodrug nanosystem for cancer detection and treatment based on the PeT process,213 which features enzyme-activated fluorescence emission and subsequent photo-triggered drug release. The pro-prodrug (probe 43) contains the anticancer drug methotrexate (MTX), the DT-diaphorase responsive moiety (quinone propionic acid), and a coumarin-derived fluorophore (Fig. 40A). Initially, in the absence of DT-diaphorase, quinone propionic acid quenches the fluorescence of coumarin through a d-PeT process and blocks the photo-cleavage pathway. In the presence of DT-diaphorase, the enzyme cleaves the quinone propionic group, which removes the d-PeT process and restores the fluorescence of coumarin (Fig. 40B). This response was used to assess the levels of the DT-diaphorase biomarker and was used to distinguish tumour cells from normal cells (Fig. 40C). The presence of the enzyme also allows for the release of the active drug MTX, which can be activated via single-photon or two-photon irradiation. This pro-prodrug nanosystem is highly cytotoxic to cancer cells and has a negligible effect on normal cells, which shows that this strategy could provide a pathway for the development of photoinduced PeT-based pro-prodrugs using enzymes as activators.
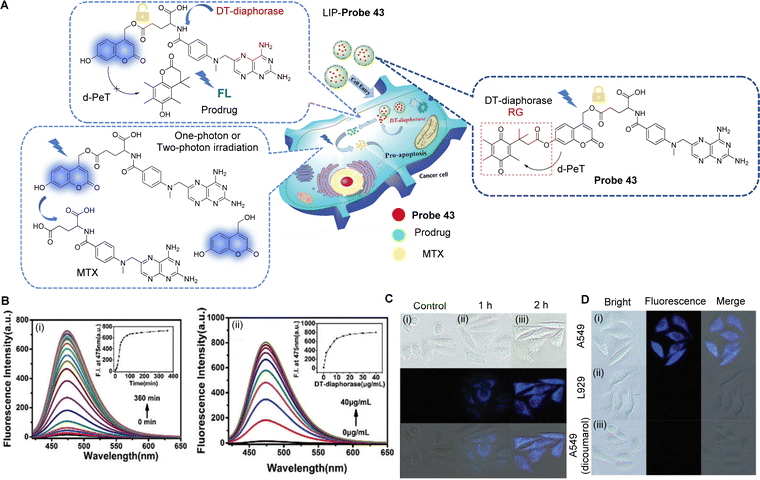 | ||
| Fig. 40 (A) Schematic overview of a pro-prodrug nanosystem (LIP-Probe 43) for imaging and therapy. (B) (i) Time course of fluorescence of probe 43 (5 μM) in the presence of DT-diaphorase (20 μg mL−1). Inset: Change in fluorescence intensity at 475 nm as a function of time after DT-diaphorase (20 μg mL−1) treatment; (ii) Fluorescence spectra for probe 43 (5 μM) after treatment with various concentrations of DT-diaphorase (0–40 μg mL−1). Inset: Change in fluorescence intensity at 475 nm as a function of DT-diaphorase concentration. (C) Fluorescence microscopic images for A549 cells that have been treated with LIP-probe 43 (20 μg mL−1, with an incubation time of (ii) 1 h or (iii) 2 h) or (i) without LIP-probe 43 (control). (D) Fluorescence microscopic images for (i) A549 cells and (ii) L929 cells upon incubation LIP-probe 43 (20 μg mL−1) for 2 h; (iii) images of A549 cells pretreated with 20 μM of dicoumarol (the inhibitor of DT-diaphorase) for 30 min and then incubated with LIP-probe 43 (20 μg mL−1) for 2 h. (RG = Recognition Group) Reproduced from ref. 213 with permission from the Royal Society of Chemistry, copyright 2018. | ||
Recently, Gunnlaugsson, Scanlan and co-workers have developed several examples of enzyme-triggered probes or drug-release systems.215,216 The first family of these systems is based on the concept of a “pro-probe”, where a 1,8-naphthalimide-derived glycan system (probes 44a–d) is released into cancer cells that overexpress a glycosidase (Fig. 41A).215 There are clear changes in the confocal microscopic images of probe 44a (Fig. 41B) after exposure to glycosidase, an enzyme that facilitates the uptake of the naphthalimide moiety into cells via endocytosis. In the case of probe 44a, the naphthalimide unit was shown not to be cytotoxic, and hence, probe 44a could only be employed as an imaging agent. However, the authors have recently extended their work by developing probes 45a and b which are based on the 3-amino-1,8-naphthalimide drug Amonafide. Probes 45a and b have been shown to exhibit PeT properties, with the naphthalimide fluorophore separated from the glycan unit via a self-immolative linker (Fig. 42A).216
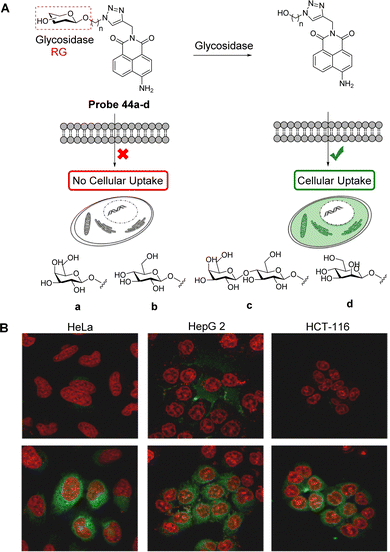 | ||
| Fig. 41 (A) Glycosidase activation of the glycosylated naphthalimide ‘pro-probes’ (probe 44a–d). (B) The demonstration of the release of the active probe into cancer cells: Top row, incubation of probe 44a (0.1 mM) for 3 h in cancer cell lines. Bottom row: Incubation of probe 44a (0.1 mM) for 3 h and β-galactosidase (1 eq.) for 1 h, demonstrating the release of the probe into the cells. (RG = Recognition Group) Reproduced from ref. 215 with permission from the Royal Society of Chemistry, copyright 2016. | ||
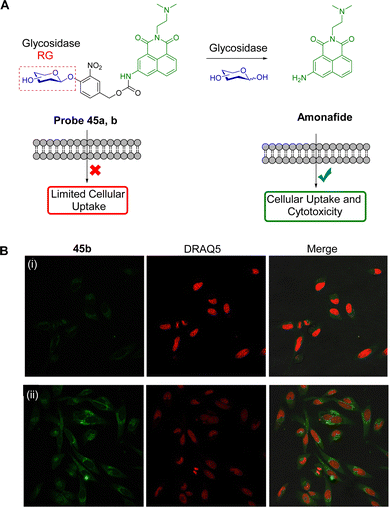 | ||
| Fig. 42 (A) The novel glycosylated naphthalimide probes 45a and b, based on the drug candidate Amonafide possessing either glucuronic acid (a) or galactosyl- (b) derivatives. (B) Incubation of HeLa cells for 1 h with (i) probe 45b (50 μM) and (ii) probe 45b (50 μM, 1 h further) with β-glucuronidase (1 U, 1 h). (RG = Recognition Group) Reproduced from ref. 216 with permission from Wiley, copyright 2022. | ||
Amonafide has been previously demonstrated to have excellent activity in phase II breast cancer clinical trials. However, it failed in phase III clinical trials due to acute side effects and dose-limiting bone marrow toxicity. Hence, the authors proposed converting this structure into a prodrug by converting it into a glycoconjugated form. This group can be cleaved using endogenous enzymes that are overexpressed in certain cancers, potentially overcoming this side effect, and providing an activated release of the therapeutic component in real-time and in a highly targeted manner. Due to its ability to offer a unique insight into the prodrug pharmacokinetic profile, the authors demonstrated using both single- and two-photon bioimaging that there was only minor cellular uptake in the absence of β-glucuronidase, and there was a large enhancement in the naphthalimide emission seen upon addition of 1 U of the enzyme. Gratifyingly, while no effective toxicity was observed for the prodrug probes 45a or b, the release of the active Amonafide form upon enzymatic triggering gave rise to IC50 values that were comparable with that of Amonafide itself.216 Hence, these results demonstrate the potential and emerging application of PeT-based prodrugs for use as cancer therapeutics.
5. Conclusions and perspectives
This review focuses on the role of the PeT process in the development of fluorescent systems and summarises recent research towards fluorescent-based probes using the PeT mechanism for cell imaging and disease diagnosis. This includes the cell microenvironment (polarity and pH), bioactive small molecules (reactive oxygen species, gaseous small molecules and biothiols), biological macromolecules, etc. In addition, this review concentrates on the application of PeT-based fluorescent probes for the diagnosis and treatment of diseases. Since its inception, PeT has become a particularly popular design strategy for the development of switchable “on–off” or “off–on” based fluorescent probes. However, the application and scope of PeT-based systems is still limited. For example, PeT-based fluorescent probes for measuring cell polarity remain scarce. Similarly, reported examples of fluorescence-based PeT prodrugs, while eminently suitable for cancer diagnosis and treatment, are rare. One of the reasons is that the number of suitable recognition groups needs to be extended to become more diverse. More flexible linkers between fluorophores and recognition groups also need to be developed to improve both fluorescence response and targeting efficiency. While some excellent examples of such systems have recently been developed, the area is relatively undeveloped.There also exist some limitations and disadvantages to the PeT mechanism. For example, the PeT mechanism can only influence the fluorescence intensity of a fluorophore and the peak position does not change. Also, in complex biological environments, a “turn-off”/“turn-on” mode of response is sensitive to the local concentration of the probe. However, despite the shortcomings of PeT-based systems we hope on reading this review researchers will be encouraged to develop PeT-based systems that can overcome these limitations. Going forward, we hope that this review will help provide a better understanding of PeT and provide suitable design strategies to enable the development of improved PeT-based fluorescent probes.
In particular, computational methods will facilitate a better understanding of the relative electron density and energy differences between different fluorophores and recognition groups. This will allow for the development of PeT-based systems with improved performance that will be suitable for a wider range of applications. In the future, we expect that the PeT process could be precisely regulated, enabling the development of PeT-based fluorescent prodrugs for cancer with improved therapeutic effect and reduced side effects.
In this review, we describe PeT-based fluorescent probes with applications in various pathophysiological processes, which clearly illustrates that the field remains full of challenges but is also burgeoning with opportunities. We expect that with the continued development of fluorescence imaging technology, PeT-based fluorescent probes will continue to provide practical assistance for medical imaging and clinical surgery in the not too distant future. We hope this review will help researchers to develop a better understanding of PeT-based fluorescent probes, both for facilitating the development of improved systems for disease related biological processes, and for disease diagnosis and treatment.
Conflicts of interest
There are no conflicts to declare.Acknowledgements
This work was supported by the National Natural Science Foundation of China (U21A20314, 22107089, 21722501); T. D. J. wishes to thank the Royal Society for a Wolfson Research Merit Award and the Open Research Fund of the School of Chemistry and Chemical Engineering, Henan Normal University for support (2020ZD01). T. D. J. has been appointed as an Outstanding Talent by Henan Normal University. T. G. and H. M. O. C. thank the Irish Research Council for support (IRC: GOIPD/2020/849).Notes and references
- A. P. de Silva and R. A. D. D. Rupasinghe, J. Chem. Soc., Chem. Commun., 1985, 23, 1669–1670 RSC.
- (a) R. A. Bissell, A. P. de Silva, H. Q. Nimal Gunaratne, P. L. Mark Lynch, G. E. M. Maguire, C. P. McCoy and K. R. A. S. Sandanayake, Top. Curr. Chem., 1993, 168, 223–264 CrossRef CAS; (b) A. P. de Silva, T. S. Moody and G. D. Wright, Analyst, 2009, 134, 2385–2393 RSC; (c) A. P. de Silva, Molecular Logic-based Computation, Royal Society of Chemistry, Cambridge, UK, 2013 Search PubMed; (d) S. E. Cakmak, S. Kolemen, T. Gunnlaugsson, T. D. James, J. Yoon and E. U. Akkaya, Chem. Soc. Rev., 2018, 47, 2228–2248 RSC.
- K. J. Bruemmer, S. W. M. Crossley and C. J. Chang, Angew. Chem., Int. Ed., 2020, 59, 13734–13762 CrossRef CAS PubMed.
- J. Zhang, X. Chai, X.-P. He, H.-J. Kim, J. Yoon and H. Tian, Chem. Soc. Rev., 2019, 48, 683–722 RSC.
- D. Escudero, Acc. Chem. Res., 2016, 49, 1816–1824 CrossRef CAS PubMed.
- B. Dong, X. Song, C. Wang, X. Kong, Y. Tang and W. Lin, Anal. Chem., 2016, 88, 4085–4091 CrossRef CAS PubMed.
- J. Liu, Y.-Q. Sun, Y. Huo, H. Zhang, L. Wang, P. Zhang, D. Song, Y. Shi and W. Guo, J. Am. Chem. Soc., 2014, 136, 574–577 CrossRef CAS PubMed.
- S. Singha, D. Kim, H. Seo, S. W. Cho and K. H. Ahn, Chem. Soc. Rev., 2015, 44, 4367–4399 RSC.
- T. Matsumoto, Y. Urano, T. Shoda, H. Kojima and T. Nagano, Org. Lett., 2007, 9, 3375–3377 CrossRef CAS PubMed.
- L. Yang, J.-Y. Niu, R. Sun, Y.-J. Xu and J.-F. Ge, Org. Biomol. Chem., 2017, 15, 8402–8409 RSC.
- H.-C. Xia, X.-H. Xu and Q.-H. Song, Anal. Chem., 2017, 89, 4192–4197 CrossRef CAS PubMed.
- R. Wang, F. Yu, L. Chen, H. Chen, L. Wang and W. Zhang, Chem. Commun., 2012, 48, 11757–11759 RSC.
- P. Xiao, J. Liu, Z. Wang, F. Tao, L. Yang, G. Yuan, W. Sun and X. Zhang, Chem. Commun., 2021, 57, 5012–5015 RSC.
- Q. Sun, S.-H. Yang, L. Wu, Q.-J. Dong, W.-C. Yang and G.-F. Yang, Anal. Chem., 2016, 88, 6084–6091 CrossRef CAS PubMed.
- W. Zhang, P. Li, F. Yang, X. Hu, C. Sun, W. Zhang, D. Chen and B. Tang, J. Am. Chem. Soc., 2013, 135, 14956–14959 CrossRef CAS PubMed.
- Y. Wu, X. Peng, B. Guo, J. Fan, Z. Zhang, J. Wang, A. Cui and Y. Gao, Org. Biomol. Chem., 2005, 3, 1387–1392 RSC.
- J. Fan, K. Guo, X. Peng, J. Du, J. Wang, S. Sun and H. Li, Sens. Actuators, B, 2009, 142, 191–196 CrossRef CAS.
- J. Fan, X. Liu, M. Hu, H. Zhu, F. Song and X. Peng, Anal. Chim. Acta, 2012, 735, 107–113 CrossRef CAS PubMed.
- M. Tian, X. Peng, F. Feng, S. Meng, J. Fan and S. Sun, Dyes Pigm., 2009, 81, 58–62 CrossRef CAS.
- M. H. Lee, N. Park, C. Yi, J. H. Han, J. H. Hong, K. P. Kim, D. H. Kang, J. L. Sessler, C. Kang and J. S. Kim, J. Am. Chem. Soc., 2014, 136, 14136–14142 CrossRef CAS PubMed.
- H. Zhu, J. Fan, J. Wang, H. Mu and X. Peng, J. Am. Chem. Soc., 2014, 136, 12820–12823 CrossRef CAS PubMed.
- J. Fan, Z. Han, Y. Kang and X. Peng, Sci. Rep., 2016, 6, 19562 CrossRef CAS PubMed.
- D. Zhang, N. Xu, H. Li, Q. Yao, F. Xu, J. Fan, J. Du and X. Peng, Ind. Eng. Chem. Res., 2017, 56, 9303–9309 CrossRef CAS.
- B. A. Webb, M. Chimenti, M. P. Jacobson and D. L. Barber, Nat. Rev. Cancer, 2011, 11, 671–677 CrossRef CAS PubMed.
- L. A. Flugge, L. A. Miller-Deist and P. A. Petillo, Chem. Biol., 1999, 6, R157–R166 CrossRef CAS PubMed.
- G. Hong, A. L. Antaris and H. Dai, Nat. Biomed. Eng., 2017, 1, 0010 CrossRef CAS.
- S. Wang, W. X. Ren, J. T. Hou, M. Won, J. An, X. Chen, J. Shu and J. S. Kim, Chem. Soc. Rev., 2021, 50, 8887–8902 RSC.
- H. Zhu, J. Fan, H. Mu, T. Zhu, Z. Zhang, J. Du and X. Peng, Sci. Rep., 2016, 6, 35627 CrossRef CAS PubMed.
- S. Y. Kim, A. Podder, H. Lee, Y.-J. Cho, E. H. Han, S. Khatun, J. L. Sessler, K. S. Hong and S. Bhuniya, Chem. Sci., 2020, 11, 9875–9883 RSC.
- U. Haldar, S. S. Chaudhury, R. Sharma, B. Ruidas, S. G. Patra, C. D. Mukhopadhyay and H.-I. Lee, Sens. Actuators, B, 2020, 320, 128379 CrossRef CAS.
- H. Mai, Y. Wang, S. Li, R. Jia, S. Li, Q. Peng, Y. Xie, X. Hu and S. Wu, Chem. Commun., 2019, 55, 7374–7377 RSC.
- H. Xiao, P. Li and B. Tang, Coord. Chem. Rev., 2021, 427, 213582 CrossRef CAS.
- B. Szczupak, A. G. Ryder, D. M. Togashi, A. S. Klymchenko, Y. A. Rochev, A. Gorelov and T. J. Glynn, J. Fluoresc., 2010, 20, 719–731 CrossRef CAS PubMed.
- P. Suppan, J. Chem. Soc. A, 1968, 3125–3133 RSC.
- H. Xiao, P. Li, W. Zhang and B. Tang, Chem. Sci., 2016, 7, 1588–1593 RSC.
- Z. Yang, J. Cao, Y. He, J. H. Yang, T. Kim, X. Peng and J. S. Kim, Chem. Soc. Rev., 2014, 43, 4563–4601 RSC.
- J.-T. Hou, W. X. Ren, K. Li, J. Seo, A. Sharma, X.-Q. Yu and J. S. Kim, Chem. Soc. Rev., 2017, 46, 2076–2090 RSC.
- P. Brundin and R. Wyse, Science, 2018, 362, 521–522 CrossRef CAS PubMed.
- E. Persi, M. Duran-Frigola, M. Damaghi, W. R. Roush, P. Aloy, J. L. Cleveland, R. J. Gillies and E. Ruppin, Nat. Commun., 2018, 9, 2997 CrossRef PubMed.
- E. S. Trombetta, M. Ebersold, W. Garrett, M. Pypaert and I. Mellman, Science, 2003, 299, 1400–1403 CrossRef CAS PubMed.
- Y. Yue, F. Huo, S. Lee, C. Yin and J. Yoon, Analyst, 2017, 142, 30–41 RSC.
- A. M. De Grand and J. V. Frangioni, Technol. Cancer Res. Treat., 2003, 2, 553–562 CrossRef CAS PubMed.
- D. Grimm, J. Bauer, J. Pietsch, M. Infanger, J. Eucker, C. Eilles and J. Schoenberger, Curr. Med. Chem., 2011, 18, 176–190 CrossRef CAS PubMed.
- R. Shi, L. Huang, X. Duan, G. Sun, G. Yin, R. Wang and J.-J. Zhu, Anal. Chim. Acta, 2017, 988, 66–73 CrossRef CAS PubMed.
- T. Ueno, Y. Urano, K.-I. Setsukinai, H. Takakusa, H. Kojima, K. Kikuchi, K. Ohkubo, S. Fukuzumi and T. Nagano, J. Am. Chem. Soc., 2004, 126, 14079–14085 CrossRef CAS PubMed.
- Y. Urano, M. Kamiya, K. Kanda, T. Ueno, K. Hirose and T. Nagano, J. Am. Chem. Soc., 2005, 127, 4888–4894 CrossRef CAS PubMed.
- T. Kirkegaard and M. Jaattela, Biochim. Biophys. Acta, 2009, 1793, 746–754 CrossRef CAS PubMed.
- C. Nilsson, K. Kagedal, U. Johansson and K. Ollinger, Methods Cell Sci., 2003, 25, 185–194 CrossRef PubMed.
- B. Dong, X. Song, X. Kong, C. Wang, N. Zhang and W. Lin, J. Mater. Chem. B, 2017, 5, 988–995 RSC.
- M. Martínez-Calvo, S. A. Bright, E. B. Veale, A. F. Henwood, D. C. Williams and T. Gunnlaugsson, Front. Chem. Sci. Eng., 2020, 14, 61–75 CrossRef.
- T. Yorimitsu, U. Nair, Z. Yang and D. J. Klionsky, J. Biol. Chem., 2006, 281, 30299–30304 CrossRef CAS PubMed.
- D. Senft and Z. A. Ronai, Trends Biochem. Sci., 2015, 40, 141–148 CrossRef CAS PubMed.
- M. Hoyer-Hansen and M. Jaattela, Cell Death Differ., 2007, 14, 1576–1582 CrossRef CAS PubMed.
- U. Ozcan, Q. Cao, E. Yilmaz, A.-H. Lee, N. N. Iwakoshi, E. Ozdelen, G. Tuncman, C. Gorgun, L. H. Glimcher and G. S. Hotamisligil, Science, 2004, 306, 457–461 CrossRef PubMed.
- D. L. Eizirik, A. K. Cardozo and M. Cnop, Endocr. Rev., 2008, 29, 42–61 CrossRef CAS PubMed.
- H. Xiao, R. Zhang, C. Wu, P. Li, W. Zhang and B. Tang, Sens. Actuators, B, 2018, 273, 1754–1761 CrossRef CAS.
- A. Podder, M. M. Joseph, S. Biswas, S. Samanta, K. K. Maiti and S. Bhuniya, Chem. Commun., 2021, 57, 607–610 RSC.
- W. Shen, L. Wang, S. Zhu, S. Yu, C. Cai, W. Yi and Q. Zhu, Anal. Biochem., 2020, 596, 113609 CrossRef CAS PubMed.
- D. Wu, A. C. Sedgwick, T. Gunnlaugsson, E. U. Akkaya, J. Yoon and T. D. James, Chem. Soc. Rev., 2017, 46, 7105–7123 RSC.
- K. Li, S. Xu, M. Xiong, S.-Y. Huan, L. Yuan and X.-B. Zhang, Chem. Soc. Rev., 2021, 50, 11766–11784 RSC.
- C. M. Levinn, M. M. Cerda and M. D. Pluth, Acc. Chem. Res., 2019, 52, 2723–2731 CrossRef CAS PubMed.
- D. Amilan Jose, N. Sharma, R. Sakla, R. Kaushik and S. Gadiyaram, Methods, 2019, 168, 62–75 CrossRef CAS PubMed.
- M. Valko, D. Leibfritz, J. Moncol, M. T. D. Cronin, M. Mazur and J. Telser, Int. J. Biochem. Cell Biol., 2007, 39, 44–84 CrossRef CAS PubMed.
- P. G. Winyard, B. Ryan, P. Eggleton, A. Nissim, E. Taylor, M. L. Lo Faro, T. Burkholz, K. E. Szabo-Taylor, B. Fox, N. Viner, R. C. Haigh, N. Benjamin, A. M. Jones and M. Whiteman, Biochem. Soc. Trans., 2011, 39, 1226–1232 CrossRef CAS PubMed.
- L. Wu, A. C. Sedgwick, X. Sun, S. D. Bull, X.-P. He and T. D. James, Acc. Chem. Res., 2019, 52, 2582–2597 CrossRef CAS PubMed.
- L.-Y. Niu, Y.-Z. Chen, H.-R. Zheng, L.-Z. Wu, C.-H. Tung and Q.-Z. Yang, Chem. Soc. Rev., 2015, 44, 6143–6160 RSC.
- M. S. T. Goncalves, Chem. Rev., 2009, 109, 190–212 CrossRef CAS PubMed.
- Z. Mao, W. Feng, Z. Li, L. Zeng, W. Lv and Z. Liu, Chem. Sci., 2016, 7, 5230–5235 RSC.
- L. Liang, C. Liu, X. Jiao, L. Zhao and X. Zeng, Chem. Commun., 2016, 52, 7982–7985 RSC.
- H. Zhang, L. Xu, W. Chen, J. Huang, C. Huang, J. Sheng and X. Song, Anal. Chem., 2019, 91, 1904–1911 CrossRef CAS PubMed.
- B. Arunachalam, U. T. Phan, H. J. Geuze and P. Cresswell, Proc. Natl. Acad. Sci. U. S. A., 2000, 97, 745–750 CrossRef CAS PubMed.
- D. R. Balce, E. R. O. Allan, N. McKenna and R. M. Yates, J. Biol. Chem., 2014, 289, 31891–31904 CrossRef CAS PubMed.
- S. K. Bae, C. H. Heo, D. J. Choi, D. Sen, E. H. Joe, B. R. Cho and H. M. Kim, J. Am. Chem. Soc., 2013, 135, 9915–9923 CrossRef CAS PubMed.
- F. Yu, X. Han and L. Chen, Chem. Commun., 2014, 50, 12234–12249 RSC.
- J. Yue, Y. Tao, J. Zhang, H. Wang, N. Wang and W. Zhao, Chem. – Asian J., 2021, 16, 850–855 CrossRef CAS PubMed.
- W. Jiang, Q. Fu, H. Fan, J. Ho and W. Wang, Angew. Chem., Int. Ed., 2007, 46, 8445–8448 CrossRef CAS PubMed.
- J. Ou-Yang, W.-L. Jiang, K.-Y. Tan, H.-W. Liu, S.-J. Li, J. Liu, Y.-F. Li and C.-Y. Li, Sens. Actuators, B, 2018, 260, 264–273 CrossRef CAS.
- L. Wu, J. Huang, K. Pu and T. D. James, Nat. Rev. Chem., 2021, 5, 406–421 CrossRef CAS.
- Y. Li, X. Xie, X. Yang, M. Li, X. Jiao, Y. Sun, X. Wang and B. Tang, Chem. Sci., 2017, 8, 4006–4011 RSC.
- H.-W. Liu, S. Xu, P. Wang, X.-X. Hu, J. Zhang, L. Yuan, X.-B. Zhang and W. Tan, Chem. Commun., 2016, 52, 12330–12333 RSC.
- Y. Dou, X. Gu, S. Ying, S. Zhu, S. Yu, W. Shen and Q. Zhu, Org. Biomol. Chem., 2018, 16, 712–716 RSC.
- S.-J. Li, Y.-F. Li, H.-W. Liu, D.-Y. Zhou, W.-L. Jiang, J. Ou-Yang and C.-Y. Li, Anal. Chem., 2018, 90, 9418–9425 CrossRef CAS PubMed.
- T. Zhou, Y. Yang, K. Zhou, M. Jin, M. Han, W. Li and C. Yin, Sens. Actuators, B, 2019, 301, 127116 CrossRef CAS.
- L. F. Yousif, K. M. Stewart and S. O. Kelley, ChemBioChem, 2009, 10, 1939–1950 CrossRef CAS PubMed.
- L. Galluzzi, N. Zamzami, T. de La Motte Rouge, C. Lemaire, C. Brenner and G. Kroemer, Apoptosis, 2007, 12, 803–813 CrossRef CAS PubMed.
- Z. Zhang, J. Fan, Y. Zhao, Y. Kang, J. Du and X. Peng, ACS Sens., 2018, 3, 735–741 CrossRef CAS PubMed.
- S. Yang, F. Zhou, X. Yao, W. Liu, W. Zhu, X. Qian and Y. Liu, Sens. Actuators, B, 2021, 339, 129881 CrossRef CAS.
- G. C. Brown, Nitric oxide, 2010, 23, 153–165 CrossRef CAS PubMed.
- K. Kawahara, S. Oyadomari, T. Gotoh, S. Kohsaka, H. Nakayama and M. Mori, FEBS Lett., 2001, 506, 135–139 CrossRef CAS PubMed.
- S.-J. Li, D.-Y. Zhou, Y. Li, H.-W. Liu, P. Wu, J. Ou-Yang, W.-L. Jiang and C.-Y. Li, ACS Sens., 2018, 3, 2311–2319 CrossRef CAS PubMed.
- S. R. M. C. Pacca, A. P. de Azevedo, C. F. De Oliveira, I. M. S. De Luca, G. De Nucci and E. Antunes, J. Cardiovasc. Pharmacol., 2002, 39, 201–207 CrossRef CAS PubMed.
- K. Chalupsky and H. Cai, Proc. Natl. Acad. Sci. U. S. A., 2005, 102, 9056–9061 CrossRef CAS PubMed.
- J. B. Laursen, M. Somers, S. Kurz, L. McCann, A. Warnholtz, B. A. Freeman, M. Tarpey, T. Fukai and D. G. Harrison, Circulation, 2001, 103, 1282–1288 CrossRef CAS PubMed.
- J.-L. Balligand and P. J. Cannon, Arterioscler., Thromb., Vasc. Biol., 1997, 17, 1846–1858 CrossRef CAS PubMed.
- T. Zhou, J. Wang, J. Xu, C. Zheng, Y. Niu, C. Wang, F. Xu, L. Yuan, X. Zhao, L. Liang and P. Xu, Anal. Chem., 2020, 92, 5064–5072 CrossRef CAS PubMed.
- L. Liang, W. Wang, J. Wu, F. Xu, Y. Niu, B. Xu and P. Xu, Chem. – Eur. J., 2013, 19, 13774–13782 CrossRef CAS PubMed.
- L. Yang, Y. Zhu, M. Shui, T. Zhou, Y. Cai, W. Wang, F. Xu, Y. Niu, C. Wang, J.-L. Zhang, P. Xu, L. Yuan and L. Liang, Chem. – Eur. J., 2016, 22, 12363–12370 CrossRef CAS PubMed.
- Y. Zhu, T. Zhou, L. Yang, L. Yuan, L. Liang and P. Xu, Biochem. Biophys. Res. Commun., 2017, 486, 904–908 CrossRef CAS PubMed.
- T. P. Misko, R. J. Schilling, D. Salvemini, W. M. Moore and M. G. Currie, Anal. Biochem., 1993, 214, 11–16 CrossRef CAS PubMed.
- H. Kojima, Y. Urano, K. Kikuchi, T. Higuchi, Y. Hirata and T. Nagano, Angew. Chem., Int. Ed., 1999, 38, 3209–3212 CrossRef CAS PubMed.
- Y. Gabe, Y. Urano, K. Kikuchi, H. Kojima and T. Nagano, J. Am. Chem. Soc., 2004, 126, 3357–3367 CrossRef CAS PubMed.
- T. Zhou, L. Yang, L. Liang, H. Liu, Y. Zhu, M. Shui, L. Yuan, F. Xu, Y. Niu, C. Wang and P. Xu, Eur. J. Org. Chem., 2017, 2017, 3274–3281 CrossRef CAS.
- D. Lee, K. M. K. Swamy, J. Hong, S. Lee and J. Yoon, Sens. Actuators, B, 2018, 266, 416–421 CrossRef CAS.
- Z. Dai, L. Tian, B. Song, X. Liu and J. Yuan, Chem. Sci., 2017, 8, 1969–1976 RSC.
- R. Ostuni, F. Kratochvill, P. J. Murray and G. Natoli, Trends Immunol., 2015, 36, 229–239 CrossRef CAS PubMed.
- M. Genin, F. Clement, A. Fattaccioli, M. Raes and C. Michiels, BMC Cancer, 2015, 15, 577–590 CrossRef PubMed.
- S. K. Biswas, P. Allavena and A. Mantovani, Semin. Immunopathol., 2013, 35, 585–600 CrossRef CAS PubMed.
- A. Mantovani and P. Allavena, J. Exp. Med., 2015, 212, 435–445 CrossRef CAS PubMed.
- N. N. Parayath, A. Parikh and M. M. Amiji, Nano Lett., 2018, 18, 3571–3579 CrossRef CAS PubMed.
- Y. Zhang, L. Wu, Z. Li, W. Zhang, F. Luo, Y. Chu and G. Chen, Biomacromolecules, 2018, 19, 2098–2108 CrossRef CAS PubMed.
- X. Ai, M. Hu, Z. Wang, L. Lyu, W. Zhang, J. Li, H. Yang, J. Lin and B. Xing, Bioconjugate Chem., 2018, 29, 928–938 CrossRef CAS PubMed.
- S. Zanganeh, G. Hutter, R. Spitler, O. Lenkov, M. Mahmoudi, A. Shaw, J. S. Pajarinen, H. Nejadnik, S. Goodman, M. Moseley, L. M. Coussens and H. E. Daldrup-Link, Nat. Nanotechnol., 2016, 11, 986–994 CrossRef CAS PubMed.
- M. Song, T. Liu, C. Shi, X. Zhang and X. Chen, ACS Nano, 2016, 10, 633–647 CrossRef CAS PubMed.
- Y. Huo, J. Miao, J. Fang, H. Shi, J. Wang and W. Guo, Chem. Sci., 2019, 10, 145–152 RSC.
- Y. Huo, J. Miao, L. Han, Y. Li, Z. Li, Y. Shi and W. Guo, Chem. Sci., 2017, 8, 6857–6864 RSC.
- N. Kwon, D. Kim, K. M. K. Swamy and J. Yoon, Coord. Chem. Rev., 2021, 427, 213581 CrossRef CAS.
- C. C. Winterbourn, Nat. Chem. Biol., 2008, 4, 278–286 CrossRef CAS PubMed.
- S. Heinzelmann and G. Bauer, Biol. Chem., 2010, 391, 675–693 CAS.
- D. Shi, S. Chen, B. Dong, Y. Zhang, C. Sheng, T. D. James and Y. Guo, Chem. Sci., 2019, 10, 3715–3722 RSC.
- L. C. Murfin, M. Weber, S. J. Park, W. T. Kim, C. M. Lopez-Alled, C. L. McMullin, F. Pradaux-Caggiano, C. L. Lyall, G. Kociok-Kohn, J. Wenk, S. D. Bull, J. Yoon, H. M. Kim, T. D. James and S. E. Lewis, J. Am. Chem. Soc., 2019, 141, 19389–19396 CrossRef CAS PubMed.
- K. P. Carter, A. M. Young and A. E. Palmer, Chem. Rev., 2014, 114, 4564–4601 CrossRef CAS PubMed.
- H. M. Kim and B. R. Cho, Chem. Rev., 2015, 115, 5014–5055 CrossRef CAS PubMed.
- P. Gao, W. Pan, N. Li and B. Tang, Chem. Sci., 2019, 10, 6035–6071 RSC.
- S. G. Rhee, Science, 2006, 312, 1882–1883 CrossRef PubMed.
- G. M. Chisolm and D. Steinberg, Free Radical Biol. Med., 2000, 28, 1815–1826 CrossRef CAS PubMed.
- A. Sevanian and F. Ursini, Free Radical Biol. Med., 2000, 29, 306–311 CrossRef CAS PubMed.
- H. Ohshima, M. Tatemichi and T. Sawa, Arch. Biochem. Biophys., 2003, 417, 3–11 CrossRef CAS PubMed.
- C. Xu and Y. Qian, J. Mater. Chem. B, 2019, 7, 2714–2721 RSC.
- S. I. Reja, M. Gupta, N. Gupta, V. Bhalla, P. Ohri, G. Kaur and M. Kumar, Chem. Commun., 2017, 53, 3701–3704 RSC.
- J. Perez-Vilar and R. C. Boucher, Free Radical Biol. Med., 2004, 37, 1564–1577 CrossRef CAS PubMed.
- S. M. Wu and S. V. Pizzo, Arch. Biochem. Biophys., 2001, 391, 119–126 CrossRef CAS PubMed.
- H. Li, Y. Miao, Z. Liu, X. Wu, C. Piao and X. Zhou, Dyes Pigm., 2020, 176, 108192 CrossRef CAS.
- H. Feng, Z. Zhang, Q. Meng, H. Jia, Y. Wang and R. Zhang, Adv. Sci., 2018, 5, 1800397 CrossRef PubMed.
- H. Tsukano, T. Gotoh, M. Endo, K. Miyata, H. Tazume, T. Kadomatsu, M. Yano, T. Iwawaki, K. Kohno, K. Araki, H. Mizuta and Y. Oike, Arterioscler., Thromb., Vasc. Biol., 2010, 30, 1925–1932 CrossRef CAS PubMed.
- M.-M. Zhang, Y.-H. Ma, P. Li, Y. Jia and K.-L. Han, Chem. Commun., 2020, 56, 2610–2613 RSC.
- Q. Pang, T. Li, C. Yin, K. Ma and F. Huo, Analyst, 2021, 146, 3361–3367 RSC.
- G. Ferrer-Sueta and R. Radi, ACS Chem. Biol., 2009, 4, 161–177 CrossRef CAS PubMed.
- D. Cheng, W. Xu, L. Yuan and X. Zhang, Anal. Chem., 2017, 89, 7693–7700 CrossRef CAS PubMed.
- Y. Zhou, P. Li, N. Fan, X. Wang, X. Liu, L. Wu, W. Zhang, W. Zhang, C. Ma and B. Tang, Chem. Commun., 2019, 55, 6767–6770 RSC.
- A. Jankowski, J. H. Kim, R. F. Collins, R. Daneman, P. Walton and S. Grinstein, J. Biol. Chem., 2001, 276, 48748–48753 CrossRef CAS PubMed.
- J. A. McNew, K. Sykes and J. M. Goodman, Mol. Biol. Cell, 1993, 4, 223–232 CrossRef CAS PubMed.
- B. Zhu, Z. Wang, Z. Zhao, W. Shu, M. Zhang, L. Wu, C. Liu, Q. Duan and P. Jia, Sens. Actuators, B, 2018, 262, 380–385 CrossRef CAS.
- J. Chen, X. Jiang, C. Zhang, K. R. MacKenzie, F. Stossi, T. Palzkill, M. C. Wang and J. Wang, ACS Sens., 2017, 2, 1257–1261 CrossRef CAS PubMed.
- S. V. Mulay, Y. Kim, M. Choi, D. Y. Lee, J. Choi, Y. Lee, S. Jon and D. G. Churchill, Anal. Chem., 2018, 90, 2648–2654 CrossRef CAS PubMed.
- G. Jiang, X. Liu, Q. Chen, G. Zeng, Y. Wu, X. Dong, G. Zhang, Y. Li, X. Fan and J. Wang, Sens. Actuators, B, 2017, 252, 712–716 CrossRef CAS.
- J. Lu, Y. Song, W. Shi, X. Li and H. Ma, Sens. Actuators, B, 2012, 161, 615–620 CrossRef CAS.
- Y. Liu, D. Yu, S. Ding, Q. Xiao, J. Guo and G. Feng, ACS Appl. Mater. Interfaces, 2014, 6, 17543–17550 CrossRef CAS PubMed.
- S. Shahrokhian, Anal. Chem., 2001, 73, 5972–5978 CrossRef CAS PubMed.
- D. Chen, J. Yang, J. Dai, X. Lou, C. Zhong, X. Yu and F. Xia, J. Mater. Chem. B, 2018, 6, 5248–5255 RSC.
- W. Luo, S. Zhang, Q. Meng, J. Zhou, R. Jin, X. Long, Y.-P. Tang and H. Guo, Talanta, 2021, 224, 121833 CrossRef CAS PubMed.
- W. Zhang, G. Weijing, T. Cheng, B. Wang, Y. Jiang and J. Shen, Anal. Methods, 2018, 10, 3991–3999 RSC.
- D. Kand, A. M. Kalle, S. J. Varma and P. Talukdar, Chem. Commun., 2012, 48, 2722–2724 RSC.
- R. R. Nawimanage, B. Prasai, S. U. Hettiarachchi and R. L. McCarley, Anal. Chem., 2014, 86, 12266–12271 CrossRef CAS PubMed.
- J. Zhang, J. Wang, J. Liu, L. Ning, X. Zhu, B. Yu, X. Liu, X. Yao and H. Zhang, Anal. Chem., 2015, 87, 4856–4863 CrossRef CAS PubMed.
- X. Xie, C. Yin, Y. Yue and F. Huo, Sens. Actuators, B, 2018, 267, 76–82 CrossRef CAS.
- J. Xu, J. Pan, Y. Zhang, J. Liu, L. Zeng and X. Liu, Sens. Actuators, B, 2017, 238, 58–65 CrossRef CAS.
- S. Qi, W. Liu, P. Zhang, J. Wu, H. Zhang, H. Ren, J. Ge and P. Wang, Sens. Actuators, B, 2018, 270, 459–465 CrossRef CAS.
- W. Fan, X. Huang, X. Shi, Z. Wang, Z. Lu, C. Fan and Q. Bo, Spectrochim. Acta, Part A, 2017, 173, 918–923 CrossRef CAS PubMed.
- X. Ma, Y. Hao, J. Liu, G. Wu and L. Liu, Molecules, 2019, 24, 411 CrossRef PubMed.
- T. Cheng, W. Huang, D. Gao, Z. Yang, C. Zhang, H. Zhang, J. Zhang, H. Li and X.-F. Yang, Anal. Chem., 2019, 91, 10894–10900 CrossRef CAS PubMed.
- H. Sies, Free Radical Biol. Med., 1999, 27, 916–921 CrossRef CAS PubMed.
- N. Ballatori, S. M. Krance, S. Notenboom, S. Shi, K. Tieu and C. L. Hammond, Biol. Chem., 2009, 390, 191–214 CrossRef CAS PubMed.
- H. Helmbach, E. Rossmann, M. A. Kern and D. Schadendorf, Int. J. Cancer, 2001, 93, 617–622 CrossRef CAS PubMed.
- G. Housman, S. Byler, S. Heerboth, K. Lapinska, M. Longacre, N. Snyder and S. Sarkar, Cancers, 2014, 6, 1769–1792 CrossRef PubMed.
- X. Zhang, Z. Wang, Z. Guo, N. He, P. Liu, D. Xia, X. Yan and Z. Zhang, Analyst, 2019, 144, 3260–3266 RSC.
- C.-H. Whang, E. Yoo, S. K. Hur, K. S. Kim, D. Kim and S. Jo, Chem. Commun., 2018, 54, 9031–9034 RSC.
- H.-J. Xiang, H. P. Tham, M. D. Nguyen, S. Z. Fiona Phua, W. Q. Lim, J.-G. Liu and Y. Zhao, Chem. Commun., 2017, 53, 5220–5223 RSC.
- C. Yin, W. Zhang, T. Liu, J. Chao and F. Huo, Sens. Actuators, B, 2017, 246, 988–993 CrossRef CAS.
- S. Chen, P. Hou, J. Sun, H. Wang and L. Liu, Spectrochim. Acta, Part A, 2020, 241, 118655 CrossRef CAS PubMed.
- M. Vert, Y. Doi, K.-H. Hellwich, M. Hess, P. Hodge, P. Kubisa, M. Rinaudo and F. Schué, Pure Appl. Chem., 2012, 84, 377–410 CrossRef CAS.
- C. Luan, Z. Yang and B. Chen, J. Fluoresc., 2016, 26, 1131–1139 CrossRef CAS PubMed.
- H. Zhang, J. Fan, J. Wang, B. Dou, F. Zhou, J. Cao, J. Qu, Z. Cao, W. Zhao and X. Peng, J. Am. Chem. Soc., 2013, 135, 17469–17475 CrossRef CAS PubMed.
- H. Zhang, J. Fan, J. Wang, S. Zhang, B. Dou and X. Peng, J. Am. Chem. Soc., 2013, 135, 11663–11669 CrossRef CAS PubMed.
- B. Feng, K. Wang, Y. Yang, G. Wang, H. Zhang, Y. Liu and K. Jiang, Chem. Sci., 2019, 10, 10373–10380 RSC.
- Y. Chen, Y. Wang, Y. Yang, Y. Li, Y. Wang, G. Wang, T. D. James, X. Xuan, H. Zhang and Y. Liu, Chem. Sci., 2020, 11, 6209–6216 RSC.
- J. Liu, Y. Yang, K. Wang, G. Wang, C. Shen, Y. Chen, Y. Liu, T. D. James, K. Jiang and H. Zhang, ACS Appl. Mater. Interfaces, 2021, 13, 3669–3678 CrossRef CAS PubMed.
- J. R. Lindner, Nat. Rev. Drug Discovery, 2004, 3, 527–532 CrossRef CAS PubMed.
- Y. Duan, M. Liu, W. Sun, M. Wang, S. Liu and Q. Li, Mini-Rev. Org. Chem., 2009, 6, 35–43 CrossRef CAS.
- L. Wu, J. Liu, P. Li, B. Tang and T. D. James, Chem. Soc. Rev., 2021, 50, 702–734 RSC.
- X.-P. He, Y. Zang, T. D. James, J. Li, G.-R. Chen and J. Xie, Chem. Commun., 2017, 53, 82–90 RSC.
- K.-Y. Tan, C.-Y. Li, Y.-F. Li, J. Fei, B. Yang, Y.-J. Fu and F. Li, Anal. Chem., 2017, 89, 1749–1756 CrossRef CAS PubMed.
- C. Geraghty, C. Wynne and R. B. P. Elmes, Coord. Chem. Rev., 2021, 437, 213713 CrossRef CAS.
- (a) M. Goldfeder, M. Kanteev, S. Isaschar-Ovdat, N. Adir and A. Fishman, Nat. Commun., 2014, 5, 4505 CrossRef CAS PubMed; (b) H. Decker and F. Tuczek, Angew. Chem., Int. Ed., 2017, 56, 14352–14354 CrossRef CAS PubMed.
- M. Peng, Y. Wang, Q. Fu, F. Sun, N. Na and J. Ouyang, Anal. Chem., 2018, 90, 6206–6213 CrossRef CAS PubMed.
- Y. Teng, X. Jia, J. Li and E. Wang, Anal. Chem., 2015, 87, 4897–4902 CrossRef CAS PubMed.
- W. Kang, D. Choi, S. Park and T. Park, Molecules, 2020, 25, 5191 CrossRef CAS PubMed.
- T.-I. Kim, J. Park, S. Park, Y. Choi and Y. Kim, Chem. Commun., 2011, 47, 12640–12642 RSC.
- K. Naidu Bobba, M. Won, I. Shim, N. Velusamy, Z. Yang, J. Qu, J. S. Kim and S. Bhuniya, Chem. Commun., 2017, 53, 11213–11216 RSC.
- C. A. Haynes, R. L. Koder, A. F. Miller and D. W. Rodgers, J. Biol. Chem., 2002, 277, 11513–11520 CrossRef CAS PubMed.
- M. Cellier, O. J. Fabrega, E. Fazackerley, A. L. James, S. Orenga, J. D. Perry, V. L. Salwatura and S. P. Stanforth, Bioorg. Med. Chem., 2011, 19, 2903–2910 CrossRef CAS PubMed.
- Y. Li, Y. Sun, J. Li, Q. Su, W. Yuan, Y. Dai, C. Han, Q. Wang, W. Feng and F. Li, J. Am. Chem. Soc., 2015, 137, 6407–6416 CrossRef CAS PubMed.
- D. Yang, H. Y. Tian, T. N. Zang, M. Li, Y. Zhou and J. F. Zhang, Sci. Rep., 2017, 7, 9174 CrossRef PubMed.
- R. J. Gillies and R. A. Gatenby, Cancer Metast. Rev., 2007, 26, 311–317 CrossRef CAS PubMed.
- L. Yang, J.-Y. Niu, R. Sun, Y.-J. Xu and J.-F. Ge, Sens. Actuators, B, 2018, 259, 299–306 CrossRef CAS.
- N. Zhang, Y. Wang, S. Leng, S. Xu, L. Zhang, Q. Wang, Q. Zhang and H.-Y. Hu, Talanta, 2019, 205, 120133 CrossRef CAS PubMed.
- F. Sliman, M. Blairvacq, E. Durieu, L. Meijer, J. Rodrigo and D. Desmaele, Bioorg. Med. Chem. Lett., 2010, 20, 2801–2805 CrossRef CAS PubMed.
- W. W. Chen, D. C. Chan, C. Donald, M. B. Lilly and A. S. Kraft, Mol. Cancer Res., 2005, 3, 443–451 CrossRef CAS PubMed.
- M. Malinen, T. Jaaskelainen, M. Pelkonen, S. Heikkinen, S. Vaisanen, V.-M. Kosma, K. Nieminen, A. Mannermaa and J. J. Palvimo, Mol. Cell. Endocrinol., 2013, 365, 270–276 CrossRef CAS PubMed.
- U. Warneche-Eberz, E. Bollschwweiler, U. Drebber, R. Metzger, S. E. Baldus, A. H. Holscher and S. Monig, Anticancer Res., 2009, 29, 4451–4456 Search PubMed.
- S. Guo, J. Fan, B. Wang, M. Xiao, Y. Li, J. Du and X. Peng, ACS Appl. Mater. Interfaces, 2018, 10, 1499–1507 CrossRef CAS PubMed.
- C. Y.-S. Chung and V. W.-W. Yam, J. Am. Chem. Soc., 2011, 133, 18775–18784 CrossRef CAS PubMed.
- S. I. Reja, I. A. Khan, V. Bhalla and M. Kumar, Chem. Commun., 2016, 52, 1182–1185 RSC.
- S. Arques, Eur. J. Int. Med., 2018, 52, 8–12 CrossRef CAS PubMed.
- C. Chen, Y. Yao, W. Wang, L. Duan, W. Zhang and J. Qian, Spectrochim. Acta, Part A, 2020, 241, 118685 CrossRef CAS PubMed.
- D. A. Silver, I. Pellicer, W. R. Fair, W. D. W. Heston and C. Cordon-Cardo, Clin. Cancer Res., 1997, 3, 81–85 CAS.
- D. G. Bostwick, A. Pacelli, M. Blute, P. Roche and G. P. Murphy, Cancer, 1998, 82, 2256–2261 CrossRef CAS PubMed.
- M. Kawatani, K. Yamamoto, D. Yamada, M. Kamiya, J. Miyakawa, Y. Miyama, R. Kojima, T. Morikawa, H. Kume and Y. Urano, J. Am. Chem. Soc., 2019, 141, 10409–10416 CrossRef CAS PubMed.
- M. Xiao, W. Sun, J. Fan, J. Cao, Y. Li, K. Shao, M. Li, X. Li, Y. Kang, W. Zhang, S. Long, J. Du and X. Peng, Adv. Funct. Mater., 2018, 28, 1805128 CrossRef.
- C. Bailly, Chem. Rev., 2012, 112, 3611–3640 CrossRef CAS PubMed.
- X. Zhang, X. Li, Q. You and X. Zhang, Eur. J. Med. Chem., 2017, 139, 542–563 CrossRef CAS PubMed.
- H. Shi, R. T. K. Kwok, J. Liu, B. Xing, B. Z. Tang and B. Liu, J. Am. Chem. Soc., 2012, 134, 17972–17981 CrossRef CAS PubMed.
- M. H. Lee, J. Y. Kim, J. H. Han, S. Bhuniya, J. L. Sessler, C. Kang and J. S. Kim, J. Am. Chem. Soc., 2012, 134, 12668–12674 CrossRef CAS PubMed.
- Z. Chen, B. Li, X. Xie, F. Zeng and S. Wu, J. Mater. Chem. B, 2018, 6, 2547–2556 RSC.
- S. U. Hettiarachchi, B. Prasai and R. L. McCarley, J. Am. Chem. Soc., 2014, 136, 7575–7578 CrossRef CAS PubMed.
- E. Calatrava-Perez, S. A. Bright, S. Achermann, C. Moylan, M. O. Senge, E. B. Veale, D. C. Williams, T. Gunnlaugsson and E. M. Scanlan, Chem. Commun., 2016, 52, 13086–13089 RSC.
- E. Calatrava-Pérez, L. A. Marchetti, G. J. McManus, D. M. Lynch, R. B. P. Elmes, D. C. Williams, T. Gunnlaugsson and E. M. Scanlan, Chem. – Eur. J., 2022, 28, e202103858 CrossRef PubMed.
Footnote |
| † This review is dedicated to A. P. de Silva and Xiaojun Peng on the occasion of their 70th and 60th birthdays. |
| This journal is © The Royal Society of Chemistry 2023 |


