
 Open Access Article
 This Open Access Article is licensed under a
 Creative Commons Attribution 3.0 Unported Licence
Formic acid–methanol complexation vs. esterification: elusive pre-reactive species identified by vibrational spectroscopy†
Sophie M.
Schweer
 ,
Maxim
Gawrilow
,
Arman
Nejad‡
and
Martin A.
Suhm
*
,
Maxim
Gawrilow
,
Arman
Nejad‡
and
Martin A.
Suhm
*
Institute of Physical Chemistry, University of Goettingen, Tammannstr. 6, 37077 Goettingen, Germany. E-mail: sschwee@gwdg.de; maxim.gawrilow@chemie.uni-goettingen.de; arman.nejad@chem.ox.ac.uk; msuhm@gwdg.de
First published on 23rd October 2023
Abstract
Vibrational spectra of the mixed dimer and the two mixed trimers of methanol and formic acid as well as some of their isotopologues are presented. Out of the eight expected OH stretching fundamentals of these three pre-reactive hydrogen-bonded complexes, the three modes mainly involving an acid OH group bound to the alcohol appear to be missing in the jet-cooled spectra despite a combination of infrared and Raman probing. A possibility of spectral overlap is discussed in the mixed dimer case, but largely discarded. The missing modes correspond to (fractional) concerted elongation of all engaged OH bonds, promoting synchronous degenerate proton transfer between the molecules. One other trimer mode is very tentatively attributed to a broad spectral feature, whereas all OH bonds contacting carbonyl groups can be unambiguously identified by four relatively narrow infrared absorptions. The spectral features are confirmed by vibrational perturbation theory and deviate in a subtle but systematic way from scaled harmonic predictions which were previously validated for the formic acid complex with a more acidic alcohol. Despite being exothermic and exergonic, ester formation can only be detected in the rarefied gas expansions after extended pre-mixture of the gases, which somewhat contrasts the recent microwave spectroscopic evidence of in situ ester formation and in particular the lack of pre-reactive complex signals.
1 Introduction
Carboxylic acid esters form under water elimination when the acid reacts with an alcohol, often catalysed by stronger acids. This nucleophilic C–O bond forming-breaking reaction profits from protonation, because a positive charge at the COOH group facilitates its nucleophilic attack.1 The driving force for esterification is typically small and the equilibrium2 is thus easily tuned by the molecular environment. Here, we completely eliminate this environmental effect and any molecular complexity or net charge by studying the simplest carboxylic acid (formic acid F) and the simplest alcohol (methanol M) in the gas phase at low temperature. Under such conditions, the overall double (alcohol + acid) or triple (alcohol + acid + catalytic acid or alcohol + acid + solvating alcohol) molecule esterification process contains a unimolecular core, where a pre-reactive acid–alcohol complex (Fig. 1) must be transformed into a post-reactive ester-water complex. From the perspective of the most stable pre-3 and post-reactive complexes instead of the separated molecules, the transition state barrier for esterification is significantly increased, because hydrogen bonding interferes with C–O bond formation and with C–O bond breaking and may thus distract from the actual reaction. Therefore, these complexes are expected to be rather non-reactive at low temperature.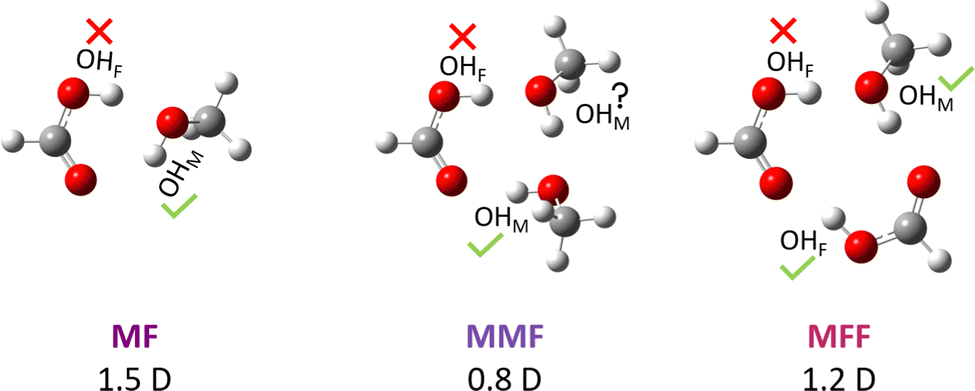 | ||
| Fig. 1 MF, MMF and MFF pre-esterification complexes spectroscopically characterised in this work for the first time via their high-frequency OH stretching modes (green check marks), together with (equilibrium B3LYP-D3/def2-QZVP) computed dipole moment predictions. Red crosses mark missing transitions. | ||
In this context, the report of spontaneous gas phase esterification between formic acid and methanol without a detectable trace of the competing pre-reactive hydrogen-bonded complex3 was surprising. Against expectation and despite a decent dipole moment of about 1.5 D (Fig. 1), the latter complex has remained elusive in supersonic jet microwave spectroscopy even when expanding the two reactants immediately after their mixture. Two explanations are conceivable, but not very probable: The investigated spectral windows or patterns may complicate acid–alcohol complex detection in the presence of similarly polar ester signals (1.8 D from experiment,4 2.0 D at the standard computational level used here) or these complexes really have a very low abundance in a supersonic jet. The latter would imply that ester formation is thermodynamically controlled, without any significant kinetic hindrance.3 The fact that other acid–alcohol combinations preferentially involving tertiary alcohols3,5 led to the direct microwave observation of the pre-reactive complex does not decide between the two explanations. Non-observation of the pre-reactive complex for most6 primary and secondary alcohols3,7–9 by microwave spectroscopy aggravates the problem. This calls for an alternative spectroscopic strategy to search for the elusive hydrogen-bonded complexes between methanol and formic acid.
Therefore, we have started an investigation of such complexes by vibrational spectroscopy. We target the most aggregation-sensitive OH stretching region. This has its own challenges, because strong hydrogen bonds may trigger fast vibrational energy redistribution after OH stretch excitation.10,11 That counteracts the gain in spectral intensity with hydrogen bonding because the OH stretching mode may distribute its intensity among many coupled dark states, as in the case of carboxylic acid dimers.10 Our first example thus involved trifluoroethanol (T), a relatively poor acceptor for the acidic OH group, hopefully slowing down any energy flow across the hydrogen bonds. We could unambiguously detect both OH stretching vibrations of its pre-reactive complex with formic acid,12 but no ester reaction product in the OH or CH stretching region, even after extended room temperature pre-mixing of the components. The latter observation is not too surprising given the low sensitivity of the OH stretching range to ester detection. The trifluoroethanol complex with formic acid12 (TF) also allowed for the validation of anharmonic and the calibration of harmonic quantum chemical predictions for such acid–alcohol interactions, which will be used in the present work as an empirical predictor of spectral band positions.
Based on this preparatory study,12 we now report on the analogous investigation of methanol–formic acid co-expansions, where the hydrogen bonding from the acid to the alcohol is more favoured and the risk of fast energy redistribution dynamics increases. We find that pre-reactive mixed dimers and trimers are again present in the expansion. Evidence for the ester product is restricted to expansions from gases which have been pre-mixed for several hours at room temperature. Detection of the (predominantly) acidic OH stretch OHF (see Fig. 1) in the hydrogen-bonded complexes was unsuccessful, likely due to fast vibrational energy flow into other vibrational degrees of freedom or electrical anharmonicity and less likely due to spectral overlap. Despite differences in the expansion conditions to the microwave study (slit nozzle instead of pinhole nozzle, lower stagnation pressure and lower concentration in the present work), we can safely rule out that pre-reactive acid–alcohol complexes in supersonic jet expansions have a consistently low abundance. They are present in typical concentrations for hydrogen-bonded complexes which are at least comparable to those of complexes involving the ester reaction product. There must be some unusual and unexpected sensitivity, expansion condition or assignment issue with the missing microwave detection of the mixed methanol/formic acid dimer.
2 Methods
For the purpose of this work, methanol is abbreviated with M, formic acid with F, water with W and the methyl formate ester with E. Their purities and sources are provided in the ESI† (Table S10).2.1 Gas mixing and spectroscopy
The complementary linear FTIR13 and Raman14 spectroscopy techniques employed in this study have been summarised recently.12 Here, we focus on some aspects of pre-expansion gas handling relevant for the (non-)reactivity of the acid/alcohol mixtures. In method P (pre-mixing), the two components were pre-mixed at high pressure in the helium carrier gas and stored for several hours in stainless steel bottles before expanding the mixture through the slit nozzle. In method O (online mixing), separate acid-helium and alcohol-helium mixtures were prepared and combined for at most a few minutes, either by pulsed admission into a pre-expansion reservoir (FTIR, ESI,† Table S12) or by flow controllers (Raman, ESI,† Table S11). Only method P yielded significant amounts of ester product, detected in the OH stretching range by the associated complex with one methanol molecule. Any ester formation for method O remained below the detection limit in the spectral window investigated.Mixing ratios for spectra are estimated based on the partial pressures of the components, controlled by the temperature of the pure liquid through which the carrier gas flows (method O), or defined by the pre-mixing fraction (method P). For F, a small correction (described in Section S2.1 in the ESI†) is applied to the actual pressure because of extensive dimer formation based on the dissociation constant.15,16 The spectral signatures of the monomers in the jet expansions are used to verify the composition of the gas mixture, assuming that cluster formation does not distort the monomer ratio in a qualitative way. IR absorbance is expressed as log10(I0/I), for which we use the short-hand notation lg(I0/I).
2.2 Quantum chemical calculations
All calculations addressing the relative stability of the pre-reactive and post-esterification species were carried out with Turbomole17 (version 7.5) and Molpro18 (version 2022.1), see the ESI† (Section S1.1) for details. For spectroscopic purposes, harmonic spectra and transition states were also predicted using Gaussian 16 (Rev. A.03),19 focusing on the methods employed for the corresponding complexes with trifluoroethanol.12 In brief, for the harmonic DFT predictions the B3LYP-D3(BJ) functional20,21 was used with a def2-QZVP basis set.22 The resulting harmonic wavenumbers are uniformly scaled by the previously validated factor of 0.96.12 See the ESI† (Section S1.2) for details.The anharmonic vibrational frequency calculations similarly follow the methodology outlaid in ref. 12 which was previously validated for the complex between trifluoroethanol and formic acid. In essence, the MP2-quality anharmonic semi-diagonal quartic force fields are improved with CCSD(T)-F12a/VDZ-F1223–25 harmonic force constants. For IR intensities, we use the pure MP2 expansion of the dipole moment. The vibrational energy levels were calculated with second-order vibrational perturbation theory using the composite force fields, resulting in the substituted hybrid force field approach.26 The necessary electronic structure calculations were performed with Gaussian 1619 (Rev. A.03) and Molpro (version 2021.3).18 On a practical note, the geometry optimisation and anharmonic force field calculations with Gaussian were executed sequentially using two separate input files, respectively, to minimise (artificial) noise in the numerical differentiation (cf. Appendix. C2 in ref. 27). Due to implementational differences, energy levels and IR intensities computed with Gaussian can differ slightly from direct implementations of the substituted hybrid force field approach because the former scales the force constants by the square root of the ratio of the original and new harmonic wavenumbers (see ESI of ref. 28). The calculations were, therefore, conducted with the GUINEA module of the CFOUR program package29 (version 2.1) and manual implementations26,30,31 using the unscaled derivatives.
3 Results and discussion
In contrast to the combination of formic acid with trifluoroethanol12 and in agreement with the microwave studies of methanol with formic acid,3 we found evidence for ongoing esterfication in the gas mixture. Therefore, prior to reporting and interpreting experimental vibrational spectra of pre-reactive complexes between formic acid and methanol, it is advisable to look at the low temperature energetics of the esterification process. This will be largely based on computation, because the energetics of complexes are rarely32,33 accessible experimentally.3.1 Computational thermodynamics of ester formation
From the perspective of a supersonic jet expansion of methanol (M) with formic acid (F), where spontaneous esterification was claimed,3 a relevant comparison is that of the most stable complex of formic acid with methanol (MF) to the most stable complex of the resulting methyl formate ester with water (EW). It turns out that the reaction enthalpy or energy at 0 K strongly depends on the computational method. At D3- and ZPE-corrected PBE0 level using a quadruple-zeta basis set, MF wins by about 5 kJ mol−1, at the corresponding B3LYP level by only 2 kJ mol−1. If one switches to CCSD(T) (including ZPE-correction from B3LYP), EW wins by 2–2.5 kJ mol−1, depending on whether the structures are optimised at B3LYP or CCSD(T) level. When moving to the (rigid rotor, harmonic oscillator) Gibbs energy difference at 298 K, MF stops winning at B3LYP level, but keeps winning at PBE0 level, such that only PBE0 is qualitatively at variance with the CCSD(T) prediction of a small but significant advantage for the ester/water complex. When comparing the isolated products (ester and water) to the isolated reactants (acid and alcohol), all methods (including PBE0) predict the ester side to be more favourable in both energy and 298 K standard Gibbs energy, because the acid + methanol side loses its double hydrogen bond advantage. The degree of exothermicity at 0 K again differs, ranging from 18 kJ mol−1 for B3LYP and 19 kJ mol−1 for PBE0 to 23 kJ mol−1 for the CCSD(T)-edited approaches (21 kJ mol−1 for B2PLYP3). The CCSD(T) value compares reasonably well to the current ATcT value of 24–25 kJ mol−1 at 0 K.34 We note that neither the complexes nor the isolated molecules are close to the global minimum structure or Guinness molecule35 for the C2H6O3 sum formula. E.g., the formation of a van der Waals complex of methane, water and carbon dioxide is more than 100 kJ mol−1 exothermic. The details of the exploratory calculations are given in the ESI† (Section S1.1).In summary, if there were no kinetic hindrance, ester formation from formic acid and methanol would always be exothermic and exergonic, to a more or less large extent. This driving force is particularly small (as small as 2 kJ mol−1) at low temperature for the unimolecular rearrangement of the binary complex. To ensure that the driving force does not vanish completely at low temperature, one would have to carry out elaborate anharmonic corrections (MP2-level VPT2 calculations suggest that these are unproblematic) and to investigate the influence of other approximations in the present calculations. The finding of a near-degeneracy between the pre- (MF) and post-reactive (EW) complexes provides an interesting thermodynamic starting point for the question as to what happens when formic acid is co-expanded with methanol through a nozzle.
3.2 Weakly shifted OH stretching signatures of complexes between methanol and formic acid
We start with the OH stretching spectrum in the region above 3300 cm−1 which was validated by the previous TF (trifluoroethanol + formic acid) study.12Fig. 2 displays the individual spectra of F (a), M (b, with MM and MMM signals) and their mixture (c). Subtraction of the single-substance contributions (d) shows that at least three positive signals are due to mixed M/F clusters, whereas negative signals reflect M, F, MM and MMM consumption. In sequence of decreasing wavenumber, the positive signals correspond to predominantly methanol-centred OH stretching fundamentals (OHM) in the mixed MF dimer and the MMF and MFF trimers, as shown in Fig. 1. The calculated structures of these complexes explain the spectral sequence, because hydrogen-bonded ring strain decreases and cooperativity increases from two to three binding partners. In the case of MMF, the OHM vibration is mostly located on the M unit acting as a hydrogen bond donor towards F. | ||
| Fig. 2 FTIR helium jet spectra of (a) F (0.03%), (b) M (0.08%), (c) their mixture F+M (insert at higher dilution in helium) and (d) the residue Δ after subtraction of the single components. Scaled harmonic predictions (e) match M and F monomer positions, while systematically underestimating the highest-frequency MF, MMF, MFF OH stretches. The calculated harmonic intensities allow for an estimation of relative cluster abundances, and the intensity evolution at different M/F ratio (f, 0.07% F and 0.04% M) follows statistical expectations for the assigned cluster stoichiometry (g). | ||
A spectrum at higher dilution (insert above c) confirms the identity of the mixed dimer as the most persistent peak. Simulations based on the uniform harmonic scaling adopted from the TF system12 and on predicted IR intensities suggest that MFF forms more readily than MMF from MF at higher concentration, but MF remains the dominant mixed cluster under the present conditions. In trace d, MFF reaches a relative abundance of 0.4, MMF only 0.3, despite a more than two-fold excess of M over F in the expansion and potential intensity stealing in MFF by anharmonic resonance (signals marked “MFF?” in trace f, vide infra). Harmonic theory, scaled by 0.96 (trace e) to reproduce the free OH stretch, progressively overestimates the weakening of the OH bond force constant due to hydrogen bonding for B3LYP-D3 (dashed guiding lines). This is in part a deficiency of DFT, but may also have contributions from neglected off-diagonal anharmonicity contributions. It will be analysed in detail later on.
Trace f (ESI,† Fig. S3) further confirms the relative size assignment, by showing the intensity trend in the difference spectrum when the F concentration is increased by 7/3 while the M concentration is decreased to 1/2. If cluster formation is reasonably proportional to the concentration of the collision partners (as assumed in trace g) this should only slightly increase the MF signal (1/2 × 7/3), whereas MMF should be depleted (1/4 × 7/3) and MFF increased (1/2 × 49/9). That closely corresponds to observation and provides clear evidence for all three pre-reactive species, also building on the previous work on trifluoroethanol complexing formic acid.12 The three signals are similarly narrow, underscoring that energy flow from the methanolic OH donor to the carbonyl group of the formic acid is slow. This is in line with expectation for such moderately strong hydrogen bonds. Two weak peaks marked with question marks in Fig. 2f next to MMM and MFF may also be due to MFF and would then mark the onset of fast energy redistribution to dark states,36 but are not intense enough for a safe size assignment.
We note that deuteration of all CH bonds in these complexes (ESI,† Table S7) has little effect on the OH stretching wavenumbers in Fig. 2, because the CH stretches are fairly uncoupled from the OH modes. Only for the most weakened OHM bond in MFF one can observe a 3 cm−1 downshift. This is underestimated in the harmonic predictions (≈1 cm−1) and not improved at MP2-VPT2 level.
Raman spectra (vide infra and Fig. S4 in the ESI†) provide little further insight in this spectral region. Due to the higher concentrations used and the preference of MFF over MMF, the spectra are typically dominated by the MFF signal. The two weak bands labelled with a question mark in Fig. 2 are also visible as minor unassigned contributions. At this point, one can move to the lower spectral range, which is expected to contain formic acid-centred OH vibrations.
3.3 Strongly shifted OH stretching signatures of complexes between methanol and formic acid
Fig. 3 extends the experimental and theoretical spectra below 3300 cm−1, where OH stretching vibrations located on the formic acid unit(s) are expected, together with the second alcoholic stretch of MMF. The subtraction procedure leading to trace d is the same as in Fig. 2. Instead of three expected features around 3200 cm−1 due to MF, MMF and MFF (trace e to the left), only one signal (OHF) is observed at 3178 cm−1. It is about 2 times broader than the signals in Fig. 2, therefore the predicted peak intensities in traces e and g are also scaled by 1/2. The negative and positive features around 2900 cm−1 are due to poorly compensated monomeric C–H absorptions (see traces a and b), as their absence in the insert obtained from fully C-deuterated species demonstrates (ESI,† Fig. S5). The positive signal slightly below 2940 cm−1 also has contributions from the C–H stretch of F in the complexes. The slight downshift of OHF upon C-deuteration suggests that the C–H stretch of the underlying complex mixes somewhat with the O–H stretch. However, at the harmonic prediction level used in this work, the downshift is less than 2 cm−1 and fairly uniform for the three expected contributions (see ESI,† Table S7), whereas experimentally it is found to be close to 5 cm−1. This underestimation is in line with the observation in the higher-frequency spectral window (vide supra). After inclusion of VPT2 corrections (Table S7, ESI†), the shifts are less regular and in particular the prediction for MF shifts strongly to lower wavenumber. This makes an MF contribution to OHF somewhat less likely. | ||
| Fig. 3 Continuation of the FTIR jet spectra from Fig. 2 towards lower wavenumber. (a) F, (b) M, (c) their mixture F+M (insert at higher dilution) and (d) the residue Δ after subtraction of the single components. An insert below (d) shows the spectrum after halving the M concentration and replacing all CH bonds by CD bonds, leaving only a single, more narrow OH stretching signal (OHF). Scaled harmonic predictions (e) matching the abundance of MF, MMF, and MFF obtained from Fig. 2 are shown at half intensity (see text). Trace f involves the same concentration changes as in Fig. 2 and trace g the corresponding statistical intensity expectations from the theory side. | ||
To identify the origin of OHF, trace f again shows the spectrum obtained after concentration modification of the F and M monomers and g corresponds to the statistical intensity prediction based on trace e in Fig. 2. Clearly, the dominant contribution to OHF is from MFF, based on its relative intensity. In trace e, it matches the intensity prediction based on Fig. 2 trace e rather well, better than MF and MMF. It also matches the intensity increase predicted in trace g and it is consistent with the statistically expected 9-fold attenuation for such a species in the insert above trace c. The M-centred vibration of MMF around 3200 cm−1 does not match the observed peak at all, justifying its naming as OHF. A smaller, coincidentally overlapping contribution by MF to OHF cannot be ruled out completely, as usual for non size-selected low resolution spectra. However, any contribution approaching or exceeding 50% of the total intensity would be inconsistent with the total intensity and its evolution in the experimental spectra. This is particularly obvious when comparing traces d and f. The experimentally observed increase of the OHF signal by about a factor of 2 clearly exceeds the statistically predicted increase by 7/6 for MF, which was experimentally confirmed in Fig. 2.
The complete absence of any narrow spectral feature near 2700 cm−1, where the analogous OHF modes of MMF and MFF are predicted (see insert below trace d, the trace d itself, and most prominently trace f), is striking. Based on the spectra, one must conclude that the peak intensities of these OHF stretching vibrations are attenuated by a factor of at least 2 for MF, at least 3 for MMF, and at least 10 for MFF, relative to the harmonic prediction and to the OHF feature seen in traces f, d and its insert. This n-fold attenuation could be either due to a resonance splitting of the intensity into at least n multiple weaker bands or due to a broadening by a factor of at least n, or a combination of both splitting and broadening. Very speculatively, the broad feature above 3200 cm−1 in trace d may be attributed to the second OHM stretching vibration in MMF, as it vanishes with M-dilution (trace f).
In summary, out of the 8 OH stretching vibrations of MF, MMF and MFF, Fig. 2 unambiguously shows the three M-vibrations towards the F unit, whereas Fig. 3 only reveals the F-vibration towards F in MFF (and perhaps very weakly the M-vibration towards M in MMF). All three F-vibrations towards M, which are predicted to exhibit the strongest hydrogen bond shifts of all OH vibrations and correlate with concerted in-phase stretching of the OH oscillators, appear to be missing to a substantial extent.
3.4 Auxiliary Raman spectra
Raman spectra can provide complementary information even in the absence of symmetry. Due to the more local character of the OH oscillators in MF (vide infra), their Raman intensity ratio is however more similar to the IR intensity ratio than in the TF12 case. The CH stretching region is congested due to the high Raman scattering cross sections but indicates some cluster contributions around 2934 cm−1, most likely due to C–H stretching motion. As in the IR, there is no evidence for strongly shifted OH stretches. Fig. 4 shows the range from 3560 to 3100 cm−1, which covers the IR-observed mixed dimer and trimer OH fundamentals, under different expansion conditions. They are framed by sharp F monomer transitions39,40 and the onset of formic acid dimer signals at the lower-wavenumber end. The top part shows a concentration series, with more M or more F added to the mixture, as indicated by the colour coding. The bottom part shows how the spectrum evolves with progressive nozzle heating, gradually suppressing larger clusters. Both series are scaled to the unambiguous MF signal at 3523 cm−1. The heating series clearly shows that all signals between 3160 and 3500 cm−1 are predominantly due to clusters beyond dimers. Contributions of MMM and MMMM at high M concentration and low nozzle temperature are marked as such and are largely Raman-specific due to the (near-)symmetry of these homoclusters. The three mixed trimer signals behave as expected, with two of them scaling as predicted for MFF and the one attributed to MMF scaling less strongly with F concentration. However, the more similar scaling of MF at 3523 cm−1 and the 3177 cm−1 peak at the two highest nozzle temperatures might support a small MF contribution underneath the MFF peak. The two weak Raman signals labelled “MFF?” match those in the IR spectrum in position and roughly also in intensity, which would be in line with a resonance interpretation, i.e. dark state mixing.41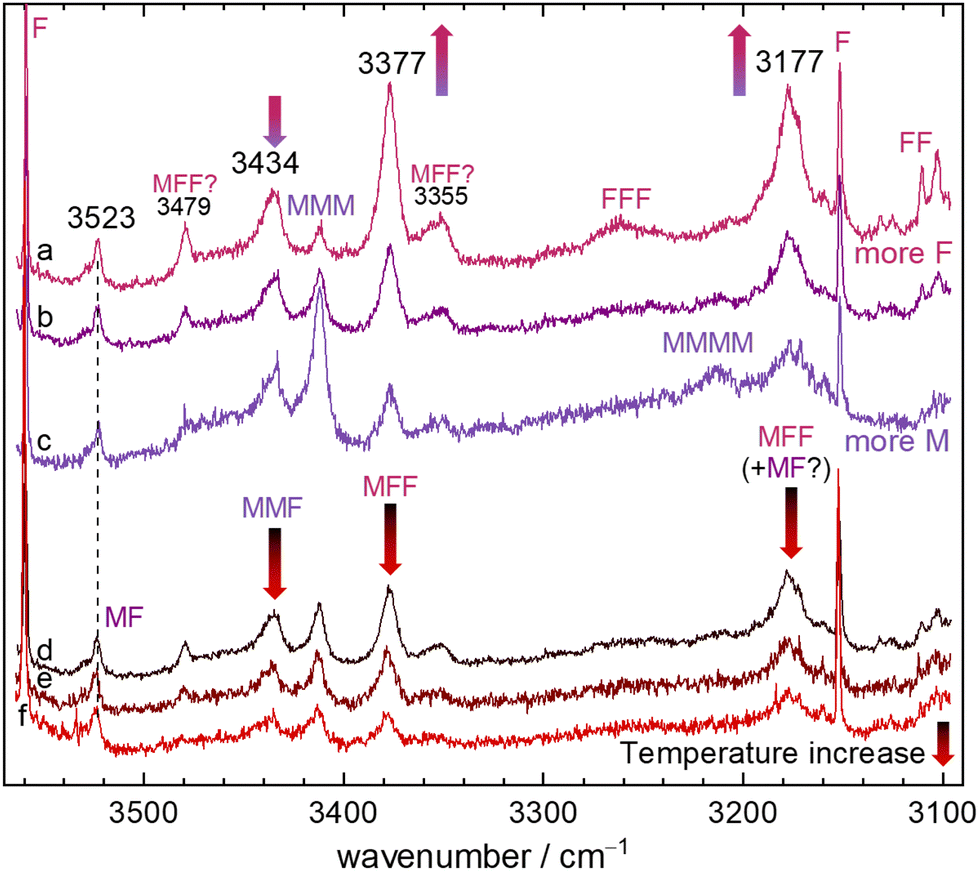 | ||
| Fig. 4 Raman spectra of different F+M mixtures, all scaled to have similar MF complex intensity at 3523 cm−1. The upper part shows spectra with different mixing ratios (a)–(c), the lower part the effect of increasing nozzle temperatures from d to f. The colour-coded arrows indicate important intensity trends along the colour-coded spectral series. Mixed and homoclusters37,38 are marked. The colour code in the lower part encodes nozzle temperature from cold (black) to hot (red, decreasing cluster tendency) whereas the code in the upper part corresponds to that of the IR spectra. | ||
3.5 What is different for OD stretching?
One way of putting less vibrational energy into the acid–alcohol clusters is to replace the OH group by its OD isotopolog. This changes the anharmonicity and reduces the likelihood for fast dynamics assisted by concerted hydrogen exchange between the acid and the alcohol. Fig. 5 compares the OD and OH stretching ranges, with the OD wavenumbers stretched by a factor of 1.4 and shifted to match the monomer transition (M). One can see how the cluster signals progressively shift to higher (scaled) wavenumbers upon deuteration, relative to the monomer, when the hydrogen bond strength increases. The four main mixed cluster features persist upon deuteration whereas no counterpart of the “MFF?” satellite band near 3351 cm−1 is found, tentatively underscoring its resonance interpretation, although the signal-to-noise ratio is quite limited. Most importantly, the most downshifted band remains unsplit upon deuteration. Any hidden MF contribution underneath this MFF-dominated band must therefore show the same isotope shift. This renders the spectral overlap hypothesis for MF and MFF around 3177 cm−1 less likely. In the following, we will collect further arguments to resolve this discrepancy. | ||
| Fig. 5 FTIR spectra of F+M mixtures without (a) and with (b) OH deuteration. To show the corresponding OH/OD regions, the OD wavenumber axis is stretched by ×1.4 compared to the CH axis and aligned with the OH band of M. | ||
3.6 What is different from trifluoroethanol?
A look at the relative Raman and IR intensities of the two OH stretching bands is instructive. In the TF case, the intensities were complementary, which is typical for mixing of the local modes and is also confirmed by double-harmonic theory predictions. This is illustrated in Fig. 6 (circles). Where the Raman intensity is high, the IR intensity is low, and vice versa. Although IR intensities usually correlate with hydrogen bond downshift (the larger the shift, the larger the infrared intensity enhancement due to a steepening of the dipole curve), the less-shifted IR signal has a higher intensity. Stretching one OH while compressing the other in the cyclic arrangement leads to a large overall dipole moment change. Synchronous stretching leads to a polarisability increase and thus more Raman intensity. This mode-coupling effect, which ultimately leads to the rule of mutual exclusion for inversion-symmetric species like FF, counteracts the expected shift-intensity correlation and helped to identify the acidic OH stretch in TF. Instead, for MF and to some extent also for the corresponding MMF and MFF trimers, theory predicts that infrared and Raman intensity change in parallel, which is more characteristic for isolated OH modes (Fig. 6). The stronger the hydrogen bond they are engaged in, the larger the intensity enhancement. This decoupling of the OH stretches is plausible when the acidities of the binding partners differ strongly, as is the case for M and F, but less so for T and F. If one compares the spectral splitting of the OH modes in the complex to that of the monomer modes, a ratio of about 3 for MF contrasts a ratio of close to 1 for TF. Due to the decoupling, the acidic OH stretching signal of MF should thus be highly visible in the IR and in the Raman spectra, whereas it is observed to be at best a small admixture to the MFF-dominated signal with a similar predicted visibility. More likely it is not observed at all, which can only be explained by an extreme broadening of its spectroscopic appearance, bringing the peak intensity down below noise level. | ||
| Fig. 6 Predicted Raman activities plotted against predicted IR intensities of the dimers MF and TF as well as the trimers MMF and MFF calculated at B3LYP-D3/def2-QZVP level. All symbols are accompanied by their corresponding scaled (×0.96) harmonic wavenumbers. Filled symbols mark the experimentally found OH stretching vibration with the experimental wavenumbers in parenthesis while empty ones mark experimentally missing OH vibrations. The red line through the origin is a guide to the eye, representing a fitted linear trend of all MF, MMF and MFF intensities. | ||
3.7 Insights from and benchmarking of anharmonic (VPT2) calculations
After having established some of the expected OH stretching transitions based on approximate, TF-validated harmonic DFT predictions and experimental concentration variations, one can test the performance of (perturbative) anharmonic predictions at MP2 and CCSD(T) level, including insights from anharmonic intensities.Starting with MF, CCSD(T)-edited MP2 VPT2 predicts a sharp band at 3514 cm−1 for the M-centred stretch OHM, 9 cm−1 below the experimental value. The discrepancy is larger (16 cm−1) for the complexation downshift relative to isolated M (162 cm−1) because the OH stretch of isolated M is overestimated by 6 cm−1. Fig. 7 shows that this observation can be generalised to the other investigated complexes. The deviation to experiment is shown for all observed OH stretching vibrations of MF, MMF, MFF, and the complexes involving the MF ester methyl formate (E) and water (EW) or methanol (EM). The free monomer vibrations are included in lighter hues. Focusing on the filled symbols, the consistently better performance of the larger-basis set MP2 hybrid VPT2 (red and blue triangles) profits from the aforementioned partial cancellation between free OH wavenumber and complexation shift. In contrast, scaled harmonic DFT (black disks), consistently underperforms compared to hybrid VPT2, making a compelling case for the hybrid approach which carries only a fraction of the cost of a full coupled-cluster treatment.
 | ||
| Fig. 7 Performance of hybrid VPT2 (triangles) and scaled harmonic (disks) vibrational models for all observed OH stretching wavenumbers. Raw data are reported in the ESI† (Table S9). The corresponding free monomer vibrations are shown in lighter hues. The unfilled symbols correspond to a tentative MMF assignment and a hypothetical location of the missing MF OH stretch underneath 3178 cm−1 and are excluded from the MAD analysis shown in the grey inset (see text). | ||
Having verified the predictive power of hybrid VPT2, the unfilled symbols in Fig. 7 allow to address the two uncertain assignments. The weak experimental evidence for the second methanol OH stretching mode of MMF near 3262 cm−1 would give rise to somewhat larger deviations for scaled harmonic and in particular anharmonic predictions than all the experimentally secured transitions. Therefore, this tentative assignment is not supported by theory, and should perhaps be discarded. Less ambiguous is the computational insight about a potential MF contribution to the 3178 cm−1 MFF band (Fig. 5). This attempt to rationalise the missing experimental MF OHF signal by spectral overlap can be reasonably ruled out based on the 70–90 cm−1 deviation of the computational predictions. Why then is OHF not observed? If one computes anharmonic IR intensities of the two MF OH stretching bands in the hybrid VPT2 approximation, there is only a slight (less than 20%) intensity reduction for the higher-wavenumber M-vibration (similar to the higher-wavenumber band in TF12) compared to the harmonic result, whereas the lower-wavenumber F-vibrational intensity drops by more than 50% (in contrast to the lower-wavenumber vibration in TF, where the intensity drop is much weaker). Part of the intensity drop in the standard VPT2 treatment is predicted to be due to redistribution to neighbouring dark states in MF. Further intensity redistribution beyond standard VPT242 would be needed to explain the experimental absence of the OHF band for MF. A detailed analysis including the corresponding effects for trimers will be presented elsewhere.
3.8 Vibrationally promoted concerted proton dynamics as a possible explanation
Besides anharmonic resonances and electrical anharmonicity effects accessible to a VPT2 treatment, there may be another possible explanation for the elusiveness of the most downshifted OH stretching transitions in MMF and MFF, perhaps also in MF. They all involve F hydrogen stretching motion towards the M binding partner. This excitation is close to the energy needed to dissociate one monomer (ESI,† Table S6), but probably not quite enough. Therefore, dissociation life time is not a likely cause for broadening. However, after projection of the acidic F proton towards M, the accepting M unit can simultaneously relay its own proton to the next binding partner and this can go on until the carbonyl group of the originally excited acid (F) is back-protonated, resulting in a topologically equivalent structure where the two oxygen atoms of F have interchanged their role. This feature of resonance-assisted hydrogen bonds in carboxylic acid complexes deserves consideration, when trying to understand the missing bands.If the infrared excitation is close to the transfer barrier or if heavy atom motion is so small that concerted tunneling becomes fast,43 this large amplitude dynamics may facilitate additional channels for vibrational energy redistribution. Fig. 8 describes the energetic situation for MF, the simplest case where concerted proton transfer may happen after in-phase OH stretching excitation. Indeed, one can see that the spectrally missing (or overlapped) excitation is close to the barrier to double proton transfer and it qualitatively corresponds to the reaction coordinate. However, we have shown that the acidic stretching band of MF was still elusive after deuteration (Fig. 5), where the concerted deuteron transfer is classically inhibited after OD stretching excitation and tunneling is slowed down due to the larger mass. Therefore, the role of concerted proton dynamics in these complexes has to remain speculative and calls for dedicated quantum dynamics simulations.
 | ||
| Fig. 8 Barrier calculated at B3LYP-D3/def2-QZVP level for the concerted double proton exchange (after harmonic zero point energy correction) in MF compared to predicted harmonic, scaled harmonic, and speculative experimental fundamental OH stretch excitation in the direction of the exchange coordinate. The latter is defined by the difference between the acidic OH bond and the alcoholic hydrogen bond. The comparable size of all energies may or may not be related to the elusiveness of the experimental transition. | ||
3.9 Ester detection by solvent vibrations
So far, the spectral interpretation did not have to invoke any contribution from the ester (E) reaction product between M and F. There are two main reasons for this. The investigated OH/CH stretching range is not very sensitive to ester formation, due to the lack of specific XH stretching fundamentals of the ester and omnipresence of the water (W) reaction product as an impurity. Furthermore, all spectra shown were obtained after relatively short online gas mixing periods (less than 5 min even in the IR experiment, where a reservoir stores 5–10 gas pulses) such that a slow esterification remains undetected. This combination was intentional in order to uniquely identify the so far elusive pre-reactive complexes between M and F.
Fig. 9 (ESI,† Fig. S6) shows what happens if the second constraint is relaxed by pre-mixing the two gases for more than 15 hours at about 50 bar (method P, trace d). Compared to much shorter pre-mixing or online mixing (method O, trace e, average over different mixing ratios to further reduce the noise level), a small band at 3591 cm−1 appears which can be attributed to the non-covalent complex (EM) between methylformate and methanol by comparison to the explicit mixture of these two components (trace b). Less prominently, a small band at 3195 cm−1 appears which may correspond to a complex EF between formic acid and methylformate (trace a, the second feature at 3179 cm−1 overlaps with a mixed trimer signal). At the same time, the ro-vibrational lines of traces of water (W) are more visible than usual, indicating some esterification over time. Note that the EM and W signals do not increase significantly in intensity after more than 60 hours (trace c). The intensity ratio between EM and MF OH stretching bands in the jet spectra is about 1![[thin space (1/6-em)]](https://www.rsc.org/images/entities/char_2009.gif) :3 and the predicted IR band strength ratio is about 3:2, indicating a conversion yield of about (20 ± 10)% under these non-catalytical conditions. This is somewhat too low for characteristic methyl formate monomer bands, such as the carbonyl overtone at 3494 cm−1 or the highest CH stretching band at 3039 cm−1 (trace f) to be discernible above the spectral noise. Finally, small traces of EW complexes,44 which absorb nearby (3587 cm−1, ESI,† Fig. S7), cannot be ruled out due to partial overlap with F and would be consistent with partial conversion of the acid and the alcohol to the ester. For the dominant species MF, MMF and MFF, the linear character of the FTIR spectra shown in Fig. 2, 3 and 9 in combination with approximate calculated IR cross sections allows us to quantify their average abundance in the probed parts of the supersonic jet on the order of 1010–1012 cm−3, when the associated monomers M, F reach about 1013 cm−3 (Table S8 ESI†).
:3 and the predicted IR band strength ratio is about 3:2, indicating a conversion yield of about (20 ± 10)% under these non-catalytical conditions. This is somewhat too low for characteristic methyl formate monomer bands, such as the carbonyl overtone at 3494 cm−1 or the highest CH stretching band at 3039 cm−1 (trace f) to be discernible above the spectral noise. Finally, small traces of EW complexes,44 which absorb nearby (3587 cm−1, ESI,† Fig. S7), cannot be ruled out due to partial overlap with F and would be consistent with partial conversion of the acid and the alcohol to the ester. For the dominant species MF, MMF and MFF, the linear character of the FTIR spectra shown in Fig. 2, 3 and 9 in combination with approximate calculated IR cross sections allows us to quantify their average abundance in the probed parts of the supersonic jet on the order of 1010–1012 cm−3, when the associated monomers M, F reach about 1013 cm−3 (Table S8 ESI†).
 | ||
| Fig. 9 Evidence for ester (E) and water (W) formation after a mixing time tmixing of 0.7 and 2.5 days (traces d and c, independent mixtures explain the varying conditions) of M and F at 50 bar in a 50 l stainless steel bottle in comparison of online mixing in a similar composition range (trace e). W is observed directly, E only indirectly through EM and perhaps some EF complex formation, as reference spectra (traces a, b and f) show. As an example, based on theoretical band strengths, trace c is consistent with 1 × 10¹³ monomers (M, F) per cm3 as well as 3 × 1011 cm−3 MF, 9 × 1010 cm−3 MFF and 6 × 1010 cm−3 MMF. EM may be roughly estimated at 6 × 1010 cm−3. | ||
4 Conclusions
Every spectroscopic tool has its dark spots. Some gaps are obvious, such as the difficulty of microwave rotational spectroscopy in characterising non-polar compounds or the inability of low-resolution direct absorption spectroscopy to disentangle species with little spectral variation. Others are more interesting because they are initially unexpected and their multi-spectroscopic investigation may reveal new molecular dynamics. The simplest complexes between carboxylic acids and alcohols clearly fall in this category. Our work shows that the elusiveness of the MF complex of methanol with formic acid in microwave spectroscopy cannot be due to its generally low abundance in supersonic jets. The elusiveness of formic acid OH stretching signals in linear FTIR and Raman spectroscopy when hydrogen-bonded to methanol cannot just be due to a small transition moment or accidental spectral overlap but rather may reflect rapid energy flow from the initially excited states with their mobile protons, giving rise to pronounced spectral broadness. Such missing spectral signatures of high-frequency stretching vibrations in combination with strong hydrogen bonding are not completely new, but more typical in electronically exited states45,46 or charged systems.47 To identify the spectroscopic gaps, scaled harmonic DFT predictions have again proven to be helpful. The B3LYP-D3/def2-QZVP approach requires scaling of OH stretching fundamental predictions by 0.96, roughly the product of 0.94 for anharmonicity and 1.02 for too soft OH bonds.12 This closely reproduces free and weakly hydrogen-bonded situations, whereas stronger hydrogen bonds require scaling factors slightly closer to 1.00 due to the increased importance of high-frequency motions orthogonal to the hydrogen bond. Such scaled harmonic spectra can thus only be applied for mild extrapolations. The anharmonic hybrid CCSD(T)//MP2 VPT2 approach, after being validated for TF,12 again proved to be an excellent trade-off between computational cost and accuracy (errors < 10 cm−1). For the experimentally elusive bands, explorative effective Hamiltonian VPT2 calculations support intensity redistribution scenarios into either discrete sets of absorption peaks or continuous band patterns due to fast vibrational energy redistribution after OH/D stretch excitation of MF. A detailed analysis will be presented elsewhere.To come back to the title, after mixing gaseous methanol and formic acid in helium for less than a few minutes, one can largely suppress esterification and study exclusively the pre-reactive complexes by expanding the gas mixture through a slit nozzle.
Conflicts of interest
There are no conflicts to declare.Acknowledgements
This work was funded by the Deutsche Forschungsgemeinschaft (DFG, German Research Foundation) – 465181753 (SU 121/8-1) and its benchmarking aspects were promoted by the GRK2455 (project 389479699). We thank Sönke Oswald for helpful experimental support and discussions. We acknowledge early discussions with Jer-Lai Kuo about the anharmonic treatment of such complexes and later discussions with John Stanton.References
- Y. Liu, E. Lotero and J. G. Goodwin Jr., J. Mol. Catal. A: Chem., 2006, 245, 132–140 CrossRef CAS.
- M. M. Lawal, T. Govender, G. E. M. Maguire, B. Honarparvar and H. G. Kruger, J. Mol. Model., 2016, 22, 235 CrossRef PubMed.
- L. Evangelisti, L. Spada, W. Li, F. Vazart, V. Barone and W. Caminati, Angew. Chem., Int. Ed., 2017, 56, 3872–3875 CrossRef CAS PubMed.
- R. F. Curl Jr., J. Chem. Phys., 1959, 30, 1529–1536 CrossRef.
- W. Li, L. Spada, L. Evangelisti and W. Caminati, Spectrochim. Acta, Part A, 2021, 254, 119621 CrossRef CAS PubMed.
- W. Sun and M. Schnell, Cyclobutanemethanol - 2021 International Symposium on Molecular Spectroscopy (Virtual): June 21–25, 2021, Talk WD03 DOI:10.15278/isms.2021.WD03.
- L. Evangelisti, L. Spada, W. Li, I. Federici and W. Caminati, Mol. Phys., 2018, 116, 3503–3506 CrossRef CAS.
- W. Li, L. Spada, L. Evangelisti, L. Di Silvio and W. Caminati, J. Mol. Struct., 2020, 1209, 127952 CrossRef CAS.
- L. Spada, L. Evangelisti, W. Li, R. Orlacchio and W. Caminati, J. Phys. Chem. A, 2019, 123, 1785–1789 CrossRef CAS PubMed.
- C. Emmeluth, M. A. Suhm and D. Luckhaus, J. Chem. Phys., 2003, 118, 2242–2255 CrossRef CAS.
- E. L. Sibert III, J. Chem. Phys., 2019, 150, 090901 CrossRef PubMed.
- S. M. Schweer, A. Nejad and M. A. Suhm, Phys. Chem. Chem. Phys., 2022, 24, 26449–26457 RSC.
- M. A. Suhm and F. Kollipost, Phys. Chem. Chem. Phys., 2013, 15, 10702–10721 RSC.
- M. Gawrilow and M. A. Suhm, Molecules, 2021, 26, 4523 CrossRef CAS PubMed.
- K. Mackeprang, Z.-H. Xu, Z. Maroun, M. Meuwly and H. G. Kjaergaard, Phys. Chem. Chem. Phys., 2016, 18, 24654–24662 RSC.
- J. Vander Auwera, K. Didriche, A. Perrin and F. Keller, J. Chem. Phys., 2007, 126, 124311 CrossRef CAS PubMed.
- S. G. Balasubramani, G. P. Chen, S. Coriani, M. Diedenhofen, M. S. Frank, Y. J. Franzke, F. Furche, R. Grotjahn, M. E. Harding, C. Hättig, A. Hellweg, B. Helmich-Paris, C. Holzer, U. Huniar, M. Kaupp, A. Marefat Khah, S. Karbalaei Khani, T. Müller, F. Mack, B. D. Nguyen, S. M. Parker, E. Perlt, D. Rappoport, K. Reiter, S. Roy, M. Rückert, G. Schmitz, M. Sierka, E. Tapavicza, D. P. Tew, C. van Wüllen, V. K. Voora, F. Weigend, A. Wodyński and J. M. Yu, J. Chem. Phys., 2020, 152, 184107 CrossRef CAS PubMed.
- H.-J. Werner, P. J. Knowles, F. R. Manby, J. A. Black, K. Doll, A. Heßelmann, D. Kats, A. Köhn, T. Korona, D. A. Kreplin, Q. Ma, T. F. Miller III, A. Mitrushchenkov, K. A. Peterson, I. Polyak, G. Rauhut and M. Sibaev, J. Chem. Phys., 2020, 152, 144107 CrossRef CAS PubMed.
- M. J. Frisch, G. W. Trucks, H. B. Schlegel, G. E. Scuseria, M. A. Robb, J. R. Cheeseman, G. Scalmani, V. Barone, G. A. Petersson, H. Nakatsuji, X. Li, M. Caricato, A. V. Marenich, J. Bloino, B. G. Janesko, R. Gomperts, B. Mennucci, H. P. Hratchian, J. V. Ortiz, A. F. Izmaylov, J. L. Sonnenberg, D. Williams-Young, F. Ding, F. Lipparini, F. Egidi, J. Goings, B. Peng, A. Petrone, T. Henderson, D. Ranasinghe, V. G. Zakrzewski, J. Gao, N. Rega, G. Zheng, W. Liang, M. Hada, M. Ehara, K. Toyota, R. Fukuda, J. Hasegawa, M. Ishida, T. Nakajima, Y. Honda, O. Kitao, H. Nakai, T. Vreven, K. Throssell, J. A. Montgomery Jr., J. E. Peralta, F. Ogliaro, M. J. Bearpark, J. J. Heyd, E. N. Brothers, K. N. Kudin, V. N. Staroverov, T. A. Keith, R. Kobayashi, J. Normand, K. Raghavachari, A. P. Rendell, J. C. Burant, S. S. Iyengar, J. Tomasi, M. Cossi, J. M. Millam, M. Klene, C. Adamo, R. Cammi, J. W. Ochterski, R. L. Martin, K. Morokuma, O. Farkas, J. B. Foresman and D. J. Fox, Gaussian 16 Revision A.03, Gaussian Inc., Wallingford CT, 2016 Search PubMed.
- S. Grimme, J. Antony, S. Ehrlich and H. Krieg, J. Chem. Phys., 2010, 132, 154104 CrossRef PubMed.
- S. Grimme, S. Ehrlich and L. Goerigk, J. Comput. Chem., 2011, 32, 1456–1465 CrossRef CAS PubMed.
- F. Weigend and R. Ahlrichs, Phys. Chem. Chem. Phys., 2005, 7, 3297–3305 RSC.
- T. B. Adler, G. Knizia and H.-J. Werner, J. Chem. Phys., 2007, 127, 221106 CrossRef PubMed.
- W. Győrffy and H.-J. Werner, J. Chem. Phys., 2018, 148, 114104 CrossRef PubMed.
- K. A. Peterson, T. B. Adler and H.-J. Werner, J. Chem. Phys., 2008, 128, 084102 CrossRef PubMed.
- P. R. Franke, J. F. Stanton and G. E. Douberly, J. Phys. Chem. A, 2021, 125, 1301–1324 CrossRef CAS PubMed.
- A. Nejad, Vibrational dynamics of formic acid and its dimer: FTIR and Raman jet spectroscopy and theory, Niedersächsische Staats- und Universitätsbibliothek Göttingen, Göttingen, 2022 DOI:10.53846/goediss-9602.
- A. Nejad, K. A. E. Meyer, F. Kollipost, Z. Xue and M. A. Suhm, J. Chem. Phys., 2021, 155, 224301 CrossRef CAS PubMed.
- D. A. Matthews, L. Cheng, M. E. Harding, F. Lipparini, S. Stopkowicz, T.-C. Jagau, P. G. Szalay, J. Gauss and J. F. Stanton, J. Chem. Phys., 2020, 152, 214108 CrossRef CAS PubMed.
- J. Vázquez and J. F. Stanton, Mol. Phys., 2006, 104, 377–388 CrossRef.
- V. Barone, M. Biczysko and J. Bloino, Phys. Chem. Chem. Phys., 2014, 16, 1759–1787 RSC.
- J. A. Frey, C. Holzer, W. Klopper and S. Leutwyler, Chem. Rev., 2016, 116, 5614–5641 CrossRef CAS PubMed.
- F. Kollipost, R. Wugt Larsen, A. V. Domanskaya, M. Nörenberg and M. A. Suhm, J. Chem. Phys., 2012, 136, 151101 CrossRef CAS PubMed.
- B. Ruscic and D. H. Bross, Active Thermochemical Tables (ATcT) values based on ver. 1.122r of the Thermochemical Network, 2021, available at https://ATcT.anl.gov.
- M. A. Suhm, Angew. Chem., Int. Ed., 2014, 53, 1714–1715 CrossRef CAS PubMed.
- R. E. Miller, Acc. Chem. Res., 1990, 23, 10–16 CrossRef CAS.
- S. Oswald, E. Meyer and M. A. Suhm, J. Phys. Chem. A, 2018, 122, 2933–2946 CrossRef CAS PubMed.
- R. Wugt Larsen, P. Zielke and M. A. Suhm, J. Chem. Phys., 2007, 126, 194307 CrossRef PubMed.
- The vibrational formic acid databases are being digitised and can be found on https://qmbench.net/databases/formic-acid-vibrations (last accessed on 4.08.2023).
- The two F bands at the higher- (3560 cm−1) and lower-wavenumber (3153 cm−1) end correspond to weakly perturbing resonance partners of the bright OH and CH stretching fundamentals, respectively. The latter band is a binary combination involving the CH bend and C
![[double bond, length as m-dash]](https://www.rsc.org/images/entities/char_e001.gif) O stretch whereas the nature of the former peak remains rather elusive. Chan and Nesbitt recently proposed an assignment to a multi-quantum excitation involving the OCO bend, C–O stretch, and OH torsion,48 whereas a previous analysis based on Van Vleck perturbation theory questions the involvement of the OCO bend.49 A theoretical investigation of the OH stretching range is currently underway.
O stretch whereas the nature of the former peak remains rather elusive. Chan and Nesbitt recently proposed an assignment to a multi-quantum excitation involving the OCO bend, C–O stretch, and OH torsion,48 whereas a previous analysis based on Van Vleck perturbation theory questions the involvement of the OCO bend.49 A theoretical investigation of the OH stretching range is currently underway. - G. Herzberg, Molecular spectra and molecular structure. II. Infrared and Raman spectra of polyatomic molecules, D. van Nostrand, New York, 1st edn, 1945 Search PubMed.
- Q. Yang, M. Mendolicchio, V. Barone and J. Bloino, Front. Astron. Space Sci., 2021, 8, 665232 CrossRef.
- M. Pettersson, E. M. S. Maçôas, L. Khriachtchev, R. Fausto and M. Räsänen, J. Am. Chem. Soc., 2003, 125, 4058–4059 CrossRef CAS PubMed.
- P. Soulard and B. Tremblay, J. Mol. Struct., 2022, 1257, 132604 CrossRef CAS.
- E. L. Sibert III, K. N. Blodgett and T. S. Zwier, J. Phys. Chem. A, 2021, 125, 7318–7330 CrossRef PubMed.
- T. Ebata, N. Mizuochi, T. Watanabe and N. Mikami, J. Phys. Chem., 1996, 100, 546–550 CrossRef CAS.
- A. Hayd, E. G. Weidemann and G. Zundel, J. Chem. Phys., 1979, 70, 86–91 CrossRef CAS.
- Y.-C. Chan and D. J. Nesbitt, J. Mol. Spectrosc., 2023, 392, 111743 CrossRef CAS.
- A. Nejad and E. L. Sibert III, J. Chem. Phys., 2021, 154, 064301 CrossRef CAS PubMed.
Footnotes |
| † Electronic supplementary information (ESI) available: Experimental details and auxiliary data for the Results and discussion section. See DOI: https://doi.org/10.1039/d3cp04705a |
| ‡ Current address: Physical and Theoretical Chemistry Laboratory, University of Oxford, South Parks Road, Oxford OX1 3QZ, UK. |
| This journal is © the Owner Societies 2023 |