
 Open Access Article
 This Open Access Article is licensed under a
 Creative Commons Attribution 3.0 Unported Licence
The adsorption of nitrobenzene over an alumina-supported palladium catalyst: an infrared spectroscopic study†
Annelouise M.
McCullagh
 a,
Emma K.
Gibson
a,
Stewart F.
Parker
ab,
Keith
Refson
b and
David
Lennon
*a
a,
Emma K.
Gibson
a,
Stewart F.
Parker
ab,
Keith
Refson
b and
David
Lennon
*a
aSchool of Chemistry, Joseph Black Building, University of Glasgow, Glasgow, G12 8QQ, UK. E-mail: David.Lennon@glasgow.ac.uk; Tel: +44-141-330-4372
bISIS Neutron and Muon Facility, STFC Rutherford Appleton Laboratory, Chilton, Oxon OX11 0QX, UK
First published on 8th September 2023
Abstract
As part of an on-going programme of development of an aniline synthesis catalyst suitable for operation at elevated temperatures, the geometry of the adsorption complex for nitrobenzene on a 5 wt% Pd/Al2O3 catalyst is investigated by infrared (IR) spectroscopy. Via an appreciation of the reduced site symmetry resulting from adsorption, application of the metal surface selection rule, and observation of in-plane modes only, the adsorption complex (Pd–nitrobenzene) at 28 °C is assigned as occurring vertically or tilted with respect to the metal surface, adopting Csσv(yz) symmetry. Moreover, adsorption occurs via a single Pd–O bond. Single molecule DFT calculations and simulated IR spectra assist vibrational assignments but indicate a parallel adsorption geometry to be energetically favourable. The contradiction between calculated and observed structures is attributed to the DFT calculations corresponding to an isolated molecule adsorption complex, while IR spectra relate to multi molecule adsorption that is encountered during sustained catalytic turnover. Residual hydrogen from the catalyst reduction stage leads to aniline formation on the Pd surface at low nitrobenzene coverages but, on increasing nitrobenzene exposure, the aniline is forced on to the alumina support. A reaction scheme is proposed whereby the nitrobenzene adsorption geometry is inherently linked to the high aniline selectivity observed for Pd/Al2O3 catalysts.
1. Introduction
The heterogeneously catalysed hydrogenation of nitrobenzene is a commonly employed route to produce aniline, which in turn is a key component in the formation of methylene diphenyl diisocyanate (MDI) utilised throughout the polyurethane industry.1 Supported Pd catalysts are regularly described as achieving high aniline selectivity from nitrobenzene hydrogenation2–9 owing to the high activity and propensity of Pd to reduce functional groups in proximity to aromatic structures. The current investigation aims to investigate nitrobenzene adsorption over a reference Pd/Al2O3 catalyst via infrared (IR) spectroscopy to better understand the origins of this favourable aniline selectivity.Nitrobenzene and aniline both possess a phenyl ring and a functional group moiety, permitting the possibility of various interactions between the molecules and a catalyst surface. It follows that each of these potential interactions may result in different preferential orientations of nitrobenzene and aniline on metal surfaces – a parameter which may be directly related to catalytic outputs. A DFT study by Chen et al. highlighted the possible relationship between observed chemical pathways and adsorbate geometry, where 100% product selectivity during hydrogenation of p-chloronitrobenzene using platinum nanoparticles encapsulated into zeolite Y as a catalyst was reported.10 This perfect selectivity was attributed to an end-on orientation of p-chloronitrobenzene enforced by steric constraints of the zeolite pore size.
The geometry of adsorbates may be inferred from IR spectra with reference to the metal surface selection rule (MSSR):11 molecular vibrations that yield a dipole parallel to a metal surface are unobservable, whilst vibrations yielding a non-parallel dipole to a metal surface are observable.12,13
The IR spectrum of nitrobenzene (C2v symmetry) has been extensively described,14–17 with two high intensity peaks centred around 1530 and 1350 cm−1 assigned to the in-plane asymmetric (B2 symmetry) and symmetric (A1 symmetry) NO2 stretching modes of nitrobenzene (νAS(NO2) and νS(NO2)), respectively, being the most prominent features. In addition, several out-of-plane B1 symmetry modes are observed, including a moderate intensity band at ca. 705 cm−1 that corresponds to the out-of-plane NO2 deformation mode (δoop(NO2)) and smaller features centred at ca. 935 and 793 cm−1, both arising from out-of-plane C–H deformation modes (δoop(CH)).14,15
Surface science studies are insightful. Richardson and co-workers used reflection–absorption infrared spectroscopy (RAIRS) to investigate the adsorption of nitrobenzene on Cu(110) over a range of temperatures.18 For temperatures <223 K multilayer adsorption was observed, with no preferential orientation of the nitrobenzene molecule relative to the metal surface. Adsorption at 300 K led to dissociation of the nitrobenzene. A subsequent vibrational electron energy loss spectroscopy study established the retained moieties to be phenyl species and atomic oxygen.18 Koel and co-workers used RAIRS to investigate the adsorption of nitrobenzene on Au(111) at low temperatures.19 For monolayer coverages, only two bands were observed: an out-of-plane CH deformation at 793 cm−1 and a NO2 deformation at 710 cm−1. Assuming C2v symmetry, these modes exhibit B1 symmetry, indicating the nitrobenzene molecule to be aligned parallel to the surface. On increasing coverage, modes with A1 and B2 symmetry were observed, indicative of a change of molecular orientation. As neither in-plane nor out-of-plane modes are screened completely, the molecule was assumed to adopt a tilted geometry. Temperature-programmed desorption measurements showed the monolayer to exhibit a desorption maximum at 290 K.19 Bridging the gap between surface science and heterogeneous catalysis, Corma and co-workers have examined the adsorption of nitroaromatics on Au single crystal surfaces and supported Au particles.20 For the case of nitrostyrene adsorption, the Au/support interface was reported to be the active site of Au/TiO2, which exhibits high chemo-selectivity via preferential activation of the nitro group.
Density functional theory (DFT) is widely used to investigate adsorbate orientation, and has been utilised to investigate the adsorption geometry of nitrobenzene on varying systems. A recent study by Hajiahmadi et al. considered the likelihood of six different nitrobenzene adsorption configurations, three vertical and three parallel, over Pd(111).21 They found a parallel nitrobenzene adsorption geometry with N atoms located on top of Pd atoms to be most favourable for adsorption to Pd(111). Additionally, Boronat et al. conducted a DFT investigation into nitroarene adsorption primarily over non-noble metals, with the inclusion of Pd(111) for comparison, and report parallel nitrobenzene adsorption over Pd(111) via the aromatic ring with the NO2 group twisted relative to the aromatic moiety.22 Interestingly, Boronat and co-workers reported strictly perpendicular nitrobenzene adsorption over the non-noble metal Cu(111) and used this specified adsorbate geometry to propose a possible non-noble metal catalyst candidate for high selectivity aniline synthesis. Contrarily for Pd studies, a DFT investigation of nitrobenzene adsorption on bimetallic Pd3/Pt(111) found vertical nitrobenzene adsorption over Pd crystallites to be preferable to parallel adsorption.23 Comparison of these opposing outcomes indicates that nitrobenzene adsorption orientation is substrate dependent. This perspective meshes with a recent spectroscopic and computational study by Millán and co-workers on nitrobenzene activation on non-noble metals-based mono- and bimetallic catalysts.24
This article concentrates on the adsorption of nitrobenzene over a 5 wt% Pd/Al2O3 catalyst (GU-1) that is a model for low metal loading Pd/Al2O3 aniline synthesis catalysts intended for operation at elevated temperatures.8 The performance of this catalyst in vapour phase nitrobenzene hydrogenation has previously been described,8 as has the morphology of the Pd crystallites.25 The approach adopted is as follows. A complete vibrational analysis of nitrobenzene is undertaken with reference to measured solid and liquid phase spectra (inelastic neutron scattering, infrared spectroscopy, and Raman scattering). The infrared spectrum of nitrobenzene adsorbed on GU-1 is compared to simulated spectra corresponding to DFT calculations for the adsorption of a single unit of nitrobenzene on a Pd(111) surface, providing information on the geometry of the adsorption complex. The unidentate nature of the interaction between the nitro group and the Pd surface is consistent with established reaction schemes. A small quantity of aniline is formed at the Pd surface at low nitrobenzene exposures, but it is forced on to the alumina support on increasing nitrobenzene exposure. A reaction scheme is proposed whereby the nitrobenzene adsorption geometry is inherently linked to the high aniline selectivity observed for Pd/Al2O3 catalysts.
2. Experimental
A 5 wt% Pd/γ-Al2O3 catalyst was obtained from Alfa Aesar (ref.: 11713). The catalyst has been comprehensively characterised25 and is referred to here, and in previous communications from this group,8,25 as GU-1.2.1 Computational methods
The Gaussian0926 and GaussView software packages were used to derive the vibrational spectrum of gas phase nitrobenzene. Density functional theory (DFT) was utilised with the B3LYP functional and the 6-311G++(3df.2p) basis set. A DFT scaling factor of 0.967 was used on calculated wavenumbers.27 Solid state calculations used the plane wave pseudopotential method as implemented in CASTEP.28 The generalized gradient approximation (GGA) was used with the PBE functional.29 The Tkatchenko and Scheffler-dispersion correction was used to account for the long-range interactions.30 For nitrobenzene, the initial structure used the experimental crystal structure that was determined at 103 K.31 The plane wave cut-off was 1020 eV and the Brillouin zone sampling used a 12 × 4 × 4 (48 k-points) Monkhorst–Pack grid. The adsorption of nitrobenzene on Pd(111) was investigated using a three-layer slab with (111) truncation. A 15 Å vacuum gap was used. For both the parallel and vertical orientations, the plane wave cut-off was 1020 eV and the Brillouin zone sampling used a 11 × 11 × 1 (36 k-points) Monkhorst–Pack grid. After geometry optimisation, the vibrational transition energies were calculated with density functional perturbation theory.32 To reduce the time required for the calculation, only the internal modes of the nitrobenzene were calculated. The computational outputs include the amplitude of motion of each atom in the vibrational mode, this enables mode visualisation and enables the inelastic neutron scattering (INS) spectrum to be calculated using the program AbINS.33In Section 3.2.3 Gaussian calculations are used to simulate the IR spectra for nitrobenzene adopting parallel and vertical adsorption geometries relative to the Pd surface. Here, with consideration of point group theory and the MSSR, simulated spectra for parallel (Csσv(xz)) and mono-dentate vertical (Csσv(yz)) nitrobenzene adsorption over a metal surface were produced by adjusting the intensity of non-accessible modes to 0 a.u.
2.2 Vibrational spectroscopy
Infrared spectra (256 scans, 4 cm−1 resolution, eight-times zerofilling) of nitrobenzene were measured with a Bruker Vertex 70 Fourier transform infrared (FT-IR) spectrometer. The liquid at room temperature was measured by attenuated total internal reflection (ATR) using a Bruker Diamond ATR accessory. Variable temperature (210–296 K) spectra were recorded with a low temperature SpecAc Golden Gate ATR accessory. Raman spectra were recorded with a Bruker Fourier transform Raman spectrometer (64 scans, 4 cm−1 resolution, eight-times zerofilling, 500 mW laser power at 1064 nm). The sample was held in a quartz cuvette and the liquid measured at room temperature and the solid after immersion of the cuvette in liquid nitrogen. INS spectra of the solid were recorded at 10 K from the sample held in a flat-plate indium wire sealed aluminium can using the broad band, high resolution spectrometer TOSCA34 at ISIS.352.3 DRIFTS measurements: nitrobenzene adsorption and temperature-programmed IR spectroscopy
In situ DRIFTS measurements were performed with a Bruker Vertex 70 FT-IR spectrometer fitted with a MCT detector. GU-1 was supplied as a powder and was used directly. Ca. 50 mg of GU-1 was placed into a Harrick Praying Mantis DRIFTS reaction chamber. A Harrick ATC heater permitted control of cell temperature. Activation of Pd crystallites occurred in situ using a flow of helium (35 mL min−1, BOC gases, 99.9%) and hydrogen (15 mL min−1, BOC gases, 99.8%) while heating to 110 °C. This temperature was held for 30 minutes. The temperature was then increased to 200 °C for one hour, with the hydrogen flow stopped after 30 minutes and the sample allowed to return to ambient temperature in flowing He. A He purge of 18 hours was utilised to minimise the levels of retained hydrogen within GU-1 from the reduction process, which would otherwise result in nitrobenzene hydrogenation to aniline. Post-purge, a background spectrum was collected at 28 °C.Nitrobenzene was supplied via a nitrobenzene bubbler system which supplied 61.2 μmol(NB) min−1 g(cat)−1 to the reaction chamber in the vapour phase using He as a carrier gas. A 5-minute pulse duration was selected, so that 1 pulse corresponded to a nitrobenzene exposure of 0.31 mmol(NB) g(cat)−1. After each pulse, the cell was purged with He for 10 minutes to evacuate unbound nitrobenzene before spectral acquisition.
For desorption experiments, the catalyst was heated in situ under a flow of He and maintained at the designated temperature for 30 minutes before cooling to 28 °C for spectral acquisition. This process was repeated for 50, 100, 120, 140, 160, 180 and 200 °C. All spectra were recorded at 28 °C for 520 scans at 4 cm−1 resolution. Spectra are presented as difference spectra, where the spectrum of the activated catalyst has been subtracted from that of a nitrobenzene dosed spectrum. No additional spectrum treatment was performed. A minor aniline impurity was present in the feed stream to the IR cell, which could not be eliminated. Though vexatious, its minimal presence in the IR spectra can be accounted for and will be suitably considered in the following sections.
3. Results
3.1 Molecular symmetry and DFT: assigning key nitrobenzene modes
In the gas and liquid phases nitrobenzene exhibits C2v symmetry,36 see Fig. S1 in the ESI.† In the solid state, there are four molecules in the primitive cell, each on a site with C1 symmetry, however, the C2v symmetry is largely retained.31 Reference to the C2v character table confirms modes possessing A1, B1 and B2 symmetry are infrared active.37
Fig. 1 shows the infrared and Raman spectra in the liquid phase, the infrared, Raman, and INS spectra in the solid state, together with the calculated infrared and INS spectra for the solid state. Table 1 presents experimental wavenumber values and DFT-derived frequencies for nitrobenzene in the liquid phase. The vibrational spectra of mono-substituted benzenes have been extensively studied over the decades and the various schemes are lucidly discussed by Gardner and Wright.38 Based on DFT calculations, they proposed some revision to the assignments and designated the modes as  . The form of the modes and their usual ranges are reproduced from ref. 38 in the ESI† (Fig. S2 and Table S1). We have adopted their assignment scheme and the vibrational assignments and associated symmetry designations are also listed in Table 1.
 | ||
| Fig. 1 Experimental and calculated vibrational spectra of nitrobenzene. Top panel: infrared spectra of (a) liquid nitrobenzene at room temperature, (b) solid nitrobenzene at 210 K, (c) calculated spectrum for solid nitrobenzene. Middle panel: Raman spectra of (d) liquid nitrobenzene at room temperature, (e) solid nitrobenzene. Bottom panel: INS spectrum (f) solid nitrobenzene at 10 K and (g) calculated spectrum for solid nitrobenzene. | ||
| Mode | Sym. | Expt.a | DFTb | Assignment | ||
|---|---|---|---|---|---|---|
| a Experimental wavenumbers for nitrobenzene are from Fig. 1a, or otherwise indicated. b Scaling factor for DFT frequencies was 0.967.40 c Ref. 41. d This mode appears twice because it is mixed with the NO2 wag. e Key diagnostic modes for orientational assignments in the present investigation. | ||||||
| 1 | A2 | 52c | 57 | τ(Ph-NO2) | oop | |
| 2 | B1 | 179 | 164 | δ oop(Ph-NO2) |

|
oop |
| 3 | B2 | 256 | 249 | δ ip(Ph-NO2) |

|
ip |
| 4 | A1 | 396 | 383 | Ring deformation |

|
ip |
| 5 | A2 | 423 | 404 | Ring deformation |

|
oop |
| 6 | B1 | 454 c | 432 | Ring deformation |

|
oop |
| 7 | B2 | 529 | 508 | NO2 rock | ip | |
| 8 | B2 | 608 | 607 | δ ip(CCC) |

|
ip |
| 9 | B1 | 677 | 663 | δ oop(CH) |

|
oop |
| 10 | A1 | 680 | 671 | δ ip(ring) + δip(NO2) + ν(CN) |

|
ip |
| 11 | B1 | 700 | 704 | NO2 wag + δoop(CH) |

|
oop |
| 12e | B1 | 793 | 791 | NO2 wag + δoop(CH) |

|
oop |
| 13 | A2 | 837 | 831 | δ oop(CH) |

|
oop |
| 14 | A1 | 851 | 839 | NO2 scissors | ip | |
| 15e | B1 | 935 | 936 | δ oop(CH) |

|
oop |
| 16 | A2 | 975 | 972 | δ oop(CH) |

|
oop |
| 17 | A1 | 977 | 977 | δ ip(ring) |

|
ip |
| 18 | B1 | 991 | 988 | δ oop(CH) |

|
oop |
| 19 | A1 | 1003 | 1006 | δ ip(ring) |

|
ip |
| 20 | B2 | 1069 | 1063 | δ ip(CH) |

|
ip |
| 21 | A1 | 1094 | 1078 | ν(Ph-NO2) |

|
ip |
| 22 | B2 | 1145 | δ ip(CH) |

|
ip | |
| 23 | A1 | 1162 | 1157 | δ ip(CH) |

|
ip |
| 24 | B2 | 1248 | 1294 | δ ip(CH) |

|
ip |
| 25 | B2 | 1308 | 1305 | ν(CC) |

|
ip |
| 26e | A1 | 1344 | 1348 | ν S(NO2) | ip | |
| 27 | B2 | 1415 | 1439 | ν(CC) |

|
ip |
| 28 | A1 | 1478 | 1462 | ν(CC) |

|
ip |
| 29e | B2 | 1528 | 1531 | ν AS(NO2) | ip | |
| 30 | A1 | 1588 | 1572 | ν(CC) |

|
ip |
| 31 | B2 | 1606 | 1596 | ν(CC) |

|
ip |
| 32 | A1 | 3029 | 3066 | ν(CH) |

|
ip |
| 33 | B2 | 3077 | 3079 | ν(CH) |

|
ip |
| 34 | A1 | 3086 | ν(CH) |

|
ip | |
| 35 | B2 | 3107 | 3116 | ν(CH) |

|
ip |
| 36 | A1 | 3107 | 3117 | ν(CH) |

|
ip |
In the solid state, the presence of four molecules in the primitive cell results in factor group splitting. However, periodic-DFT calculations of the complete unit cell show that for most of the internal modes this is 10 cm−1 or less, although there are exceptions (see Table S2, ESI†). These are the Ph–NO2 torsion and some of the out-of-plane C–H bending modes. As can be seen from Fig. 1, the calculated infrared and INS spectra are in good agreement with the experimental data (cf.Fig. 1b, c and f, g).
As mentioned in the Introduction, owing to their high intensity,14,21 the B2 symmetry νAS(NO2) and A1 symmetry νS(NO2) modes at 1531 and 1348 cm−1 respectively, represent key nitrobenzene modes for orientational diagnostics. The IR spectrum of activated GU-1 is presented in Fig. S3 (ESI†) and exhibits a spectral cut-off due to strong Al–O phonon modes of the alumina support39 at about 1100 cm−1. With respect to Table 1, in the presence of the catalyst, several B1 symmetry diagnostic nitrobenzene modes are inaccessible; for example, the δoop(NO2) feature present at 704 cm−1. However, rather fortuitously, GU-1's γ-alumina displays a narrow transmission window in the 970–745 cm−1 range (Fig. S3, ESI†), which enables access to two δoop(CH) B1 symmetry modes at 791 and 936 cm−1, respectively. Therefore, on this basis, vibrational transitions 12, 15, 26 and 29 (Table 1) were selected as key modes for orientational diagnostics.
3.2 DRIFTS: adsorbate geometry
 | ||
| Fig. 2 DRIFTS spectra of nitrobenzene adsorption over (a) GU-1 (blue) and (b) KBr (black) at 28 °C. Wavenumber range: 1700–660 cm−1. Note the differences in y-axes scales for both spectra. | ||
The observation of A1 and B2 key modes and absence of B1 modes in spectra associated with nitrobenzene adsorption to the catalyst provides information on the form of the adsorption complex. However, prior to assignment of molecular geometry utilising the MSSR, it is essential to consider the impact of binding to a metal surface on the molecular symmetry of nitrobenzene; thus, reference to the C2v correlation table is necessary. C2v symmetry correlates to four lower symmetry point groups:37C1, C2, Csσv(xz) and Csσv(yz), where Csσv(xz) and Csσv(yz) represent a molecule possessing Cs symmetry with a single mirror plane in the molecule's xz and yz-planes, respectively.
Table 2 considers the accessibility of each key nitrobenzene diagnostic mode during nitrobenzene adsorption to a metal surface in a vertical or parallel orientation for nitrobenzene exhibiting C2v, C2, Csσv(xz) and Csσv(yz) symmetry. With reference to this table, at a saturation coverage of nitrobenzene, Fig. 2a indicates that nitrobenzene exhibits Csσv(yz) symmetry and is positioned in a vertical orientation over the metal surface; a deduction that contradicts previously introduced DFT investigations.20,21
| Symmetric Representations | |||||||||||||
|---|---|---|---|---|---|---|---|---|---|---|---|---|---|
| Assign. | Expt.a (cm−1) | C 2v | C2 | C s σ v(xz) | C s σ v(yz) | ||||||||
| ⊥b | ‖c | ⊥b | ‖c | ⊥b | ‖c | ⊥b | ‖c | ||||||
| a Experimental wavenumbers for nitrobenzene are from Fig. 1a. b Indicates if mode is allowed during vertical nitrobenzene adsorption over a metal surface, as per the MSSR.11 N = no; Y = yes. c Indicates if mode is allowed during parallel nitrobenzene adsorption over a metal surface, as per the MSSR.11 N = no; Y = yes. d Corresponding orientation is not possible for nitrobenzene exhibiting stated symmetric representation. | |||||||||||||
| NO2 wag + δoop(CH) | 794 | B1 | N | Y | B | N | Y | A′ | Y | Y | A′′ | N | |
| δ oop(CH) | 935 | B1 | N | Y | B | N | Y | A′ | Y | Y | A′′ | N | |
| ν S(NO2) | 1351 | A1 | Y | N | A | Y | N | A′ | Y | N | A′ | Y | |
| ν AS(NO2) | 1527 | B2 | N | N | B | N | N | A′′ | Y | N | A′ | Y | |
For nitrobenzene to exhibit Csσv(yz) symmetry adsorption must occur via only one Pd–O bond (Fig. 3(c and d)); as binding to the Pd surface via both oxygens of the nitro group would retain the C2v symmetry of nitrobenzene (Fig. 3(a and b)). For vertical nitrobenzene bidentate adsorption (C2v symmetry) the νS(NO2) and νAS(NO2) modes exhibit A1 and B2 symmetry, respectively. For the A1νS(NO2) (Fig. 3b) the resulting dipole (Fig. 3, orange arrow) is positioned perpendicularly to the metal surface, thus with consideration of the MSSR, this mode would be observed in IR spectra,11,13 as is the case during adsorption to GU-1. However, the dipole associated with the B2 symmetry νAS(NO2) mode (Fig. 3a) is aligned parallel to the metal surface during bidentate vertical adsorption, and resultingly, would not be observable in IR spectra. Thus, a bidentate vertical adsorption of nitrobenzene to the metal surface, and thus retention of C2v symmetry during binding, is not possible as both the A1νS(NO2) and B2νAS(NO2) symmetry modes of nitrobenzene were clearly observed during adsorption to GU-1 (Fig. 2a). Conversely, for monodentate vertical nitrobenzene adsorption (Csσv(yz)) both the νS(NO2) and νAS(NO2) modes correlate to A′ symmetry, and so are both totally symmetric in-plane modes (Fig. 3(c and d)). The resulting dipole for each A′ mode during a vertical nitrobenzene adsorption would be positioned perpendicular to the metal surface and would therefore be MSSR allowed. Thus, nitrobenzene adsorbs to the Pd crystallites of GU-1 in a vertical orientation via monodentate binding, and not bidentate binding of the metal group. Moving forward, nitrobenzene modes will be referred to as exhibiting either A′ or A′′ symmetry as encountered for Csσv(yz) symmetry (Table 2).
 | ||
| Fig. 3 Visualisation of νS(NO2) and νAS(NO2) nitrobenzene modes during vertical adsorption over a metal surface via (a) and (b) bidentate and (c) and (d) monodentate binding. Orange arrows indicate the dipole derivative unit vector associated with each mode. Grey parallelograms symbolise a non-specific Pd crystallite. White, grey, blue and red balls represent hydrogen, carbon, nitrogen and oxygen, respectively. | ||
The known chemistry of metal catalysed nitrobenzene hydrogenation is supportive of the proposed geometric structure. A scenario in which both O atoms of nitrobenzene simultaneously interacted with the metal would result in a rapid and simultaneous one-step hydrogenation of the nitro group with no observable intermediates. However, as reported by Gelder et al., hydrogenation of the nitro moiety occurs in a stepwise fashion, and intermediates such as phenylhydroxylamine (PHA) are accessible during nitrobenzene hydrogenation with Pd (Scheme 1).42 Moreover, this observable intermediate, PHA, exhibits Csσv(yz) symmetry, further strengthening the hypothesis of nitrobenzene exhibiting the same symmetry during adsorption to GU-1. Thus, we assert that the assignment of Csσv(yz) symmetry and monodentate binding for nitrobenzene adsorption over the catalyst is consistent with the reported chemistry.
 | ||
| Scheme 1 A schematic representation for aniline (ANL) formation via the stepwise hydrogenation of nitrobenzene (NB) to phenylhydroxylamine (PHA) over a supported Pd catalyst as reported by Gelder and co-workers. Blue hashed boxes represent surface species. The figure has been adapted from Chemical Communications.42 | ||
The authors acknowledge the totally vertical orientation depicted in Fig. 3(c and d) may be an over-simplification, as it is not possible to entirely differentiate if nitrobenzene exhibiting Csσv(yz) symmetry adsorbs vertically, or if the molecule exhibits some degree of tilting in the yz-plane. Fig. 4(a and b) presents visualisation of the in-plane A′ symmetry νS(NO2) and out-of-plane A′′ symmetry δoop(CH) modes of nitrobenzene whilst exhibiting Csσv(yz) symmetry in a tilted orientation, and highlights the respective perpendicular and parallel alignment of resulting dipoles with respect to the metal surface. The non-parallel orientation of the A′ symmetry dipole will permit observation of the νS(NO2) mode in IR spectra (Fig. 4a), while the parallel orientation of the out-of-plane A′′ dipole will yield the δoop(CH) mode unobservable (Fig. 4b).11,13 Thus, nitrobenzene adsorption orientation may be visualised as occurring vertically, or with some degree of tilting in the molecules yz-plane. For completeness, Fig. S4 (ESI†) presents a visualisation of nitrobenzene aligned with respect to the molecule's xz-plane and eliminates the option of either vertical or tilted variants in that plane.
 | ||
| Fig. 4 Visualisation of (a). νS(NO2) and (b). δoop(CH) nitrobenzene modes during a tilted adsorption orientation over a metal surface with respect to the molecules yz-plane. Orange arrows indicate the dipole derivative unit vector associated with each mode. Grey parallelograms symbolise a non-specific Pd crystallite. White, grey, blue and red balls represent hydrogen, carbon, nitrogen and oxygen, respectively. | ||
Small frequency shifts were observed when comparing wavenumber values for the key νAS(NO2) and νS(NO2) modes during nitrobenzene adsorption over KBr (Fig. 2b) to adsorption over GU-1 (Fig. 2a) from 1529 to 1530 cm−1 and 1347 to 1352 cm−1, respectively. A larger wavenumber shift upon adsorption was anticipated; not least because Section 3.2.5 reveals an appreciable enthalpy of adsorption over GU-1. One possible scenario is that dipole coupling effects43 are contributing to the spectrum of the bound nitrobenzene via two opposing effects: a dipole coupling shift which acts to increase wavenumber values for high coverages, and a chemical shift that results in a lowering of wavenumber values.43 RAIRS spectra reported by Koel and co-workers depicting increasing nitrobenzene coverage over Au(111) obtained via RAIRS do not exhibit any discernible frequency shift either.19
An additional broad feature centred at 955 cm−1 is clearly discernible for the IR spectrum depicting nitrobenzene adsorption to GU-1 (Fig. 2a); this peak cannot be assigned to any nitrobenzene vibrational mode (Table 1). The origins of this band will be addressed further in Section 3.2.4.
 | ||
| Fig. 5 Geometry optimised periodic-DFT structures of nitrobenzene adsorbed parallel (a) and perpendicular (b) on the Pd(111) facet. White, grey, blue and red balls represent hydrogen, carbon, nitrogen and oxygen, respectively. | ||
The adsorption energy (Eads, kJ mol−1) can be calculated from:
| Eads = [Pd(111) + nitrobenzene] − [Pd(111)] − [nitrobenzene], | (1) |
That the parallel geometry is the lowest energy state is a surprising result. Fig. 6 presents the experimental spectrum of nitrobenzene adsorption over GU-1 and the simulated spectra for parallel (Csσv(xz)) and monodentate vertical (Csσv(yz)) nitrobenzene adsorption over a metal surface. The simulated spectra are obtained via the process described in Section 2.1. For a parallel adsorption, the simulated spectrum (Fig. 6a) depicts the absence of the in-plane νAS(NO2) and νS(NO2) modes usually visualised at ca. 1350 and 1530 cm−1 as per the MSSR. However, these modes are clearly observed during adsorption to GU-1 (Fig. 2a). In distinct contrast, the simulated spectrum for a monodentate nitrobenzene adsorption complex does present these modes and, crucially, it does not include any out-of-plane A′′ symmetry modes, as observed experimentally (Fig. 2a). Thus, comparison between the simulated Csσv(yz) symmetry vertical nitrobenzene adsorption spectrum (Fig. 6b) and experimental outcomes herewith is distinct, and clearly identifies nitrobenzene adsorption over GU-1 to result in an adsorption complex in which nitrobenzene exhibits Csσv(yz) symmetry, and not the proposed Csσv(xz) symmetry from simulated outcomes. Additionally, the pronounced distortion that nitrobenzene undergoes on parallel adsorption is not intuitive to a favourable geometry.
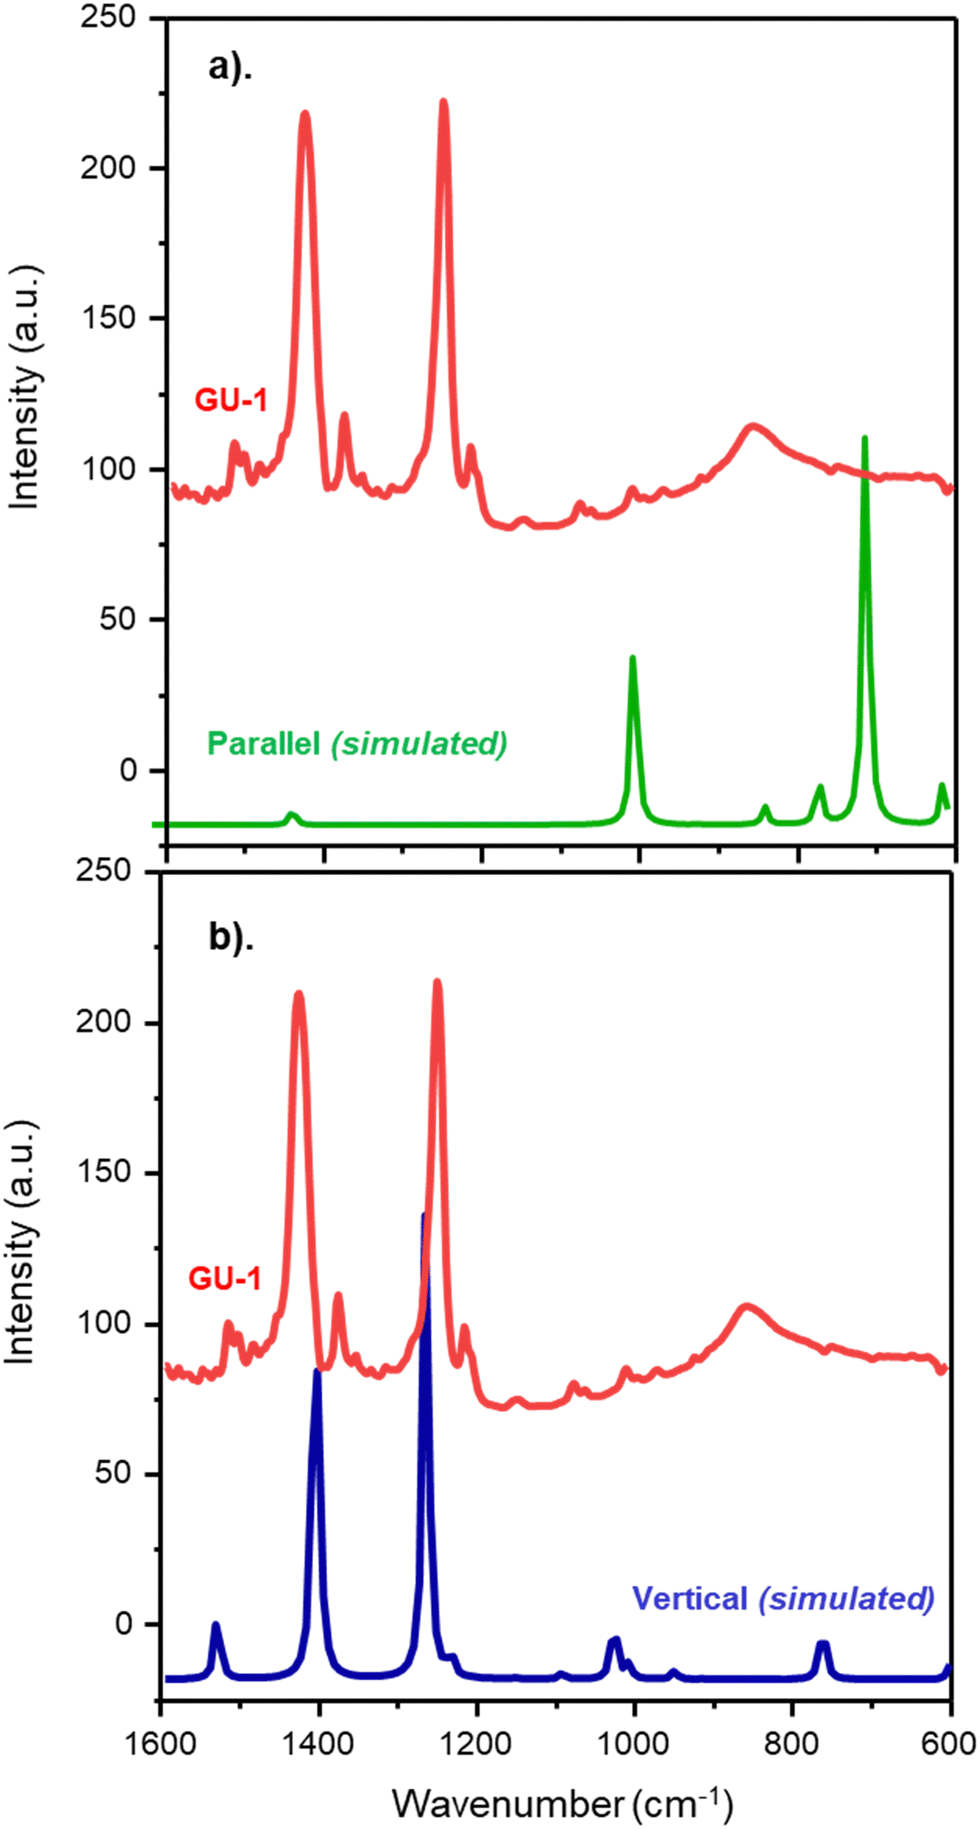 | ||
| Fig. 6 DRIFTS spectrum of nitrobenzene adsorption to GU-1 (red) alongside the simulated spectrum for (a) parallel and (b) monodentate vertical nitrobenzene adsorption over a metal surface. Wavenumber range: 1600–600 cm−1. | ||
Relative to the ideal C2v geometry of gas phase nitrobenzene, the parallel form of nitrobenzene is 113.1 kJ mol−1 higher in energy, while the perpendicular form is only 7.9 kJ mol−1 higher. The stabilisation of the parallel form presumably reflects that there are six Pd–C bonds, whereas there is a single Pd–O bond for the perpendicular form. Thus, we have an interesting result and an apparent conundrum: the measured IR spectrum strongly correlates with nitrobenzene adopting a vertical/tilted geometry relative to the metal surface with binding occurring via a single O atom (Fig. 5b), whilst the energetics emanating from the calculations strongly indicate a preference for a distorted parallel geometry (Fig. 5a).
The authors note that the calculations correspond to a single adsorption event that does not account for any ensemble effects from intermolecular interactions between multiple molecular adsorptions; a scenario that is not wholly indicative of elevated nitrobenzene exposures as encountered in catalytic turnover. Specifically, GU-1 possesses a Pd surface density of 1.153 × 10²⁰ Pd(s) g−1![[thin space (1/6-em)]](https://www.rsc.org/images/entities/char_2009.gif) 25 and the incident nitrobenzene flux is 3.68 × 10¹⁹ NB molecules min−1 g−1 (Section 2.3) that corresponds to a continuous incident flux of 0.32 NB molecules min−1 Pd(s)−1. The lowest nitrobenzene exposure examined (0.62 mmol(NB) g(cat)−1) corresponds to a cumulative exposure of 1.87 × 10²² nitrobenzene molecules, which translates to 3234 nitrobenzene molecules Pd(s)−1. Thus, even the lowest nitrobenzene exposures considered here correspond to a multi-monolayer coverage regime as encountered during catalytic turnover, which is differentiated from the single molecule coverage regime examined by the DFT calculations. Under these conditions, adsorbate–adsorbate interactions will prevail. Additionally, the Pd crystallites of GU-1, which represents a real working catalytic system,8 may present a level of complexity not accessible via modelling on a perfect Pd(111) surface.
25 and the incident nitrobenzene flux is 3.68 × 10¹⁹ NB molecules min−1 g−1 (Section 2.3) that corresponds to a continuous incident flux of 0.32 NB molecules min−1 Pd(s)−1. The lowest nitrobenzene exposure examined (0.62 mmol(NB) g(cat)−1) corresponds to a cumulative exposure of 1.87 × 10²² nitrobenzene molecules, which translates to 3234 nitrobenzene molecules Pd(s)−1. Thus, even the lowest nitrobenzene exposures considered here correspond to a multi-monolayer coverage regime as encountered during catalytic turnover, which is differentiated from the single molecule coverage regime examined by the DFT calculations. Under these conditions, adsorbate–adsorbate interactions will prevail. Additionally, the Pd crystallites of GU-1, which represents a real working catalytic system,8 may present a level of complexity not accessible via modelling on a perfect Pd(111) surface.
These reasonings represent suggestions for the encountered conundrum and highlight difficulties to be considered when applying a combination of in situ structural determination and isolated molecule DFT simulated structures within the field of heterogeneous catalysis. Summarising, nitrobenzene adsorption corresponding to aniline synthesis is thought to require the nitrobenzene to adopt an upright/tilted geometry with Csσv(yz) symmetry, as illustrated in Fig. 5b.
 | ||
| Fig. 7 DRIFTS spectra depicting increasing nitrobenzene exposure (0.62–5.58 mmol(NB) g(cat)−1) to the catalyst at 28 °C. The spectra have been offset by 0.25 au to facilitate viewing. Wavenumber range: 1700–700 cm−1. | ||
As briefly considered in Section 3.2.2, a broad feature centred at 954 cm−1 is observed at saturation coverages (Fig. 2a) that is not assigned to any nitrobenzene vibrational mode. Fig. 8 presents spectra for nitrobenzene exposures of 0.62 and 0.93 mmol(NB) g(cat)−1 only and reveals a series of bands at 1647, 1271 and 954 cm−1 after the initial 0.62 mmol(NB) g(cat)−1 exposure. Aniline possesses a NH2 bending mode (δoop(NH2)), a C–N stretching mode (ν(CN)) and a series of C–H deformation modes (δ(CH)) at ca. 1628, 1278 and 996–883 cm−1,46,47 respectively. Thus, with reference to Fig. 8, we attribute the observation of stated wavenumber values at 0.62 mmol(NB) g(cat)−1 exposure to the formation of aniline on the catalyst, with the δoop(NH2) mode exhibiting a notable shift in wavenumber, and assign the broad 954 cm−1 feature observed at a saturation coverage of nitrobenzene (Fig. 2a and 7) to a δ(CH) mode of aniline.46,47 The intense and broad nature of this mode at nitrobenzene saturation coverage is anomalous and requires further investigation.
 | ||
| Fig. 8 DRIFTS spectra depicting nitrobenzene exposures of 0.62 (black) and 0.93 (red) mmol(NB) g(cat)−1 to the catalyst at 28 °C. The spectra have been offset to facilitate viewing. | ||
With reference to Fig. 7 and 8, the aniline features, excluding that of the broad band at ca. 955 cm−1, are only observable at low nitrobenzene exposures. As they do not scale with nitrobenzene exposure (≤0.62 mmol(NB) g(cat)−1); i.e., no nitrobenzene modes are observed, the aniline is thought to occur via nitrobenzene hydrogenation via reaction with a small reservoir of residual hydrogen left over from the catalyst reduction stage. Thus, we have two sources of aniline adsorption to GU-1: (i) hydrogenation of nitrobenzene via a limited reservoir of sub-surface and surface hydrogen from reduction, as evidenced in Fig. 8, and (ii). via a minor aniline impurity within the experimental set-up.
Fig. 9 presents the intensity profile for the main IR bands observed in Fig. 7. At an exposure of 0.62 mmol(NB) g(cat)−1 no νAS(NO2) and νS(NO2) features are observable but, thereafter, at higher exposures (≥0.93 mmol(NB) g(cat)−1) nitrobenzene coverage increases and approaches a plateau for nitrobenzene loadings exceeding 4.96 mmol(NB) g(cat)−1. The aniline intensity, as signified by the broad feature at 954 cm−1, is seen to progressively increase as a function of nitrobenzene exposure. The separate profiles for nitrobenzene and aniline in Fig. 9 suggest separate adsorption sites on GU-1 for reagent and product. Summarising, for exposures of ≥0.93 mmol(NB) g(cat)−1, nitrobenzene adsorption on the Pd surface is seen to occur in a vertical/titled orientation in the yz-plane via one Pd–O bond independent of coverage, with the concomitant formation of aniline, which adsorbs in a different manner on GU-1.
 | ||
| Fig. 9 Plot of peak area for nitrobenzene νAS(NO2) and νS(NO2) modes and aniline δ(CH) mode (954 cm−1) as a function of increasing nitrobenzene exposure to GU-1 at 28 °C. | ||
 | ||
| Fig. 10 DRIFTS spectra depicting nitrobenzene desorption from GU-1 with increasing temperature (28–200 °C). The spectra have been offset by 0.2 au to facilitate viewing. | ||
Although orientation of the reagent did not change with increasing desorption, several spectral changes are evident in Fig. 10. Firstly, the saturation coverage spectrum (Fig. 10, 28 °C) exhibits a negative peak at 3729 cm−1 and a positive peak at 3677 cm−1. Surface hydroxyl groups of γ-Al2O3 include terminal hydroxyls (type I) at ca. 3764 cm−1, bridging hydroxyls (type II) at ca. 3730 cm−1, and tri-bridged hydroxyls (type III) at ca. 3675 cm−1.48,49 We therefore assign the negative IR feature at 3729 cm−1 to bridging hydroxyl groups and the positive feature at 3677 cm−1 to tri-bridging hydroxyl groups on the alumina support of GU-1, respectively.
All spectra presented have been background subtracted using a spectrum of the activated catalyst. Thus, the observed hydroxyl features suggest perturbation of the bridging and tri-bridged hydroxyl groups of the catalyst support. We propose the negative feature at 3729 cm−1 observed at saturation coverage is indicative of a moiety forming a hydrogen bond to the bridging hydroxyl groups of the alumina support; this shifts the discrete ν(OH) to lower wavenumber, where it is submerged in the broad envelope of hydrogen-bonded hydroxyls. On background subtraction, this loss of the isolated ν(OH) leads to a negative feature. Similar observations have been reported over various aluminas during reagent adsorption.49–51 As the desorption temperature is increased, the negative peak at 3729 cm−1 decreases such that at 120 °C the negative hydroxyl feature is no longer observable, indicating desorption of the adsorbed species from the bridging hydroxyl groups of the alumina support of GU-1 at this temperature. Crucially, at this temperature, the key in-plane A′ symmetry modes (νS(NO2) and νAS(NO2)) of nitrobenzene remain discernible, confirming that nitrobenzene adsorption occurred on the Pd crystallites of GU-1 and not the alumina support.
TP-IR measurements also revealed the emergence of derivative type features below 1700 cm−1 with increasing desorption temperatures ≥100 °C. Four discernible negative intensity features were observed at 1646, 1606, 1502 and 1274 cm−1, and are assigned to aniline: the broad feature at 1646 cm−1 corresponds to a shifted out-of-plane NH2 bending (δoop(NH2)) mode, sharp bands at 1606 and 1502 cm−1 correspond to in-plane ring stretching (ν(CC)) modes and the feature at 1274 cm−1 corresponds to the in-plane C–N stretching (ν(CN)) mode.47 These negative aniline bands are derived from the small aniline impurity within the experimental set-up, which permitted a limited degree of aniline adsorption to GU-1 prior to background collection (see Fig. 8). This small population of aniline is believed to be a ‘spectator’ species that does not affect observables concerning the nitrobenzene adsorption process. Thus, as referred to in Section 3.2.4, IR spectroscopy revealed the presence of two categories of adsorbed aniline that require accounting for. In the first instance, a small amount of aniline held as an impurity in the gas lines is present in the IR background spectrum. Secondly, low nitrobenzene exposures to GU-1 react with a small degree of retained hydrogen to form aniline that is adsorbed on metal sites (Fig. 8), with aniline shifted to the alumina support with increasing nitrobenzene exposure and represented by a broad feature at 954 cm−1.
Fig. 11 presents a plot of peak area for the A′ symmetry nitrobenzene modes (νAS(NO2) and νS(NO2)) and the aniline-derived mode observed at 954 cm−1 as a function of increasing temperature and indicates different binding strengths of nitrobenzene and aniline on GU-1. The νAS(NO2) and νS(NO2) modes of nitrobenzene remain observable in IR spectra after heating to the maximum desorption temperature (200 °C) utilised in this investigation, albeit in a significantly reduced capacity, while the aniline mode (954 cm−1) is absent in the 120 °C spectrum; indicative of aniline desorption from GU-1 for the temperature range of 100–120 °C. Thus, under the stated reaction conditions, TP-IR spectra indicate nitrobenzene to have a greater binding strength to GU-1 than that of the product aniline, an outcome which is desirable for high selectivity catalysis.
 | ||
| Fig. 11 Plot of peak area for nitrobenzene νAS(NO2) and νS(NO2) modes and aniline δ(CH) at 954 cm−1 as observed on GU-1 as a function of increasing temperature. | ||
The TP-IR temperature range for aniline desorption on GU-1 (100–120 °C) is illuminating. Previously in this section, we attributed adsorption of some species to the bridging hydroxyl groups of the alumina support up to a temperature of 120 °C. With the coincidence of these desorption temperatures (the absence of both the negative hydroxyl feature and the 954 cm−1 IR feature at 120 °C), it is proposed that aniline binds to the alumina support of the catalyst via bridging hydroxyl groups with nitrobenzene adsorption occurring on the Pd crystallites in a vertical/tilted in the yz-plane orientation via monodentate binding. Furthermore, it is proposed that increasing nitrobenzene exposure forces the aniline that is formed from nitrobenzene hydrogenation at 28 °C onto the support material, as indicated by the broad feature at 954 cm−1 in Fig. 7.
4. Discussion
Previous reaction testing with GU-1 revealed near complete nitrobenzene conversion, good aniline selectivity (ca. 90% at 60 °C) and a prevalence for aniline derived vs. nitrobenzene derived by-products during nitrobenzene hydrogenation.8 It is opportune to consider the observed catalytic behaviour with respect to the deduced adsorbate geometry and/or adsorbate location on GU-1, derived via DRIFTS measurements. Fig. 12 presents a schematic diagram depicting the Csσv(yz) symmetry monodentate vertical adsorption of nitrobenzene to the Pd crystallites of GU-1; in the presence of hydrogen this produces aniline, some of which adsorbs on the support material. For higher nitrobenzene exposures, no aniline adsorbs on the Pd. | ||
| Fig. 12 Diagram visualising nitrobenzene adsorption to Pd in a vertical orientation via one Pd–O bond, with subsequent hydrogenation to aniline, and re-adsorption of some aniline to the support with no specific geometry identified. The solid grey box represents a non-specific Pd crystallite; the hashed box represents the Al2O3 support. Larger arrows for vertical NB hydrogenation to ANL depicts this as the major transformation. | ||
Nitrobenzene is hydrogenated to yield predominantly aniline, with low levels of by-products reported at 60 °C (aniline derived by-products selectivity ≤10%; nitrobenzene derived by-products selectivity ≤0.2%)8. The authors propose that it is the nitrobenzene adsorption geometry over GU-1 that is key to explaining the observed low levels of by-products associated with the reagent (<0.2%). Specifically, it is the perpendicular/tilted in the yz-plane nature of the adsorption of nitrobenzene to the metal surface that results in the distancing of the aromatic moiety of the molecule to the Pd crystallites, excluding a parallel arrangement that would otherwise favour ring hydrogenation. The minimal observation of nitrobenzene derived by-products cyclohexanol and cyclohexanone, which require aromatic ring hydrogenation,9 illustrate this chemical pathway to be minimised due to the proposed geometric reasons. This outcome, as observed with IR spectra, opposes those reported in Section 3.2.3. where simulated outcomes indicated a parallel adsorption of nitrobenzene over Pd(111) to be energetically favourable. However, it is crucial to re-iterate that these DFT calculations represent a single nitrobenzene molecule on a perfect Pd(111) surface – parameters of significance include (i) experimental coverages significantly exceed single molecule adsorption, and (ii) GU-1 is not a perfect Pd(111) surface. Additionally, IR measurements (Fig. 7, 9 and 10) indicate that high coverages of nitrobenzene force small quantities of aniline, formed via reaction with residual hydrogen, from the Pd surface onto the support material. This dynamic scenario is thought to be a contributory factor to high aniline selectivity for nitrobenzene hydrogenation over GU-18 and supported Pd catalysts in general.
5. Conclusions
Application of FT-IR spectroscopy, sequential nitrobenzene adsorption, TP-IR and consideration of the metal surface selection rule (MSSR) permitted determination of the adsorbate complex orientation for nitrobenzene adsorption over GU-1. The following conclusions can be drawn.• Adsorption of nitrobenzene to GU-1 yielded DRIFTS spectra exhibiting IR features solely associated with monodentate vertical or tilted Csσv(yz) symmetry with in-plane A′ symmetry modes observed, and the IR active out-of-plane A′′ symmetry modes unobserved.
• Comparison of experimental outcomes and DFT simulations for a single adsorption event over Pd(111) present opposing conclusions. However, this conundrum is attributed to the DFT calculations representing single molecule adsorption to a perfect (111) surface, whereas cooperative effects at elevated coverages (exposures of ≥0.93 mmol(NB) g(cat)−1), as encountered during catalytic turnover, are attributed to the nitrobenzene adopting an upright geometry.
• The lowest nitrobenzene exposure (0.62 mmol(NB) g(cat)−1) investigated via DRIFTS identified the presence of aniline on GU-1 that was formed via nitrobenzene reaction with residual hydrogen.
• TP-IR measurements from GU-1 indicated aniline to be interacting with bridging hydroxyl groups of the alumina support of the catalyst up to 120 °C.
• It is proposed that the vertical/tilted orientation of nitrobenzene in the yz-plane with respect to the metal surface limits the formation of nitrobenzene derived by-products due to the perpendicular positioning of the aromatic ring of the molecule with the Pd surface.
• The predominant re-adsorption of aniline to the γ-Al2O3 support of GU-1 as opposed to adsorption on the Pd is proposed to limit product over-hydrogenation, and thus contributes to the elevated aniline selectivity observed.
Data management statement
Data for this paper, including spectroscopic datasets, are available from the University of Glasgow Library via the following link, http://dx.doi.org/10.5525/gla.researchdata.1447.Conflicts of interest
There are no conflicts of interest to declare.Acknowledgements
The EPSRC are thanked for the provision of a PhD studentship (ALMcC, EP/R513222/1 & EP/N509668/1). The STFC Rutherford Appleton Laboratory is thanked for access to neutron beam facilities. Computing resources (time on the SCARF computer cluster for the CASTEP calculations) was provided by STFC's e-Science facility. This research has been performed with the aid of facilities at the Research Complex at Harwell, including the FT-Raman spectrometer. The authors would like to thank the Research Complex for access to, and support of, these facilities and equipment. We also thank one of the reviewers for particularly helpful comments concerning the DFT calculations.References
- G. Brereton, Ullmann's Encyclopedia of Industrial Chemistry, Wiley-VCH Verlag GmbH & Co, Weinheim, Germany, 2019 Search PubMed.
- C. S. Couto, L. Maderia, C. Nunes and P. Araújo, Chem. Eng. Tech., 2015, 38, 1625–1636 CrossRef CAS.
- C. S. Couto, L. Maderia, C. Nunes and P. Araújo, Appl. Cat. A: Gen., 2016, 522, 152–164 CrossRef CAS.
- C. S. Couto, L. Maderia, C. Nunes and P. Araújo, Ind. Eng. Chem. Res., 2017, 56, 3231–3242 CrossRef CAS.
- M. Turakova, T. Salmi, K. Eranen, J. Warna and D. Murzin, Appl. Cat. A: Gen., 2015, 499, 66–76 CrossRef CAS.
- Y. Qu, T. Chen and G. Wang, Appl. Surf. Sci., 2019, 465, 888–894 CrossRef CAS.
- F. Simescu-Lazar, V. B. F. Meille, F. Campoli and C. de Bellefon, Catal. Today, 2015, 249, 52–58 CrossRef CAS.
- C. Morisse, A. M. McCullagh, J. Campbell, C. How, D. MacLaren, C. Mitchell, R. Carr and D. Lennon, Ind. Eng. Chem. Res., 2021, 60, 17917–17927 CrossRef CAS PubMed.
- C. Morrise, A. M. McCullagh, J. Campbell, C. Mitchell, R. Carr and D. Lennon, Ind. Eng. Chem. Res., 2022, 61, 10712–10722 CrossRef PubMed.
- Q. Chen, M. Wang, C. Zhang, K. Ren, Y. Xin, M. Zhao and E. Xing, Chem. – Asian J., 2018, 13, 2077–2084 CrossRef CAS PubMed.
- R. Greenler, D. Snider, D. Witt and R. Sorbello, Surf. Sci., 1982, 118, 415–428 CrossRef CAS.
- H. Pearce and N. Sheppard, Surf. Sci., 1976, 59, 205–217 CrossRef CAS.
- N. Sheppard and J. Erkelens, Appl. Spec., 1984, 38(4), 471–485 CrossRef CAS.
- J. Green and D. Harrison, Spectrochim. Acta., 1970, 26, 1925 CrossRef CAS.
- J. Laposa, Spectrochim. Acta, 1979, 35, 65 CrossRef.
- C. Pouchert, The Aldrich Library of FT-IR Spectra, Aldrich Chemical Company, Inc, Milwaukee, Wisconsin, USA, 1985 Search PubMed.
- C. Stephenson, W. Coburn and W. Wilcox, Spectrochim. Acta, 1961, 17, 933–946 CrossRef CAS.
- Q. Chen, S. Haw, B. Frederick and N. Richardson, Surf. Sci., 1996, 368, 310–317 CrossRef CAS.
- D. Syomin, J. Wang and B. Koel, Surf. Sci. Lett., 2001, 495, 824–833 CrossRef.
- M. Boronat, P. Concepcion, A. Corma, S. Gonzalez, F. Illas and P. Serna, J. Am. Chem. Soc., 2007, 129, 16230–16237 CrossRef CAS PubMed.
- Z. Hajiahmadi and Z. Travangar, Appl. Surf. Sci., 2018, 454, 343–349 CrossRef CAS.
- R. Millán and M. Boronat, Faraday Discuss., 2021, 229, 297–317 RSC.
- L. Zhang, J. Jian, W. Shi, S. Xia and X. Ni, RSC Adv., 2015, 5, 34319–34326 RSC.
- R. Millán, M. Soriano, C. Moreno, M. Boronat and P. Concepción, Nanomaterials, 2021, 11, 2037 CrossRef PubMed.
- A. M. McCullagh, R. Warringham, C. Morisse, L. Gilpin, C. Brennan, C. Mitchell and D. Lennon, Top. Cat., 2021, 64, 1010–1020 CrossRef CAS.
- M. J. Frisch, G. W. Trucks, H. B. Schlegel, G. E. Scuseria, M. A. Robb, J. R. Cheeseman, G. Scalmani, V. Barone, G. A. Petersson, H. Nakatsuji, X. Li, M. Caricato, A. V. Marenich, J. Bloino, B. G. Janesko, R. Gomperts and B. E. A. Mennucci, Gaussian09, Revision, Gaussian, Inc., Wallingford CT, 2009 Search PubMed.
- “Computation Chemistry Comparison and Benchmark Database,” National Institute of Standards and Technology, August 2019. [Online]. Available: https://cccbdb.nist.gov/vibscalejust.asp. [Accessed 16 August 2020].
- S. Clark, M. Segall, C. Pickard, P. Hasnip, M. Probert, K. Refson and M. Payne, Z. Kristallogr., 2005, 220, 567–570 CAS.
- J. Perdew, K. Burke and M. Ernzerhof, Phys. Rev. Lett., 1996, 77, 3865–3868 CrossRef CAS PubMed.
- A. Tkatchenko and M. Scheffler, Phys. Rev. Lett., 2009, 102, 173005 CrossRef PubMed.
- R. Boese, D. Bläser, M. Nussbaumer and T. Krygowski, Struct. Chem., 1992, 3, 363–368 CrossRef CAS.
- K. Refson, P. Tulip and S. Clark, Phys. Rev. B: Condens. Matter Mater. Phys., 2006, 73, 155114 CrossRef.
- K. Dymkowski, S. Parker, F. Fernandex-Alonso and S. Mukhopadhyay, Pyhsica B, 2018, 551, 443–448 CrossRef CAS.
- R. Pinna, M. Zanetti, S. Rudić, S. Parker, J. W. S. Armstrong, D. Zacek, C. Smith, S. Harrison, G. Gorini and F. Fernandez-Alanso, J. Phys.: Conf. Ser., 2018, 1021, 012029 CrossRef.
- “ISIS Neutron and Muon Source,” Science and Technology Facilities Council, [Online]. Available: https://www.isis.stfc.ac.uk/Pages/About.aspx. [Accessed 12th January 2023].
- J. Høg, L. Nygaard and G. Sørensen, J. Mol. Struct., 1971, 7, 111–121 CrossRef.
- J. A. Salthouse and M. J. Ware, Point group character tables and related data, Cambridge University Press, Cambridge, 1972 Search PubMed.
- A. Gardner and T. Wright, J. Chem. Phys., 2011, 135, 114305 CrossRef PubMed.
- D. T. Lundie, A. R. McInroy, R. Marshall, J. M. Winfield, P. Jones, C. C. Dudman, S. F. Parker, C. Mitchell and D. Lennon, J. Phys. Chem. B, 2005, 109, 11592–11601 CrossRef CAS PubMed.
- Precomputed vibrational scaling factors, NIST, August 2020. [Online]. Available: https://cccbdb.nist.gov/vibscalejust.asp. [Accessed November 2020].
- L. Khaikin, I. Kochikov, O. Grikina, D. Tikhonov and E. Baskir, Struct. Chem., 2015, 26, 1651–1687 CrossRef CAS.
- E. Gelder, S. D. Jackson and C. M. Lok, Chem. Comm., 2005, 4, 522–524 RSC.
- P. Hollins and J. Pritchard, Surf. Sci., 1979, 89, 486–495 CrossRef CAS.
- C. Brock and Y. Fu, Acta Cryst., 1997, B53, 928–938 CAS.
- L. Lyssenko, A. Korlyukov, D. Golovanov, S. Ketkov and M. Antipin, J. Phys. Chem. A, 2006, 110, 6545–6551 CrossRef PubMed.
- J. Evans, Spectrochemi Acta, 1960, 16, 428–442 CrossRef CAS.
- P. M. Wojcrichowski, W. Zierkiewicz and D. Michalska, J. Chem. Phys., 2003, 118, 10900–10911 CrossRef.
- C. Morterra and G. Magnacca, Catal. Today., 1996, 27, 497–532 CrossRef CAS.
- X. Liu and R. Triutt, J. Am. Chem. Soc., 1997, 119, 9856–9860 CrossRef CAS.
- D. T. Lundie, A. R. McInroy, R. Marshall, J. M. Winfield, P. Jones, C. C. Dudman, S. F. Parker, C. Mitchell and D. Lennon, J. Phys. Chem. B, 2005, 109, 11592–11601 CrossRef CAS PubMed.
- A. R. McInroy, D. T. Lundie, J. M. Winfield, C. C. Dudman, P. Jones, S. F. Parker and D. Lennon, Cat. Today, 2006, 114, 403–411 CrossRef CAS.
Footnote |
† Electronic supplementary information (ESI) available: Fig. S1: Diagram of nitrobenzene with respect to a specified xyz-coordinate (blue = nitrogen; red = oxygen), with the z axis defining the principal component axis of the molecule; Fig. S2: Form of the vibrational modes for a mono-substituted benzene in C2v symmetry; Table S1: Approximate wavenumber ranges for the ![[scr M, script letter M]](https://www.rsc.org/images/entities/char_e145.gif) i vibrations; Table S2: Vibrational transition energies, infrared intensities and assignments for nitrobenzene in the solid state as calculated by periodic-DFT; Fig. S3: Single beam DRIFTS measurement of activated GU-1; Table S3: Experimental and calculated geometry of nitrobenzene; Fig. S4: Wide scan DRIFTS spectra depicting increasing nitrobenzene exposure; Fig. S5: Visualisation of the νS(NO2) and δoop(CH) nitrobenzene modes during a (a) and (b) parallel orientation and (c) and (d) a tilted adsorption orientation over a metal surface with respect to the molecules xz-plane; Fig. S6: Diagram visualising nitrobenzene adsorption to Pd(111) in a tilted orientation with respect to the yz-plane depicting (a). O positioned in a 2-fold hollow site with H in registry with on-top and (b). the H positioned in a 2-fold hollow site with O in registry with the on-top site. See DOI: https://doi.org/10.1039/d3cp03028h i vibrations; Table S2: Vibrational transition energies, infrared intensities and assignments for nitrobenzene in the solid state as calculated by periodic-DFT; Fig. S3: Single beam DRIFTS measurement of activated GU-1; Table S3: Experimental and calculated geometry of nitrobenzene; Fig. S4: Wide scan DRIFTS spectra depicting increasing nitrobenzene exposure; Fig. S5: Visualisation of the νS(NO2) and δoop(CH) nitrobenzene modes during a (a) and (b) parallel orientation and (c) and (d) a tilted adsorption orientation over a metal surface with respect to the molecules xz-plane; Fig. S6: Diagram visualising nitrobenzene adsorption to Pd(111) in a tilted orientation with respect to the yz-plane depicting (a). O positioned in a 2-fold hollow site with H in registry with on-top and (b). the H positioned in a 2-fold hollow site with O in registry with the on-top site. See DOI: https://doi.org/10.1039/d3cp03028h |
| This journal is © the Owner Societies 2023 |