
 Open Access Article
 This Open Access Article is licensed under a
 Creative Commons Attribution 3.0 Unported Licence
Protomers of the green and cyan fluorescent protein chromophores investigated using action spectroscopy†
Eleanor K.
Ashworth‡
 a,
Jordan
Dezalay‡
b,
Christopher R. M.
Ryan‡
c,
Christian
Ieritano
c,
W. Scott
Hopkins
c,
Isabelle
Chambrier
a,
Andrew N.
Cammidge
a,
Mark H.
Stockett
b,
Jennifer A.
Noble
d and
James N.
Bull
*a
a,
Jordan
Dezalay‡
b,
Christopher R. M.
Ryan‡
c,
Christian
Ieritano
c,
W. Scott
Hopkins
c,
Isabelle
Chambrier
a,
Andrew N.
Cammidge
a,
Mark H.
Stockett
b,
Jennifer A.
Noble
d and
James N.
Bull
*a
aSchool of Chemistry, Norwich Research Park, University of East Anglia, Norwich NR4 7TJ, UK. E-mail: james.bull@uea.ac.uk
bDepartment of Physics, Stockholm University, SE-10691 Stockholm, Sweden
cDepartment of Chemistry, University of Waterloo, Waterloo N2L 3G1, Canada
dAix-Marseille University, CNRS, PIIM, Marseille, France
First published on 13th July 2023
Abstract
The photophysics of biochromophore ions often depends on the isomeric or protomeric distribution, yet this distribution, and the individual isomer contributions to an action spectrum, can be difficult to quantify. Here, we use two separate photodissociation action spectroscopy instruments to record electronic spectra for protonated forms of the green (pHBDI+) and cyan (Cyan+) fluorescent protein chromophores. One instrument allows for cryogenic (T = 40 ± 10 K) cooling of the ions, while the other offers the ability to perform protomer-selective photodissociation spectroscopy. We show that both chromophores are generated as two protomers when using electrospray ionisation, and that the protomers have partially overlapping absorption profiles associated with the S1 ← S0 transition. The action spectra for both species span the 340–460 nm range, although the spectral onset for the pHBDI+ protomer with the proton residing on the carbonyl oxygen is red-shifted by ≈40 nm relative to the lower-energy imine protomer. Similarly, the imine and carbonyl protomers are the lowest energy forms of Cyan+, with the main band for the carbonyl protomer red-shifted by ≈60 nm relative to the lower-energy imine protomer. The present strategy for investigating protomers can be applied to a wide range of other biochromophore ions.
1 Introduction
Green fluorescent protein (GFP), which was first isolated from the Aequorea victoria jellyfish over 50 years ago,1 has become a cornerstone in photobiology.2 GFP has revolutionised fluorescence imaging owing to the ease with which it can be incorporated into biological systems and because of its desirable optical properties.3 The photophysics of GFP are governed by a deprotonated p-hydroxybenzylidene-2,3-dimethylimidazolinone, pHBDI unit – Fig. 1(a), situated within the protein's β-barrel.4 Following the discovery of GFP, a range of derivative fluorescent proteins have been characterised and synthesised, offering tuned absorption and emission profiles, on–off switching, and optical highlighting.5–8 One such variant, the cyan fluorescent protein (CFP), is formed through the substitution of a tyrosine residue in GFP with a tryptophan unit.9 This mutation blue-shifts the fluorescence profile due to the combination of an altered chromophore structure 4-((1H-indol-3-yl)methylene)-1,2-dimethyl-1H-imidazol-5(4H)-one (Fig. 1(b)), and a chromophore-specific binding pocket in the protein. Although these chromophores exist in a deprotonated state in the protein, spectroscopic data on the cationic (protonated) forms are useful for calibrating theory and providing benchmark data for understanding spectra for protonation equilibria in solution.10,11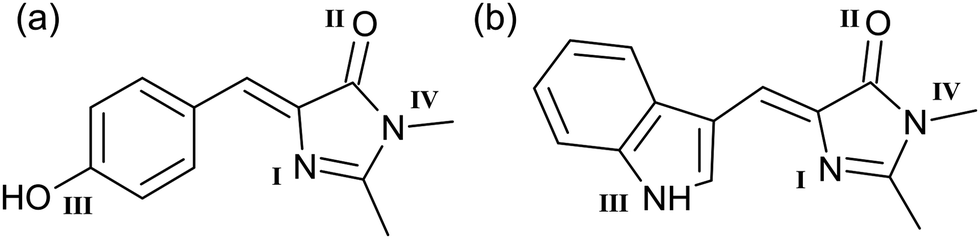 | ||
| Fig. 1 Structure of (a) pHBDI and (b) Cyan. The protonated cations are denoted pHBDI+ and Cyan+, with the four possible protonation sites identified. In both cases, protonation site I (imine) corresponds to the lowest energy protomer. Each protomer may have E and Z geometric configurations about the double bond on the methine bridge. In all cases, the Z isomer is lower in energy. The E isomer, if present, is expected in only trace quantities. | ||
In solution and in the gas phase, the protonated forms of these chromophores, pHBDI+ and Cyan+, can exist as several protomers (protonation isomers), which may exhibit distinct photophysical properties.12 Characterisation of protomers (or deprotomers for anions) and probing the impact of protonation site on molecular photophysics is a topical area in gas-phase spectroscopy due to the emerging analytical capabilities to separate and probe protomers;13 such selectivity is almost always impossible in solution due to rapid proton exchange, with solution experiments measuring some solvent-dependent average.
There are several strategies for inferring the presence of coexisting protomers in gas-phase experiments, including by comparing infrared and ultraviolet action spectroscopy measurements with electronic structure calculations, such as done for benzocaine,14 DNA bases,15 and flavins.16 Similar spectroscopic identifications of coexisting protomers have been made at cryogenic temperatures through analysis of vibronic structure.17,18 Often, however, protomers have overlapping absorption profiles but may have distinct excited-state dynamics, making them difficult to study confidently without isomer-selective action spectroscopy techniques. As an example, protomers of 4-dicyanomethylene-2-methyl-6-para-dimethylaminostyryl-4H-pyran (DCM) dye molecules have been separated using ion mobility spectrometry and were shown to have well-resolved action spectra (shifted by nearly 200 nm) and protomer-specific photoisomerisation dynamics.12 Isomer selectivity in action spectroscopy experiments is most commonly achieved by incorporating ion mobility as a separation dimension.13,19 While the occurrence of coexisting protomers is becoming a common theme in gas-phase spectroscopy, general trends or ‘rules of thumb’ for the preponderance of protomers can be difficult to determine because, aside from the electrospray solvent, relative protomer yields can depend on a vast number of factors including solution pH, electrospray geometry and needle voltage, desolvation conditions, and collisional treatment of ions as they are introduced into vacuum.20,21 Additionally, because most gas-phase action spectroscopy instruments are custom designed, it can be difficult to know if the protomer distribution generated in one experiment is the same as for another.
Here, we report photodissociation action spectra for pHBDI+ and Cyan+, produced using electrospray ionisation. While the gas-phase deprotonated anions of pHBDI chromophores have been studied extensively (see ref. 22 for a recent summary of relevant literature) and deprotonated Cyan has been studied with photoelectron spectroscopy,23 the protonated cations have been studied at room-temperature only,24–26 with limited discussion of protomers. In this work, photodissociation action spectra of pHBDI+ and Cyan+ were recorded using two instruments, the first offering the capabilities for measurements at T ≈ 300 K and T = 40 ± 10 K, and the second offering isomer (protomer) selectivity, although the ions are heated to T = 400–500 K during the isomer selection step. The results of both sets of experiments are consistent with two coexisting protomers, possessing overlapping action spectra in the visible. The protomers were assigned based on electronic structure calculations of their stabilities and Franck–Condon simulation of absorption profiles.
2 Experimental
The pHBDI molecule used in this work was available from an earlier study.22 The Cyan molecule was synthesised in a two-step reaction according to an established procedure involving the preliminary synthesis of an azalactone followed by its aminolysis with methylamine.27 The structures and purity of the compounds were confirmed by 1H spectroscopy – see ESI.†2.1 Room-temperature and cryogenic photodissociation action spectroscopy
Photodissociation action spectra at T ≈ 300 K and T = 40 ± 10 K were recorded, at the PIIM laboratory in Marseille, France, by trapping electrosprayed ions in a cryogenically-cooled quadrupole ion trap (QIT) and irradiating the ions with tunable laser light. Complete details of the apparatus are given elsewhere.28,29 Briefly, pHBDI+ and Cyan+ were generated through electrospray ionisation of a millimolar solution of the target molecule dissolved in a 1![[thin space (1/6-em)]](https://www.rsc.org/images/entities/char_2009.gif) :1 (v/v%) methanol–water mixture. Several drops of concentrated acetic acid were added to the solutions to protonate the target molecule. After electrospray, ions were stored in an octopole for ≈100 ms before being extracted and transferred into the QIT. Helium buffer gas was injected into the QIT using a Parker pulsed valve, serving to collisionally decelerate and thermalise the ions to a temperature of T ≈ 300 K or T = 40 ± 10 K.30 The cryogenic temperature was achieved by cooling of the trap with a Leybold helium-cooled cryohead to T ≈ 20 K (several temperature sensors across the ion trap assembly vary between T = 12 K to 35 K).30 An auxiliary radio frequency was applied to the trap and tuned to the resonance frequencies of the fragment ions in order to minimise collision-induced fragment signal.31 Stored ions were irradiated in the trap using light from an optical parametric oscillator laser (OPO, EKSPLA NT342B), operating at 10 Hz repetition rate with ≈10 ns pulse width and ≈10 cm−1 bandwidth. The laser fluence (2–4 mJ pulse−1 for λ > 400 nm and 4–7 mJ pulse−1 for λ < 400 nm) was constantly measured during the spectral acquisitions. After irradiation, photofragment and parent ions were extracted from the QIT by applying a negative pulse (−400 V) on the exit cap electrode. The ions were then accelerated, by a second negative pulse (−2800 V) applied to a Gauss tube, into the field free region of a linear time-of-flight mass spectrometer, where they were detected by microchannel plate assembly. For pHBDI+, the width of the pulse applied to the Gauss tube was optimised to accelerate both parent ions and small photofragments. For Cyan+, this condition could not be achieved due to the limited m/z range accessible in the experiment; consequently, photodepletion spectroscopy of the parent Cyan+ was performed. Action spectra were derived by plotting laser-on photofragment or photodepletion yield normalised with laser-off signal and laser fluence.
:1 (v/v%) methanol–water mixture. Several drops of concentrated acetic acid were added to the solutions to protonate the target molecule. After electrospray, ions were stored in an octopole for ≈100 ms before being extracted and transferred into the QIT. Helium buffer gas was injected into the QIT using a Parker pulsed valve, serving to collisionally decelerate and thermalise the ions to a temperature of T ≈ 300 K or T = 40 ± 10 K.30 The cryogenic temperature was achieved by cooling of the trap with a Leybold helium-cooled cryohead to T ≈ 20 K (several temperature sensors across the ion trap assembly vary between T = 12 K to 35 K).30 An auxiliary radio frequency was applied to the trap and tuned to the resonance frequencies of the fragment ions in order to minimise collision-induced fragment signal.31 Stored ions were irradiated in the trap using light from an optical parametric oscillator laser (OPO, EKSPLA NT342B), operating at 10 Hz repetition rate with ≈10 ns pulse width and ≈10 cm−1 bandwidth. The laser fluence (2–4 mJ pulse−1 for λ > 400 nm and 4–7 mJ pulse−1 for λ < 400 nm) was constantly measured during the spectral acquisitions. After irradiation, photofragment and parent ions were extracted from the QIT by applying a negative pulse (−400 V) on the exit cap electrode. The ions were then accelerated, by a second negative pulse (−2800 V) applied to a Gauss tube, into the field free region of a linear time-of-flight mass spectrometer, where they were detected by microchannel plate assembly. For pHBDI+, the width of the pulse applied to the Gauss tube was optimised to accelerate both parent ions and small photofragments. For Cyan+, this condition could not be achieved due to the limited m/z range accessible in the experiment; consequently, photodepletion spectroscopy of the parent Cyan+ was performed. Action spectra were derived by plotting laser-on photofragment or photodepletion yield normalised with laser-off signal and laser fluence.
2.2 Protomer-specific photodissociation action spectroscopy
Protomer-specific photodissociation action spectra for electrosprayed pHBDI+ and Cyan+ were recorded using a modified instrument combining differential mobility spectrometry (DMS) with mass spectrometry (described in detail in ref. 32–35), at the University of Waterloo, Canada. The target molecules were dissolved in a 50:50 water:methanol solution (≈600 ng mL−1) with 0.1% formic acid to assist protonation. Following electrospray, the protonated cations were carried, by dry N2 gas heated to ≈150 °C doped with 1.5 mol% acetonitrile (pHBDI+), 1.5 mol% propan-2-ol (Cyan+) or no dopant (pHBDI−), through the planar DMS cell. The addition of a dopant (mobility modifier) to the carrier gas causes the formation of microsolvated clusters, which, dependent on the protic nature of the dopant, dictates the yield and interconversion of protomers in the DMS cell.36–38 Isomer population ionograms were acquired by applying a separation voltage (SV) across the DMS cell (SV = 3500 V for pHBDI+ and 2900 V for Cyan+) and scanning the compensation voltage (CV). For the photodissociation measurements, cations transmitted at a fixed CV were passed into a triple-quadrupole mass spectrometer (Q1–Q3), where Q3 can be operated as a traditional quadrupole filter or a linear ion trap. These ions were mass selected in Q1 (m/z 217 for pHBDI+ and m/z 240 for Cyan+), transmitted through Q2, and accumulated in Q3. The accumulated ion bunches were irradiated with light from an OPO (Horizon II, Continuum, loosely focused, 4–7 mJ pulse−1) pumped by a pulsed Nd:YAG laser (10 Hz, Surelite, Continuum). Parent and photofragment ions were ejected from Q3 and counted with a channeltron ion detector. Action spectra were derived by plotting laser-on photofragment or photodepletion yield normalised with respect to laser-off signal and laser-fluence. The error in photofragmentation efficiency, for each wavelength, was obtained by propagation of the error in photofragmentation efficiency, assessed over 25 laser interrogation/ejection cycles within Q3, and the variation in laser power assessed over 100 shots.
The predominant photofragment from both protomers of pHBDI+ was m/z 56 (C3H6N), with the next four most abundant ions at m/z 160, 186, 119, and 91. For Cyan+, the predominant photofragment from both protomers was m/z 56 (C3H6N) with the next four most abundant ions at m/z 157, 183, 130, and 115. There were no obvious marker m/z products from a given protomer ensemble that clearly reflect the protonation site, presumably because dissociation is statistical in nature and rearrangement barriers are lower in energy than dissociation barriers.39
2.3 Computational
Electronic structure calculations were performed using the Gaussian 16B.0140 and ORCA 5.0.3 software packages.41,42 Geometry optimisations and vibrational frequencies for the S0 and S1 electronic states of neutral and cationic forms of the chromophores were determined at the ωB97X-D/aug-cc-pVDZ level of theory.43–45 Single-point energies were computed at the CCSD(T)/aug-cc-pVDZ and DLPNO-CCSD(T)/aug-cc-pVDZ levels of theory. Vertical excitation energies were computed at the DLPNO-STEOM-CCSD/aug-cc-pVDZ level of theory.46,47 The DLPNO-CCSD(T) method has been benchmarked to calculate relative energies to within ≈20 meV (≈2 kJ mol−1) of established ref. 48 and 49, while the DLPNO-STEOM-CCSD method has previously reproduced vertical transition energies for a series of pHBDI-based anions and other biochromophores to within ≈0.1 eV.22,50Franck–Condon (FC) simulations of the absorption spectra (at T = 20 K – there was no substantial change at T = 40 K), with the exception of Cyan+ protomer I, were performed using ezSpectrum 3.0 (ezFCF).51 The FC factors were obtained using the parallel mode approximation with a maximum of four quanta of vibrations in the target state. The final spectra were constructed by convolving the simulated vibronic transitions with Gaussian functions (10 cm−1 FWHM) approximating the laser bandwidth. Similar Franck–Condon simulations can satisfactory describe photoelectron spectra of cryogenic pHBDI−.52 The simulation for Cyan+ protomer I, also convolved with 10 cm−1 FWHM Gaussian functions, used the vertical Hessian approximation in Gaussian 16,53 due to a large change in geometry associated with torsion of the methine bridge between the ground and excited states.
3 Results and discussion
3.1 pHBDI+
Photodissociation action spectra recorded for pHBDI+ at T ≈ 300 K and T = 40 ± 10 K are shown in Fig. 2(a) and (b), respectively. At T ≈ 300 K, the spectrum spans the 340–460 nm range with the peak spectral response at 410 ± 1 nm. The wavelength of maximum response in the cryogenic spectrum is 407 ± 1 nm, which is blue-shifted by ≈3 nm compared with the T ≈ 300 K spectrum. At cryogenic temperature, the spectrum sharpens and an additional peak centred at 428 ± 1 nm is resolved. We immediately note that these spectra are inconsistent with the two earlier reports (at T ≈ 300 K), which were recorded by monitoring photo-induced neutral fragment production24 and photofragments generated in an ion trap26 – both spectra are included in Fig. 2(a) for comparison. While these two earlier measurements are in good agreement with each other and the wavelength of maximum response is consistent with the current work, the earlier spectra are substantially narrower and do not show the red-edge shoulder evident in the current work.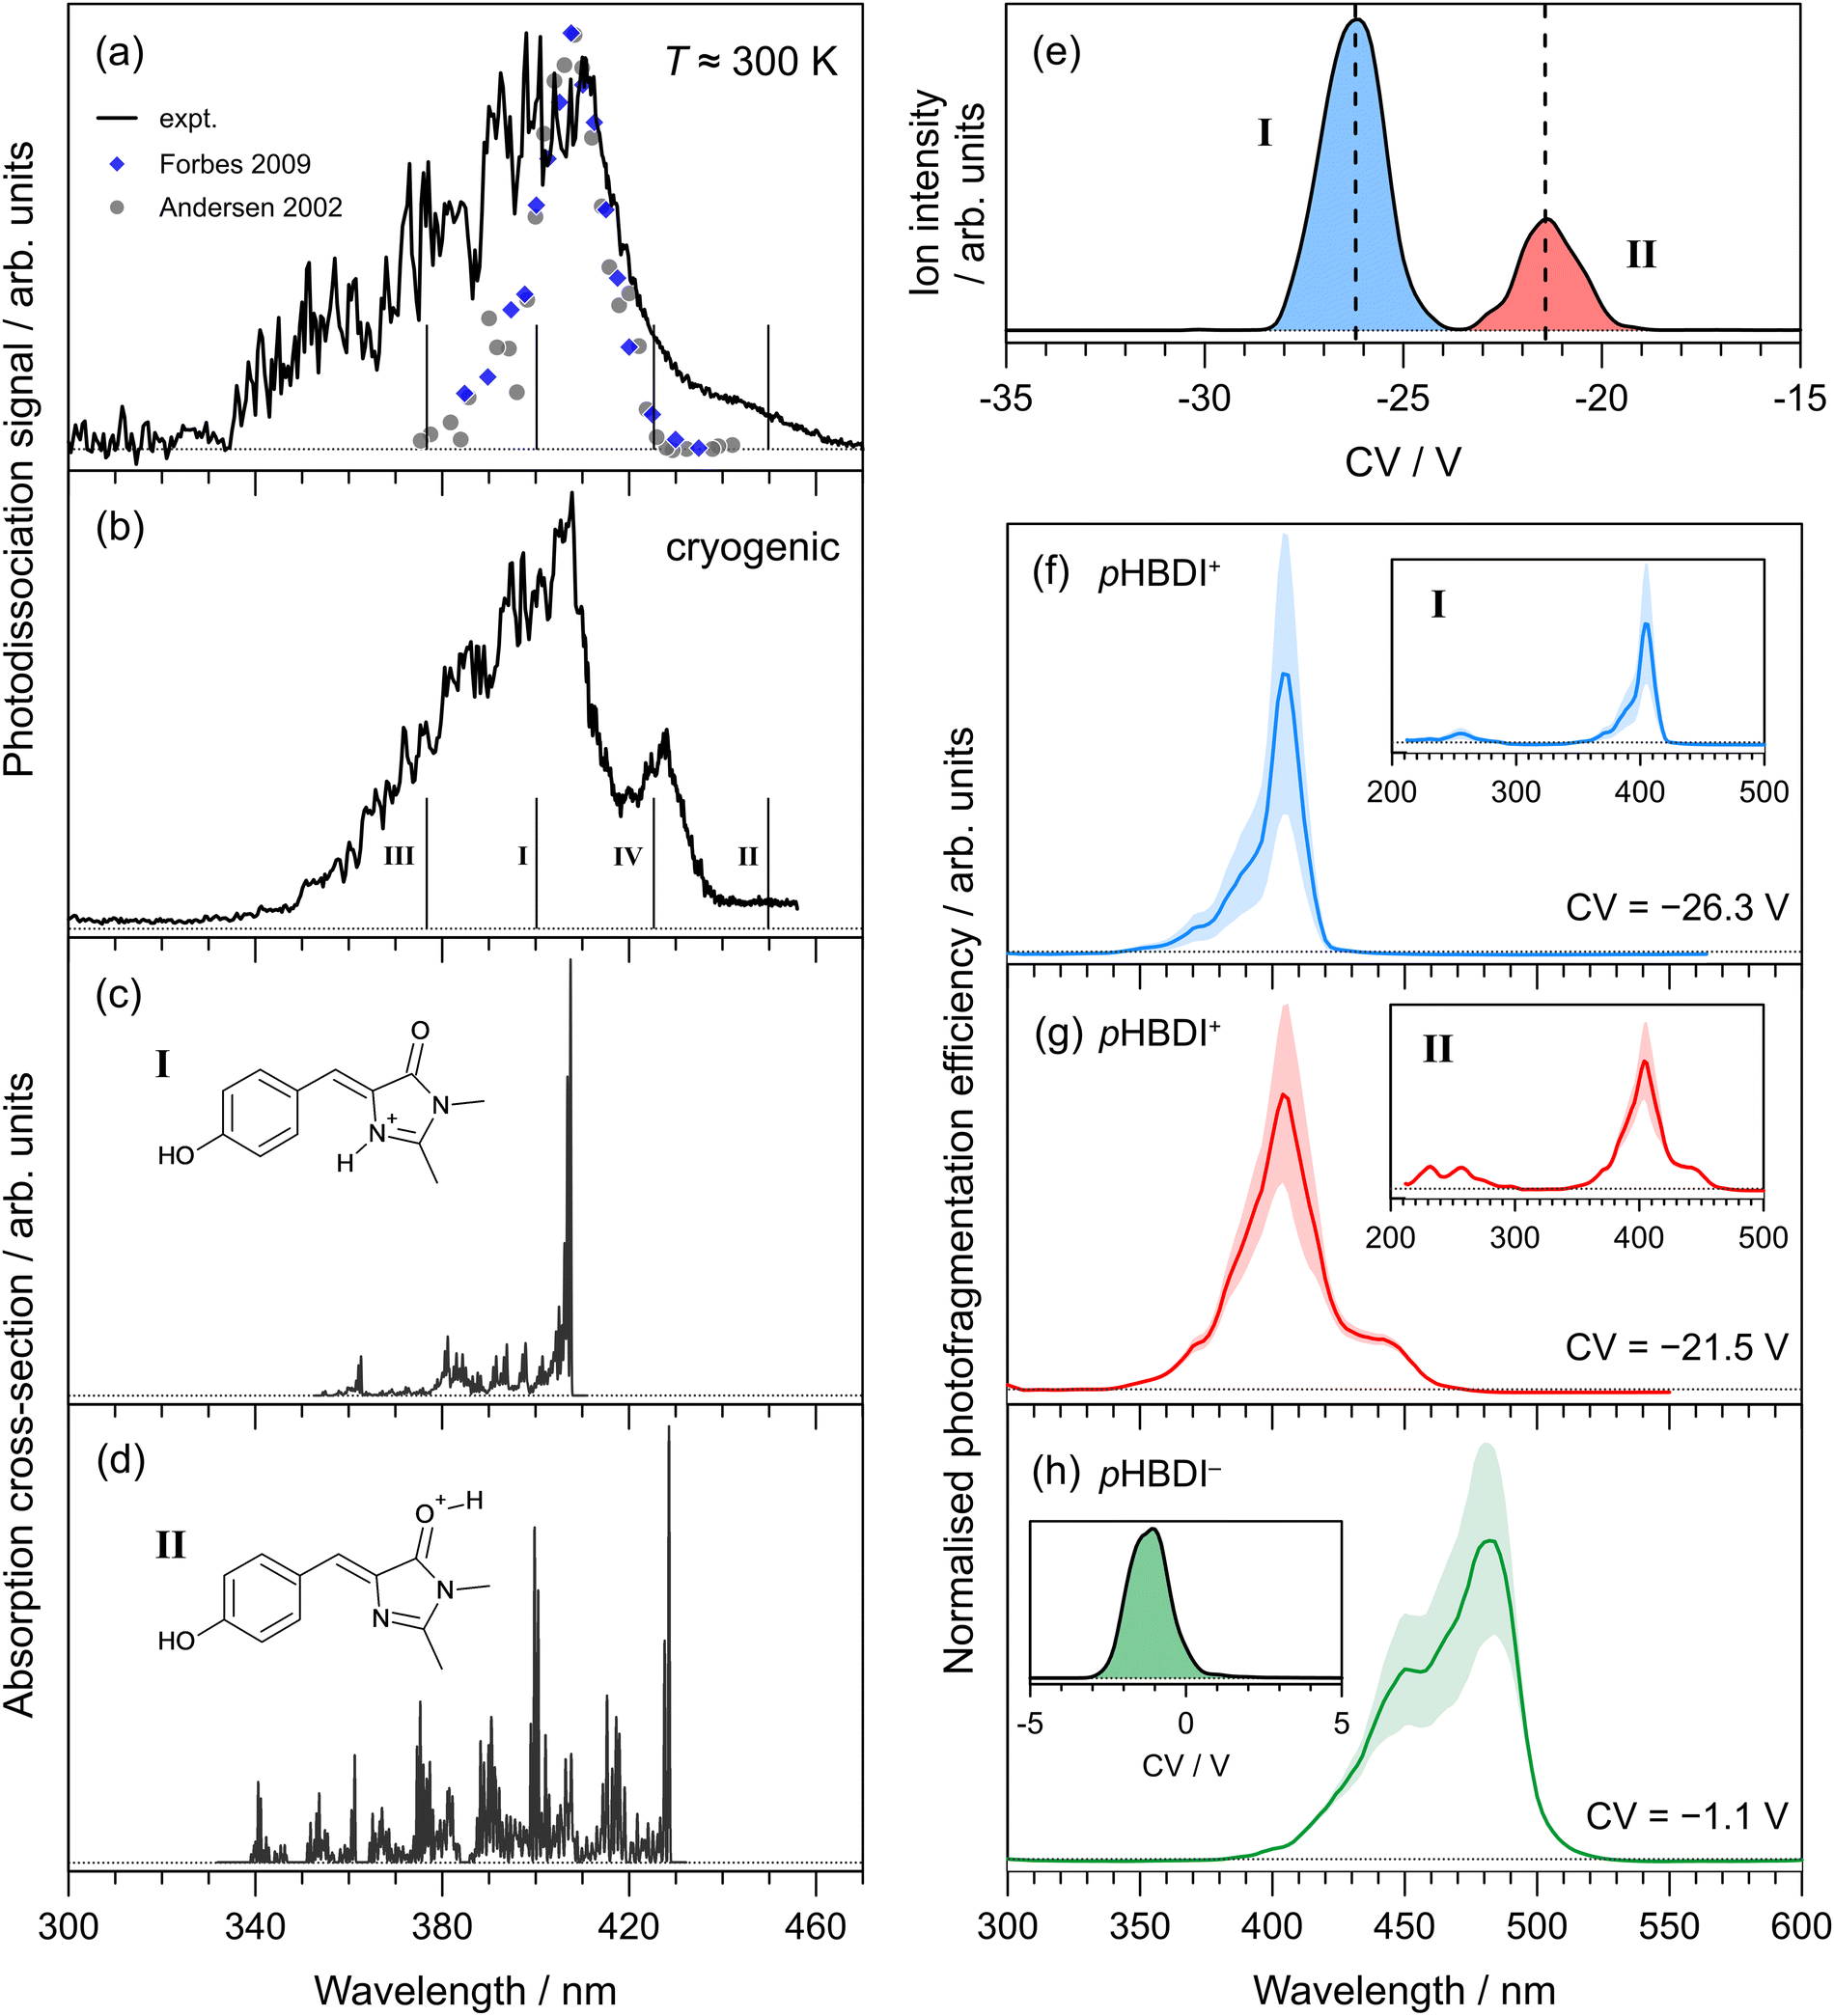 | ||
| Fig. 2 Action spectroscopy of pHBDI+: (a) photodissociation spectrum at T ≈ 300 K [grey dots taken from ref. 24 and blue diamonds from ref. 26], (b) photodissociation spectrum at cryogenic temperature. Vertical bars indicate the calculated vertical excitation wavelengths for protomers I–IV, determined at the DLPNO-STEOM-CCSD(T)/aug-cc-pVDZ level of theory. Franck–Condon simulation of the S1 ← S0 absorption profiles (at T = 20 K) for: (c) protomer I (lowest energy protomer) assigned as the imine protomer I in Fig. 1, and (d) protomer II (second lowest energy protomer) assigned as the carbonyl protomer II in Fig. 1. Protomer-specific photodissociation action spectroscopy: (e) ionogram recorded using DMS heated to T = 150 °C with 1.5 mol% acetonitrile entrained in N2 at SV = 3500 V showing two isomer populations, assigned to protomers I and II, (f) photodissociation spectrum for protomer I, (g) photodissociation spectrum for protomer II. Panel (h) shows the photodissociation spectrum recorded for (deprotonated) pHBDI− and ionogram (inset), consistent with a single deprotomer [SV = 3000 V, pure N2 carrier gas], and with earlier spectra.22,54 Dotted horizontal baselines indicate the zero signal level. | ||
The ionogram of electrosprayed pHBDI+ recorded using DMS is shown in Fig. 2(e). Two isomeric (protomer) populations are discernible, centered at CVs of −26.3 V (I, blue) and −21.5 V (II, red), with a 3:1 abundance. The asymmetry in peak II is probably a signal-to-noise artefact. Protomer-specific photodissociation action spectra recorded for mobility-selected ions at the two CVs are given in Fig. 2(f) and (g), respectively. Both spectra have similar band maxima (≈405 nm) and overall shape, although the spectrum for protomer I is narrower than for protomer II, in part due to the presence of a shoulder at ≈440 nm for protomer II. The protomer-specific photodissociation maxima are in close agreement with that for the T ≈ 300 K spectrum in Fig. 2(a), and it is evident that some combination of the protomer-specific photodissociation spectra can describe the T ≈ 300 K and cryogenic spectra. Furthermore, the action spectrum for protomer I is in good agreement with the earlier ion storage ring and ion trap photodissociation reports (Fig. 2(a)), supporting that the conditions in the earlier experiments produced (predominantly) a single protomer.
To help assign the action spectra to individual protomers, we performed electronic structure calculations on the possible protonated structures identified in Fig. 1(a). Relative energies of each protomer are summarised in Table 1, showing that protomer I, with protonation on the imine nitrogen, is the most stable form. The second lowest energy form, protomer II, lies 0.38 eV higher in energy and corresponds to protonation on the carbonyl oxygen. The other protomers, III and IV, lie much higher in energy and are unlikely to be formed during electrospray ionisation. Calculated vertical excitation wavelengths (DLPNO-STEOM-CCSD/aug-cc-pVDZ level of theory) for the protomers are indicated as vertical bars in Fig. 2(a) and (b) (values given in Table 1). Earlier benchmarking calculations on pHBDI-based deprotonated anions with the same level of theory determined that vertical excitation energies, on average, are within ≈0.05 eV (≈15 nm in the present spectral range) of experiment.22 The calculated vertical excitation wavelength for protomer I is within 10 nm of the action spectrum peak. On the other hand, the calculated value for protomer II is red-shifted by ≈20 nm compared with the longest-wavelength shoulder feature in the cryogenic action spectrum.
| Protomer | pHBDI+ | Cyan+ | ||
|---|---|---|---|---|
| ΔEa/eV | VEE/eV | ΔEa/eV | VEE/eV | |
| a For protomers I, II, and III, calculations at the CCSD(T)/aug-cc-pVDZ level of theory gave the same ΔE values, supporting the use of the less demanding DLPNO-CCSD(T) method. b These values are greater than the 11 kJ mol−1 energy difference between Z- and E–pHBDI−.54 It is unlikely that these E isomers will form considering the substantial energy differences. | ||||
| I | 0.00 (14)b | 3.10 | 0.00 (31)b | 3.00 |
| II | 0.38 (24)b | 2.76 | 0.38 (41)b | 2.75 |
| III | 2.04 | 3.29 | 1.26 | 3.37 |
| IV | 1.20 | 2.92 | 1.23 | 2.93 |
Franck–Condon simulation of the S1 ← S0 absorption spectra for protomers I and II, performed at the ωB97X-D/aug-cc-pVDZ level of theory, are shown in Fig. 2(c) and (d), respectively, and have been translated to coincide with the experimental spectra. The simulation for protomer I is consistent with the mobility-selected spectrum for protomer I as well as the earlier T ≈ 300 K measurements (Fig. 2(a)), and describes the most intense portion of our cryogenic spectrum (Fig. 2(b)). The Franck–Condon simulation for protomer II is consistent with the additional red-edge shoulder feature observed in our T ≈ 300 K and cryogenic action spectra, and the mobility-selected action spectrum for protomer II. The extended progression character of the simulated band also describes the broadened tail on the blue-edge of those experimental spectra.
We note that pHBDI+ (and Cyan+) can exist as E and Z isomers with respect to the double bond on the methine bridge. Isomer-selective action spectroscopy experiments using a drift-tube instrument on the deprotonated anion, pHBDI−,54 have shown that the relative abundance of the E and Z isomers depends on collisional treatment of the ions as they are introduced into vacuum. However, the mobility-selected action spectra for the E and Z isomers of pHBDI− are essentially identical (i.e. indistinguishable), consistent with vertical excitation wavelength calculations. In the present DMS experiments, only a single ionogram peak was observed for pHBDI−. For pHBDI+ and Cyan+, we expect the action spectra to predominately reflect the Z isomers for a given protomer because the energies of the E-isomers are substantially higher than for the Z-isomers (Table 1). Furthermore, electronic structure calculations of vertical excitation wavelengths for the E isomers of the iminie protomers are within a few nanometers of those for the Z isomers.
It is interesting to note that the mobility-selected action spectra for protomers I and II have the same wavelengths of maximum response. There are two possible explanations. First, this is coincidence and indeed the mobility-selective experiments probe pure ensembles of each protomer due to clear protomer separation (Fig. 2(e)). Second, there may be some degree of conversion of protomer II into the more stable protomer I, which occurs after DMS isomer separation and while the ions are being transferred into the trap. Such an interconversion may occur due to the temperature of the ions (T ≈ 500–600 K) and collisions associated with focussing and RF electric field as ions are transferred into the higher vacuum environment. Whatever the case, it is clear that the action spectra for pHBDI+ recorded in two separate instruments, incorporating different electrospray ionisation sources and ion optics, show the co-existence of the two lowest energy protomers. Conversely, the earlier ion storage ring and ion trap photodissociation spectra appear consistent with a single protomer.
We conclude that pHBDI+ is generated as imine and carbonyl protomers in both the Marseille and Waterloo photodissociation experiments.
3.2 Cyan+
The photodissociation action spectrum recorded for Cyan+ at T ≈ 300 K is shown in Fig. 3(a). At T ≈ 300 K, the spectrum spans the 340–460 nm range, with the peak spectral response at 412 ± 2 nm. Our spectrum is substantially different to an earlier report (filled circles in Fig. 3(a)), which was recorded in an ion storage ring by monitoring the production of neutral photofragments.25 The literature spectrum peak is red-shifted by ≈40 nm and spans a slightly narrower spectral range (420–510 nm). A rough cryogenic photodepletion spectrum for Cyan+ recorded in the Marseille experiment is included in Fig. 3(a), and is substantially narrower than the T ≈ 300 K spectrum and with a slightly (≈10 nm) blue-shifted maximum.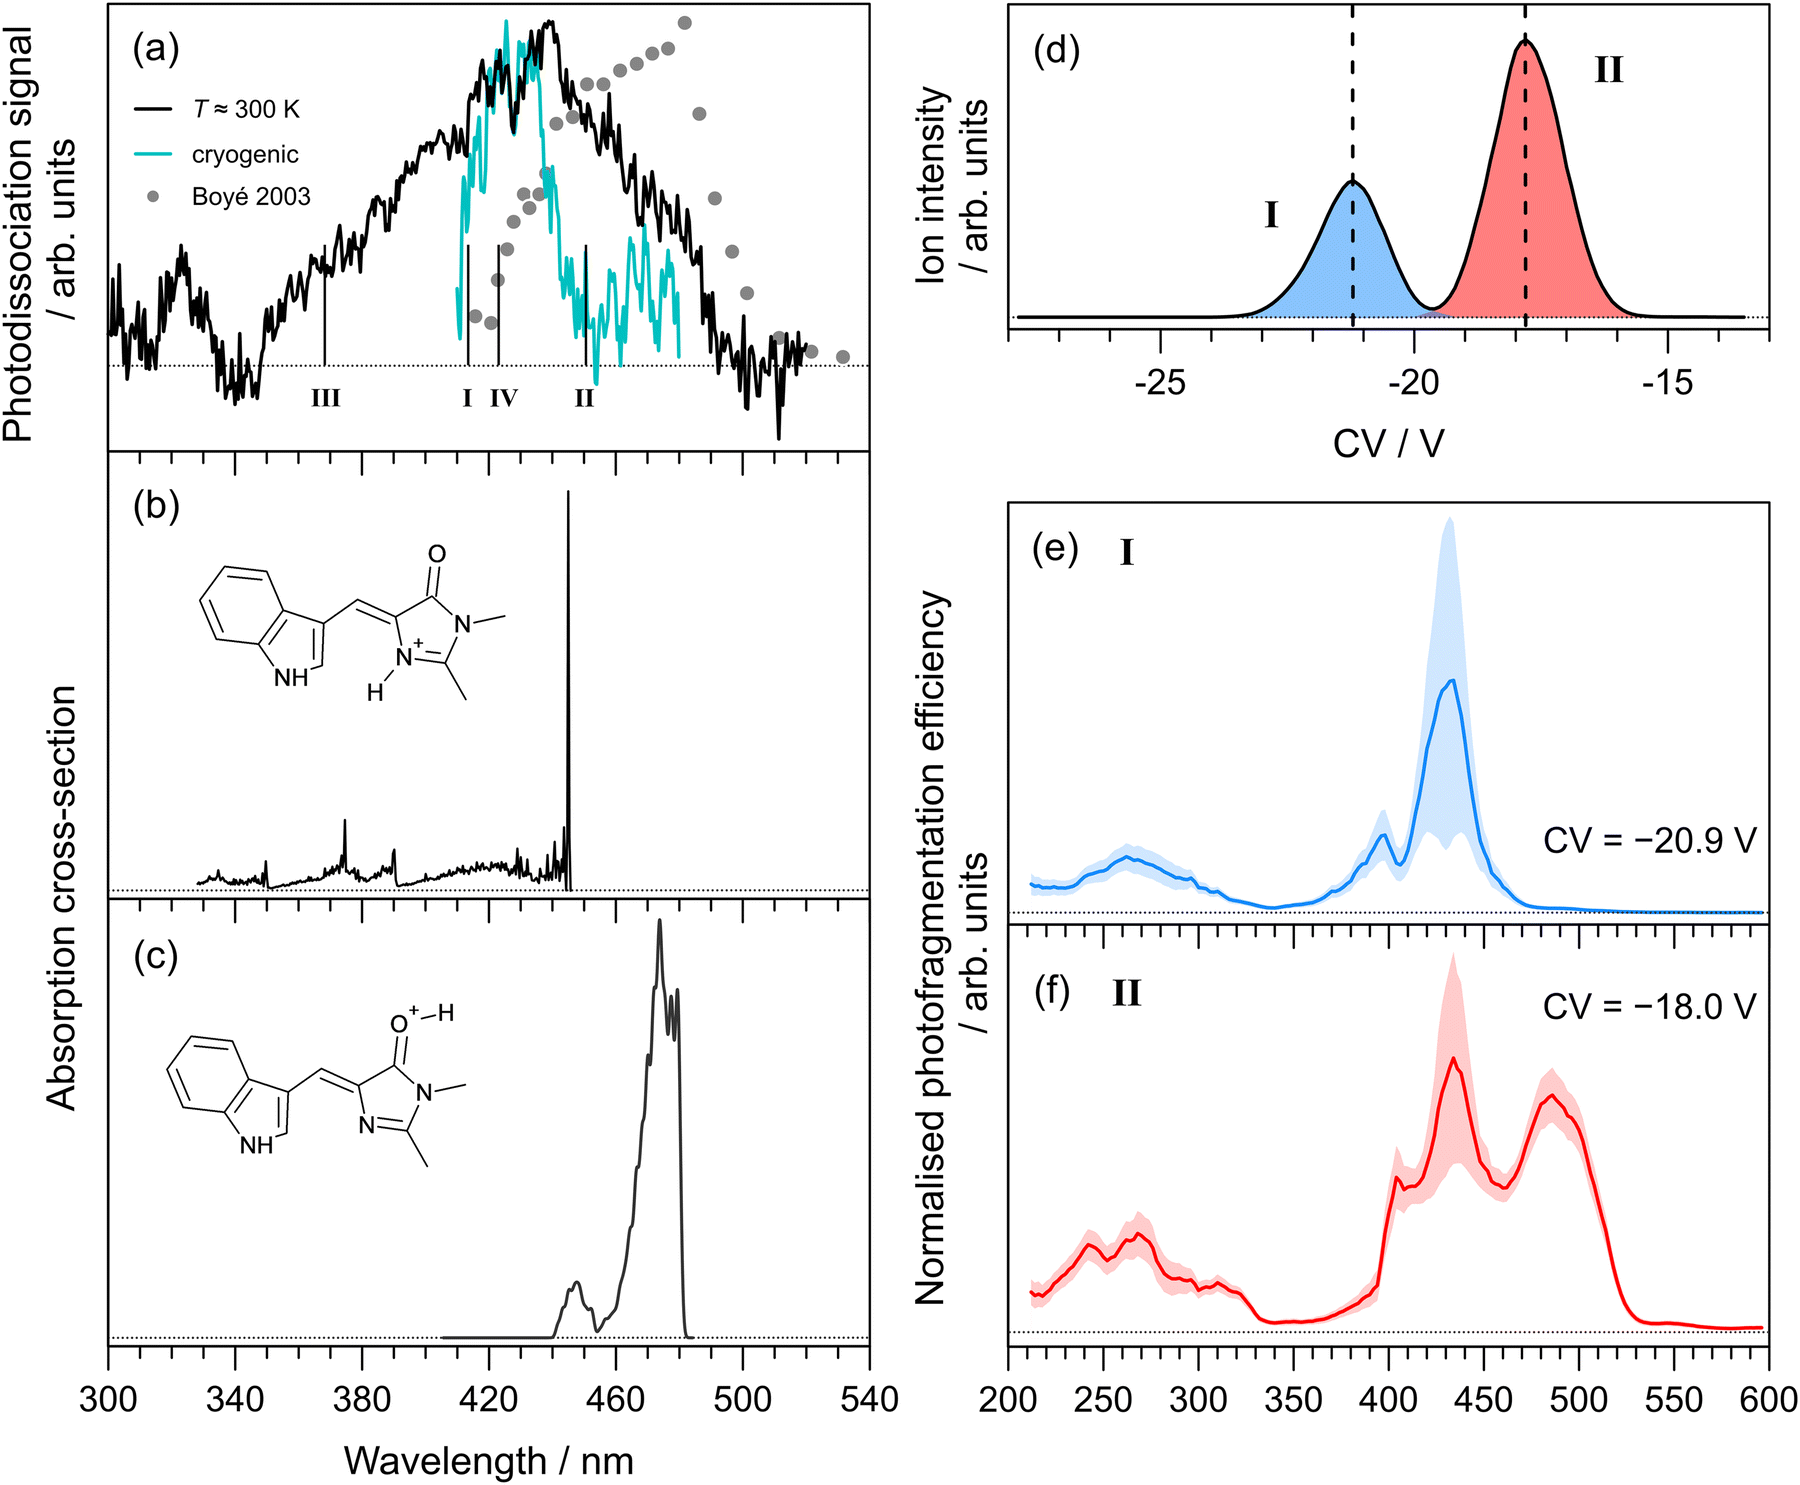 | ||
| Fig. 3 Action spectroscopy of Cyan+: (a) photodissociation spectrum at T ≈ 300 K [dots are from ref. 25]. Vertical bars indicate the calculated vertical excitation wavelengths for protomers I–IV, determined at the DLPNO-STEOM-CCSD(T)/aug-cc-pVDZ level of theory. Franck–Condon simulation of the S1 ← S0 absorption profiles (at T ≈ 20 K) for: (b) the lowest energy protomer, I, and (c) the second lowest energy protomer, II. Protomer-specific photodissociation spectroscopy: (d) ionogram recorded using DMS heated to T = 150 °C with 1.5 mol% propan-2-ol entrained in N2 at SV = 2900 V showing two isomer populations assigned to protomers I and II, (e) photodissociation spectrum for species I, (f) photodissociation spectrum for species II. | ||
In a similar vein to pHBDI+, we computed the lowest energy protomers (Table 1), finding that protonation on the imine nitrogen (protomer I) and carbonyl group (protomer II) corresponds to the two lowest energy protomers, respectively. The other protomers, III and IV, lie substantially higher in energy and are unlikely to be formed during electrospray ionisation. Calculated vertical excitation wavelengths (DLPNO-STEOM-CCSD/aug-cc-pVDZ level of theory) for the possible protomers are indicated as vertical bars in Fig. 3(a) (values given in Table 1). Taking into account the precision of the computational method (±0.2 eV), the two lowest energy protomers could satisfactorily describe the spectra.
Franck–Condon simulation of the S1 ← S0 absorption profiles (translated to coincide with the experimental spectra) for the imine and carbonyl protomers are shown in Fig. 3(b) and (c), respectively. The imine protomer was difficult to model because of a large internal rotation of single bond as part of the methine bridge (S0 at 21.5 and S1 at 87.7), although the vertical excitation is bright (oscillator strength, f = 0.60). We assign the main part our T ≈ 300 K spectrum to protomer I, and the red-edge (as well as the literature spectrum) to protomer II. These assignments are also based on the protomer-specific spectra described below.
The ionogram for electrosprayed Cyan+ recorded using the Waterloo instrument is shown in Fig. 3(d). As with pHBDI+, two isomeric (protomer) populations are discernible, centred at CVs of −20.9 V (I, blue) and −18.0 V (II, red), with approximately a 2:1 abundance. Protomer-specific photodissociation action spectra recorded for mobility-selected ions at the two CVs are given in Fig. 3(d) and (e), respectively. The photodissociation spectrum for protomer I has maximum response at 434 ± 3 nm, while protomer II has the additional peak at 488 ± 3 nm. These assignments are consistent with the energy ordering of the calculated the vertical excitation wavelengths.
It is significant to note that the longer wavelength peak at ≈430 nm in the protomer-specific spectrum assigned to protomer II is not reproduced in the Franck–Condon simulation for the S1 ← S0 transition in Fig. 3(c). Furthermore, our DLPNO-STEOM-CCSD/aug-cc-pVDZ calculations indicated no higher-lying excited state with a substantial oscillator strength that could account for this feature. We therefore hypothesise that this spectral feature is associated with conversion of protomer II to protomer I after DMS separation, presumably due to solvent clustering combined with a low barrier to proton shuffling.38,55 This conversion is consistent with the fact that protomer II is higher in energy and, on statistical thermodynamic grounds, would be expected to convert to protomer I when energised. The same arguments can be applied to pHBDI+ protomer II. In principle, such protomer interconversions might be minimised by trialling DMS separation with a range of non-protic dopants.
In summary, as for pHBDI+, we conclude that Cyan+ is generated as imine and carbonyl protomers in both the Marseille and Waterloo photodissociation experiments.
4 Conclusions
This work has demonstrated that electrospray ionisation of protonated pHBDI and Cyan chromophores in two disparate electrospray ionisation experiments each generates two protomers, and has demonstrated the capacity for DMS coupled with laser spectroscopy to quantify the protomers and record protomer-specific action spectra. For both chromophores, protonation on the imine nitrogen is the lowest energy form, followed by protonation on the carbonyl group. Additional protomers could, in principle, be generated in other experiments due to the large number of factors that contribute to protomer abundance. Because the protomer-specific photodissociation spectra for a given chromophore overlap, it is difficult to disentangle relative protomer abundances or contributions in experiments that do not offer protomer separation. Future work will seek to use ion mobility spectrometry coupled with other laser spectroscopies, including photoisomerisation action spectroscopy56 and femtosecond time-resolved strategies,57 to probe the photochemistry of each protomer individually.The occurrence of co-existing gas-phase protomers (or deprotomers in negative-mode electrospray ionisation) appears a common issue for many biochromophores,58–60 and will likely become an increasingly important as action spectroscopy experiments are applied to more complex biomolecules with many heteroatom sites (e.g. N and O atoms), allowing for a large number of protomers. Robust action spectroscopy studies on such species should have provisions for protomer selectivity.
The spectra presented in this paper complement recent DMS deprotomer-selected photodissociation action spectra on the Kaede chromophore,55 and, similarly, required a dopant to assist DMS separation. As for pHBDI+ and Cyan+, it was found that the higher energy deprotomer probably contained a signature of the lower energy deprotomer. Further quantitative information on the propensity and barriers for protomer/deprotomer interconversion could be obtained through collision-induced tandem ion mobility spectrometry experiments,12,58,59,61 where precursor species are selected, collisionally activated, and the products then separated and quantified. Such experiments could be conducted as a function of the dopant molecule to investigate how properties, such as hydrogen-bonding propensity of the dopant,36–38 affect isomerisation barriers.
Data availability
The data that support the findings of this study are available from the corresponding author upon reasonable request.Author contributions
Photodissociation experiments at T ≈ 300 K and T = 40 ± 10 K (cryogenic) were performed by JD, JAN, EKA, and JNB in the laboratory of JAN. Protomer-specific action spectroscopy experiments were performed by CRMR and CI in the laboratory of WSH. Quantum chemical calculations were performed by EKA, and Franck–Condon simulations were performed by JD and JNB. The Cyan molecule was synthesised by IC and ANC. The manuscript was prepared by EKA and JNB, and discussed by all authors. The project was managed by JNB and MHS.Conflicts of interest
There are no conflicts to declare.Acknowledgements
JNB acknowledges funding from an EPSRC New Investigator Award (EP/W018691). JAN acknowledges funding from the Agence Nationale de la Recherche (ANR, HYDRAE project ANR-21-CE30-0004-01) and additional support from the French Programme National “Physique et Chimie du Milieu Interstellaire” (PCMI) of the CNRS/INSU with the INC/INP, co-funded by the CEA and the CNES. WSH acknowledges financial support provided by the Natural Sciences and Engineering Research Council (NSERC) of Canada in the form of Discovery and Alliance grants, and Mitacs in the form of an Accelerate grant. EKA thanks the University of East Anglia for a doctoral studentship. Travel funding was provided by the Swedish Foundation for International Cooperation in Research and Higher Education (STINT) Grant for Internationalisation programme (PT2017-7328 to MHS and JNB). Electronic structure calculations were carried out on the High Performance Computing Cluster supported by the Research and Specialist Computing Support service at the University of East Anglia.Notes and references
- R. Y. Tsien, Annu. Rev. Biochem., 1998, 67, 509–544 CrossRef CAS PubMed.
- Fundamentals of Fluorescence Imaging, ed. G. Cox, Jenny Stanford Publishing, 2019 Search PubMed.
- N. C. Shaner, P. A. Steinbach and R. Y. Tsien, Nat. Methods, 2005, 2, 905–909 CrossRef CAS PubMed.
- M. Ormö, A. B. Cubitt, K. Kallio, L. A. Gross, R. Y. Tsien and S. J. Remington, Science, 1996, 273, 1392–1395 CrossRef PubMed.
- G.-J. Kremers, J. Goedhart, E. B. van Munster and T. W. J. Gadella, Biochemistry, 2006, 45, 6570–6580 CrossRef CAS PubMed.
- G. D. Malo, L. J. Pouwels, M. Wang, A. Weichsel, W. R. Montfort, M. A. Rizzo, D. W. Piston and R. M. Wachter, Biochemistry, 2007, 46, 9865–9873 CrossRef CAS PubMed.
- B. Seefeldt, R. Kasper, T. Seidel, P. Tinnefeld, K.-J. Dietz, M. Heilemann and M. Sauer, J. Biophotonics, 2008, 1, 74–82 CrossRef CAS PubMed.
- J. S. Paige, K. Y. Wu and S. R. Jaffrey, Science, 2011, 333, 642–646 CrossRef CAS PubMed.
- R. Heim, D. C. Prasher and R. Y. Tsien, Proc. Natl. Acad. Sci. U. S. A., 1994, 91, 12501–12504 CrossRef CAS PubMed.
- X. He, A. F. Bell and P. J. Tonge, FEBS Lett., 2003, 549, 35–38 CrossRef CAS PubMed.
- S. P. Laptenok, J. Conyard, P. C. B. Page, Y. Chan, M. You, S. R. Jaffrey and S. R. Meech, Chem. Sci., 2016, 7, 5747–5752 RSC.
- J. N. Bull, N. J. A. Coughlan and E. J. Bieske, J. Phys. Chem. A, 2017, 121, 6021–6027 CrossRef CAS PubMed.
- S. J. P. Marlton and A. J. Trevitt, Chem. Commun., 2022, 58, 9451–9467 RSC.
- S. Warnke, J. Seo, J. Boschmans, F. Sobott, J. H. Scrivens, C. Bleiholder, M. T. Bowers, S. Gewinner, W. Schöllkopf, K. Pagel and G. von Helden, J. Am. Chem. Soc., 2015, 137, 4236–4242 CrossRef CAS PubMed.
- S. Ø. Pedersen, C. S. Byskov, F. Turecek and S. B. Nielsen, J. Phys. Chem. A, 2014, 118, 4256–4265 CrossRef CAS PubMed.
- E. Matthews, R. Cercola and C. Dessent, Molecules, 2018, 23, 2036 CrossRef PubMed.
- J. A. Noble, C. Dedonder-Lardeux, J. Mascetti and C. Jouvet, Chem. – Asian J., 2017, 12, 1523–1531 CrossRef CAS PubMed.
- D. Müller and O. Dopfer, Phys. Chem. Chem. Phys., 2020, 22, 18328–18339 RSC.
- H. Zettergren, A. Domaracka, T. Schlathölter, P. Bolognesi, S. Díaz-Tendero, M. Abuda, S. Tosic, S. Maclot, P. Johnsson, A. Steber, D. Tikhonov, M. C. Castrovilli, L. Avaldi, S. Bari, A. R. Milosavljević, A. Palacios, S. Faraji, D. G. Piekarski, P. Rousseau, D. Ascenzi, C. Romanzin, E. Erdmann, M. Alcamí, J. Kopyra, P. Limão-Vieira, J. Kočišek, J. Fedor, S. Albertini, M. Gatchell, H. Cederquist, H. T. Schmidt, E. Gruber, L. H. Andersen, O. Heber, Y. Toker, K. Hansen, J. A. Noble, C. Jouvet, C. Kjær, S. B. Nielsen, E. Carrascosa, J. Bull, A. Candian and A. Petrignani, Eur. Phys. J. D, 2021, 75, 152 CrossRef CAS.
- A. B. Attygalle, H. Xia and J. Pavlov, J. Am. Soc. Mass Spectrom., 2017, 28, 1575–1586 CrossRef CAS PubMed.
- H. Xia and A. B. Attygalle, J. Am. Soc. Mass Spectrom., 2017, 28, 2580–2587 CrossRef CAS PubMed.
- E. K. Ashworth, M. H. Stockett, C. Kjær, P. C. B. Page, S. R. Meech, S. B. Nielsen and J. N. Bull, J. Phys. Chem. A, 2022, 126, 1158–1167 CrossRef CAS PubMed.
- M. A. Parkes, A. Bennett and H. H. Fielding, Mol. Phys., 2019, 117, 3027–3035 CrossRef CAS.
- L. H. Andersen, A. Lapierre, S. B. Nielsen, I. B. Nielsen, S. U. Pedersen, U. V. Pedersen and S. Tomita, Eur. Phys. J. D, 2002, 20, 597–600 CrossRef CAS.
- S. Boyé, I. B. Nielsen, S. B. Nielsen, H. Krogh, A. Lapierre, H. B. Pedersen, S. U. Pedersen, U. V. Pedersen and L. H. Andersen, J. Chem. Phys., 2003, 119, 338–345 CrossRef.
- M. W. Forbes and R. A. Jockusch, J. Am. Chem. Soc., 2009, 131, 17038–17039 CrossRef CAS PubMed.
- V. Voliani, R. Bizzarri, R. Nifos, S. Abbruzzetti, E. Grandi, C. Viappiani and F. Beltram, J. Phys. Chem. B, 2008, 112, 10714–10722 CrossRef CAS PubMed.
- I. Alata, J. Bert, M. Broquier, C. Dedonder, G. Féraud, G. Grégoire, S. Soorkia, E. Marceca and C. Jouvet, J. Phys. Chem. A, 2013, 117, 4420–4427 CrossRef CAS PubMed.
- J. A. Noble, E. Marceca, C. Dedonder, I. Carvin, E. Gloaguen and C. Jouvet, Eur. Phys. J. D, 2021, 75, 1–13 CrossRef.
- N. Esteves-López, C. Dedonder-Lardeux and C. Jouvet, J. Chem. Phys., 2015, 143, 074303 CrossRef PubMed.
- H. Kang, G. Féraud, C. Dedonder-Lardeux and C. Jouvet, J. Phys. Chem. Lett., 2014, 5, 2760–2764 CrossRef CAS PubMed.
- J. L. Campbell, M. Zhu and W. S. Hopkins, J. Am. Soc. Mass Spectrom., 2014, 25, 1583–1591 CrossRef CAS PubMed.
- C. Liu, J. C. Y. L. Blanc, J. Shields, J. S. Janiszewski, C. Ieritano, G. F. Ye, G. F. Hawes, W. S. Hopkins and J. L. Campbell, Analyst, 2015, 140, 6897–6903 RSC.
- C. Liu, J. C. Y. L. Blanc, B. B. Schneider, J. Shields, J. J. Federico, H. Zhang, J. G. Stroh, G. W. Kauffman, D. W. Kung, C. Ieritano, E. Shepherdson, M. Verbuyst, L. Melo, M. Hasan, D. Naser, J. S. Janiszewski, W. S. Hopkins and J. L. Campbell, ACS Cent. Sci., 2017, 3, 101–109 CrossRef CAS PubMed.
- N. J. A. Coughlan, P. J. J. Carr, S. C. Walker, C. Zhou, M. Guna, J. L. Campbell and W. S. Hopkins, J. Am. Soc. Mass Spectrom., 2020, 31, 405–410 CrossRef CAS PubMed.
- A. Haack, C. Polaczek, M. Tsolakis, M. Thinius, H. Kersten and T. Benter, J. Am. Soc. Mass Spectrom., 2020, 31, 785–795 CrossRef CAS PubMed.
- C. Ieritano, D. Rickert, J. Featherstone, J. F. Honek, J. L. Campbell, J. C. Y. L. Blanc, B. B. Schneider and W. S. Hopkins, J. Am. Soc. Mass Spectrom., 2021, 32, 956–968 CrossRef CAS PubMed.
- A. Haack and W. S. Hopkins, J. Am. Soc. Mass Spectrom., 2022, 33, 2250–2262 CrossRef CAS PubMed.
- J. W. L. Lee, M. H. Stockett, E. K. Ashworth, J. E. N. Navarrete, E. Gougoula, D. Garg, M. Ji, B. Zhu, S. Indrajith, H. Zettergren, H. T. Schmidt and J. N. Bull, J. Chem. Phys., 2023, 158, 174305 CrossRef CAS PubMed.
- M. J. Frisch, G. W. Trucks, H. B. Schlegel, G. E. Scuseria, M. A. Robb, J. R. Cheeseman, G. Scalmani, V. Barone, G. A. Petersson, H. Nakatsuji, X. Li, M. Caricato, A. V. Marenich, J. Bloino, B. G. Janesko, R. Gomperts, B. Mennucci, H. P. Hratchian, J. V. Ortiz, A. F. Izmaylov, J. L. Sonnenberg, D. Williams-Young, F. Ding, F. Lipparini, F. Egidi, J. Goings, B. Peng, A. Petrone, T. Henderson, D. Ranasinghe, V. G. Zakrzewski, J. Gao, N. Rega, G. Zheng, W. Liang, M. Hada, M. Ehara, K. Toyota, R. Fukuda, J. Hasegawa, M. Ishida, T. Nakajima, Y. Honda, O. Kitao, H. Nakai, T. Vreven, K. Throssell, J. A. Montgomery, Jr., J. E. Peralta, F. Ogliaro, M. J. Bearpark, J. J. Heyd, E. N. Brothers, K. N. Kudin, V. N. Staroverov, T. A. Keith, R. Kobayashi, J. Normand, K. Raghavachari, A. P. Rendell, J. C. Burant, S. S. Iyengar, J. Tomasi, M. Cossi, J. M. Millam, M. Klene, C. Adamo, R. Cammi, J. W. Ochterski, R. L. Martin, K. Morokuma, O. Farkas, J. B. Foresman and D. J. Fox, Gaussian 16 Revision B.01, Gaussian Inc., Wallingford CT, 2016 Search PubMed.
- F. Neese, Wiley Interdiscip. Rev.: Comput. Mol. Sci., 2011, 2, 73–78 Search PubMed.
- C. Riplinger, P. Pinski, U. Becker, E. F. Valeev and F. Neese, J. Chem. Phys., 2016, 144, 024109 CrossRef PubMed.
- J.-D. Chai and M. Head-Gordon, Phys. Chem. Chem. Phys., 2008, 10, 6615–6620 RSC.
- F. Weigend and R. Ahlrichs, Phys. Chem. Chem. Phys., 2005, 7, 3297–3305 RSC.
- T. M. Henderson, A. F. Izmaylov, G. Scalmani and G. E. Scuseria, J. Chem. Phys., 2009, 131, 044108 CrossRef PubMed.
- K. Raghavachari, G. W. Trucks, J. A. Pople and M. Head-Gordon, Chem. Phys. Lett., 1989, 157, 479–483 CrossRef CAS.
- A. K. Dutta, M. Saitow, B. Demoulin, F. Neese and R. Izsák, J. Chem. Phys., 2019, 150, 164123 CrossRef PubMed.
- D. G. Liakos and F. Neese, J. Chem. Theory Comput., 2015, 11, 4054–4063 CrossRef CAS PubMed.
- D. G. Liakos, Y. Guo and F. Neese, J. Phys. Chem. A, 2019, 124, 90–100 CrossRef PubMed.
- A. Sirohiwal, F. Neese and D. A. Pantazis, J. Chem. Theory Comput., 2021, 17, 1858–1873 CrossRef CAS PubMed.
- S. Gozem and A. I. Krylov, Wiley Interdiscip. Rev.: Comput. Mol. Sci., 2021, 12, e1546 Search PubMed.
- W. Zagorec-Marks, M. M. Foreman, J. R. R. Verlet and J. M. Weber, J. Phys. Chem. Lett., 2019, 10, 7817–7822 CrossRef CAS PubMed.
- F. Santoro, A. Lami, R. Improta, J. Bloino and V. Barone, J. Chem. Phys., 2008, 128, 224311 CrossRef PubMed.
- E. Carrascosa, J. N. Bull, M. S. Scholz, N. J. A. Coughlan, S. Olsen, U. Wille and E. J. Bieske, J. Phys. Chem. Lett., 2018, 9, 2647–2651 CrossRef CAS PubMed.
- N. J. A. Coughlan, M. H. Stockett, C. Kjær, E. K. Ashworth, P. C. B. Page, S. R. Meech, S. B. Nielsen, L. Blancafort, W. S. Hopkins and J. N. Bull, J. Chem. Phys., 2021, 155, 124304 CrossRef CAS PubMed.
- B. D. Adamson, N. J. A. Coughlan, R. E. Continetti and E. J. Bieske, Phys. Chem. Chem. Phys., 2013, 15, 9540–9548 RSC.
- J. N. Bull, C. W. West, C. S. Anstöter, G. da Silva, E. J. Bieske and J. R. R. Verlet, Phys. Chem. Chem. Phys., 2019, 21, 10567–10579 RSC.
- J. N. Bull, E. Carrascosa, L. Giacomozzi, E. J. Bieske and M. H. Stockett, Phys. Chem. Chem. Phys., 2018, 20, 19672–19681 RSC.
- J. N. Bull, G. da Silva, M. S. Scholz, E. Carrascosa and E. J. Bieske, J. Phys. Chem. A, 2019, 123, 4419–4430 CrossRef CAS PubMed.
- J. N. Bull, J. T. Buntine, E. Carrascosa, M. H. Stockett and E. J. Bieske, Eur. Phys. J. D, 2021, 75, 67 CrossRef CAS.
- J. N. Bull, M. S. Scholz, E. Carrascosa, G. da Silva and E. J. Bieske, Phys. Rev. Lett., 2018, 120, 223002 CrossRef CAS PubMed.
Footnotes |
| † Electronic supplementary information (ESI) available: 1H NMR spectrum for Cyan; Cartesian coordinates of optimised geometries. See DOI: https://doi.org/10.1039/d3cp02661b |
| ‡ These authors contributed equally. |
| This journal is © the Owner Societies 2023 |