 Open Access Article
Circularly polarized luminescence of natural products lycorine and narciclasine: role of excited-state intramolecular proton-transfer and test of pH sensitivity†
Giuseppe
Mazzeo
 a,
Marco
Fusè
 a,
Antonio
Evidente
 bc,
Sergio
Abbate
 ad and
Giovanna
Longhi
 *ad
*ad
aDepartment of Molecular and Translational Medicine, Università di Brescia, Viale Europa,11, 25123 Brescia, Italy. E-mail: giovanna.longhi@unibs.it
bDepartment of Chemical Science Università di Napoli Federico II, Via Cintia, 21, 80126, Napoli, Italy
cInstitute of Sciences of Food Production, National Research Council, Via Amendola 122/O, 70185 Bari, Italy
dNational Institute of Optics-CNR, Brescia Research Unit, via Branze 45, 25123, Brescia, Italy
First published on 9th August 2023
Abstract
Circularly polarized luminescence (CPL) is increasingly gaining interest not only for its applicative potentialities but also for providing an understanding of the excited state properties of chiral molecules. However, applications of CPL are mainly in the field of materials science: special organic molecules and polymers, metal (lanthanide) complexes, and organic dyes are actively and intensely studied. So far natural compounds have not been investigated much. We fill the gap here by measuring circular dichroism (CD) and CPL of lycorine and narciclasine, the most abundant known alkaloid and isocarbostyril from Amaryllidaceae, which exhibit a large spectrum of biological activities and are promising anticancer compounds. Dual fluorescence detection in narciclasine led us to unveil an occurring excited-state intramolecular proton transfer (ESIPT) process, this mechanism well accounts for the Stokes shift and CPL spectra observed in narciclasine. The same molecule is interesting also as a pH chiroptical switch. Both in absorption and emission, lycorine and narciclasine are also studied computationally via density functional theory (DFT) calculations further shedding light on their properties.
Introduction
In the last ten years circularly polarized luminescence (CPL) has been experiencing an important revival,1–5 after some silent years since the invention of the technique in the Netherlands, by Oosterhof6 and Wynberg and their collaborators.7 This renaissance was not only due to updated design of the experiment8,9 but also due to the application and use of CPL data in several fields of chemical and materials science.10–16 We are convinced that many other fields are going to benefit from this technique in the years to come. We wish to prove here that the field of natural product chemistry is worth investigating via CPL; indeed, this scientific area has used chiroptical spectroscopies, limited to circular dichroism (CD)17,18 and vibrational optical activity spectroscopies, mainly in order to assess the absolute configuration.17,19,20 We report here a CD and CPL study of two natural products and derivatives thereof, with the aim of characterizing their emissive properties shedding light on how these compounds are structured in the first excited electronic state;21 it may be useful to follow and investigate their mode of action and interaction with biomolecules, when the products are used as drugs.Lycorine 1 (Scheme 1) isolated for the first time in 1877 from Narcissus pseudonarcissus,22 is the main Amaryllidaceae alkaloid and since then the interest towards alkaloids of this family increased because of their wide range of bioactivities. These include antitumor, antiviral, antibacterial, antifungal, antimalarial, analgesic, and cytotoxic activities.23 For these reasons, lycorine was subjected to several investigations, starting from the inhibition of ascorbic acid biosynthesis in higher plants,24,25 its phytotoxicity26 and anticancer effects. From the latter aspect, an extensive structure–activity relationship (SAR) study was also performed.27,28 Among lycorine derivatives its hydrochloride form (LH) is worth mentioning, which, as expected, exhibits a noteworthy increase of its solubility in water, a problem hampering the use of lycorine. Patient-derived xenograft (PDX) model experiment showed that LH in combination with HA14-1 greatly inhibited the growth of gastric cancer in vivo.29
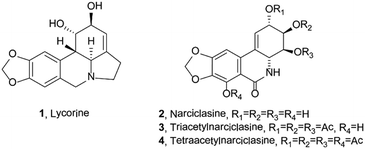 | ||
| Scheme 1 Structures of lycorine, narciclasine, and tri- and tetra-acetyl derivatives of narciclasine 1–4. | ||
Narciclasine 2 is an isocarbostyril compound with a structure close to lycorine, however, it is not a basic compound, since nitrogen is amidic in nature. Narciclasine was isolated for the first time from different varieties of Narcissus bulbs30 and showed potent antimitotic activity.31 Furthermore, narciclasine is very well known for its potent anticancer activity as it possesses strong inhibiting effects against a variety of cancer cells.32–36
The absolute configuration of 1 and 2 had been confirmed also by total synthesis.37–39
Experimental section
General experimental procedures
1H and 13C NMR spectra were recorded at 400 and 100 MHz, respectively on Bruker (Kalsruhe, Germany) spectrometers. The same solvent was used as the internal standard.EI MS data were recorded at 70 eV on a QP 5050 Shimadzu spectrometer. Analytical and preparative thin layer chromatography (TLC) analyses were performed on silica gel plates (0.25 mm Kieselgel 60 and 0.5 mm F254) and on reverse phase (Whatman, Maidstone, UK, KC18 F254, 0.20 mm); the spots were visualized by exposure to UV light and by exposure to I2 vapors. Column chromatography was performed on 0.063–0.200 mm silica gel (Merck) and 40–63 μm, 10 × 240 mm.
Plant materials
Sternbergia lutea Ker Gawl, collected near Bari, Italy, during the weathering period, was identified by Prof. Arrigoni, Dipartimento di Biologia e Patologia Vegetale, Università di Bari, Italy, where a voucher specimen was deposited. Narcissus pseudonarcissus King Alfred bulbs were collected in New Mexico, USA, and a voucher specimen was deposited in the Institute of Mining and Technology, Socorro, NM, USA.Extracted compounds
The fresh bulbs S. lutea Ker Gawl were dried, minced and acid extracted as previously detailed. Crude lycorine 1 obtained as a free base was crystallized by ethanol obtaining the alkaloid as white prisms.40 Similar treatment was applied to the bulbs of N. pesudonarcissus King Alfred, but the corresponding powder was extracted with diluted NaOH as previously described and crude narciclasine 2 crystallized from acetic acid as white needles.41 Tri- and tetra-acetyl-derivatives of narciclasine 3 and 4 were obtained from 2 by usual acetylation with acetic anhydride in pyridine as previously reported by Mondon et al.42 and Pettit et al.43CD and CPL experiments
CD measurements were conducted with Jasco 815SE apparatus, employing quartz cuvettes with 2 mm path length, in solutions from 10−5 to 3 × 10⁻⁴ M (the concentration of each spectrum is reported in figure captions). Generally, 6 scans were taken for every measurement; when needed, up to 20 scans were taken. UV-Vis absorption spectra were recorded on the same apparatus. Fluorescence spectra were recorded on a Jasco FP8600. CPL spectra were recorded on a home-built system in our lab,9 and a second CPL system based on a Jasco “reversed J-715” CD instrument.44 2 mm × 10 mm fluorescence quartz cuvettes were employed with a 90° scattering geometry, 30 scans at 100 nm/min have been run. With the same system also fluorescence spectra were recorded. As light sources, a fiber coupled with an FP-8200 Jasco Fluorimeter was used. Measurements were carried out also by linearly polarizing the excitation beam parallel to the direction of the collected beam, to exclude photoselection effects.1,45–47DFT calculations
The conformational landscapes of the four molecules were explored with CREST code,48 which relies on the GFN2-XTB semiempirical method.49 In the following steps all DFT and TD-DFT calculations were performed with the Gaussian16 suite of packages.50 Low-energy conformers within 12 kJ mol−1 with respect to the global minimum of each molecule were then reoptimized at the M062X/TZVP level of theory including bulk solvent effects by the conductor version of the polarizable continuum model (PCM).51 Their nature was tested by computing Hessian matrices. The computed free energies were employed to evaluate the Boltzmann weights for the computed spectra. Excited stated geometries were obtained starting from the corresponding ground state ones within the time dependent DFT (TD-DFT) framework at the same level of theory. Further specifications are provided in the Results and discussion section.Results and discussion
Compounds (1–4) used in this work are identified by NMR and MS spectroscopy. The 1H and 13C NMR data (identical to those previously reported for lycorine33,52 and for narciclasine41) are reported in the ESI† for completeness. The 1H and 13C NMR data of the tri- and tetra-acetyl derivatives of narciclasine, being new data, are reported in Table S1, with the original spectra, Fig. S1–S4 (ESI†).In the following, we present the UV-Vis absorption spectra and circular dichroism (CD) spectra, the fluorescence and circularly polarized luminescence (CPL) spectra of the compounds reported in Scheme 1 of the Introduction section. The spectroscopic behavior of the two compounds is notably different. In the next section we compare the experimental spectra and provide a first interpretation of the data; to gain more information about compound 2, we investigate the effect of different solvents and chemical modifications considering narciclasine derivatives 3 and 4. We also investigate pH effects on spectroscopic properties. In the following section, we report DFT and TD-DFT calculations which nicely account for the hypotheses suggested by experimental data.
Analysis of experimental CD and CPL spectra
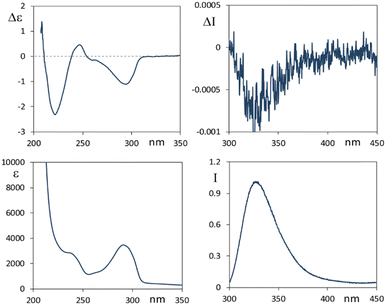
We first analyze the absorption and emissive properties and chiroptical response of ethanol solutions of the two parent compounds 1 and 2 reported in Scheme 1, which directly result from the extraction and purification from plants.In Fig. 1 we present spectroscopic data of lycorine 1. In correspondence to the main accessible UV features, the CD spectrum shows three bands at 294 nm (negative), 248 nm (weak positive) and 222 nm (intense negative). The fluorescence spectrum shows an intense emission band centered at 330 nm. The CPL spectrum (Fig. 1, top right panel) exhibits a negative band centered at 330 nm. In agreement with that observed in most systems, the sign of the CPL band is the same as that for the longest wavelength CD band. This can be interpreted to be due to a similar configuration of the chromophore in both ground and excited states.1,53 Exceptions to this rule have been observed, but are uncommon.21 Besides, from CD and UV-Vis data we have that the g ratio, originally defined by Kuhn54,55 to be gabs = Δε/ε = ΔAbs/Abs, is −0.33 × 10⁻³ for the longest wavelength feature and smaller for the other bands; in the fluorescence-CPL case one observes glum = ΔI/I = 2(IL − IR)/(IL + IR) ≈ −0.8 × 10⁻³ for the single emission band. These values are quite standard4 for merely organic compounds, since, as demonstrated in ref. 44, g is limited above to twice the fine structure constant, namely (2/137), at least considering electric dipole moment allowed transitions. Finally, we notice that the UV-Vis absorption band at 294 nm and the fluorescence band have the same shape, analyzing the former from high to low wavelengths and the latter from low to high wavelengths; this is referred to as the two complementary spectra being “mirror-symmetric”. The same happens to CPL in comparison to the CD feature at the highest wavelength.
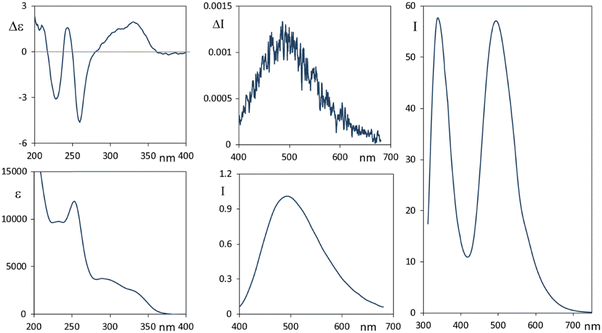
In Fig. 2 we report the CD-UV, CPL and fluorescence spectra of 2, in ethanol solutions.
Narciclasine 2 CD-UV spectra exhibit a larger number of bands than lycorine 1 with an absorption onset at higher wavelengths. A broad positive and featured CD band, which has two positive maxima at 335 nm and at about 310 nm, is allied to the corresponding UV band structured in two components the first one at 335 nm (assignable to conjugated isocarbostyril chromophore transition) and the second at 300 nm. Three CD bands (negative, positive and negative) occur at 260, 245 and 228 nm respectively. Interestingly the fluorescence spectrum of 2 (Fig. 2, right panel) shows two bands, the first one at ca. 340 nm and a second intense band at 495 nm (with a shoulder at 585 nm). Of the two bands observed in the emission spectrum, we were only able to measure the CPL signal corresponding to the transition at higher wavelengths, which shows a positive band at ca. 495 nm. To be able to measure CPL signals, we were forced to work at high concentrations; under this condition the sample gives strong auto-absorption of the emitted light,1,56 due to the low Stokes shift. In diluted samples, the fluorescence was not enough intense to record CPL at 340 nm. Even though the observed 495 nm CPL band correlates both in sign and g factors (gabs ≈ 0.8 × 10⁻³, glum ≈ 1.2 × 10⁻³) to the first band in the CD spectrum at 335 nm, the large difference in the wavelength and the presence of a higher energy fluorescence band suggested us that it is the 340 nm fluorescence band (see right panel of Fig. 2) that may be interpreted as the emission counterpart of the longest wavelength feature of the UV absorption and CD spectra, in a similar way to that observed for lycorine 1, while the longest wavelength emission (Stokes shift 160 nm) may be associated with an evolution of the system in the excited state.
Different phenomena could lead to dual emission: the presence of different species, aggregation phenomena, eventually favored in the excited state (excimers), intra or inter molecular excited state proton transfer.57–61
In order to test concentration effects possibly promoting aggregation, we considered increasingly diluted solutions and we report CD and fluorescence data thus obtained in Fig. S5 (ESI†). ECD spectral shape is not affected by dilution; the two fluorescence bands recorded in the same solutions, at concentrations lower than 10−4 M, show the same intensity when corrected dividing by transmittance to account for auto-absorption.56 At higher concentrations, transmittance is too low in correspondence of the higher energy band and for this reason we cannot report reliable corresponding data (see Fig. S5, ESI†). In conclusion we cannot completely exclude aggregation effects on the observed dual fluorescence, however, from what was observed, it seems unlikely that just aggregation can explain the intense band at 495 nm, thus another mechanism must be considered.
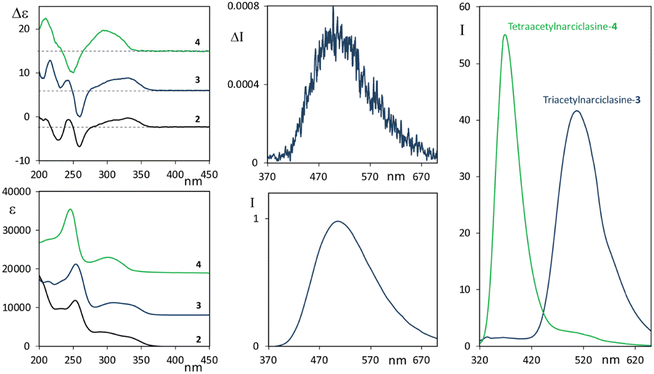
Before resorting to theoretical considerations, we present other experimental data in order to check the role of OH groups, which obviously are involved in solute/solvent or solute/solute interactions, or intramolecular H-bonds. To this aim we studied the two selectively acetylated derivatives of narciclasine, which are compounds 3 and 4 (see Scheme 1), where either only one or no OH is left unprotected, respectively. CD-UV spectra of 3 and 4, measured in acetonitrile solution, are reported in Fig. 3 (left panels) and compared with the CD-UV spectra of 2 in ethanol solution.
The CD and UV spectra of 3 and 4 are quite similar to the spectra of 2, though not identical, in particular similarities observed at low energy indicate little involvement of OH or acetyl groups in the first transitions, however, the absorption/CD onset of 4 at slightly lower wavelength than 2 and 3 suggests some steric influence of OAc substitution of the phenolic hydroxyl on the chromophore responsible for the first transitions.
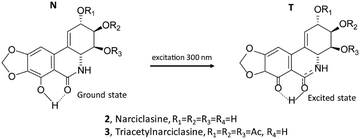
The fluorescence spectra of the two derivatives 3 and 4 were also measured (Fig. 3, right panel). It is worth noting that compound 4, similar to the lycorine 1 case (see Fig. 1, right panel), possesses an intense emission band at short wavelengths. On the other hand, compound 3 emits, with an intense band centered at about 515 nm, approximately in correspondence with the higher wavelength band of narciclasine 2 (see Fig. 2, right panel), though, unlike narciclasine, at a shorter wavelength (at ca. 385 nm) only a very weak feature is observed. The CPL spectrum of 3 (Fig. 3, top center panel) shows a positive band centered at 515 nm. This band, presenting a large Stokes shift, is similar in position, intensity, sign and band shape to the corresponding band of 2, suggesting a common origin of emission in the two compounds. We were not able to record CPL spectra for 4 at short wavelengths since the compound, under the excitation beam, was not stable for enough long time to allow CPL measurement. Comparison of fluorescence spectra of 3 and 4 indicates that the phenolic OH plays a crucial role in the mechanism giving rise to the low energy emission band with a large Stokes shift. Typically these observations suggest the possibility of an excited state intramolecular proton transfer (ESIPT) mechanism to be responsible for the band at a higher wavelength, as shown among others by Zhou and collaborators.62,63 ESIPT was first hypothesized in 195564 to interpret methyl salicylate spectroscopic data and its role has since been recognized in many molecular systems through experiments and calculations.65–70 The phenomenon and the correspondingly observed spectroscopic signature show strong dependence on the strength of the intramolecular H-bonding and on solvent interactions; even the possible occurrence of intermolecular proton transfer has been observed.62 For this reason, one may expect different results in different solvents. Contrary to the case of two conformers of methyl salicylate, which either provide or exclude the possibility of intramolecular H-bonds,63 in narciclasine 2 and its derivative 3 all of the most stable conformers exhibit the intramolecular hydrogen bonds between the phenolic OH and the amide carboxyl group (for conformational study, see below in the theoretical section). Thus, one may assume that in the excited state, the proton moves to the carbonyl group leading to a more stable quinoid form of 2 and 3 (indicated as the T “tautomer” in Scheme 2) which emits at higher wavelengths. In the following we will refer to the original form as N and the tautomeric form after proton transfer as T.
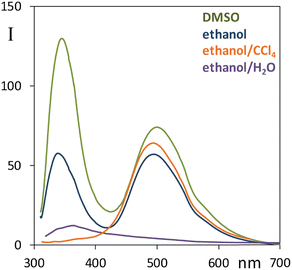
Considering the effect of solvent on the ESIPT process, hydrogen bonding donors like alcohols hinder such mechanism,63 an analogous effect may be observed in the case of polar solvents like acetonitrile.63 Strong H-bond acceptors like DMSO are expected to further suppress the intramolecular proton transfer.71 As a first check, we report in Fig. S6 (ESI†) the fluorescence spectrum of 3 recorded in both ethanol and acetonitrile for due comparison with narciclasine, it was observed that in both solvents 3 has a negligible component at high energy, and an intense band at low energy; it is also clear that emission is more intense in 3 than in 2 at the same measurement conditions. So, in the presence of bulky groups, substituted for peripheral hydroxyl groups, fluorescence is enhanced and the ESIPT process is favored; differently from 3, the interaction ethanol-narciclasine 2 perturbs the intramolecular H-bond and the acceptor properties of C![[double bond, length as m-dash]](https://www.rsc.org/images/entities/char_e001.gif) O, this condition permits emission from two species, the excited state with original ground state geometry (N) at high energy (low Stokes shift) and another excited state determined by (T). To gain further information regarding the dual fluorescence response, we performed further measurements of 2 (Fig. 4) with different solvents: a mixture of ethanol:CCl4, DMSO and water. Due to solubility reasons, both the CCl4 and the H2O solutions were prepared starting from an ethanol solution of 2.
O, this condition permits emission from two species, the excited state with original ground state geometry (N) at high energy (low Stokes shift) and another excited state determined by (T). To gain further information regarding the dual fluorescence response, we performed further measurements of 2 (Fig. 4) with different solvents: a mixture of ethanol:CCl4, DMSO and water. Due to solubility reasons, both the CCl4 and the H2O solutions were prepared starting from an ethanol solution of 2.
When CCl4 is added to ethanol in a 1![[thin space (1/6-em)]](https://www.rsc.org/images/entities/char_2009.gif) :
:![[thin space (1/6-em)]](https://www.rsc.org/images/entities/char_2009.gif) 2 v/v ratio one notices the “disappearance” of the 350 nm fluorescence band (Fig. 4). This result is consistent with the hypothesized ESIPT mechanism since CCl4 does not interact with the solute through hydrogen bonds, therefore this solvent promotes the conversion to the most stable quinoid form (T). In DMSO, instead, compound 2 shows a noteworthy increase of the relative intensity of the near-UV fluorescence band at 340 nm with respect to the 495 nm one. In mixed ethanol/H2O the overall emission is quenched: the high wavelength emission band almost disappears and only the band at about 360 nm is clearly visible, though with a long red tail. These results strongly support the ESIPT mechanism.
2 v/v ratio one notices the “disappearance” of the 350 nm fluorescence band (Fig. 4). This result is consistent with the hypothesized ESIPT mechanism since CCl4 does not interact with the solute through hydrogen bonds, therefore this solvent promotes the conversion to the most stable quinoid form (T). In DMSO, instead, compound 2 shows a noteworthy increase of the relative intensity of the near-UV fluorescence band at 340 nm with respect to the 495 nm one. In mixed ethanol/H2O the overall emission is quenched: the high wavelength emission band almost disappears and only the band at about 360 nm is clearly visible, though with a long red tail. These results strongly support the ESIPT mechanism.
For the sake of completeness, we report in the ESI† also CPL measurements in DMSO for compounds 2 and 3 (see Fig. S7, ESI†).
Being the fluorescence measured in ethanol/H2O 1![[thin space (1/6-em)]](https://www.rsc.org/images/entities/char_2009.gif) :
:![[thin space (1/6-em)]](https://www.rsc.org/images/entities/char_2009.gif) 5 highly quenched, we report in Fig. S8 (ESI†) different ratios of ethanol/H2O for both compounds 2 and 3. It is interesting to consider how the ESIPT band is much more quenched than the high energy component for narciclasine, a similar trend is observed for the triacetyl derivative, with no significant high wavelength component.
5 highly quenched, we report in Fig. S8 (ESI†) different ratios of ethanol/H2O for both compounds 2 and 3. It is interesting to consider how the ESIPT band is much more quenched than the high energy component for narciclasine, a similar trend is observed for the triacetyl derivative, with no significant high wavelength component.
Another characteristic point of this mechanism is that low temperatures inhibit the kinetics of proton transfer72,73 leaving the original natural N form more populated. To test temperature dependence, we have measured the fluorescence spectra of 2 at liquid-N2 temperature (see Fig. S9, ESI†) in the EPA mixture (ether, isopentane, ethanol, 5![[thin space (1/6-em)]](https://www.rsc.org/images/entities/char_2009.gif) :
:![[thin space (1/6-em)]](https://www.rsc.org/images/entities/char_2009.gif) 5
5![[thin space (1/6-em)]](https://www.rsc.org/images/entities/char_2009.gif) :
:![[thin space (1/6-em)]](https://www.rsc.org/images/entities/char_2009.gif) 2, by volume). At 77 K we may notice that the relative intensity of the near-UV band increases with respect to the low energy band. This again supports the interpretation based on an ESIPT mechanism. Some shifts of the bands are also observed: the 340 nm fluorescence band at room temperature is red shifted to 385 nm at liquid-N2 temperature, while the low energy band at 495 nm is blue shifted to 485 nm. These effects could be connected to the glassy state of the solvent in the 77 K measures.
2, by volume). At 77 K we may notice that the relative intensity of the near-UV band increases with respect to the low energy band. This again supports the interpretation based on an ESIPT mechanism. Some shifts of the bands are also observed: the 340 nm fluorescence band at room temperature is red shifted to 385 nm at liquid-N2 temperature, while the low energy band at 495 nm is blue shifted to 485 nm. These effects could be connected to the glassy state of the solvent in the 77 K measures.
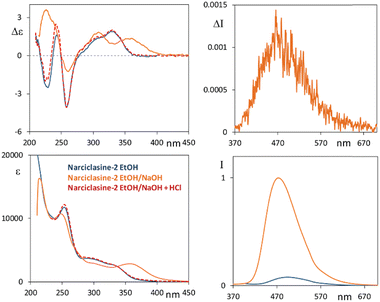
In line with the tests of sensing properties of these molecules towards different environments, we investigated the behavior of compounds 2–4 in the presence of a strong base such as NaOH. Indeed, according to reference74 (see also ref. 30, 31 and 75) narciclasine 2, under basic conditions, exhibits a change in the absorption spectrum, with respect to the neutral form, with the appearance of a low energy absorption band at 365 nm and strong enhancement of the emission band at a high wavelength upon excitation at 360 nm. Thus, we performed measurements of 2 in NaOH–water solution (ethanol![[thin space (1/6-em)]](https://www.rsc.org/images/entities/char_2009.gif) :
:![[thin space (1/6-em)]](https://www.rsc.org/images/entities/char_2009.gif) water 1
water 1![[thin space (1/6-em)]](https://www.rsc.org/images/entities/char_2009.gif) :
:![[thin space (1/6-em)]](https://www.rsc.org/images/entities/char_2009.gif) 10, 10 mM NaOH). The CD and UV spectra of 2 under this mixed solvent condition present a feature with positive CD at 365 nm (see Fig. 5, the solid orange line); a second positive CD band at 310 nm and a negative one at 260 nm are observed matching the neutral 2 CD profile (solid blue line). Finally, a positive CD band is observed at 230 nm, which is opposite in sign with respect to the negative one of the neutral solution.
10, 10 mM NaOH). The CD and UV spectra of 2 under this mixed solvent condition present a feature with positive CD at 365 nm (see Fig. 5, the solid orange line); a second positive CD band at 310 nm and a negative one at 260 nm are observed matching the neutral 2 CD profile (solid blue line). Finally, a positive CD band is observed at 230 nm, which is opposite in sign with respect to the negative one of the neutral solution.
Considering fluorescence, we excited the system at 300 nm in all cases and, upon addition of NaOH, we observed an intense fluorescence band which is ca. 20 nm blue shifted (475 nm) with respect to that observed in ethanol while no emission is observed in the high energy region. Furthermore, a correspondingly strong CPL spectrum is observed, with a positive band centered at ca. 475 nm and a glum factor of about 1.2 × 10⁻³. Similar measurements in NaOH water solution have been performed for compounds 3 and 4 (starting from concentrated acetonitrile solutions) and are reported in Fig. S10 (ESI†). For both derivatives the CD-UV spectra were quite similar to those of 2 already described, the fluorescence spectra are also quite similar to those of compound 2; even for compound 4 we notice the appearance of an emission band at 475 nm while, in acetonitrile solution, 4 has an intense band at 355 nm. We then treated basified solutions of 2–4 with a drop of HCl (Fig. 5 and Fig. S10, ESI†); indeed, ECD and UV spectra of compounds 2 and 3 (red dashed lines) revert to the spectra of the neutral species (solid blue lines). Instead, for compound 4, after the overall process, the spectra do not match the neutral case, being similar instead to the spectra of neutral 2 and 3. The alkaline condition is expected to deprotonate the phenolic OH, if present, and possibly hydrolyze the acetyl groups. HCl addition leads to protonation of anionic species, by again neutralizing the compounds. At the end of the process the CD spectra of the three compounds display the same features including compound 4 as if it had recovered a phenolic OH (see Scheme S1, ESI†).
The observed spectroscopic results in basic solution will be further investigated via DFT calculations in the following.
Computational results
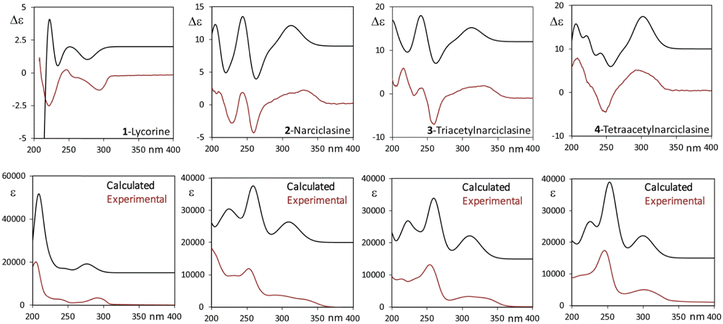
Both the recorded CD signal and the excited state spectroscopic response observed in emission have been rationalized by means of quantum-mechanics DFT and TD-DFT calculations. We first examined the possible conformers for all four molecules in Scheme 1 in the ground state using the CREST48 program. The obtained structures were then fully reoptimized at the DFT level of theory and the lowest energy ones presenting non-negligible population are presented in Tables S2–S5 (ESI†). Apart from hydroxyl or O-acetyl groups’ orientation, the polycyclic backbone is quite rigid: the possible ring deformations are reported in Tables S2–S5 (ESI†) as Cremer–Pople ring coordinates.76 Considering, in particular compound 2, the eight most populated conformers reported in Table S3 (ESI†) differ only in the OH orientation described by three dihedral angles (the phenolic OH is engaged in intra-molecular H-bond) and in the ring puckering angle φ1 relative to the dioxolane ring (care must be taken in accurately performing the conformational search to properly account for the puckering of this ring). The cyclohexene ring (ring 4 in Fig. S12, ESI†) is in half-chair conformation (as described by θ4 and φ4) with the hydroxyl near the NH group in equatorial position and the other two OHs in axial orientation, the opposite half-chair conformations are substantially less stable, lying more than 6 kJ mol−1 above the global minimum. The ECD spectra of each conformer of compound 2 are presented in Fig. S13 (ESI†), from which it appears that in the spectroscopically accessible region the CD signals are independent of hydroxyl orientation while, somehow unexpectedly, they appear sensitive to the dioxolane puckering coordinate φ1. For the sake of discussion, we report in Table S3 (ESI†) also a couple of structures with the alternative conformation of the cyclohexene ring and the relative CD spectra. Through conformational search, DFT optimization, TD-DFT calculations and Boltzmann average of the calculated spectra, we obtained good correspondence between calculated and experimental spectra as shown in Fig. 6 for the four compounds. In all the studied molecular systems, the band at lower energy is mostly associated with a HOMO–LUMO transition (see Fig. S14, ESI† for orbital representation of 2), which in 2–4 is flanked at slightly higher energy by a less intense transition involving a combination of HOMO−1–LUMO and HOMO–LUMO+1 transitions. Once the ground state response of the neutral molecules had been satisfactorily modeled, we approached the excited state investigation, particularly with the aim of understanding the dual fluorescence and CPL response of compound 2. Furthermore, we modeled the anionic species.Calculation of fluorescence response in the case of lycorine is quite simple; being the lowest energy transition independent of hydroxyl orientation, we can take the lowest energy conformer to represent the excited state upon due optimization. This gives for fluorescence and CPL the results reported in Fig. S15 (ESI†) together with absorption and ECD, altogether the match between the experiment and calculation is good.
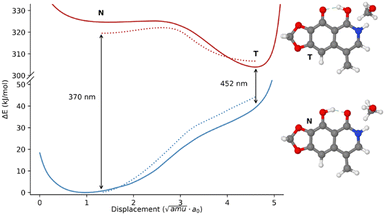
As a first step in the analysis of the properties of the excited state of narciclasine and its derivatives, we decided to rely on a smaller model system (see Fig. 7 for its representation). As already mentioned, this choice, aimed at reducing the computational cost, is justified by the HOMO–LUMO nature of the first transition (see Fig. S14, ESI†), which is almost localized on the atoms that the model shares with the real molecules. Moreover, since the transition is well localized on the rigid portion of 2 and its derivatives, it remains almost constant and independent of the conformation of various pendant groups. This further simplifies our analysis to only the most stable conformer also for the complete systems. In Fig. 7 the potential energy surface (PES) of the template system in the excited state S1 and the PES in the ground state evaluated at the excited states geometries are reported. The PES of the S1 state was built starting from the transition state and following the intrinsic reaction coordinate (IRC) between the two minima. Then, beyond the stationary points, the PES was extended by following the normal modes corresponding to two OH stretchings.77 In Fig. S16 (ESI†) also the behavior of local internal coordinates, OH stretching and O–H–O bending, are reported along the reaction coordinate. As expected, in the excited state two minima separated by a low barrier transition state are found, differently from the ground state where only one minimum is present. As already reported in ref. 63 the energy barrier is extremely sensitive to the characteristics of the solvent. In fact, an implicit solvation model like PCM underestimates the barrier which increases only when explicit solvent molecules are included in the QM simulations. In Fig. 7 the effect achieved including only one solvent molecule is reported as a dashed line.
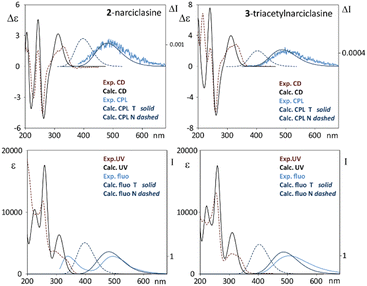
As may be observed in Fig. 7, the more stable quinoid form (T) gets closer to the ground state PES resulting in a less energetic transition. Indeed, the calculated shift from 370 nm to 452 nm well reproduces the experimental data both in terms of relative positions and Stokes shift (see Table S6, ESI†). Encouraged by these results, we optimized the first excited states of the most populated conformer of 2 in both possible forms N and T, just considering the two possible envelope conformation of the dioxolane ring. In all cases the “tautomer” T form is the most stable one and the simulated transitions (see Table S2, ESI†) are in excellent agreement with the experimental values.
For due comparison, we show in Fig. 8 experimental and calculated absorption, CD and CPL and fluorescence spectra. It is important to note that the calculated Stokes shift for the lowest energy emissive band is ca. 180 nm, which is in good agreement with the experimental one.
Considering the relatively high concentration adopted in some experiments, we also decided to simulate possible effects coming from the aggregation of molecules driven by the π–π stacking interaction. Stable aggregates of this type have been found after CREST evaluation and have been optimized via TD-DFT at the same level as the monomer. Even though dimerization leads to slightly red shifted simulated emission transitions with respect to the monomer ones, this effect is not pronounced enough to be related to the wavelength difference between the two experimentally observed bands. For compound 2 theoretical predictions for fluorescence bands are: 372 nm for the N structure, 456 nm for the tautomeric structure T, and 400 nm for a dimer of N type, further suggesting that ESIPT is the crucial mechanism explaining the origin of the dual fluorescence of narciclasine.
The last point we wish to consider is the simulation of the absorption and emission spectra under basic conditions; the assignment of the observed bands through DFT calculations permits to shed light on the nature of the charged species. A first test on the template molecule introduced in Fig. 7 gives already good results. From Table S6 (ESI†) one may see that the deprotonation of the phenol is less energetically demanding than the deprotonation of the amide group. Nonetheless, one should keep in mind that these simulations were performed under PCM conditions, which may not reflect the relative stabilities in H-donor solvents. For this reason, the comparison of experimental spectra with calculated ones for the three possibly occurring situations can give a more reliable picture. Indeed, once the amide is deprotonated, the tautomeric T form becomes the most stable one even in the ground state. The observed wavelength of both the first feature in the absorption and in the emission spectra seems compatible only with the deprotonation of the phenol unit, and the corresponding rotational strength is appreciable and positive as observed, particularly considering one of the two possible envelope conformers of the dioxolane ring.
After the preliminary analysis of the template, we also examined the complete molecule 2, as already observed in the neutral case, the pendants have little influence on the first transitions, therefore we focused on the different possible structures of the backbone by varying φ1 (for the dioxolane) and θ4 and φ4 (for the cyclohexene). For each possible charged forms, namely deprotonated phenol indicated as “NH(−1)”, deprotonated amine in the normal “N(−1)” and tautomeric “T(−1)” forms, four structures were considered through variation of the polycyclic backbone conformation and tested. The geometrical parameters and the first transition characteristics in absorption and emission, are reported in Tables S7 and S8 (ESI†), while the calculated CD spectra for the various cases are illustrated in Fig. S17 (ESI†).
In this case the deprotonated phenol species, “NH(−1)”, appears to have slightly higher energy than tautomeric “T(−1)”, but the correct wavelength and rotational strength calculated for the first feature suggests the prevalence of “NH(−1)”. Considering the backbone conformations, deprotonation of the amide group stabilizes the opposite half-chair of the cyclohexene ring with respect to the neutral case (Table S7, ESI†). Interestingly, in the case of “NH(−1)” (see Fig. S17A, ESI†) the dioxolane puckering is crucial to account for the CD features at high energy, whose sign inverted in the two envelope forms, while the cyclohexene ring is less important. In the cases of deprotonated amide instead, CD spectra are more similar for the various conformers. In Fig. S18 (ESI†), we superimposed the neutral form calculated spectrum with the anionic form spectra. It is difficult to appropriately model the dynamic situation that correctly represents the basic condition of compound 2: absorption onset and rotational strength of the first transition strongly suggest deprotonation of phenol, but the high energy CD spectrum, showing a positive band at about 230 nm of opposite sign with respect to the neutral form, can be justified assuming also the presence of the “T(−1)” form. Without claiming to be able to determine the exact equilibrium among the species, we can say that contributions from the two charged forms, prevalently NH(-1) with some contribution from T(−1), provide a calculated spectrum that well mimics the changes observed with respect to the neutral form (see Fig. S19, ESI†).
Finally, let us look at the fluorescence and CPL observed for 2 in basic conditions. For each possible charged form, four structures have been optimized and energy transitions and rotational strengths were computed. The deprotonated phenol anion is expected to be the most present species in basic solution also at the excited state (energy of this form is the lowest one). This form bears the correct sign for the CPL emission and also the wavelength is correctly evaluated (considering that all calculated transitions are blue shifted with respect to the experiment). In particular one may notice that the emission band recorded under basic conditions is at lower wavelength than emission in ethanolic neutral solution and this is confirmed by calculations (see Tables S3 and S8 for comparison, ESI†) assuming prevalence of the NH(−1) anion.
Conclusions
In this work we have obtained the CPL spectra, together with their absorption counterpart, namely the CD spectra, of two chiral natural products, lycorine 1 and narciclasine 2. Both compounds are extracted from Amaryllidaceae plants; however, the two types of compounds have distinct chemistry with the first one belonging to the alkaloid family and the second one being an isocarbostyril molecule. This difference has a good counterpart in the CPL spectra: for 1 CPL and CD are related in sign and magnitude, with a relatively small Stokes shift, and for 2 CPL and fluorescence are not immediately related to their absorption counterparts, with different CPL and CD bandshapes and with a large Stokes shift. DFT calculations have permitted us to understand that the ground and excited state structures of 1 are quite similar, while in the case of 2 two different tautomeric forms characterize the ground and excited state, connected by the ESIPT mechanism. This effect gives the advantage of a large Stokes shift and, in the case of polar solvents, leads also to the interesting phenomenon of dual fluorescence: in general, compounds with such behavior are sought after in terms of imaging and materials science applications, and recently two interesting examples of ESIPT have been reported also with CPL activity.78,79 With this work, we propose narciclasine and triacetylnarciclasine with the first one being a natural, biocompatible and biochemically active product. Furthermore, both compounds present intense fluorescence and CPL response in basic aqueous solution, which is of interest for sensing. DFT calculated CD spectra compared to the recorded CD response provide information about the charged species present in solution. Since the characteristic core of these molecules is common to other natural products, further studies will be worthwhile pursuing, with the aim of testing different substituents and different environments of biological interest.Author contributions
AE isolated and characterized the natural compounds; CPL, CD, and fluorescence measurements and interpretation were carried out by GM, MF, SA and GL. All authors equally participated in writing and re-reading the manuscript.Conflicts of interest
There are no conflicts to declare.Acknowledgements
The Italian Ministry of University and Research (PRIN 2017 program 2017A4XRCA_003) is acknowledged for funding. The Big & Open Data Innovation Laboratory (BODaILab) of the University of Brescia and Computing Center CINECA (Bologna, Italy), awarded under the ISCRA initiative, are acknowledged for providing high-performance computing facilities.References
- G. Longhi, E. Castiglioni, J. Koshoubu, G. Mazzeo and S. Abbate, Chirality, 2016, 28, 696–707 CrossRef CAS PubMed.
- F. Zinna and L. Di Bari, Chirality, 2015, 27, 1–13 CrossRef CAS.
- E. M. Sánchez-Carnerero, A. R. Agarrabeitia, F. Moreno, B. L. Maroto, G. Muller, M. J. Ortiz and S. de la Moya, Chem. – Eur. J., 2015, 21, 13488–13500 CrossRef PubMed.
- H. Tanaka, Y. Inoue and T. Mori, ChemPhotoChem, 2018, 2, 386–402 CrossRef CAS.
- J. Kumar, T. Nakashima and T. Kawai, J. Phys. Chem. Lett., 2015, 6, 3445–3452 CrossRef CAS PubMed.
- C. A. Emeis and L. J. Oosterhoff, Chem. Phys. Lett., 1967, 1, 129–132 CrossRef CAS.
- H. Wynberg, E. W. Meijer, J. C. Hummelen, H. P. J. M. Dekkers, P. H. Schippers and A. D. Carlson, Nature, 1980, 286, 641–642 CrossRef CAS.
- I. Z. Steinberg and A. Gafni, Rev. Sci. Instrum., 1972, 43, 409–413 CrossRef CAS.
- E. Castiglioni, S. Abbate and G. Longhi, Appl. Spectrosc., 2010, 64, 1416–1419 CrossRef CAS PubMed.
- S. C. J. Meskers, E. Peeters, B. M. W. Langeveld-Voss and R. A. J. Janssen, Adv. Mater., 2000, 12, 589–594 CrossRef CAS.
- J. Park, T. Yu, T. Inagaki and K. Akagi, Macromolecules, 2015, 48, 1930–1940 CrossRef CAS.
- P. Reiné, A. M. Ortuño, S. Resa, L. Álvarez de Cienfuegos, V. Blanco, M. J. Ruedas-Rama, G. Mazzeo, S. Abbate, A. Lucotti, M. Tommasini, S. Guisán-Ceinos, M. Ribagorda, A. G. Campaña, A. Mota, G. Longhi, D. Miguel and J. M. Cuerva, Chem. Commun., 2018, 54, 13985–13988 RSC.
- H. Shang, Z. Ding, Y. Shen, B. Yang, M. Liu and S. Jiang, Chem. Sci., 2020, 11, 2169–2174 RSC.
- X.-F. Luo, H.-B. Han, Z.-P. Yan, Z.-G. Wu, J. Su, J.-W. Zou, Z.-Q. Zhu, Y.-X. Zheng and J.-L. Zuo, ACS Appl. Mater. Interfaces, 2020, 12, 23172–23180 CrossRef CAS PubMed.
- P. Sumsalee, L. Abella, T. Roisnel, S. Lebrequier, G. Pieters, J. Autschbach, J. Crassous and L. Favereau, J. Mater. Chem. C, 2021, 9, 11905–11914 RSC.
- C. Zhang, S. Li, X. Dong and S. Zang, Aggregate, 2021, 2, e48 CrossRef CAS.
- G. Mazzeo, A. Cimmino, M. Masi, G. Longhi, L. Maddau, M. Memo, A. Evidente and S. Abbate, J. Nat. Prod., 2017, 80, 2406–2415 CrossRef CAS PubMed.
- J. M. Batista Jr., E. W. Blanch and V. da S. Bolzani, Nat. Prod. Rep., 2015, 32, 1280–1302 RSC.
- E. Burgueño-Tapia and P. Joseph-Nathan, Nat. Prod. Commun., 2017, 12, 641–651 Search PubMed.
- P. L. Polavarapu and E. Santoro, Nat. Prod. Rep., 2020, 37, 1661–1699 RSC.
- G. Longhi, E. Castiglioni, S. Abbate, F. Lebon and D. A. Lightner, Chirality, 2013, 25, 589–599 CrossRef CAS PubMed.
- J. L. Hartwell, Lloydia, 1971, 34, 386–425 CAS.
- M. He, C. Qu, O. Gao, X. Hu and X. Hong, RSC Adv., 2015, 5, 16562–16574 RSC.
- O. Arrigoni, R. A. Liso and G. Calabrese, Nature, 1975, 256, 513–514 CrossRef CAS.
- O. Arrigoni, G. Calabrese, L. De Gara, M. B. Bitonti and R. Liso, J. Plant Physiol., 1997, 150, 302–308 CrossRef CAS.
- K. K. Schrader, A. Andolfi, C. L. Cantrell, A. Cimmino, S. O. Duke, W. Osbrink, D. E. Wedge and A. Evidente, Chem. Biodivers, 2010, 7, 2261–2280 CrossRef CAS PubMed.
- D. Lamoral-Theys, A. Andolfi, G. Van Goietsenoven, A. Cimmino, B. Le Calvé, N. Wauthoz, V. Mégalizzi, T. Gras, C. Bruyère, J. Dubois, V. Mathieu, A. Kornienko, R. Kiss and A. Evidente, J. Med. Chem., 2009, 52, 6244–6256 CrossRef CAS PubMed.
- D. Lamoral-Theys, C. Decaestecker, V. Mathieu, J. Dubois, A. Kornienko, R. Kiss, A. Evidente and L. Pottier, MRMC, 2010, 10, 41–50 CrossRef CAS.
- C. Li, C. Deng, G. Pan, X. Wang, K. Zhang, Z. Dong, G. Zhao, M. Tan, X. Hu, S. Shi, J. Du, H. Ji, X. Wang, L. Yang and H. Cui, J. Exp. Clin. Cancer Res., 2020, 39, 230 CrossRef CAS PubMed.
- F. Piozzi, C. Fuganti, R. Mondelli and G. Ceriotti, Tetrahedron, 1968, 24, 1119–1131 CrossRef CAS.
- G. Ceriotti, Nature, 1967, 213, 595–596 CrossRef CAS PubMed.
- F. Lefranc, S. Sauvage, G. Van Goietsenoven, V. Mégalizzi, D. Lamoral-Theys, O. Debeir, S. Spiegl-Kreinecker, W. Berger, V. Mathieu, C. Decaestecker and R. Kiss, Mol. Cancer Ther., 2009, 8, 1739–1750 CrossRef CAS PubMed.
- L. Ingrassia, F. Lefranc, J. Dewelle, L. Pottier, V. Mathieu, S. Spiegl-Kreinecker, S. Sauvage, M. El Yazidi, M. Dehoux, W. Berger, E. Van Quaquebeke and R. Kiss, J. Med. Chem., 2009, 52, 1100–1114 CrossRef CAS.
- G. Van Goietsenoven, V. Mathieu, F. Lefranc, A. Kornienko, A. Evidente and R. Kiss, Med. Res. Rev., 2013, 33, 439–455 CrossRef CAS PubMed.
- C. Lv, Y. Huang, R. Huang, Q. Wang, H. Zhang, J. Jin, D. Lu, Y. Zhou, Y. Shen, W. Zhang, X. Luan and S. Liu, Molecular Therapy – Oncolytics, 2022, 24, 340–354 CrossRef CAS PubMed.
- R. Gopalakrishnan, H. Matta, S. Choi and P. M. Chaudhary, Sci. Rep., 2020, 10, 5712 CrossRef CAS PubMed.
- T. Hudlicky, U. Rinner, D. Gonzalez, H. Akgun, S. Schilling, P. Siengalewicz, T. A. Martinot and G. R. Pettit, J. Org. Chem., 2002, 67, 8726–8743 CrossRef CAS PubMed.
- E. H. Southgate, D. R. Holycross and D. Sarlah, Angew. Chem., Int. Ed., 2017, 56, 15049–15052 CrossRef CAS PubMed.
- S. Borra, R. Lapinskaite, C. Kempthorne, D. Liscombe, J. McNulty and T. Hudlicky, J. Nat. Prod., 2018, 81, 1451–1459 CrossRef CAS PubMed.
- A. Evidente, I. Iasiello and G. Randazzo, Chem. Ind., 1984, 348–349 CAS.
- A. Evidente, Planta Med., 1991, 57, 293–295 CrossRef CAS PubMed.
- A. Mondon and K. Krohn, Tetrahedron Lett., 1972, 13, 2085–2088 CrossRef.
- G. R. Pettit, N. Melody, M. O’Sullivan, M. A. Thompson, D. L. Herald and B. Coates, J. Chem. Soc., Chem. Commun., 1994, 2725–2726 RSC.
- G. Mazzeo, S. Ghidinelli, R. Ruzziconi, M. Grandi, S. Abbate and G. Longhi, ChemPhotoChem, 2022, 6, e20210022 CrossRef.
- Y. Shindo and M. Nakagawa, Appl. Spectrosc., 1985, 39, 32–38 CrossRef CAS.
- H. P. J. M. Dekkers, P. F. Moraal, J. M. Timper and J. P. Riehl, Appl. Spectrosc., 1985, 39, 818–821 CrossRef CAS.
- P. M. L. Blok and H. P. J. M. Dekkers, Appl. Spectrosc., 1990, 44, 305–309 CrossRef CAS.
- P. Pracht, F. Bohle and S. Grimme, Phys. Chem. Chem. Phys., 2020, 22, 7169–7192 RSC.
- C. Bannwarth, S. Ehlert and S. Grimme, J. Chem. Theory Comput., 2019, 15, 1652–1671 CrossRef CAS PubMed.
- M. J. Frisch, G. W. Trucks, H. B. Schlegel, G. E. Scuseria, M. A. Robb, J. R. Cheeseman, G. Scalmani, V. Barone, G. A. Petersson, H. Nakatsuji, X. Li, M. Caricato, A. V. Marenich, J. Bloino, B. G. Janesko, R. Gomperts, B. Mennucci, H. P. Hratchian, J. V. Ortiz, A. F. Izmaylov, J. L. Sonnenberg, D. Williams, F. Ding, F. Lipparini, F. Egidi, J. Goings, B. Peng, A. Petrone, T. Henderson, D. Ranasinghe, V. G. Zakrzewski, J. Gao, N. Rega, G. Zheng, W. Liang, M. Hada, M. Ehara, K. Toyota, R. Fukuda, J. Hasegawa, M. Ishida, T. Nakajima, Y. Honda, O. Kitao, H. Nakai, T. Vreven, K. Throssell, J. A. Montgomery Jr., J. E. Peralta, F. Ogliaro, M. J. Bearpark, J. J. Heyd, E. N. Brothers, K. N. Kudin, V. N. Staroverov, T. A. Keith, R. Kobayashi, J. Normand, K. Raghavachari, A. P. Rendell, J. C. Burant, S. S. Iyengar, J. Tomasi, M. Cossi, J. M. Millam, M. Klene, C. Adamo, R. Cammi, J. W. Ochterski, R. L. Martin, K. Morokuma, O. Farkas, J. B. Foresman and D. J. Fox, Gaussian 16, Rev. C.01, 2016 Search PubMed.
- B. Mennucci, Wiley Interdiscip. Rev.: Comput. Mol. Sci., 2012, 2, 386–404 CAS.
- A. Evidente, M. Rosaria Cicala, I. Giudicianni, G. Randazzo and R. Riccio, Phytochemistry, 1983, 22, 581–584 CrossRef CAS.
- S. Abbate, G. Longhi, F. Lebon, E. Castiglioni, S. Superchi, L. Pisani, F. Fontana, F. Torricelli, T. Caronna, C. Villani, R. Sabia, M. Tommasini, A. Lucotti, D. Mendola, A. Mele and D. A. Lightner, J. Phys. Chem. C, 2014, 118, 1682–1695 CrossRef CAS.
- W. Kuhn, Z. Phys. Chem., 1929, 4B, 14–36 CrossRef.
- W. Kuhn, Annu. Rev. Phys. Chem., 1958, 9, 417–438 CrossRef CAS.
- E. Castiglioni, S. Abbate, F. Lebon and G. Longhi, Chirality, 2012, 24, 725–730 CrossRef CAS PubMed.
- S. K. Behera, S. Y. Park and J. Gierschner, Angew. Chem., Int. Ed., 2021, 60, 22624–22638 CrossRef CAS PubMed.
- Y. Zhang, H. Yang, H. Ma, G. Bian, Q. Zang, J. Sun, C. Zhang, Z. An and W. Wong, Angew. Chem., Int. Ed., 2019, 58, 8773–8778 CrossRef CAS PubMed.
- K. Keshav, M. K. Kumawat, R. Srivastava and M. Ravikanth, Mater. Chem. Front., 2017, 1, 1207–1216 RSC.
- P. Zhou and K. Han, Aggregate, 2022, 3, e160 CrossRef CAS.
- H. J. Cho, D. Y. Jeong, H. Moon, T. Kim, Y. K. Chung, Y. Lee, Z. Lee, J. Huh, Y. You and C. Song, Aggregate, 2022, 3, e168 CrossRef CAS.
- P. Zhou and K. Han, Acc. Chem. Res., 2018, 51, 1681–1690 CrossRef CAS PubMed.
- P. Zhou, M. R. Hoffmann, K. Han and G. He, J. Phys. Chem. B, 2015, 119, 2125–2131 CrossRef CAS PubMed.
- A. Weller, Naturwissenschaften, 1955, 42, 175–176 CrossRef CAS.
- H. C. Joshi and L. Antonov, Molecules, 2021, 26, 1475 CrossRef CAS PubMed.
- X. Han, X. Meng, X. Wang, S. Leng, Q. Liu, L. Zhang, P. Li, Q. Zhang and H.-Y. Hu, Anal. Chem., 2023, 95, 7715–7722 CrossRef CAS PubMed.
- C.-H. Wang, Z.-Y. Liu, C.-H. Huang, C.-T. Chen, F.-Y. Meng, Y.-C. Liao, Y.-H. Liu, C.-C. Chang, E. Y. Li and P.-T. Chou, J. Am. Chem. Soc., 2021, 143, 12715–12724 CrossRef CAS PubMed.
- H. Gu, W. Wang, W. Wu, M. Wang, Y. Liu, Y. Jiao, F. Wang, F. Wang and X. Chen, Chem. Commun., 2023, 59, 2056–2071 RSC.
- K. M. Solntsev, E.-A. Bartolo, G. Pan, G. Muller, S. Bommireddy, D. Huppert and L. M. Tolbert, Isr. J. Chem., 2009, 49, 227–233 CrossRef CAS PubMed.
- L. Guo, M. Tian, Z. Zhang, Q. Lu, Z. Liu, G. Niu and X. Yu, J. Am. Chem. Soc., 2021, 143, 3169–3179 CrossRef CAS PubMed.
- R. Chen, Q. Li, K. Xu, J. Ma, X. Mu, T. Wang, L. Cao and B. Teng, J. Photochem. Photobiol., A, 2023, 437, 114437 CrossRef CAS.
- X. Bi, B. Liu, L. McDonald and Y. Pang, J. Phys. Chem. B, 2017, 121, 4981–4986 CrossRef CAS PubMed.
- P. Leiderman, R. Gepshtein, A. Uritski, L. Genosar and D. Huppert, J. Phys. Chem. A, 2006, 110, 9039–9050 CrossRef CAS PubMed.
- G. Ceriotti, L. Spandrio and A. Gazzaniga, Tumori, 1967, 53, 359–371 CrossRef CAS PubMed.
- A. Immirzi and C. Fuganti, J. Chem. Soc., Chem. Commun., 1972, 240a RSC.
- D. Cremer and J. A. Pople, J. Am. Chem. Soc., 1975, 97, 1354–1358 CrossRef CAS.
- A. Baiardi, J. Bloino and V. Barone, J. Chem. Theory Comput., 2017, 13, 2804–2822 CrossRef CAS PubMed.
- M. Coehlo, G. Clavier and G. Pieters, Adv. Opt. Mater., 2022, 10, 2101774 CrossRef CAS.
- D. Göbel, S. Míguez-Lago, M. J. Ruedas-Rama, A. Orte, A. G. Campaña and M. Juríček, Helv. Chim. Acta, 2022, 105, e202100221 CrossRef.
Footnote |
| † Electronic supplementary information (ESI) available: Additional spectra of narciclasine derivatives; DFT parameters of lycorine, neutral and anionic narciclasine, narciclasine derivatives and template molecules; deprotonation scheme of narciclasine derivatives; simulated ECD spectra of narciclasine most populated conformers; experimental and simulated spectra of lycorine; simulated spectra of anionic narciclasine; and computed molecular geometries in XYZ format. See DOI: https://doi.org/10.1039/d3cp02600k |
| This journal is © the Owner Societies 2023 |

