
 Open Access Article
 This Open Access Article is licensed under a Creative Commons Attribution-Non Commercial 3.0 Unported Licence
How complex–surface interactions modulate the spin transition of Fe(II) SCO complexes supported on metallic surfaces?
Rocío
Sánchez-de-Armas
 *,
Iman
Jaber El lala
and
Carmen J.
Calzado
*,
Iman
Jaber El lala
and
Carmen J.
Calzado
Departamento de Química Física, Universidad de Sevilla, C. Prof. García González, s/n, 41012, Spain. E-mail: rociosa@us.es
First published on 31st July 2023
Abstract
The deposition of a prototypical spin-crossover [Fe(phen)2(NCS)2] complex on Au(111), Cu(111) and Ag(111) surfaces has been investigated by means of periodic DFT+U calculations, with the aim of understanding how different metallic surfaces affect the spin state switching. Our results show that adsorption is metal- and spin-dependent, with different preferred adsorption sites for the different surfaces and spin states. For the three considered surfaces adsorption energies are larger in the LS state than in the HS one, which increases the transition enthalpy by 58.7 kJ mol−1 for Cu(111), 14.6 kJ mol−1 for Au(111) and 9.6 kJ mol−1 for Ag(111) with respect to the free molecule. There is a clear correlation between this effect and the extent of the complex–surface interaction, which can be established from adsorption energies, surface–complex distances and charge density difference plots as: Cu(111) > Au(111) > Ag(111). Therefore, a stronger interaction with the surface produces a larger energy difference between two spin states, making the spin transition less probable to occur. Finally, our calculations show that it would be possible to probe the spin-state of the deposited molecules from the STM images, in line with the recent experimental results.
1. Introduction
Spin-crossover (SCO) complexes are bistable compounds containing transition metals (mostly FeII) with two spin states (low spin, LS and high spin, HS) that can be manipulated by an external stimulus such as temperature, light, pressure or an electric or magnetic field. This spin-state switching involves changes in the optical, mechanical, electrical and/or magnetic properties of the complexes, which makes them promising components for molecular electronics and spintronics.1–4Technological applications require the immobilization of the complexes on a substrate, which can strongly modify the SCO process, leading to a change in the transition temperature, the coexistence of the two spin states at low temperature or even resulting in the complete suppression of the SCO behavior.4–8 For this reason, it is important to understand the influence of the surface on the thermal SCO process, through the evaluation of the deposition of complexes on surfaces and the analysis of the magnetic properties of the systems after adsorption.
Theoretical methods can be extremely useful to provide detailed information at a single molecule level, providing preferred adsorption positions and geometries, adsorption energies, electronic structures, and the energy gap between the two states after deposition. In this context, we have previously analyzed at the molecular level, by means of periodic DFT calculations, the deposition of the SCO complexes FeII((3,5-(CH3)2Pz)3BH)2 and [Fe(tzpy)2(NCS)2] on gold surfaces.9–11 Our results show that the interaction of both complexes with the surface is spin-dependent, being stronger in the low spin state than in the high spin (HS) state. As a consequence, there is an increase of the HS–LS energy difference, due to a relative stabilization of the low-spin state (LS), making the spin transition less probable to occur. Additionally, we have found similar trends for the SCO [Fe(H2Bpz2)2(bipy)] and [Fe(H2Bpz2)2(phen)] complexes encapsulated in single-walled carbon nanotubes, with phen = 1,10-phenanthroline, bipy = 2,2′-bipyridine and H2Bpz2 = dihydrobis(pyrazolyl).12,13
In this study, we want to extend our work with the aim of understanding the interaction of SCO complexes with different metallic surfaces, such as Au, Cu and Ag surfaces, and how this interaction affects the SCO process. To this end, we have chosen the prototypical [Fe(phen)2(NCS)2] complex and analyzed its deposition on Au(111), Cu(111) and Ag(111) surfaces. In this complex, the Fe(II) metal center is coordinated with two phenanthroline groups (phen) and two thiocyanate groups (NCS) (Fig. 1, left).14–17 It exhibits a spin transition from a low-spin diamagnetic state (LS, S = 0) to a high-spin paramagnetic one (HS, S = 2) (Fig. 1, right), with a critical temperature of ≈175 K in the bulk state,14,18 and it has been the first vacuum-sublimable SCO complex studied on a surface.19 STM images after the deposition of the complex on Cu(100),6,7 Cu(111) and Au(111)20 have shown the coexistence of both spin states at 4.2 K, without switching between the two states under any tunneling conditions. As a consequence, a loss of SCO behavior after deposition on metallic surfaces has been deduced and attributed to strong coupling with the surface. It is possible to reduce such a strong interaction and preserve the SCO behavior by the addition of a CuN layer between the Cu(100) surface and the complex,6 reinforcing this fact the idea that the preservation of the spin transition after deposition depends on the nature and magnitude of the complex–surface interaction. This idea is also supported by a couple of theoretical works,21,22 which have shown an increase of the energy between the two spin states after deposition on different metallic surfaces. The insertion of a CuN monolayer on the Cu(100) surface reduces the adsorption energy of both LS and HS configurations as well as the HS–LS energy gap.21
 | ||
| Fig. 1 Optimized geometry of the isolated [Fe(phen)2(NCS)2] complex (left) and the diagram of octahedral ligand-field splitting of the 3d orbitals into eg and t2g in a FeII-based SCO complex showing their occupation in the LS and HS states (right). Gray, blue, red, yellow and white spheres represent C, N, Fe, S and H respectively. | ||
Experimental results indicate that, once deposited on metallic surfaces, the spin state of the [Fe(phen)2(NCS)2] complex is dictated by the adsorption geometry.6–8,20,23 Experimental results for deposition on Cu(100) suggest different adsorption sites in both spin states, with Fe placed on a hollow site for HS and Fe positioned on a bridge site for LS.7 This suggests that switching the spin state of the complex adsorbed on Cu(100) would require enough energy to also modify the adsorption site. Unfortunately, it is not easy to experimentally determine the adsorption positions of the S atoms, as they are hidden by phenanthroline groups in STM images.7 In this sense, theoretical methods can be extremely useful to provide detailed information about preferred adsorption positions and adsorption energies, which are important issues to understand the mechanism of the loss of SCO behavior after deposition. Nevertheless, there are only a couple of theoretical works dealing with the deposition of [Fe(phen)2(NCS)2] on metallic surfaces21,22 and none of them provide precise information about the adsorption process. This motivates us to perform a detailed study of the adsorption of the [Fe(phen)2(NCS)2] complex on Au(111), Cu(111) and Ag(111) metallic surfaces.
Using periodic DFT calculations, we have first analyzed the isolated [Fe(phen)2(NCS)2] complex and evaluated the energy difference between the HS and LS states. After this, we have performed a detailed study of the adsorption of the molecule on Au(111), Cu(111) and Ag(111) metallic surfaces, finding different preferred adsorption sites for different surfaces and spin states. After deposition, the HS–LS energy difference and transition enthalpy are enhanced, as a consequence of the relative stabilization of the LS state, for all the studied surfaces. We found a clear correlation between the transition enthalpy and the extent of the molecule–surface interaction. The stronger interaction with the surface produces a larger enthalpy difference between the two spin states, making the spin transition less probable to occur. Finally, our calculations show that it would be possible to distinguish molecules with different spin states from STM images, in line with recent experimental results.
2. Computational details
The adsorption of a single molecule on the Au(111), Cu(111) and Ag(111) surfaces was studied by means of periodic DFT calculations using the VASP (Vienna ab initio simulation package) code24–27 employing the generalized gradient approximation (GGA) with the Perdew–Burke–Ernzerhof (PBE) exchange–correlation functional28 and projector-augmented wave (PAW) potentials.29,30 An effective Hubbard term (Ueff) of 1.7 eV is used to describe the localized 3d orbitals of Fe using Dudarev's approach.31 The DFT+U method is considered as a practical alternative to computationally prohibitive hybrid methods (such as the TPSSh functional) when plane-wave basis sets are used, and it has been proven to provide a good LS–HS balance for SCO complexes containing Fe(II) and Fe(III).21,22,32–35 The Ueff value has been chosen after a careful exploration, as the value that better reproduces the experimental transition enthalpy for the isolated complex, although our computational approximations do not take into account the intermolecular interactions present in the crystal which can produce deviations in the results. The used value, 1.7 eV, is consistent with Ueff values employed in previous calculations for the same SCO complex, which ranges between 1.2 eV33 and 2.5 eV.32 Small modifications in the Ueff value in a reasonable interval of values around the chosen one would not produce drastic changes in the obtained results, and the conclusions of the work would remain unaltered. Valence electrons are described using a plane-wave basis set with a cut-off of 500 eV and the Γ-point of the Brillouin zone is used.36The optimized lattice parameters for the bulk are a = b = c =2.94 Å for Au, a = b = c =2.93 Å for Ag and a = b = c =2.60 Å for Cu. These calculated values are used for the (111) surfaces of the metals throughout the present work and maintained fixed during the atomic position relaxation. The Au(111) and Ag(111) surfaces are represented by a three layer slab made of 6 × 6 unit cells (17.630 × 17.630 Å for Au and 17.578 × 17.578 Å for Ag). As the Cu bulk has a smaller lattice parameter, and to avoid interactions between molecules, a bigger supercell has been used to model the Cu(111) surface, containing three layers and 8 × 8 unit cells (20.546 × 20.546 Å).37 For all models, a vacuum of 27 Å is added in the z direction to avoid the interaction between the slabs. The atoms of the two lowest layers are kept fixed at bulk optimized positions, while the atoms of the upper layer are relaxed. Electronic relaxation is performed until the change in the total energy between two consecutive steps is smaller than 10−6 eV and the ionic relaxation is performed until the Hellmann–Feynman forces are lower than 0.025 eV Å−1. van der Waals interactions are taken into account through the Tkatchenko–Scheffler method.38
We have explored several adsorption sites for the [Fe(phen)2(NCS)2] complex on Au(111), Cu(111) and Ag(111) selecting sensible starting geometries for geometry optimizations inspired by previous experimental and theoretical published data.6,7,20–23 For each adsorption position, we have optimized two different magnetic solutions, with S = 0 (LS) and S = 2 (HS). The adsorption energies, Eads, are calculated as Eads = Eadsorbed_molecule − (Eslab + Emolecule). The energies of the slab (Eslab) and the free molecule (Emolecule) are obtained after a geometry optimization calculation using the same supercell as the adsorbed molecule, in order to minimize numerical errors. Thus, negative adsorption energies represent bound states.
To compare with the experimental data, transition enthalpies were also evaluated. The enthalpy variation associated with the SCO can be separated in different contributions:
| ΔH(T) = ΔEelec + ΔZPE + ΔHvib + ΔHrot + ΔHtrans |
Within the harmonic approximation, the ΔZPE can be evaluated as one-half of the sum of the vibrational frequency shifts upon the spin transition:

The translational and rotational contributions to the transition enthalpy can be neglected and consider only the dominant vibrational and electronic parts. The vibrational thermal contribution to the total enthalpy is computed at 175 K (experimental transition temperature)14,18 as follows:39

Because of the large computational cost of frequency calculations, we have calculated transition enthalpies only for the isolated molecule and the most stable configurations of the adsorbed molecule on each metallic surface.
Finally, the STM simulations with a bias voltage of were carried out using the Tersoff–Hamann approximation40 and constant-current STM images were finally visualized in the p4vasp program. Charge density isosurfaces at 0.005 e Bohr−3 were represented using the VESTA code.41
3. Results
We have first optimized the isolated [Fe(phen)2(NCS)2] complex in both spin states. Some selected parameters for the optimized geometries are given in Table 1, together with the available experimental parameters from the X-ray data.42 For comparison, we have also included the data for the molecules optimized at the TPSSh/def2-SVP level using the Gaussian 09 code (without periodic conditions). This is a hybrid meta-GGA XC functional (10% Fock exchange), which has been shown to give geometrical parameters and transition enthalpy in very good agreement with experimental values on benchmark calculations for at least thirty different Fe(II) and Fe(III) SCO complexes.43–46| Distance (Å)/angle (deg) | Fe–Nphen | Fe–Nphen(2) | Fe–N (CS) | S–S | S–Fe–S | N–Fe–N | ||
|---|---|---|---|---|---|---|---|---|
| LS | Free complex | Exp (130 K) | 2.01 | 2.01 | 1.96 | 6.77 | 92.1 | 90.6 |
| LSfree (TPSSh) | 2.00 | 2.00 | 1.91 | 6.89 | 93.7 | 92.9 | ||
| LSfree (PBE+U+TS) | 1.97 | 1.96 | 1.92 | 7.15 | 99.5 | 92.0 | ||
| Adsorbed complex | Au(111) – bridge | 1.98 | 1.96 | 1.94 | 8.19 | 128.3 | 99.8 | |
| Cu(111) – hcp | 1.98 | 1.97 | 1.91 | 8.22 | 124.5 | 100.1 | ||
| Ag(111) – fcc | 1.97 | 1.96 | 1.93 | 8.43 | 132.9 | 99.0 | ||
| HS | Free complex | Exp (293 K) | 2.20 | 2.21 | 2.06 | 7.22 | 97.2 | 94.9 |
| HSfree (TPSSh) | 2.21 | 2.29 | 2.00 | 8.13 | 115.9 | 107.7 | ||
| HSfree (PBE+U+TS) | 2.21 | 2.27 | 1.99 | 7.39 | 101.9 | 100.2 | ||
| Adsorbed complex | Au(111) – hcp | 2.12 | 2.23 | 2.03 | 8.56 | 135.8 | 108.9 | |
| Cu(111) – fcc | 2.17 | 2.20 | 2.04 | 8.69 | 130.4 | 110.3 | ||
| Ag(111) – hcp | 2.19 | 2.24 | 2.04 | 8.79 | 145.1 | 107.6 | ||
Both theoretical approaches give distances and angles in very good agreement with experimental data. As expected, the LS to HS transition involves an important enlargement of the Fe–N(phen) and Fe–N(CS) distances (about 0.20 and 0.10 Å, respectively) as well as an increase of the N–Fe–N angles.
The HS–LS energy difference evaluated at the TPSSh/def2-SVP level is 21.5 kJ mol−1 (Table 2), about 2.5 times larger than the experimental enthalpy of the bulk structure (ΔHHL = 8.6 kJ mol−1). After including the zero-point correction, the HS–LS energy difference is decreased by 9.9 kJ mol−1, resulting in 11.6 kJ mol−1. This result is in line with previous theoretical works where the zero-point correction was found to favor the HS state by 9 kJ mol−1 in average.11,46
| Method | ΔEHS–LS (kJ mol−1) |
|---|---|
| TPSSh/def2-SVP | 21.5 |
| TPSSh/def2-SVP + ZPC | 11.6 |
| PBE + U + TS | 20.1 |
| PBE + U + TS + ZPC | 10.6 |
| ΔHHL exp47 | 8.6 |
Unfortunately, the use of hybrid functionals leads to prohibitive calculations when considering the deposition on the surface, and alternative strategies need to be employed. The HS–LS energy difference calculated with the PBE + U + TS functional and periodic conditions is 20.1 kJ mol−1, and this value is decreased to 10.6 kJ mol−1 after including the zero-point correction, in excellent agreement with the TPSSh/def2-SVP result. These results validate the PBE + U + TS method, with Ueff = 1.7 eV, as a good option to study the SCO behavior after deposition. It is worth noting that any of our computational approximations take into account the intermolecular interactions present in the crystal and this can produce deviations in the results. Finally, including the vibrational thermal contribution to the total enthalpy, we have a value of 14.5 kJ mol−1 for the transition enthalpy, in very good agreement with the experimental value.
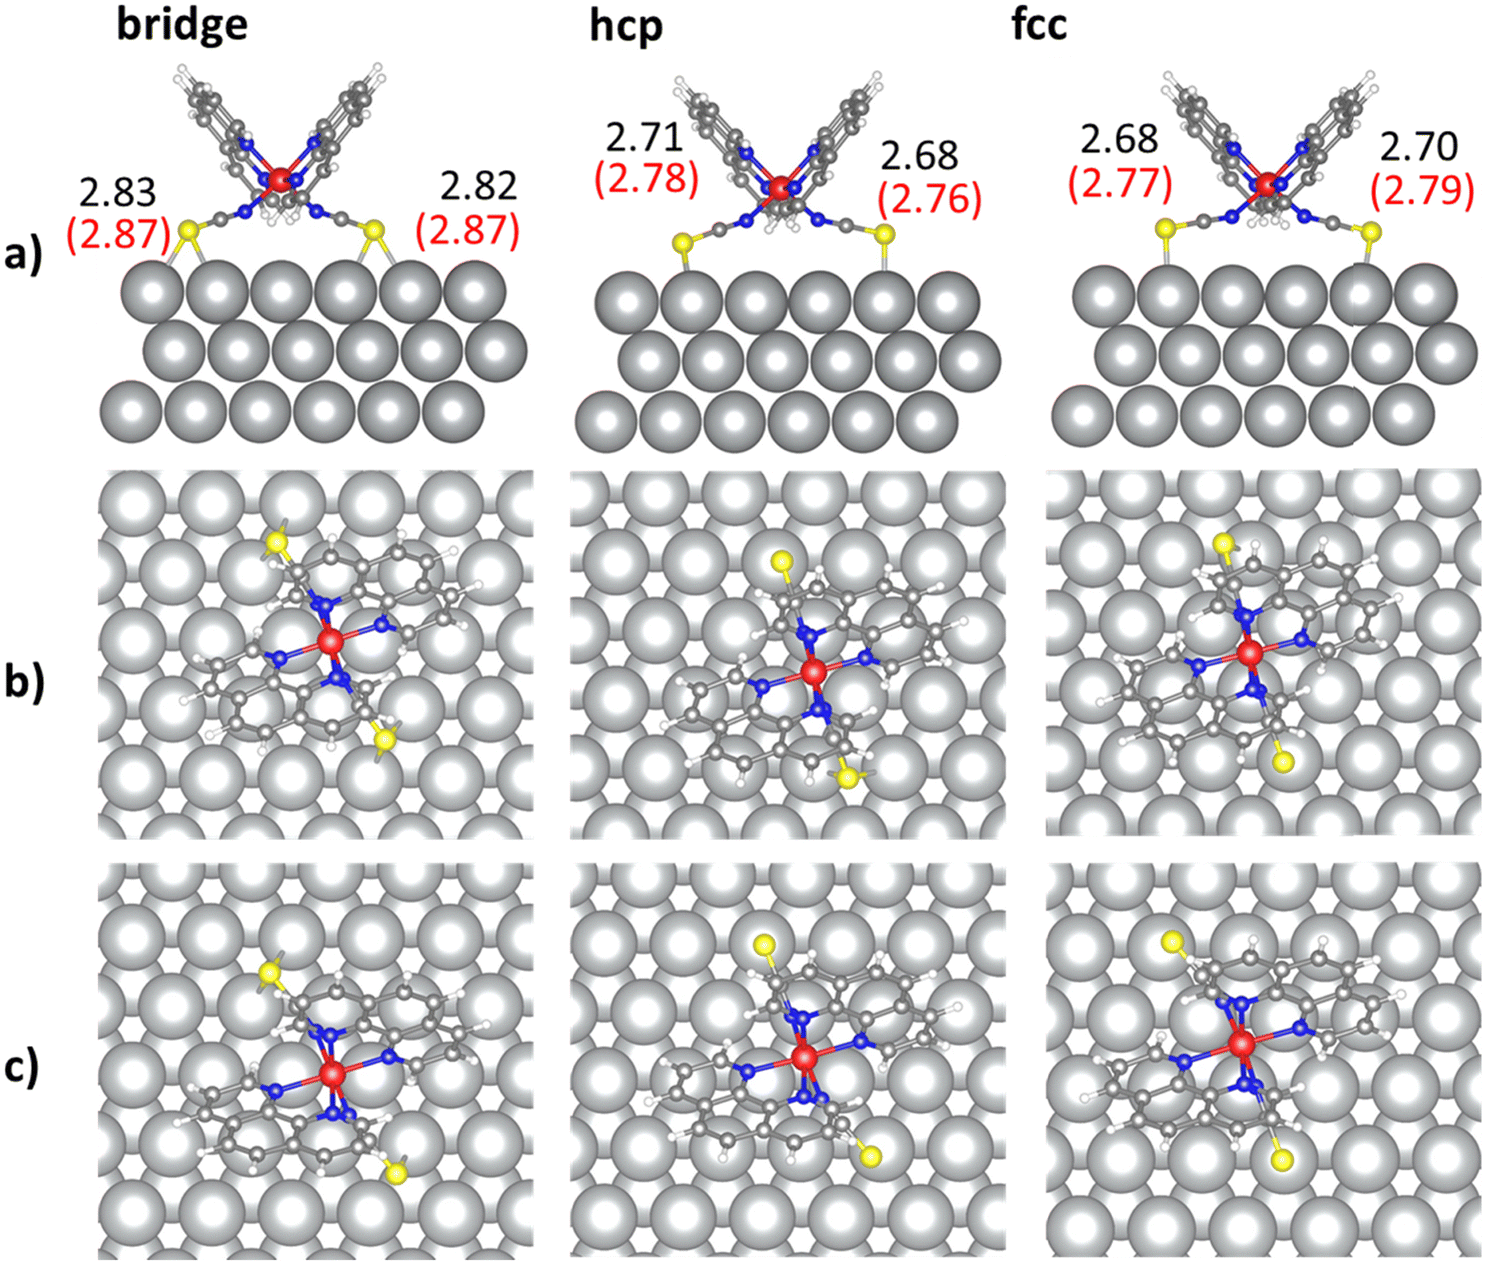
To perform the deep analysis of the adsorption of the [Fe(phen)2(NCS)2] complex on Au(111), Cu(111) and Ag(111) metallic surfaces, geometry optimizations starting from three different adsorption sites on each surface have been run. Starting geometries have been built inspired by the available experimental data,6–8,20,23 all of them with the two NCS groups pointing the substrate, and with the Fe atom placed on a bridge, hollow-hcp and hollow-fcc sites, respectively. Optimized geometries of the complex on Au(111) are shown in Fig. 2 and the shortest S–Au distances for each adsorption site are indicated. We have considered the same three adsorption sites on Cu(111) (Fig. 3) and Ag(111) (Fig. 4). Some selected geometrical parameters for the complex adsorbed on Au(111), Cu(111) and Ag(111) in the most favorable adsorption site are shown in Table 1. In general, the adsorption of the molecule on the three surfaces almost does not affect the Fe–N distances (changes are smaller than 0.1 Å). Nevertheless, S–S distances and S–Fe–S and N–Fe–N angles undergo significant changes, as NCS groups accommodate to bound the surface metal atoms.
 | ||
| Fig. 2 Optimized geometries of [Fe(phen)2(NCS)2] on Au(111). For each considered adsorption site, views along the a axis (a) and along the c axis (b) and (c) are shown. In the view along the a axis (a), LS structures are shown and the shortest S–Au distances in Å in the LS (black) and HS (red) states are indicated. For the view along the c axis, LS (b) and HS structures (c) are included. Ochre, gray, blue, red, yellow and white spheres represent Au, C, N, Fe, S, and H, respectively. | ||
 | ||
| Fig. 3 Optimized geometries of [Fe(phen)2(NCS)2] on Cu(111). For each considered adsorption site, views along the a axis (a) and along the c axis (b) and (c) are shown. In the view along the a axis (a), LS structures are shown and the shortest S–Au distances in Å in the LS (black) and HS (red) states are indicated. For the view along the c axis, LS (b) and HS structures (c) are included. Orange, gray, blue, red, yellow and white spheres represent Cu, C, N, Fe, S, and H, respectively. | ||
 | ||
| Fig. 4 Optimized geometries of [Fe(phen)2(NCS)2] on Ag(111). For each considered adsorption site considered, views along the a axis (a) and along the c axis (b) and (c) are shown. In the view along the a axis (a), LS structures are shown and the shortest S–Au distances in Å in the LS (black) and HS (red) states are indicated. For the view along the c axis, LS (b) and HS structures (c) are included. Silver, gray, blue, red, yellow and white spheres represent Ag, C, N, Fe, S, and H, respectively. | ||
Calculated adsorption energies are shown in Table 3, with negative values for all the structures, indicating that adsorption is favored in all the explored adsorption sites. Slight differences in the preferred adsorption sites are found depending on the metal surfaces and the spin states. On Au(111), the most stable sites are bridged for LS and hcp for HS. However, the relative stability of these two adsorption sites is very similar in both states. In fact, the three geometry optimization calculations on Au(111) result in very similar structures, and all of them with S atoms are placed on top of a gold atom and with almost identical S–Au distances, differing only in the relative position of the Fe center with respect to the surface. These similarities between structures also explain the similarities between adsorption energies. Table 3 also shows the probability distribution of each structure, calculated at 130 K and 293 K in LS and HS states, respectively. At room temperature, the bridge and hcp are almost equally probable, while at low temperatures, the bridge position dominates.
|
|
Relative energy (kJ mol−1) | Adsorption energy (kJ mol−1) | |||
|---|---|---|---|---|---|
| LS | HS | LS | HS | ||
| Au(111) | Bridge | 0.00 (70.5%) | 39.36 (35.8%) | −254.43 | −235.18 |
| hcp | 1.47 (18.1%) | 38.77 (46.2%) | −252.96 | −235.77 | |
| fcc | 1.97 (11.4%) | 41.07 (18.0%) | −252.46 | −233.48 | |
| Cu(111) | Bridge | 37.29 (0%) | 84.26 (18.7%) | −367.64 | −340.78 |
| hcp | 0.00 (100%) | 84.60 (16.2%) | −404.93 | −340.44 | |
| Fcc | 37.06 (0%) | 81.22 (65.1%) | −367.87 | −343.83 | |
| Ag(111) | Bridge | 14.87 (0%) | 48.99 (0%) | −218.81 | −204.82 |
| hcp | 6.13 (0.4%) | 30.48 (51.0%) | −227.55 | −223.31 | |
| Fcc | 0.00 (99.6%) | 30.58 (49.0%) | −233.68 | −223.22 | |

In the case of the deposition on Ag(111), we find more differences between the three optimized structures and their adsorption energies, in particular in the LS state, where the fcc site clearly dominates. In the HS state, fcc and hcp sites are almost degenerated, with very similar populations at room temperature, and well separated to the bridge one. In these two sites, the S atoms are placed on the top of an Ag atom, with similar S–Ag distances. However, for the bridge structures, S atoms are linked to two Ag atoms of the surface. As a consequence, S–Ag distances are longer for the bridge structure, resulting ∼15 kJ mol−1 (∼ 18 kJ mol−1) less stable than the fcc LS (HS) one.
The adsorption on Cu(111) is most favorable at hcp in the LS state and fcc in the HS state. Again, we found structures with quite similar relative stability, and consequently, molecules will occupy different adsorption sites on the surface, especially at room temperature. Based on these results, we could conclude that the adsorption position will not be determined by the Fe position (relative to the surface) but for the position of the S atoms relative to metallic ones.
The analysis of adsorption energies in Table 3 gives an idea of the strength of the molecule–surface interaction depending on the nature of the substrate, following the order Cu(111) > Au(111) > Ag(111). The strongest interaction of the complex with Cu(111) involves the shortest distances between the molecule and the surface (S–Cu distances of 2.32–2.38 Å). For Au(111) and Ag(111), the S–metal distances increase as the adsorption energy decreases, which are 2.59–2.61 Å for Au(111) and 2.68–2.83 Å for Ag(111).
To gain a deeper insight into the molecule–surface interaction, the charge density difference between the adsorbed complex, the slab and the free complex, ρ(AB)–ρ(A)–ρ(B), are plotted in Fig. 5. Yellow and cyan colors correspond to the accumulation and loss of electron charge density upon adsorption, respectively. We can see how the charge density redistribution after adsorption involves more contributions from the surface as we move from left to right figures (Ag < Au < Cu). Changes in the charge density are most pronounced in the case of adsorption on Cu(111), as the interaction energies and S–Cu distances are also indicating a stronger bond.
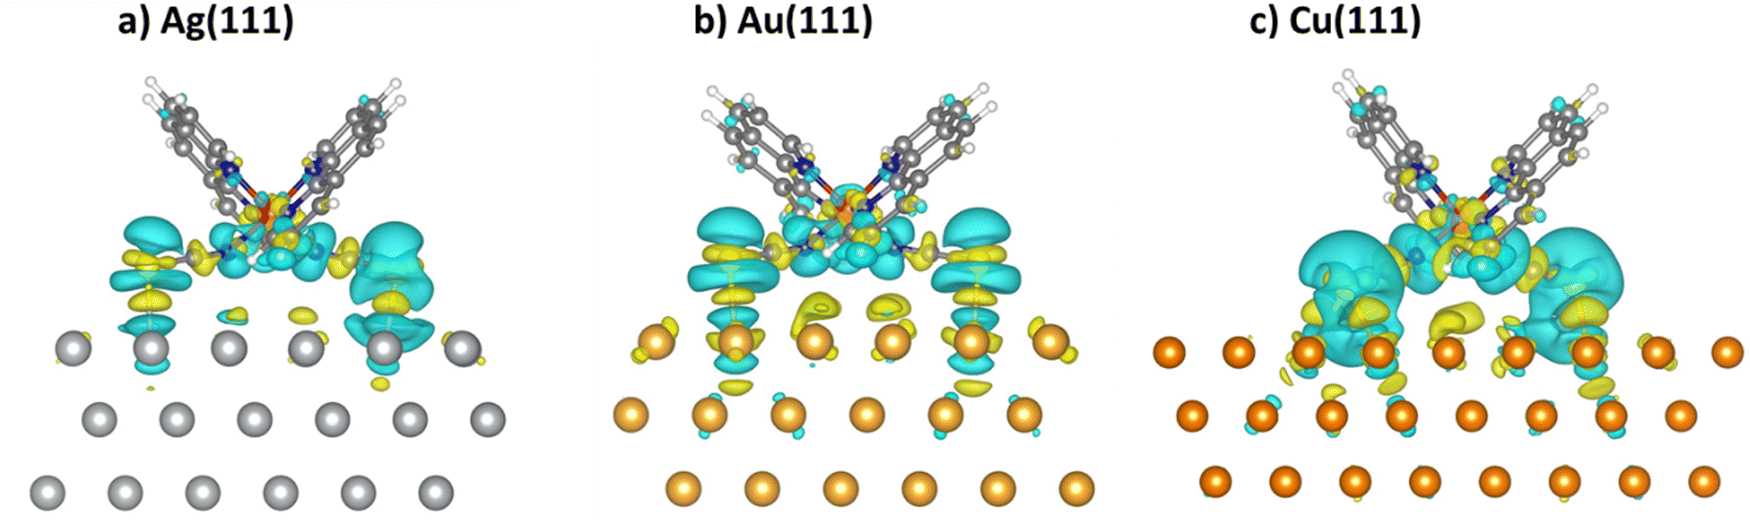 | ||
| Fig. 5 Charge density difference plots of the [Fe(phen)2(NCS)2] complex deposited on Ag(111) (a), Au(111) (b) and Cu(111) (c), in the most favorable adsorption site, with an isodensity value of 10−3 e Bohr−3. Yellow (positive difference) and cyan (negative difference) surfaces represent the charge accumulation and loss of electron charge density upon adsorption, respectively. | ||
Adsorption energies are also spin-dependent, which is between 10.4 and 61.1 kJ mol−1 larger in the LS state than in the HS state. This larger stabilization of the LS state (relative to the HS state) produces an increase of the energy difference between the two spin states with respect to the free molecule, which was 20.1 kJ mol−1 at the same level of theory. Interestingly, the increase on the HS–LS energy difference correlates with the strength of the molecule–surface interaction, leading to energy gaps of 81.22 kJ mol−1 on Cu(111), 38.77 kJ mol−1 on Au(111) and 30.48 kJ mol−1 on Ag(111). The calculated transition enthalpy, which takes into account the zero-point correction and the vibrational thermal contributions, follows the same trend, as shown in Table 4, with values of 73.2 kJ mol−1, 33.6 kJ mol−1 and 24.1 kJ mol−1 for the complex adsorbed on Cu(111), Au(111) and Ag(111), respectively. These values are significantly larger than those obtained for the isolated molecule.
| System | ΔHHL (kJ mol−1) |
|---|---|
| Free complex | 14.5 |
| Complex on Ag (111) | 24.1 |
| Complex on Au(111) | 33.6 |
| Complex on Cu(111) | 73.2 |
Then, the adsorption of the complex on metallic surfaces involves a significant increase of the enthalpy difference between the two spin states which is larger as the complex–surface interaction increases. It is worth noting that this correlation between the HS–LS energy gap and the extent of the complex–surface interaction has not been found in previous theoretical works dealing with the same kind of metallic surfaces.22
From our calculated adsorption energies and transition enthalpies, we can conclude that the deposition of [Fe(phen)2(NCS)2] on Cu(111) and Au(111) entails an increase of the HS–LS energy difference which will be responsible for the SCO suppression reported experimentally. However, the complex–surface interaction becomes significantly weaker in the case of Ag(111), leading to a smaller gap between the HS and LS states upon adsorption. As a consequence, we cannot exclude the preservation of the SCO properties after adsorption on Ag(111). Unfortunately, there are no experiments of [Fe(phen)2(NCS)2] supported on Ag surfaces, so our results remain a theoretical prediction.
Additional insight can be obtained from the comparison of the projected density of states (pDOS) of the LS and HS complexes, isolated and adsorbed on the different substrates as shown in Fig. 6. In all structures, the highest occupied band has contribution from Fe 3d states and thiocyanate groups, while the lowest unoccupied band is mainly formed by phenanthroline ligands with some small contributions from the Fe ion. The adsorption process produces the stabilization of the highest occupied band as a result of the interaction of the NCS groups with the surface. The stabilization is larger when the complex is adsorbed on Cu(111), in line with a larger complex–surface interaction. Lowest unoccupied bands are less affected by deposition, appearing almost at the same energy for the free molecule.
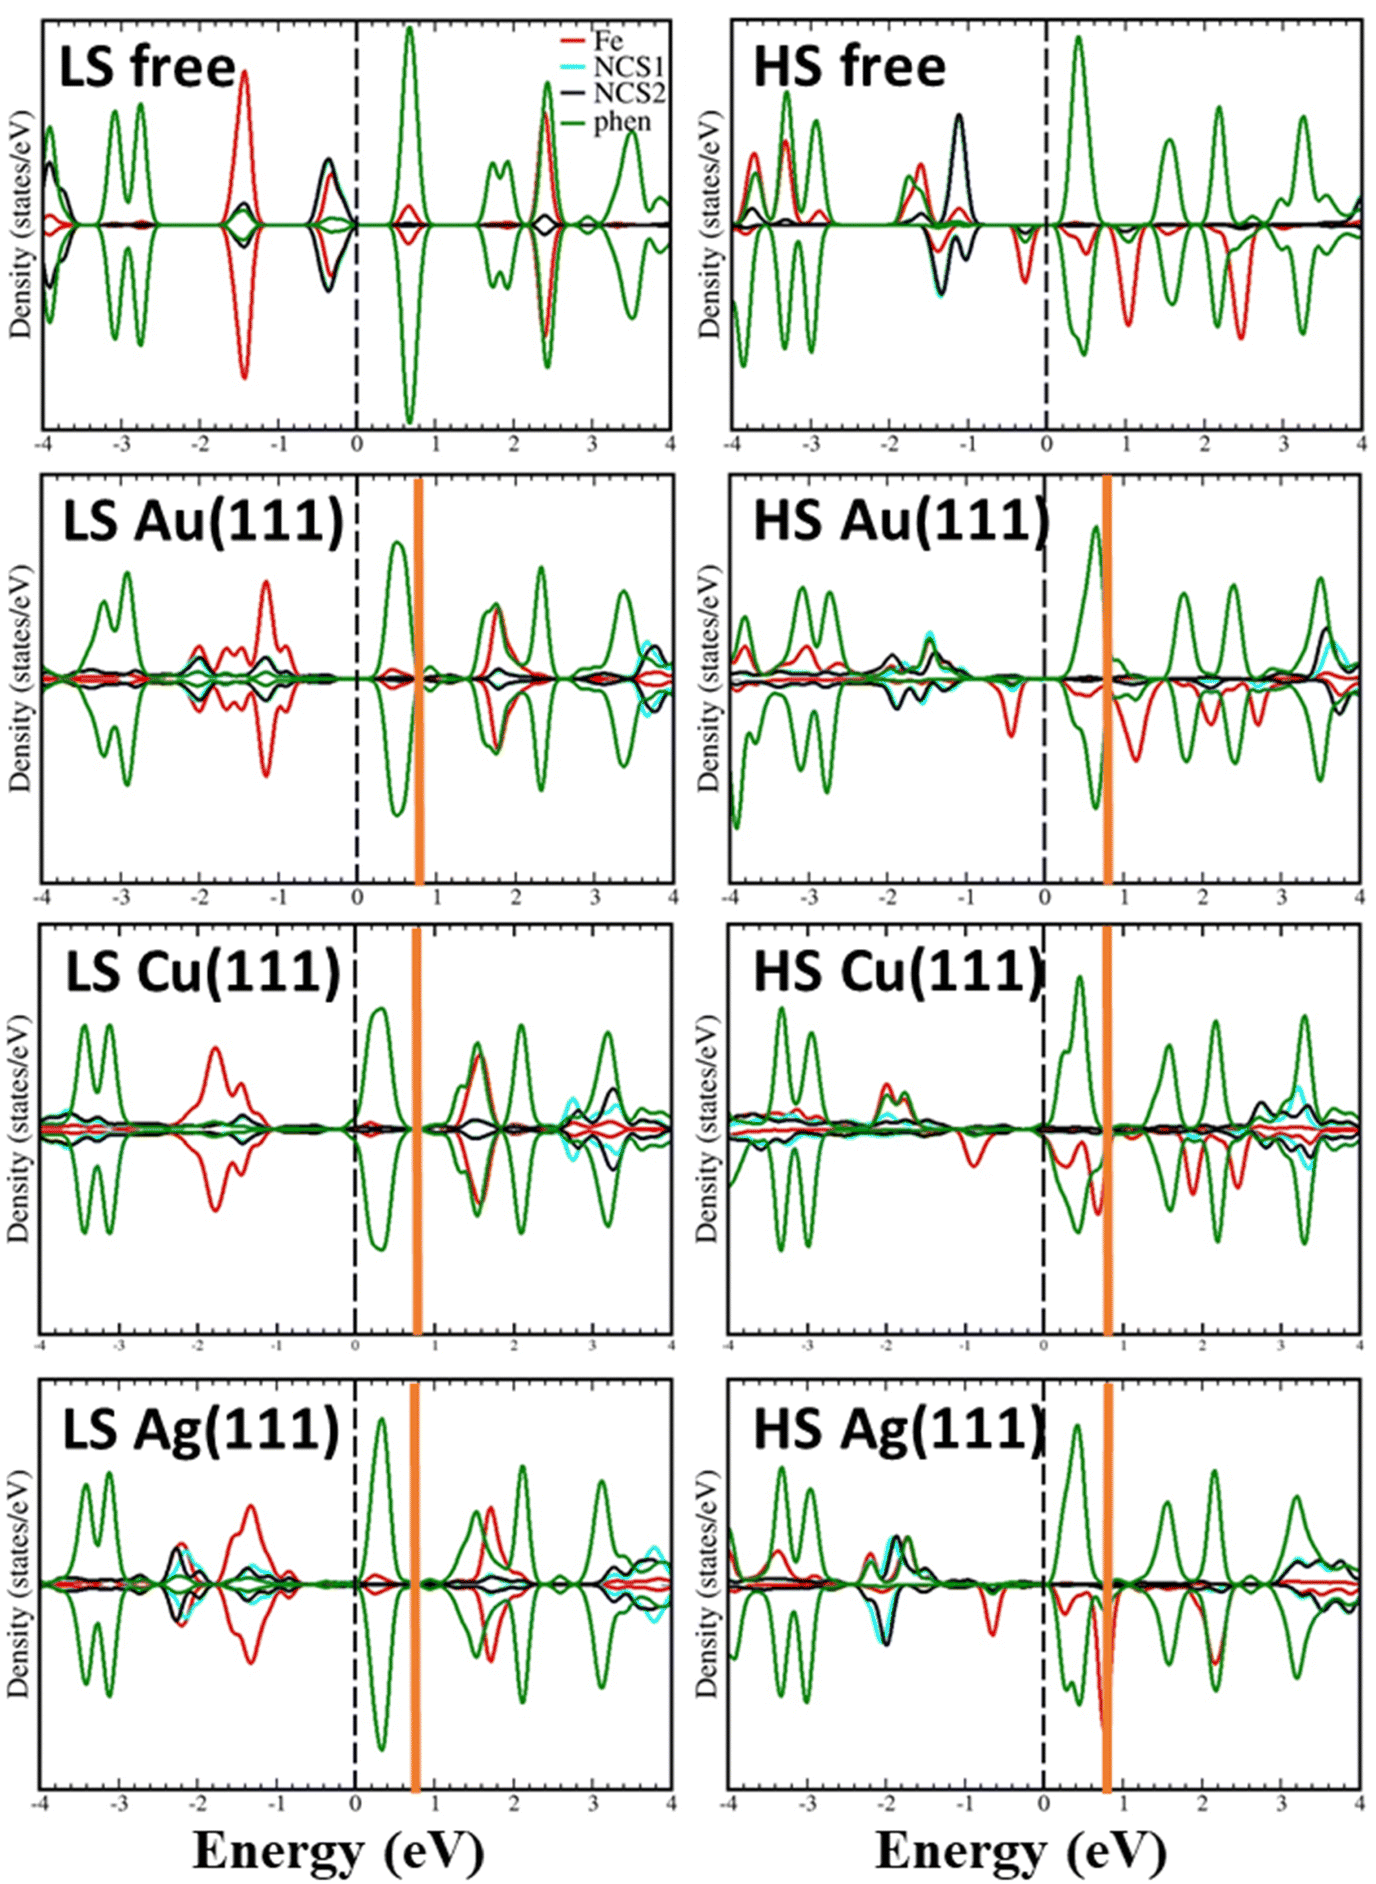 | ||
| Fig. 6 Projected density of states of the LS (left) and HS (right) complexes, free and adsorbed on Au(111), Cu(111) and Ag(111) surfaces. Red, blue, black and green lines correspond to Fe, NCS1, NCS2 and phenanthroline ligands, respectively. The dashed black vertical line at 0 eV indicates the Fermi level. The vertical orange line marks the upper limit of the unoccupied states considered to simulate the STM images (the range of 0.8 eV above the Fermi level has been considered). | ||
Finally, we have simulated constant-current STM images for the adsorbed complex on the basis of the density of states provided by our calculations (Fig. 7). In fact, it has been reported that individual [Fe(phen)2(NCS)2] molecules supported on different metallic surfaces appear as a pair of oval lobes in STM images, and the distance between the lobes is slightly larger in the HS state than that in the LS state, due to the expansion of the complex after spin transition.7,8,20 For a positive bias voltage of 0.8 V, electrons tunnel from the tip to the unoccupied bands of the sample in the range of 0.8 eV above the Fermi level. The pDOS resulting from our calculations indicate that the states in this range correspond mainly to phenanthroline ligands with a non-negligible contribution of the Fe ion in the case of the HS state, as shown in Fig. 6. These are responsible for the two lobes found in the STM images, in both the LS and HS states, although slightly larger in the HS state than in the LS one, in good agreement with experimental findings,7,8,20 and with the geometrical parameters resulting from our calculations, i.e., larger S–S distances and S–Fe–S angles for the deposited HS molecules than those for the LS molecules (Table 1). The contribution of Fe 3d orbitals to the states of the HS molecule in this range could explain the differences found in the height profiles resulting from STM,6,8 slightly higher for the HS molecules than the LS ones.
 | ||
| Fig. 7 Simulated constant-current STM images of the complex adsorbed on Au(111), Ag(111) and Cu(111) with a positive bias voltage of 0.8 V, in the LS (left) and HS (right) states. On the side of each STM image, the partial charge density isosurface at 0.005 e Bohr−3 in the states is in the range of [EFermi, EFermi + 0.8 eV]. | ||
Conclusions
In this work, we have studied the adsorption of the prototypical SCO complex [Fe(phen)2(NCS)2] on Au(111), Cu(111) and Ag(111) surfaces by means of periodic DFT calculations, with the aim of understanding how different metallic surfaces affect the spin transition. For the three studied surfaces, we found several adsorption sites with very similar relative stability, and consequently, molecules will occupy different adsorption sites on the surface, especially at room temperature.The interaction with the surface is spin-dependent for the three surfaces, and the LS state is always more stabilized than the HS state, which produces an increase of the transition enthalpy with respect to the free molecule, which should be the reason for the suppression of the SCO properties observed experimentally after adsorption on Cu and Au surfaces. We have found a good correlation between the strength of the molecule–surface interaction and the increase of the transition enthalpy. Adsorption energies, molecule–surface distances and charge density difference plots indicate that the molecule–surface interaction follows the trend: Cu(111) > Au(111) > Ag(111). The HS–LS energy difference is significantly enhanced when the molecule is deposited, increasing by 405% for Cu(111), 135% for Au(111) and 66% for Ag(111) with respect to the isolated molecule. These results reinforce the idea that the SCO properties after deposition are dictated by the molecule–surface interaction.
Finally, the projected DOS plots show enough differences between the LS and HS states close to the Fermi level to allow the identification of the spin states of the deposited molecules by STM images. Simulated constant current STM images using a positive bias voltage show each single molecule as a pair of lobes, and an expansion of the molecule after the LS–HS switching, in agreement with experimental findings.
Conflicts of interest
There are no conflicts of interest to declare.Acknowledgements
The authors acknowledge the financial support through grants PGC2018-101689-B-I00 and PID2021-127674NB-I00 funded by MCIN/AEI/10.13039/501100011033/FEDER, UE. The technical support of the Supercomputing Team of the Centro Informático Científico de Andalucía (CICA) and the access to the computational facilities of the “Centro de Servicios de Informática y Redes de Comunicaciones” (CSIRC, Universidad de Granada, Spain) are also acknowledged.References
- P. Gutlich, A. Hauser and H. Spiering, Thermal and Optical Switching of Iron(II) Complexes, Angew. Chem., Int. Ed. Engl., 1994, 33(20), 2024–2054, DOI:10.1002/anie.199420241.
- A. Bousseksou, G. Molnar, L. Salmon and W. Nicolazzi, Molecular spin crossover phenomenon: recent achievements and prospects, Chem. Soc. Rev., 2011, 40(6), 3313–3335, 10.1039/c1cs15042a.
- K. S. Kumar and M. Ruben, Sublimable Spin-Crossover Complexes: From Spin-State Switching to Molecular Devices, Angew. Chem., Int. Ed., 2021, 60(14), 7502–7521, DOI:10.1002/anie.201911256.
- L. Kipgen, M. Bernien, F. Tuczek and W. Kuch, Spin-Crossover Molecules on Surfaces: From Isolated Molecules to Ultrathin Films, Adv. Mater., 2021, 33(24), 14, DOI:10.1002/adma.202008141.
- A. Pronschinske, Y. F. Chen, G. F. Lewis, D. A. Shultz, A. Calzolari, M. B. Nardelli and D. B. Dougherty, Modification of Molecular Spin Crossover in Ultrathin Films, Nano Lett., 2013, 13(4), 1429–1434, DOI:10.1021/nl304304e.
- T. Miyamachi, M. Gruber, V. Davesne, M. Bowen, S. Boukari, L. Joly, F. Scheurer, G. Rogez, T. K. Yamada and P. Ohresser, et al., Robust spin crossover and memristance across a single molecule, Nat. Commun., 2012, 3, 938, DOI:10.1038/ncomms1940.
- M. Gruber, V. Davesne, M. Bowen, S. Boukari, E. Beaurepaire, W. Wulfhekel and T. Miyamachi, Spin state of spin-crossover complexes: From single molecules to ultrathin films, Phys. Rev. B: Condens. Matter Mater. Phys., 2014, 89(19), 9, DOI:10.1103/PhysRevB.89.195415.
- M. Gruber and R. Berndt, Spin-Crossover Complexes in Direct Contact with Surfaces, Magnetochemistry, 2020, 6(3), 26, DOI:10.3390/magnetochemistry6030035.
- N. Montenegro-Pohlhammer, R. Sanchez-de-Armas and C. J. Calzado, Deposition of the Spin Crossover Fe-II-Pyrazolylborate Complex on Au(111) Surface at the Molecular Level, Chem. – Eur. J., 2021, 27(2), 712–723, DOI:10.1002/chem.202003520.
- R. Sanchez-de-Armas and C. J. Calzado, Spin-crossover Fe(ii) complexes on a surface: a mixture of low-spin and high-spin molecules at low temperature from quantum-chemistry calculations, Inorg. Chem. Front., 2022, 9, 753–760, 10.1039/d1qi01487k.
- C. M. Palomino, R. Sanchez-de-Armas and C. J. Calzado, Theoretical inspection of the spin-crossover Fe(tzpy)(2)(NCS)(2) complex on Au(100) surface, J. Chem. Phys., 2021, 154(3), 034701, DOI:10.1063/5.0036612.
- J. Villalva, A. Develioglu, N. Montenegro-Pohlhammer, R. Sanchez-de-Armas, A. Gamonal, E. Rial, M. Garcia-Hernandez, L. Ruiz-Gonzalez, J. S. Costa and C. J. Calzado, et al., Spin-state-dependent electrical conductivity in single-walled carbon nanotubes encapsulating spin-crossover molecules, Nat. Commun., 2021, 12(1), 1578, DOI:10.1038/s41467-021-21791-3.
- R. Sanchez-de-Armas, N. Montenegro-Pohlhammer, A. Develioglu, E. Burzuri and C. J. Calzado, Spin-crossover complexes in nanoscale devices: main ingredients of the molecule-substrate interactions, Nanoscale, 2021, 13(44), 18702–18713, 10.1039/d1nr04577f.
- E. Konig and K. Madeja, Unusual Magnetic Behaviour of Some Iron(2)-Bis-(1,10-Phenanthroline) Complexes, Chem. Commun., 1966,(3), 61, 10.1039/c19660000061.
- M. Reiher, Theoretical study of the Fe(phen)(2)(NCS)(2) spin-crossover complex with reparametrized density functionals, Inorg. Chem., 2002, 41(25), 6928–6935, DOI:10.1021/ic025891l.
- G. Brehm, M. Reiher and S. Schneider, Estimation of the vibrational contribution to the entropy change associated with the low- to high-spin transition in Fe(phen)(2)(NCS)(2) complexes: Results obtained by IR and Raman spectroscopy and DFT calculations, J. Phys. Chem. A, 2002, 106(50), 12024–12034, DOI:10.1021/jp026586o.
- A. Sarmah and P. Hobza, Mechanical force-induced manipulation of electronic conductance in a spin-crossover complex: a simple approach to molecular electronics, Nanoscale Adv., 2020, 2(7), 2907–2913, 10.1039/d0na00285b.
- T. Granier, B. Gallois, J. Gaultier, J. A. Real and J. Zarembowitch, High-pressure single-crystal X-ray-diffraction study of 2 spin-crossover iron(II) complexes - Fe(Phen)2(NCS)2 and Fe(Btz)2(NCS)2, Inorg. Chem., 1993, 32(23), 5305–5312, DOI:10.1021/ic00075a058.
- S. Shi, G. Schmerber, J. Arabski, J. B. Beaufrand, D. J. Kim, S. Boukari, M. Bowen, N. T. Kemp, N. Viart and G. Rogez, et al., Study of molecular spin-crossover complex Fe(phen)(2)(NCS)(2) thin films, Appl. Phys. Lett., 2009, 95(4), 3, DOI:10.1063/1.3192355.
- M. Gruber, T. Miyamachi, V. Davesne, M. Bowen, S. Boukari, W. Wulfhekel, M. Alouani and E. Beaurepaire, Spin crossover in Fe(phen)(2)(NCS)(2) complexes on metallic surfaces, J. Chem. Phys., 2017, 146(9), 13, DOI:10.1063/1.4973511.
- S. Gueddida and M. Alouani, Spin crossover in a single Fe(phen)(2)(NCS)(2) molecule adsorbed onto metallic substrates: An ab initio calculation, Phys. Rev. B: Condens. Matter Mater. Phys., 2013, 87(14), 7, DOI:10.1103/PhysRevB.87.144413.
- Y. C. Zhang, Surface effects on temperature-driven spin crossover in Fe(phen)(2)(NCS)(2), J. Chem. Phys., 2020, 153(13), 7, DOI:10.1063/5.0027641.
- S. Beniwal, S. Sarkar, F. Baier, B. Weber, P. A. Dowben and A. Enders, Site selective adsorption of the spin crossover complex Fe(phen)2(NCS) on Au(111), J. Phys.: Condens. Matter, 2020, 32(32), 5, DOI:10.1088/1361-648X/ab808d.
- G. Kresse and J. Furthmuller, Efficiency of ab-initio total energy calculations for metals and semiconductors using a plane-wave basis set, Comput. Mater. Sci., 1996, 6(1), 15–50, DOI:10.1016/0927-0256(96)00008-0.
- G. Kresse and J. Furthmuller, Efficient iterative schemes for ab initio total-energy calculations using a plane-wave basis set, Phys. Rev. B: Condens. Matter Mater. Phys., 1996, 54(16), 11169–11186, DOI:10.1103/PhysRevB.54.11169.
- G. Kresse and J. Hafner, Ab Initio Molecular-Dynamics Simulation of the Liquid-Metal-Amorphous Semiconductor Transition in Germanium, Phys. Rev. B: Condens. Matter Mater. Phys., 1994, 49(20), 14251–14269, DOI:10.1103/PhysRevB.49.14251.
- G. Kresse and J. Hafner, Ab initio molecular dynamics for liquid metals, Phys. Rev. B: Condens. Matter Mater. Phys., 1993, 47, 4 CrossRef PubMed.
- J. P. Perdew, K. Burke and M. Ernzerhof, Generalized gradient approximation made simple, Phys. Rev. Lett., 1996, 77(18), 3865–3868, DOI:10.1103/PhysRevLett.77.3865.
- P. E. Blochl, Projector augmented-wave method, Phys. Rev. B: Condens. Matter Mater. Phys., 1994, 50(24), 17953–17979, DOI:10.1103/PhysRevB.50.17953.
- G. Kresse and D. Joubert, From ultrasoft pseudopotentials to the projector augmented-wave method, Phys. Rev. B: Condens. Matter Mater. Phys., 1999, 59(3), 1758–1775, DOI:10.1103/PhysRevB.59.1758.
- S. L. Dudarev, G. A. Botton, S. Y. Savrasov, C. J. Humphreys and A. P. Sutton, Electron-energy-loss spectra and the structural stability of nickel oxide: An LSDA + U study, Phys. Rev. B: Condens. Matter Mater. Phys., 1998, 57(3), 1505–1509, DOI:10.1103/PhysRevB.57.1505.
- S. Lebegue, S. Pillet and J. G. Angyan, Modeling spin-crossover compounds by periodic DFT+U approach, Phys. Rev. B: Condens. Matter Mater. Phys., 2008, 78(2), 6, DOI:10.1103/PhysRevB.78.024433.
- Y. C. Zhang, Fe(phen)(2)(NCS)(2) on Al(100): influence of AlN layer on spin crossover barrier, Phys. Chem. Chem. Phys., 2021, 23(41), 23758–23767, 10.1039/d1cp03782j.
- A. Albavera-Mata, S. B. Trickey and R. G. Hennig, Mean Value Ensemble Hubbard-U Correction for Spin-Crossover Molecules, J. Phys. Chem. Lett., 2022, 13(51), 12049–12054, DOI:10.1021/acs.jpclett.2c03388.
- P. Detrattanawichai, N. Niamjan, D. J. Harding, P. Harding, H. S. Kim, A. Boonchun and S. Na-Phattalung, Exploring the impact of the nitrogen layer on a Cu(001) substrate on the spin crossover properties of Fe(SalEen-I)2 Br: A DFT study, J. Phys. Chem. Solids, 2023, 173, 8, DOI:10.1016/j.jpcs.2022.111111.
- H. J. Monkhorst and J. D. Pack, Special Points for Brillouin-zone Integrations, Phys. Rev. B: Condens. Matter Mater. Phys., 1976, 13(12), 5188–5192, DOI:10.1103/PhysRevB.13.5188.
- J. Wellendorff, A. Kelkkanen, J. J. Mortensen, B. I. Lundqvist and T. Bligaard, RPBE-vdW Description of Benzene Adsorption on Au(111, Top. Catal., 2010, 53(5–6), 378–383, DOI:10.1007/s11244-010-9443-6.
- A. Tkatchenko and M. Scheffler, Accurate Molecular van der Waals Interactions from Ground-State Electron Density and Free-Atom Reference Data, Phys. Rev. Lett., 2009, 102(7), 073005, DOI:10.1103/PhysRevLett.102.073005.
- G. Molnar, M. Mikolasek, K. Ridier, A. Fahs, W. Nicolazzi and A. Bousseksou, Molecular Spin Crossover Materials: Review of the Lattice Dynamical Properties, Ann. Phys., 2019, 531(10), 1900076, DOI:10.1002/andp.201900076.
- J. Tersoff and D. R. Hamann, Theory of the scanning tunneling microscope, Phys. Rev. B: Condens. Matter Mater. Phys., 1985, 31(2), 805–813, DOI:10.1103/PhysRevB.31.805.
- K. Momma and F. Izumi, VESTA 3 for three-dimensional visualization of crystal, volumetric and morphology data, J. Appl. Crystallogr., 2011, 44, 1272–1276, DOI:10.1107/s0021889811038970.
- B. Gallois, J. A. Real, C. Hauw and J. Zarembowitch, Structural-changes associated with the spin transition in Fe(Phen)2(NCS)2 - a single-crystal x-ray-investigation, Inorg. Chem., 1990, 29(6), 1152–1158, DOI:10.1021/ic00331a009.
- O. S. Siig and K. P. Kepp, Iron(II) and Iron(III) Spin Crossover: Toward an Optimal Density Functional, J. Phys. Chem. A, 2018, 122(16), 4208–4217, DOI:10.1021/acs.jpca.8b02027.
- M. Papai, G. Vanko, C. de Graaf and T. Rozgonyi, Theoretical Investigation of the Electronic Structure of Fe(II) Complexes at Spin-State Transitions, J. Chem. Theory Comput., 2013, 9(1), 509–519, DOI:10.1021/ct300932n.
- J. Cirera, M. Via-Nadal and E. Ruiz, Benchmarking Density Functional Methods for Calculation of State Energies of First Row Spin-Crossover Molecules, Inorg. Chem., 2018, 57(22), 14097–14105, DOI:10.1021/acs.inorgchem.8b01821.
- K. P. Kepp, Theoretical Study of Spin Crossover in 30 Iron Complexes, Inorg. Chem., 2016, 55(6), 2717–2727, DOI:10.1021/acs.inorgchem.5b02371.
- S. Vela, M. Fumanal, J. Ribas-Arino and V. Robert, Towards an accurate and computationally-efficient modelling of Fe(II)-based spin crossover materials, Phys. Chem. Chem. Phys., 2015, 17(25), 16306–16314, 10.1039/c5cp02502h.
| This journal is © the Owner Societies 2023 |