
 Open Access Article
 This Open Access Article is licensed under a Creative Commons Attribution-Non Commercial 3.0 Unported Licence
Ultrafast fluorescence depolarisation in green fluorescence protein tandem dimers as hydrophobic environment sensitive probes†
Alejandro
Sánchez-Pedreño Jiménez
 abd,
Henry L.
Puhl
III
c,
Steven S.
Vogel
*c and
Youngchan
Kim
*abd
abd,
Henry L.
Puhl
III
c,
Steven S.
Vogel
*c and
Youngchan
Kim
*abd
aLeverhulme Quantum Biology Doctoral Training Centre, University of Surrey, Guildford GU2 7XH, UK. E-mail: youngchan.kim@surrey.ac.uk
bDepartment of Microbial Sciences, School of Biosciences, University of Surrey, Guilford GU2 7XH, UK
cLaboratory of Biophotonics and Quantum Biology, NIAAA, NIH, Bethesda, USA. E-mail: stevevog@mail.nih.gov
dAdvanced Technology Institute, University of Surrey, Guildford, GU2 7XH, UK
First published on 19th June 2023
Abstract
Advances in ultra-fast photonics have enabled monitoring of biochemical interactions on a sub nano-second time scale. In addition, picosecond dynamics of intermolecular energy transfer in fluorescent proteins has been observed. Here, we present the development of a genetically encoded fluorescent sensor that can detect changes in hydrophobicity by monitoring ultrafast fluorescence depolarisation. Our sensor is composed of a pair of dimeric enhanced green fluorescent proteins (dEGFPs) linked by a flexible amino-acid linker. We show dimerisation is perturbed by the addition of glycerol which interferes with the hydrophobic interaction of the two proteins. Time-resolved fluorescence anisotropy revealed a systematic attenuation of ultrafast fluorescence depolarisation when the sensor was exposed to increasing glycerol concentrations. This suggests that as hydrophobicity increases, dEGFP pairing decreases within a tandem dimer. Un-pairing of the protein fluorophores dramatically alters the rate of energy transfer between the proteins, resulting in an increase in the limiting anisotropy of the sensor.
Introduction
Hydrophobicity is a term used to describe the tendency of nonpolar groups or molecules to avoid water. It is well known that hydrophobic interactions play a prominent role as a general driving force in many biological processes, such as protein folding,1,2 membrane formation,3 membrane targeting,4 and enzyme catalysis.5 Furthermore, studies have shown that hydrophobic interactions can facilitate the formation of membrane-less subcellular compartments in eukaryotic cells, which are formed by the condensation of protein and other biomolecules into liquid droplets, referred to as biomolecular condensates.6,7 The formation of biomolecular condensates is implicated in a wide range of cellular functions and processes including organisation of subcellular compartments, RNA metabolism, signalling to gene regulation.6,7 Despite of the importance of understanding the hydrophobic interactions in the biological systems, a few fluorescent dyes have been designed and used for monitoring hydrophobic interactions in living cells.8–10 Thus, there is profound interest in developing hydrophobic environment sensitive probes to monitor with temporal and spatial resolution in living cells.Since the discovery and isolation of green fluorescent protein (GFP) from Aequorea Victoria,11 fluorescent proteins (FPs) have become a powerful tool for building genetically encoded fluorescent probes. The popularity of GFP and GFP-like FPs stem from its simple structure and its auto-catalytic fluorophore formation.12 GFP is encoded by a single gene that results in a polypeptide chain containing 238 amino acids (aa). Once translated, protein maturation takes place, where the polypeptide chain folds into a structure known as a β-barrel containing 11 β-sheets and at the centre a chromophore autocatalytically formed from 3 aa held in place by 2 alpha-helixes13 as shown in Fig. 1a. GFP has been readily modified, to generate new fluorescent proteins with optimized photo-physical characteristics generating a wide toolbox of genetically encoded fluorophores.14 It is noteworthy that alanine 206, leucine 221 and phenylalanine 223 play an important role in supporting GFP dimerisation due to the hydrophobic side chain patches they form on the surface of the β-barrel.13,15 The centre-to-centre distance separating the chromophores in an EGFP dimer is about 2.7 nm (Fig. 1b). A monomeric EGFP can be engineered by mutating alanine 206 (A206) to a positively charged lysine (K206, a.k.a. mEGFP).16
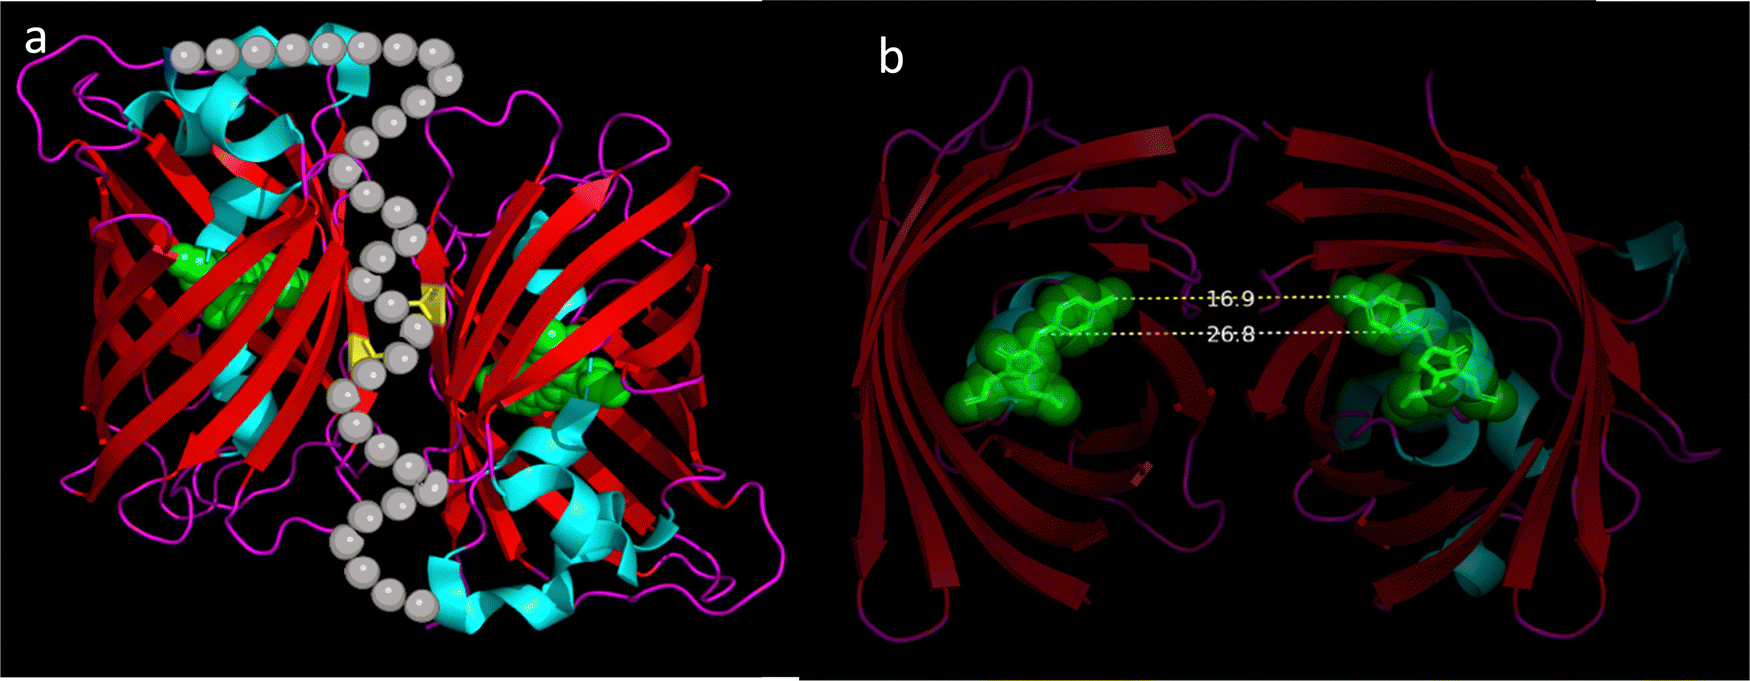 | ||
| Fig. 1 The structure of EGFP dimers. (a) An illustrated depiction of the structure of a pair of dEGFP molecules based on its crystal structure (PDB: 4N3D) is shown. Each dEGFP chromophore is depicted as green spheres while alanine 206 involved in dimerisation is depicted in yellow. α-helixes are depicted in cyan while β-barrel is depicted in red and molecular loops in magenta. Grey bubbles were added to the crystal structure to depict a possible conformation of the 33 amino acid flexible molecular linker used to support dimerisation. (b) A cut-away image of a dEGFP dimer revealing the separation between the two chromophores. The dashed yellow line (16.9 Å) depicts the nearest distance while the dashed blue line (26.8 Å) illustrates the centre-to-centre distance between the chromophores. | ||
Time-resolved fluorescence anisotropy (TRFA) is used to measure changes in the polarisation (orientation) of a fluorophore's fluorescence emission over time.17 The technique involves exciting a sample with linearly polarized light and detecting its fluorescence emission through linear polarisers oriented either parallel or perpendicular to the orientation of the excitation light polarisation. The rate at which the fluorescence depolarises is related to the rotational dynamics of the emitting molecule. Thus, TRFA is used in various biological studies such as protein–protein interactions and protein folding.18 TRFA can also be used to measure the rate of energy transfer between spectrally identical fluorophores. The limiting anisotropy is the maximum anisotropy value after excitation prior to any molecular rotation. Changes in the limiting anisotropy can indicate changes in the ultrafast dynamics of energy transfer between fluorophores that are faster than the instrument response function (IRF) of the anisotropy system.19
Here, using TRFA, we demonstrate that ultrafast fluorescence depolarisation of dEGFP tandem dimers (TDs) is sensitive to the hydrophobic environment. The ultrafast fluorescence depolarisation manifests as an instantaneously drop in limiting anisotropy. Ultrafast here is defined as faster than the IRF of our TRFA system, 84 ps (see Fig. S1, ESI†). We perform TRFA measurements of dEGFP-TDs under various glycerol–water mixtures. Our results show a systematic change in ultrafast fluorescence depolarisation in response to hydrophobicity of the environment. We used mEGFP under the same hydrophobicity conditions as a negative control.
Methods and materials
Plasmid assemblies
The Monomeric version of EGFP (mEGFP) was expressed from pRSET his-EGFP which was a gift from Jeanne Stachowiak (Addgene plasmid #113551; https://n2t.net/addgene:113551; RRID: Addgene_113551). The EGFP-33-EGFP (dEGFPA206-TD) assembly was constructed from the VenusA206-TD19 which contained a 33 flexible amino acid linker (SGLRSENLYFQGPREFCRYPAQWRPLESRPRTT) which restricted the distance between fluorescent protein barrels while allowing β-barrels to rotate and dimerise. Individual VenusA206 sequences were replaced by EGFPA206 by In-Fusion® Snap Assembly fusion (Takara Bio, USA) using the following primers:For the vector:
• EGFP1_Iffor: CTACCGGTCGCCACCATGGTGAGCAAGGGCGAGGAG
• EGFP1_Ifrev: AGATCTGAGTCCGGACTTGTACAGCTCGTCCATGC
• EGFP2_Iffor: AGACCGCGGACCACCATGGTGAGCAAGGGCGAGGAG
• EGFP2_Ifrev: GAATTAAACGGGCCCTTACTTGTACAGCTCGTCCATGC
For the inserts
• TDFP1VecIFfor: TCCGGACTCAGATCTGAGAACC
• TDFP1VecIFrev: GGTGGCGACCGGTAGCAATTCC
• TDFP2VecIFfor: GGGCCCGTTTAATTCGAAGCTTG
• TDFP2VecIFrev: GGTGGTCCGCGGTCTAGACTCG
Proper assembly was confirmed by sequencing.
Sample preparation
For expression, the plasmids were transformed into E. coli BL21 (DE3). Single colonies were used to inoculate an overnight 15 ml culture of LB (100 μg ml−1 ampicillin or 150 μg ml−1 kanamycin). Protein production was then induced by addition of IPTG to 1 mM and incubated for 16 h at 30 °C 250 rpm. The bacteria were harvested by centrifugation at 4000 rpm and frozen at −80 °C.The cell pellet was then resuspended in lysis buffer (BugBuster® Protein Extraction Reagent, Sigma-Aldrich). Purification of His6-tagged fluorescent proteins was performed by Ni-NTA spin column under native conditions as described by the manufacturer (Qiagen). Purified protein was eluted with 500 mM imidazole, the elution buffer was exchanged to PBS and concentrated with Amicon Ultra Centrifugal filters (Millipore Ultracel-10 K) with a 10 kDa cut off. Concentrated samples in PBS were stored at 4 °C before use resulting in different amounts of stock solution. The Purified protein concentration was calculated using Beer–Lambert law:20
| A = εlC | ([1]) |
Glycerol is a simple triol and a polar molecule that can interact with both hydrophobic and hydrophilic amino acids. Vagenenende et al.21 have indicated that the addition of glycerol in aqueous solution is capable of preventing protein aggregation by stabilising protein aggregation-prone motifs through preferential interactions of amphiphilic orientation of glycerol and hydrophobic surfaces on protein structure. Therefore, we anticipate that glycerol can alter hydrophobic interactions between hydrophobic patches on the surfaces of protein structures.
The average distance between mEGFPs at 1 μM is equivalent to 55 nm:
 | ([2]) |
Steady-state spectra
Steady-state absorption spectra (1 nm resolution) were obtained using an Agilent Cary 60 spectrophotometer (Agilent Technologies, USA) with a 1 cm pathlength quartz cuvette. Measurements were taken from 350 nm to 600 nm in 1 nm steps at a concentration of 5 μM. Emission spectra were obtained at 1 μM with a spectrofluorometer (FluoTime 300, Picoquant, Berlin, Germany). The emission spectra were measured between 450–650 nm with a 1 nm step after 440 ± 5 nm excitation.Time-correlated single photon counting (TCSPC) measurements
Fluorescence emission was recorded within 509 ± 5 nm using a TCSPC system (FluoTime 300, PicoQuant, Berlin, Germany). A picosecond laser diode head operating at a repetition rate of 16 MHz and a wavelength of 444 ± 5 nm (LDH-P-C-440, Picoquant) was employed for one-photon excitation. For TRFA measurements, fluorescence decay for the parallel and perpendicular components were subsequently recorded within 509 ± 5 nm using the TCSPC system that is equipped with a single photon detector (PMA Hybrid 07, Picoquant) coupled with a single photon counter (PicoHarp 300, Picoquant). TRFA. r(t), was calculated using the following equation:22 | ([3]) |
 | ([4]) |
 | ([5]) |
Refractive index measurements
The refractive index of PBS/glycerol range was measured using a digital hand-held pocket refractometer (PAL-RI, Atago, Tokyo, Japan). A 300 μl of sample was pipetted onto the refractometer to measure its refractive index (Table 1).| % glycerol in PBS | Refractive index (n) ± SD | mEGFP τ (ns) ± SD | dEGFP-TD τ (ns) ± SD |
|---|---|---|---|
| 0% | 1.33 ± 0.01 | 2.64 ± 0.00 | 2.61 ± 0.00 |
| 10% | 1.35 ± 0.01 | 2.51 ± 0.00 | 2.54 ± 0.00 |
| 25% | 1.37 ± 0.01 | 2.38 ± 0.00 | 2.43 ± 0.00 |
| 50% | 1.41 ± 0.01 | 2.21 ± 0.00 | 2.22 ± 0.00 |
| 75% | 1.45 ± 0.01 | 2.06 ± 0.00 | 2.04 ± 0.00 |
Data analysis
IGOR Pro version 9.0 software was used to process and fit TCSPC and TRFA. To process, calculate means, standard deviation (SD), and analysis of variance were performed using GraphPad Prism version 9.3.1 for Windows, GraphPad Software, San Diego, California USA. Note, a reported SD value of 0.00 indicates an error smaller than 0.005. Here, the SD was calculated as the square root of variance by determining each sample data deviation relative to the sample mean. The PyMOL Molecular Graphics System, Version 2.0 Schrödinger, LLC. was used to represent crystal structures for cartoon representations.Results
We first investigated the effect of glycerol on the steady state spectra of mEGFP and dEGFP-TD. For the absorption spectra 1.5 ml of 5 μM solutions after degassing in quartz cuvettes were scanned between 350 nm and 550 nm. Note that mEGFP and dEGFP are almost identical structurally. The absorption spectra of mEGFP (Fig. 2a, dashed lines) and dEGFP-TD (Fig. 2b, dashed lines) show an absorption maximum at 490 nm as per literature. We observed that the absorption spectra at around 400 nm was affected by increasing glycerol concentration. This result is consistent with the excitation spectra in Fig. S5 (ESI†). The peaks of the absorption spectra had virtually no difference between mEGFP and dEGFP-TD. The fluorescence emission spectrum of 2 ml of a 1 μM sample in quartz cuvettes was obtained resulting in virtually indistinguishable spectres, glycerol concentration had no effect on the spectral shape. The emission spectra of mEGFP (Fig. 2b, solid lines) and dEGFP-TD (Fig. 2b, solid lines) show a fluorescence maximum located at 510 nm. | ||
| Fig. 2 The steady-state absorption and emission spectra. Absorption (dotted lines) and emission spectra (solid lines) of (a) mEGFP and (b) dEGFP-TD in PBS at a range of glycerol concentrations. Each absorption and emission curve corresponds to the glycerol concentration of 0% (blue), 10% (red), 25% (green), 50% (purple), and 75% (orange), respectively. The emission spectra were obtained from 450 nm to 600 nm using 440 nm excitation. | ||
The fluorescence lifetime was obtained by time-correlated single photon counting (TCSPC) measurements for both samples at different glycerol concentrations. Since glycerol and our buffer have different refractive indices, this experiment allowed us to study the effect of refractive index on fluorescence lifetime. Fig. 3 shows similar lifetime decay curves for both samples that can be described by a single mono-exponential decay curve with a time constant of 2.64 ns and 2.61 ns for mEGFP and dEGFP-TD respectively at 0% glycerol. Both assemblies showed a similar lifetime decrease (Table 1) which is inversely proportional to the refractive index as previous seen in the literature23 reaching a 2.06 (mEGFP) and 2.04 ns (dEGFP-TD) time constant at 75% glycerol in Phosphate Buffered Saline (PBS) buffer.
 | ||
| Fig. 3 Normalised fluorescence decay curves of 1 μM mEGFP (a) and dEGFP-TD (b) in PBS in a range of glycerol concentrations (blue 0%, red 10%, Green 25%, purple 50%, and orange 75%). Excitation was achieved at 444 ± 5 nm with a 16 ps temporal step. The fluorescence emission was detected within 509 ± 5 nm. Each decay curve represents the average of 9 fluorescence decay curves from three preparations, each with three technical replicates. | ||
We employed TRFA to measure the rotational correlation time and energy transfer dynamics of mEGFP and dEGFP-TD. mEGFP anisotropy decays were well fit using a single exponential decay model while dEGFP-TD decays were best fit using a double exponential model. These models assume that individual molecules in these populations are arranged in a random and isotropic orientation. All mEGFP anisotropy decay curves (Fig. 4a) present a single mono-exponential decay, indicating that a single component is responsible for the fluorescence depolarization. This depolarisation is thought to be due to molecular rotation. Further details about the rotational correlation time of GFP and its biological applications can be found elsewhere.24–28Table 2 shows the fit results indicating a molecular rotational correlation time of ∼16 ns in PBS which is in good agreement with the literature.29 As expected, the molecular rotational correlation time increases with an increase of the glycerol content as the viscosity of glycerol hinders molecular rotation, which is in good agreement with the literature.30 However, given that the average mEGFP fluorescence lifetime (∼2.6 ns, Fig. 3) is shorter than the rotational correlation time and further slowing down its rotational correlation time as expected for a high viscosity buffer, measuring its rotational correlation time becomes more challenging. Such limitation will also be present when characterising a rotational correlation time of the dEGFP-TD in a highly viscous environment.
 | ||
| Fig. 4 Anisotropy decay curves. Anisotropy decay curves of 1 μM mEGFP (a) and dEGFP-TD (b) in PBS in a range of glycerol concentrations (blue 0%, red 10%, green 25%, purple 50% and orange 75%). Each decay curve represents the average of 9 anisotropy curves from three preparations, each with three technical replicates. | ||
| % glycerol in PBS | mEGFP | dEGFP-TD | ||||
|---|---|---|---|---|---|---|
| A 1 ± SD | σ 1 (ns) ± SD | A 1 ± SD | A 2 ± SD | σ 1 (ns) ± SD | σ 2 (ns) ± SD | |
| 0% | 0.36 ± 0.00 | 15.92 ± 0.06 | 0.26 ± 0.02 | 0.03 ± 0.01 | 22.70 ± 2.36 | 1.31 ± 0.21 |
| 10% | 0.36 ± 0.00 | 21.69 ± 0.1 | 0.27 ± 0.02 | 0.03 ± 0.01 | 28.15 ± 2.94 | 1.27 ± 0.34 |
| 25% | 0.36 ± 0.01 | 35.07 ± 0.28 | 0.29 ± 0.03 | 0.03 ± 0.01 | 44.49 ± 5.54 | 1.24 ± 0.30 |
| 50% | 0.36 ± 0.01 | 104.39 ± 2.23 | 0.30 ± 0.03 | 0.03 ± 0.01 | 92.78 ± 29.63 | 1.30 ± 0.44 |
| 75% | 0.37 ± 0.01 | 192.89 ± 7.93 | 0.32 ± 0.03 | 0.03 ± 0.02 | 136.51 ± 62.17 | 0.93 ± 0.22 |
The dEGFP-TD (Fig. 4b) were best fit using a double exponential decay model which accounted for a fast secondary depolarisation component, presumably resulted from homo-FRET. Our model assumes that the rotational correlation time of the dEGFP in the excited state is considerably slower than the radiative and nonradiative de-excitation rates, therefore the double exponential decay model accounts for both a slow Brownian rotational motion and a faster homo-FRET. In PBS we obtain an increased rotational for dEGFP-TD correlation time (∼23 ns) compared to the monomer. In a dimer two fluorescent proteins are bound to each other resulting in a bigger structure. The slower rotation is observed up to 25% glycerol after which our results show high uncertainty (i.e., standard deviation) with rotational correlation times that overlap those obtained for the monomer (Table 2).
Overall, the rotational correlation time for both mEGFP and dEGFP-TD increased as the glycerol concentration increased. However, at the same time, the error values in rotational correlation times analysed by exponential curve fitting also increases casting doubt on the accuracy in analysing rotational correlation times from anisotropy decay curves in a viscous environment. The homo-FRET component in the dEGFP-TD is similar amongst the glycerol concentrations at ∼1 ns time constant which manifests as the decay time for homo-FRET (Table 2).
TRFA limiting anisotropy, which is the anisotropy immediately after excitation and presumably before molecular rotation, has been widely used to study the dimerisation of various fluorescent proteins, including GFP.31 Limiting anisotropy can be used to determine the extent of dimerisation of proteins. When two proteins form a dimer, the fluorescence anisotropy of each protein can change because of energy transfer between the two proteins.
mEGFP had statistically identical limiting anisotropies across all glycerol concentrations (Table S1, ESI†). The limiting anisotropy r(0) was measured as the maximum anisotropy value after pulse excitation. In contrast, the dEGFP-TD showed a pronounced increase in limiting anisotropy with increased glycerol, indicating that there is another depolarisation dynamics happened which was faster than our instrument response function (84 ps; Fig. S1, ESI†). These results suggest ultrafast homo-FRET in these samples. This behaviour was previously observed in the yellow fluorescent protein, VenusA206, dimers and was demonstrated to be caused by ultrafast energy transfer.32 We observe the lowest limiting anisotropy (r0 = 0.30 ± 0.02) in PBS 0% glycerol where the hydrophobic patch in the FP β-barrels can presumably interact (as it does under physiological conditions), forming dimers that can optimize Coulombic dipole–dipole coupling. As the glycerol concentration was increased, the limiting anisotropy also increased which is attributed to β-barrel hydrophobic interactions weakening. Making use of this behaviour we were able to calculate the differential limiting anisotropy (Fig. 5) which allowed for the study the environmental hydrophobicity (Glycerol %) effect on the dEGFP-TD ultrafast dynamic behaviour.
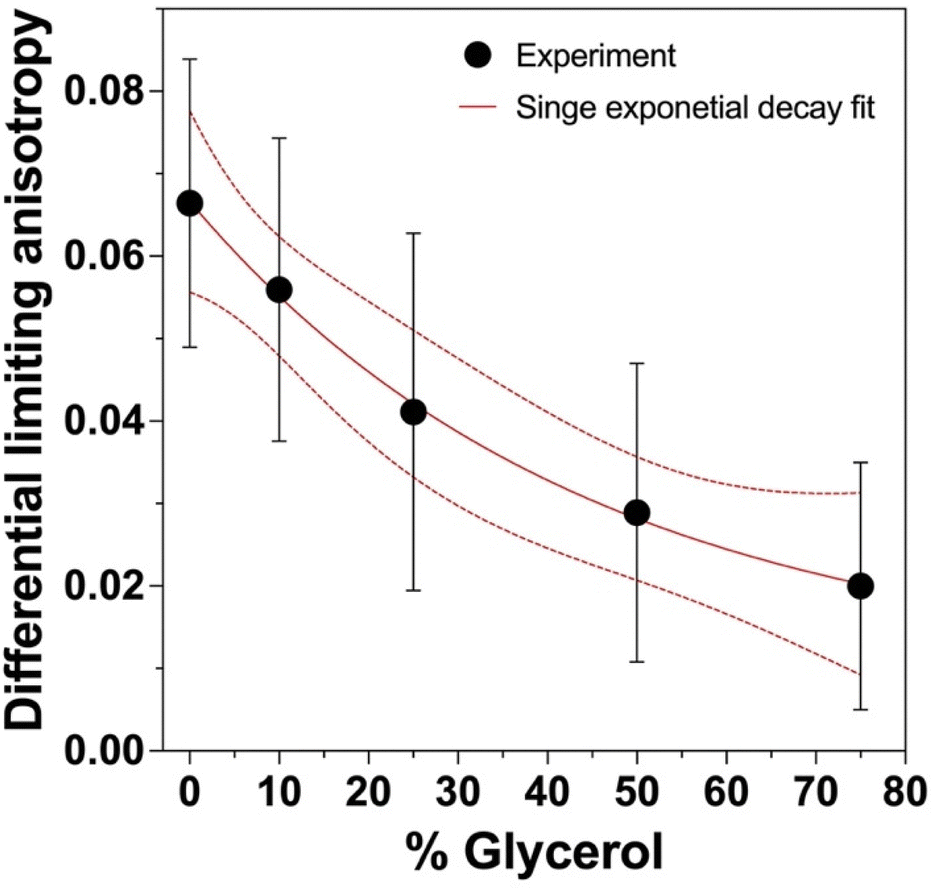 | ||
| Fig. 5 Effect of glycerol hydrophobicity on limiting anisotropy. The limiting anisotropy from dEGFP-TD was subtracted from that of mEGFP under the same conditions to obtain the differential limiting anisotropy. | ||
Discussion
Fluorescence depolarisation that can be accounted for as a drop in the limiting anisotropy or a decrease in the time-resolved anisotropy is typically caused by instrumental factors, molecular rotation, and energy transfer dynamics.17 For fluorescence anisotropy decays of fluorescent proteins, molecular rotation typically manifests as a slow decay of anisotropy. Our TRFA measurements revealed that the rotational correlation time of dEGFP-TD in PBS (22.70 ± 2.36 ns) is slower than that of mEGFP (15.92 ± 0.06 ns). This is presumably because an increased hydrodynamic volume of dEGFP-TD hindered rotational diffusion of molecule in consistent with the projected volume difference between mEGFP and dEGFP-TD. Fluorescence correlation spectroscopy (FCS) that can determine the fluorophore lateral diffusion coefficient is required to carry out for further analysis about the project volume difference.33In Fig. 2, we observed changes in absorbance at around 400 nm for both mEGFP and dEGFP-TD as the glycerol concentration increased. This result is inconsistent with the measured excitation spectra of mEGFP and dEGFP-TD, shown in Fig. S5 (ESI†). This peak is attributed to an increase of the neutral (protonated) chromophores states.34,35 These results suggest that the dEGFP-TD has a higher proportion of neutral chromophore than the mEGFP. We speculate that the absorbance decrease of the neutral chromophore is caused by the change of solvent polarity as described for wild-type GFP in ref. 36 However, the main absorption across all concentrations came from the anionic chromophore with an absorption maximum at 490 nm. As excitation was achieved with a 440 nm wavelength, we can assume that we were primarily exciting the anionic chromophore. This is reflected in the fluorescence emission spectra as shown in Fig. 2, both constructs showed indistinguishable emission spectra.
Fig. 3 shows the effect of the refractive index on the fluorescence lifetime. It was experimentally observed that the average mEGFP and dEGFP-TD fluorescence lifetime data in solution were found to be inversely proportional to the square of the refractive index. This effect on refractive index is in good agreement with the theoretical prediction of the radiative lifetime estimated from the Stricker–Berg formula37 and the previous study.23 This result leads us to conclude that dimerisation state does not affect the emission spectra nor the average time the fluorophore remains in its excited state (i.e. fluorescence lifetime).
The most prominent photophysical differences between the mEGFP and dEGFP-TD appeared when we looked at the TRFA decay curves. While the only changes observed for the mEGFP with increasing glycerol concentration was a longer rotational correlation time as previously observed in the literature,30 in contrast the dEGFP-TD displayed three unique depolarisation dynamics: (1) an ultrafast drop (faster than our IRF), (2) a fast Homo-FRET decay component (with a ∼1 ns decay constant), and (3) a much slower depolarisation decay component due to molecular rotation (Fig. 4). The ultrafast fluorescence depolarisation dynamics observed in the dEGFP-TD manifested as an instantaneous drop in the limiting anisotropy as shown in Fig. 4b because the dynamics of energy transfer between the dEGFP fluorophores was faster than the IRF of our TCSPC system, 84 ps. It is important to note that the drop in the limiting anisotropy decreased with increasing glycerol concentration, whose amplitude is inversely proportional to the fraction of dEGFP molecules that are dimerised in tandem dimers in the population. A 2.2 ps anisotropy decay time constant (corresponding to a 4.4 ps energy transfer time constant) in enhanced yellow fluorescent protein (EYFP) dimers was measured by Jung et al.32 Because the crystal structure of dEGFP is almost identical with that of EYFP, we assume that this value applies to dEGFP-TD. In addition, recent studies have shown that coherent excitonic coupling between two chromophores in a homodimer of the yellow fluorescent protein, Venus, is possible at room temperature.19,38 Thus, we speculate that energy transfer between dEGFP fluorophores in tandem dimers occurs via both homo-FRET and excitonic coupling.
To understand these results, we need to consider the physical properties of glycerol and how it can affect time-resolved anisotropy measurements. Glycerol is a simple triol compound, that when added to water (or in our case PBS) can influence three physical properties of our buffer, refractive index, viscosity and hydrophobicity. The refractive index of an optical media is a dimensionless quantity that indicates the medium's capacity to bend light. The refractive index describes how much light is bent, or refracted, as it enters a material at an angle. Since a fluorophore's fluorescence lifetime, as well as energy transfer mechanisms, can both be modulated by the refractive index of the environment, changes in refractive index might alter time-resolved anisotropy decays of monomeric fluorescent protein as well as for a tandem dimer that can homo-FRET. Viscosity is a measure of the internal friction in a fluid, therefore an increase in viscosity should attenuate the rate of molecular rotation. Thus, changes in viscosity are expected to alter the anisotropy decays of both mEGFP and dEGFP-TD. Hydrophobicity is a measure of the polarity of the solvent and its ability to form hydrogen bonds with polar components. Since glycerol is less polar than water, increasing concentrations of glycerol should reduce the probability of hydrophobic binding interactions between fluorescent proteins. Vis-à-vis changes in hydrophobicity, we expect the addition of glycerol to have little effect on mEGFP but might disturb the binding of dEGFP molecules in the dEGFP-TD.
Overall, the effect of glycerol addition on mEGFP resulted in a decrease in lifetime, increase in rotational correlation time whilst the limiting anisotropy remained the same. The decrease in fluorescence lifetime is due to the increase in refractive index as explained in the literature.23,39 The increase in rotational correlation time is affected by the viscosity of the medium as a higher internal friction of glycerol hinders the movement of the molecules. However, it was observed that the limiting anisotropy in mEGFP is insensitive to increasing glycerol concentrations.
When we compare the anisotropy decay of mEGFP with that of dEGFP-TD, a similar behaviour in fluorescence lifetime dependency and an increase in rotational correlation time were observed (Fig. 3(a) and Fig. S3, ESI†). However, unlike mEGFP, the limiting anisotropy in the dEGFP-TDs increases in response to an increase of glycerol concentration. The difference in limiting anisotropy between mEGFP and dEGFP-TD at 0% glycerol is attributed to ultrafast fluorescence depolarisation dynamics in the dEGFP-TDs occuring faster than the IRF of our TRFA system. We hypothesize that the decrease in polarity (increase in hydrophobicity) caused by addition of glycerol disrupts the dEGFP-TD hydrophobic patch, the ultrafast dynamics start disappearing, the subunits start behaving as monomers leading to an increase limiting anisotropy and approaches the limiting anisotropy of the monomers.
We note that despite the experimental similarity (444 vs. 467 nm excitation) our results for the dEGFP-TD shows noticeable differences compared to the results by Teijeiro-Gonzalez et al.30 where they used TRFA to study EGFP-TD. They studied the effect of increasing glycerol concentration such that the rotational correlation time and Homo-FRET decay were obtained but a limiting anisotropy drop was not present. There are two possible explanations for these results: (1) the 15 aa linker they used in their study is too short to support antiparallel dimerisation or (2) they used mEGFP for the construction of their TD. It is likely that the latter is more plausible as it would also explain why they observed similar rotational correlation time for the EGFP-TD and the mEGFP at low glycerol concentrations. This suggests that they might have been measuring the rotation of each monomer in their TD system and would explain their configurational illustration and TD molecular dynamics.
In this study we proposed and demonstrated a new sensing method based on ultrafast fluorescence depolarisation resulted from changes in ultrafast energy transfer dynamics within the dEGFP-TD as a function of environment hydrophobicity.
Conclusion
We have studied ultrafast energy transfer and homo-FRET of the dEGFP-TDs using a 33 amino acid flexible linker that ensures proper antiparallel dimerisation. The steady-state absorption and emission spectra of the mEGFP and dEGFP-TD showed that their ground and excited state energy levels do not change depending on the environment. Using TCSPC measurements, we observed the lifetime refractive index dependency in the mEGFP and dEGFP-TD. TRFA was used to characterise the 1 ns homo-FRET decay for the dEGFP-TD and showed an ultrafast fluorescence depolarisation. The use of glycerol to disrupt this process allows for the first use of ultrafast energy transfer dynamics to probe hydrophobicity of the environment. We envisage that genetic encoding of our hydrophobic environment sensitive probes can be used as a quantitative means of studying the dynamics and formation of biomolecular condensates, which play an important role in diverse cellular processes.6 Because our experimental results were limited by the IRF of our anisotropy system (84 ps), transient absorption spectroscopy and fluorescence upconversion spectroscopy techniques with a sub-100 fs time resolution are required to investigate further details on the chromophore collective vibrations and the oligomerisation behaviour of the EGFP32,40 that might be responsible for such ultrafast fluorescence depolarisation in the dEGEP-TD.Conflicts of interest
There are no conflicts to declare.Acknowledgements
A. S.-P. J. and Y. K. are grateful for support from the Leverhulme Trust doctoral training centre grant (DS-2017-079) and the John Templeton Foundation research grant (62210). We acknowledge helpful discussions with the members of the Leverhulme Quantum Biology Doctoral Training Centre. Y. K. is grateful for support from the Royal Society (RGS/R1/221397). This research was supported in part by the Intramural Research Program of the National Institutes of Health (NIH 1Z01 AA000452).References
- R. L. Baldwin, Proc. Natl. Acad. Sci. U. S. A., 1986, 83, 8069–8072 CrossRef CAS PubMed.
- L. Lins and R. Brasseur, FASEB J., 1995, 9, 535–540 CrossRef CAS PubMed.
- B. Alberts, A. Johnson, J. Lewis, M. Raff, K. Roberts and P. Walter, Molecular Biology of the Cell, Garland Science, 4th edn, 2002 Search PubMed.
- H. C. Lee and H. D. Bernstein, Proc. Natl. Acad. Sci. U. S. A., 2001, 98, 3471–3476 CrossRef CAS PubMed.
- H. Eom, Y. Cao, H. Kim, S. P. de Visser and W. J. Song, J. Am. Chem. Soc., 2023, 145, 5880–5887 CrossRef CAS PubMed.
- S. F. Banani, H. O. Lee, A. A. Hyman and M. K. Rosen, Nat. Rev. Mol. Cell Biol., 2017, 18, 285–298 CrossRef CAS PubMed.
- A. S. Lyon, W. B. Peeples and M. K. Rosen, Nat. Rev. Mol. Cell Biol., 2021, 22, 215–235 CrossRef CAS PubMed.
- M. Cardamone and N. K. Puri, Biochem. J., 1992, 282, 589–593 CrossRef CAS PubMed.
- L. C. Zanetti-Domingues, C. J. Tynan, D. J. Rolfe, D. T. Clarke and M. Martin-Fernandez, PLoS One, 2013, 8, e74200 CrossRef CAS PubMed.
- N. Dorh, S. Zhu, K. B. Dhungana, R. Pati, F.-T. Luo, H. Liu and A. Tiwari, Sci. Rep., 2015, 5, 18337 CrossRef CAS PubMed.
- F. Yang, L. G. Moss and G. N. Phillips, Nat. Biotechnol., 1996, 14, 1246–1251 CrossRef CAS PubMed.
- S. E. Jackson, T. D. Craggs and J. Huang, Expert Rev. Proteomics, 2006, 3, 545–559 CrossRef CAS PubMed.
- J. A. J. Arpino, P. J. Rizkallah and D. D. Jones, PLoS One, 2012, 7, e47132 CrossRef CAS PubMed.
- E. A. Rodriguez, R. E. Campbell, J. Y. Lin, M. Z. Lin, A. Miyawaki, A. E. Palmer, X. Shu, J. Zhang and R. Y. Tsien, Trends Biochem. Sci., 2017, 42, 111–129 CrossRef CAS PubMed.
- B. P. Cormack, R. H. Valdivia and S. Falkow, Gene, 1996, 173, 33–38 CrossRef CAS PubMed.
- R. P. Ilagan, E. Rhoades, D. F. Gruber, H.-T. Kao, V. A. Pieribone and L. Regan, FEBS J., 2010, 277, 1967–1978 CrossRef CAS PubMed.
- S. S. Vogel, T. A. Nguyen, P. S. Blank and B. W. van der Meer, in Advanced Time-Correlated Single Photon Counting Applications, ed. W. Becker, Springer International Publishing, Switzerland, 2015, ch. 12, vol. 111, pp. 385–406 Search PubMed.
- D. P. Millar, Curr. Opin. Struct. Biol., 1996, 6, 637–642 CrossRef CAS PubMed.
- Y. Kim, H. L. Puhl, E. Chen, G. H. Taumoefolau, T. A. Nguyen, D. S. Kliger, P. S. Blank and S. S. Vogel, Biophys. J., 2019, 116, 1918–1930 CrossRef CAS PubMed.
- P. J. Cranfill, B. R. Sell, M. A. Baird, J. R. Allen, Z. Lavagnino, H. M. de Gruiter, G.-J. Kremers, M. W. Davidson, A. Ustione and D. W. Piston, Nat. Methods, 2016, 13, 557–562 CrossRef CAS PubMed.
- V. Vagenende, M. G. S. Yap and B. L. Trout, Biochemistry, 2009, 48, 11084–11096 CrossRef CAS PubMed.
- S. Chandrasekhar, Rev. Mod. Phys., 1943, 15, 1–89 CrossRef.
- C. L. Tregidgo, J. A. Levitt and K. Suhling, J. Biomed. Opt., 2008, 13, 031218 CrossRef PubMed.
- J. M. Mullaney, R. B. Thompson, Z. Gryczynski and L. W. Black, J. Virol. Methods, 2000, 88, 35–40 CrossRef CAS PubMed.
- J. Hunt, A. H. Keeble, R. E. Dale, M. K. Corbett, R. L. Beavil, J. Levitt, M. J. Swann, K. Suhling, S. Ameer-Beg, B. J. Sutton and A. J. Beavil, J. Biol. Chem., 2012, 287, 17459–17470 CrossRef CAS PubMed.
- M. A. Uskova, J.-W. Borst, M. A. Hink, A. van Hoek, A. Schots, N. L. Klyachko and A. J. W. G. Visser, Biophys. Chem., 2000, 87, 73–84 CrossRef CAS PubMed.
- S. T. Hess, E. D. Sheets, A. Wagenknecht-Wiesner and A. A. Heikal, Biophys. J., 2003, 85, 2566–2580 CrossRef CAS PubMed.
- H. B. Lee, A. Cong, H. Leopold, M. Currie, A. J. Boersma, E. D. Sheets and A. A. Heikal, Phys. Chem. Chem. Phys., 2018, 20, 24045–24057 RSC.
- A. Volkmer, V. Subramaniam, D. J. S. Birch and T. M. Jovin, Biophys. J., 2000, 78, 1589–1598 CrossRef CAS PubMed.
- Y. Teijeiro-Gonzalez, A. Crnjar, A. J. Beavil, R. L. Beavil, J. Nedbal, A. Le Marois, C. Molteni and K. Suhling, Biophys. J., 2021, 120, 254–269 CrossRef CAS PubMed.
- I. Gautier, M. Tramier, C. Durieux, J. Coppey, R. B. Pansu, J.-C. Nicolas, K. Kemnitz and M. Coppey-Moisan, Biophys. J., 2001, 80, 3000–3008 CrossRef CAS PubMed.
- G. Jung, Y. Ma, B. S. Prall and G. R. Fleming, ChemPhysChem, 2005, 6, 1628–1632 CrossRef CAS PubMed.
- R. Rigler and E. S. Elson, Fluorescence Correlation Spectroscopy: Theory and Applications, Springer, Berlin, Heidelberg, 2001, vol. 65 Search PubMed.
- A. A. Heikal, S. T. Hess and W. W. Webb, Chem. Phys., 2001, 274, 37–55 CrossRef CAS.
- J. J. van Thor and P. M. Champion, Annu. Rev. Phys. Chem., 2023, 74, 5.1–5.22 CrossRef PubMed.
- H. Lossau, A. Kummer, R. Heinecke, F. Pöllinger-Dammer, C. Kompa, G. Bieser, T. Jonsson, C. M. Silva, M. M. Yang, D. C. Youvan and M. E. Michel-Beyerle, Chem. Phys., 1996, 213, 1–16 CrossRef CAS.
- S. J. Strickler and R. A. Berg, J. Chem. Phys., 1962, 37, 814–822 CrossRef CAS.
- M. Drobizhev, H. L. Puhl, K. Hines and S. S. Vogel, Biophys. J., 2023, 122, 540a CrossRef.
- K. Suhling, D. M. Davis, Z. Petrasek, J. Siegel and D. Phillips, Biomarkers and Biological Spectral Imaging, SPIE, 2001, vol. 4259, pp. 92–101 Search PubMed.
- R. A. Cinelli, V. Tozzini, V. Pellegrini, F. Beltram, G. Cerullo, M. Zavelani-Rossi, S. De Silvestri, M. Tyagi and M. Giacca, Phys. Rev. Lett., 2001, 86, 3439–3442 CrossRef CAS PubMed.
Footnote |
| † Electronic supplementary information (ESI) available. See DOI: https://doi.org/10.1039/d3cp01765f |
| This journal is © the Owner Societies 2023 |