 Open Access Article
Effect of oxidation on POPC lipid bilayers: anionic carboxyl group plays a major role†
Behnaz
Bagheri
 *ab,
Phansiri
Boonnoy
cd,
Jirasak
Wong-ekkabut
 cd and
Mikko
Karttunen
 ef
ef
aDepartment of Applied Physics and Science Education, Technical University of Eindhoven, PO Box 513, Eindhoven, 5600 MB, The Netherlands. E-mail: b.bagheri@tue.nl
bInstitute for Complex Molecular Systems, PO Box 513, Eindhoven, 5600 MB, The Netherlands
cDepartment of Physics, Faculty of Science, Kasetsart University, 50 Ngamwongwan Rd, Chatuchak, Bangkok, 10900, Thailand. E-mail: jirasak.w@ku.ac.th
dComputational Biomodelling Laboratory for Agricultural Science and Technology (CBLAST), Faculty of Science, Kasetsart University, 50 Ngamwongwan Rd, Chatuchak, Bangkok, 10900, Thailand
eDepartment of Chemistry, Western University, 1151 Richmond Street, London, Ontario, N6A 5B7, Canada. E-mail: mkarttu@uwo.ca
fDepartment of Physics and Astronomy, Western University, 1151 Richmond Street, London, Ontario, N6A 3K7, Canada
First published on 26th June 2023
Abstract
Phospholipids with unsaturated acyl chains are major targets of reactive oxygen species leading to formation of oxidized lipids. Oxidized phospholipids have a pronounced role in cell membrane damage. We investigated the effect of oxidation on physiological properties of phospholipid bilayers using atomistic molecular dynamics simulations. We studied phospholipid bilayer systems of 1-palmitoyl-2-oleoyl-sn-glycero-3-phosphocholine (POPC) and its two stable oxidized products, 1-palmitoyl-2-(9′-oxo-nonanoyl)-sn-glycero-3-phosphocholine (PoxnoPC) and 1-palmitoyl-2-azelaoyl-sn-glycero-3-phosphocholine (PazePC). Structural properties of the POPC lipid bilayer upon the addition of PoxnoPC or PazePC with concentration ranging from 10% to 30% were described. The key finding is that PazePC lipids bend their polar tails toward the bilayer-water interface whereas PoxnoPC lipids orient their tail toward the bilayer interior. The bilayer thickness decreases such that the thickness reduction in bilayers containing PazePC is stronger than in bilayers containing PoxnoPC. The average area per lipid decreases with a stronger effect in bilayers containing PoxnoPC. The addition of PoxnoPC makes both POPC acyl chains slightly more ordered whereas the addition of PazePC reduces the order in the two POPC acyl chains. These structural changes lead to an enhancement in the permeabilities of the bilayers containing these two oxidized products depending on the type, and the amount of oxidation. This enhancement can be achieved with a lower concentration of PazePC (10% or 15%), whereas a higher concentration of PoxnoPC (20%) is required to achieve an apparent enhancement in permeability. While the permeability of bilayers containing PazePC is higher than bilayers containing PoxnoPC in the 10–20% concentration range, by increasing the concentration of the oxidized products to higher than 20%, permeability of the bilayers containing PazePC is reduced such that it is slightly smaller than those containing PoxnoPC.
1 Introduction
Biological membranes play a central role in the control and execution of various cellular processes. Phospholipid bilayers are the building blocks of the majority of cellular membranes. Their main roles include forming a semipermeable barrier which separates the interior of a cell from its environment, protecting cells, and selectively controlling permeation of nutrients and waste in and out of cells.1 Thus, understanding structure and permeation properties of phospholipid bilayers such as thickness, membrane fluidity, and permeability upon addition of different substances is very important.The lipid composition of cellular membranes is extremely diverse. Phospholipids differ in their chain length and saturation, charge, and size of their headgroups. Phospholipids with unsaturated acyl chains are among the most important and biologically relevant lipids in eukaryotic cell membranes.1 The double bonds in the unsaturated acyl chains are prone to oxidative processes caused by reactive oxygen species (ROS, e.g., ˙OH, 1O2, H2O2, ˙O, O3, etc.).2–4 These reactions usually cause the cleavage of unsaturated acyl chains and introduce polar moieties at their terminals.5,6 This change in chemical structure of phospholipids perturbs the bilayer structure and modifies their physiological properties, the effects of which can trigger mitochondrial damage7 or mediate various disease such as Parkinson's, Alzheimer's,8–12 schizoprenia,13 atherosclerosis,13,14 inflammatory diseases,15etc. Nonetheless, inducing apoptotic cell death by delivering ROS to cells in a controlled and selective fashion is the basis of cold (room temperature) plasma therapy.16,17 Cold plasma is an emerging technology which is being investigated for wound healing,18,19 treatment of skin related disorders20,21 and a variety of cancer types.22–24 The main phospholipid in all mammalian cells (40–50%) and lipoprotein particles is phosphatidylcholine (PC). Therefore, most oxidized phospholipids detected in mammalian tissues contain the choline moiety.25–27 1-palmitoyl-2-oleoyl-sn-glycero-3-phosphocholine (POPC) is an example of monosaturated lipid with one saturated 16![[thin space (1/6-em)]](https://www.rsc.org/images/entities/char_2009.gif) :
:![[thin space (1/6-em)]](https://www.rsc.org/images/entities/char_2009.gif) 0 fatty acid chain (sn-1) and one unsaturated 18
0 fatty acid chain (sn-1) and one unsaturated 18![[thin space (1/6-em)]](https://www.rsc.org/images/entities/char_2009.gif) :
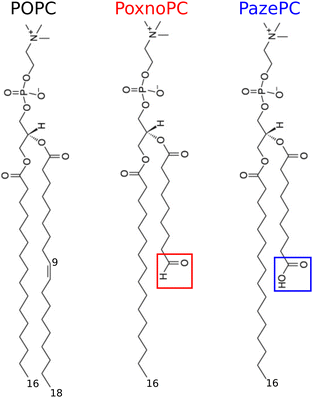
:![[thin space (1/6-em)]](https://www.rsc.org/images/entities/char_2009.gif) 1 fatty acid chain (sn-2) with two ester carbonyls,1,28,29 see Fig. 1 for its chemical structure. POPC can be oxidized at the double bond of its unsaturated (sn-2) fatty acid chain leading to two stable products: PoxnoPC (1-palmitoyl-2-(9′-oxo-nonanoyl)-sn-glycero-3-phosphocholine) and PazePC (1-palmitoyl-2-azelaoyl-sn-glycero-3-phosphocholine) bearing aldehyde and carboxyl groups at the end of their truncated sn-2 chains, respectively. At neutral pH, the aldehyde group of PoxnoPC and the carboxyl group of PazePC are neutral and negative (anionic), respectively.26,30 Chemical structure of PoxnoPC and PazePC are shown in Fig. 1. PoxnoPC can be produced by the reaction of ozone with lung surfactant extract as a product of the ozonolysis of the unsaturated chain at carbon-9.31 PazePC is involved in the genesis of atherosclerosis and has been identified in oxidized LDL particles.32 These two oxidation products are also found in POPC bilayers after treating by cold plasma where the plasma-treated POPC bilayer shows full permeability.33
1 fatty acid chain (sn-2) with two ester carbonyls,1,28,29 see Fig. 1 for its chemical structure. POPC can be oxidized at the double bond of its unsaturated (sn-2) fatty acid chain leading to two stable products: PoxnoPC (1-palmitoyl-2-(9′-oxo-nonanoyl)-sn-glycero-3-phosphocholine) and PazePC (1-palmitoyl-2-azelaoyl-sn-glycero-3-phosphocholine) bearing aldehyde and carboxyl groups at the end of their truncated sn-2 chains, respectively. At neutral pH, the aldehyde group of PoxnoPC and the carboxyl group of PazePC are neutral and negative (anionic), respectively.26,30 Chemical structure of PoxnoPC and PazePC are shown in Fig. 1. PoxnoPC can be produced by the reaction of ozone with lung surfactant extract as a product of the ozonolysis of the unsaturated chain at carbon-9.31 PazePC is involved in the genesis of atherosclerosis and has been identified in oxidized LDL particles.32 These two oxidation products are also found in POPC bilayers after treating by cold plasma where the plasma-treated POPC bilayer shows full permeability.33
The effect of PazePC and PoxnoPC on the monolayer properties of 1,2-dipalmitoyl-sn-glycero-3-phosphocholine (DPPC) were investigated using Langmuir balance by Sabatini et al.34 where the possibility of sn-2 chain reversal of these two oxidized products toward the aqueous interface was suggested. This was further studied in association with permeability of cationic protein cytochrome c in micelles composed of these oxidized lipids.35 As such, functional role of PoxnoPC and PazePC in serving as potential drug targets for antimicrobial peptides and antipsychotic compounds in cells under oxidative stress has proposed.36,37 To get microscopic insight into their structural properties, molecular dynamics (MD) simulations of POPC bilayer systems containing these oxidized lipids have also been performed.38,39 These studies differ in the system sizes, force field parameters, simulation times, and the concentration of oxidized products present in the bilayer.
In this work, we employ MD simulations to study the effect of lipid oxidation on the properties of POPC bilayer in a systematic manner. We describe structural modifications of the POPC bilayer upon the addition of PoxnoPC or PazePC at five concentrations ranging from 10% to 30% with the aim of characterizing the relation between membrane permeability and structural modifications. Our main finding is that the carboxyl group of PazePC lipids is located at the aqueous interface for all five concentrations, confirming the so-called extended conformation of PazePC sn-2 chains postulated by experiments.34–37 This is accompanied by a reduction in the bilayer thickness, and the POPC chain order. Area per lipid decreases upon addition of 10% PazePC, however it remains almost constant by further increase in concentration up to 30%. On the contrary, the aldehyde group of PoxnoPC lipids is located in the inner part of the bilayer. Upon the addition of PoxnoPC to the POPC bilayer, the thickness of bilayers decreases, but not as strongly as upon the addition of PazePC; the POPC chain order increases slightly, and the area per lipid decreases. These structural modifications lead to an increase in permeability of water molecules through the bilayers containing these two oxidized products depending on the type, and the amount of oxidation (PazePC or PoxnoPC). A lower concentration of PazePC (10% to 15%) leads to an enhancement in permeability, whereas a concentration of 20% PoxnoPC is required to achieve a noticeable enhancement. While bilayers containing PazePC have a larger permeability than bilayers containing PoxnoPC in the 10–20% concentration range, increasing the concentration to more than 20% results in a reduction in permeability of bilayers containing PazePC to slightly smaller than those containing PoxnoPC.
The rest of this article is organized as follows: the simulation parameters and methods are described in Section 2. It is followed by the analysis of structural properties of the pure POPC bilayer, and bilayers with various concentrations of PoxnoPC or PazePC in Section 3. Section 5 provides a discussion and comparison of the results to those reported in literature. Finally, concluding remarks are presented in Section 6.
2 Methods
A series of MD simulations of bilayers containing pure POPC and binary mixtures of POPC with 10%, 15%, 20%, 25%, and 30% oxidized POPC (PazePC or PoxnoPC) was performed. Each of the bilayers was composed of a total of 512 lipid molecules. In each bilayer with a non-zero concentration of oxidized lipids, a number of POPC lipids were replaced by oxidized ones such that each of the two leaflets contained the same number of oxidized lipids. Details of the systems are shown in Table 1.| System | Total No. PLs | No. POPC | No. oxidized PLs | No. SOL | No. Na+ |
|---|---|---|---|---|---|
| 100% POPC | 512 | 512 | 0 | 25![[thin space (1/6-em)]](https://www.rsc.org/images/entities/char_2009.gif) 600 600 |
— |
| 10% PoxnoPC | 512 | 460 | 52 | 25![[thin space (1/6-em)]](https://www.rsc.org/images/entities/char_2009.gif) 600 600 |
— |
| 15% PoxnoPC | 512 | 435 | 77 | 25![[thin space (1/6-em)]](https://www.rsc.org/images/entities/char_2009.gif) 600 600 |
— |
| 20% PoxnoPC | 512 | 408 | 104 | 25![[thin space (1/6-em)]](https://www.rsc.org/images/entities/char_2009.gif) 600 600 |
— |
| 25% PoxnoPC | 512 | 384 | 128 | 25![[thin space (1/6-em)]](https://www.rsc.org/images/entities/char_2009.gif) 600 600 |
— |
| 30% PoxnoPC | 512 | 358 | 154 | 25![[thin space (1/6-em)]](https://www.rsc.org/images/entities/char_2009.gif) 600 600 |
— |
| 10% PazePC | 512 | 460 | 52 | 25![[thin space (1/6-em)]](https://www.rsc.org/images/entities/char_2009.gif) 548 548 |
52 |
| 15% PazePC | 512 | 435 | 77 | 25![[thin space (1/6-em)]](https://www.rsc.org/images/entities/char_2009.gif) 523 523 |
77 |
| 20% PazePC | 512 | 408 | 104 | 25![[thin space (1/6-em)]](https://www.rsc.org/images/entities/char_2009.gif) 496 496 |
104 |
| 25% PazePC | 512 | 384 | 128 | 25![[thin space (1/6-em)]](https://www.rsc.org/images/entities/char_2009.gif) 472 472 |
128 |
| 30% PazePC | 512 | 358 | 154 | 25![[thin space (1/6-em)]](https://www.rsc.org/images/entities/char_2009.gif) 446 446 |
154 |
The simulations were preformed using the Groningen Machine for Chemical Simulation (GROMACS) version 2021.340 and Gromos54a741 force field with parameters and protocol described in ref. 42–48. The GROMOS united atom force field has been tested and successfully applied in different biomolecular applications, such as protein folding, biomolecular association, membrane formation, transport over membranes, and protein–lipid nanodisks.49 One of the advantages of a united atom force field is that the total number of atoms is significantly smaller than in all-atom simulations. United atom force fields can be considered to be of atomic resolution since, typically, only essential hydrogens are kept while others are integrated in the descriptions of carbons they are covalently bound. It should also be noted that in a typical all-atom simulation in which all the hydrogens are included, one typically constrains the hydrogens. This, given the success of this united atom force field, and that it allows for simulations of significantly larger systems and time scales were the main drivers for our choice of force field. The atomic coordinates and united atom parameters of the POPC lipids were taken from Poger and Mark.50,51 The atomic coordinates and the united atom parameters of the PazePC and PoxnoPC lipids were determined using the Automated Topology Builder.52,53
After energy minimization using the steepest descents algorithm, the MD simulations were run for 1 μs with a time step of 2 fs. All simulations were performed in the constant number of atoms, pressure, and temperature (NPT) ensemble. The temperature was set to 300 K by the velocity-rescale algorithm54 which was applied separately to the lipids and water (ions were grouped with water) with a time constant of 0.1 ps. The pressure was kept constant at 1 bar by applying a semi-isotropic pressure using the Parrinello–Rahman algorithm55 with a time constant of 3 ps and compressibility of 4.5 × 10⁻⁵ bar−1. Periodic boundary conditions were applied in all dimensions. All bond lengths were constrained using the parallel linear constraint solver (P-LINCS) algorithm.56 A cutoff of 1.0 nm was used for the Lennard-Jones and the real space part of the electrostatic interactions. The particle–mesh Ewald method57,58 was used to compute the long-range part of the electrostatic interactions with a 0.12 nm grid in the reciprocal-space and cubic interpolation of 4. Water molecules were modelled using the simple point charge (SPC)59 model. Sodium counterions Na+ were added to the systems containing PazePC to retain overall charge neutrality. Visual Molecular Dynamic (VMD) software60 was used for snapshots.
3 Analysis & results
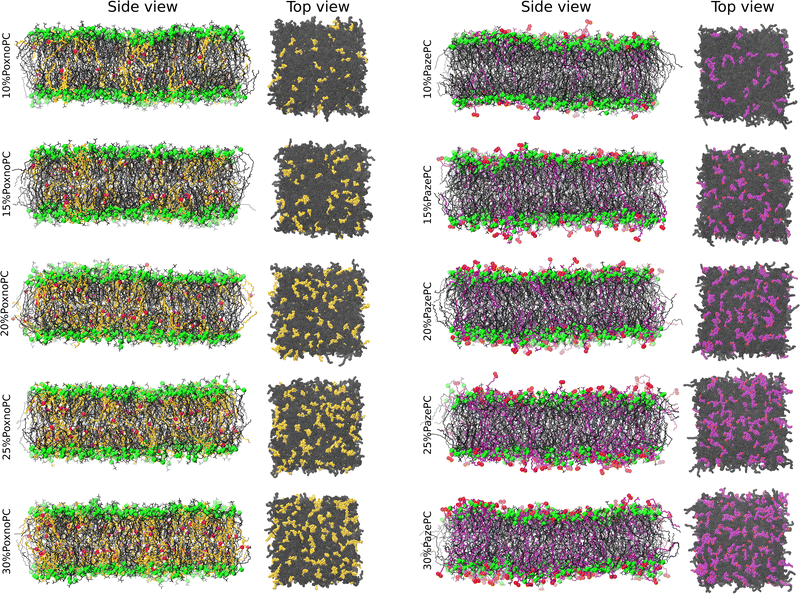
Fig. 2 and 3 show snapshots of the bilayers and representative orientations of the lipids, respectively. In the analysis below, the final 500 ns of simulations (500–1000 ns), allowing the first 500 ns of each independent simulation to be an equilibrium period, was used. Approach to equilibrium was monitored by measuring the leveling-off of the bilayer thickness and the area per lipid (see Fig. S1–S3, ESI†).3.1 Bilayer thickness
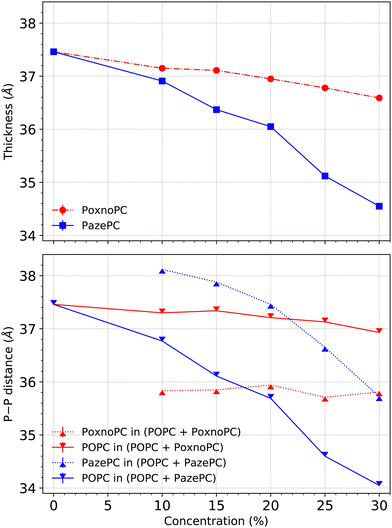
Bilayer thickness was measured based on the positions of the phosphorous (P) atoms in the lipid headgroups. Fig. 4 shows the average bilayer thickness of the POPC bilayer upon the addition of PoxnoPC or PazePC at various concentrations in the top part. The bilayer containing pure POPC had a thickness of about 37.5 Å in good agreement with previous studies.61 The thickness became reduced upon the addition of oxidized products (PazePC or PoxnoPC) such that bilayers with PazePC lipids had a smaller thickness than bilayers containing PoxnoPC lipids. In the case of 30% oxidation, the thickness was reduced to about 34.6 Å and 36.6 Å for PazePC and PoxnoPC, respectively.In the bottom part of Fig. 4, the average P–P distance of each lipid type (POPC and PazePC/PoxnoPC) is plotted for the POPC bilayers containing various concentrations of PazePC or PoxnoPC. In the bilayers containing PazePC, the positions of the PazePC headgroups were higher than the positions of the POPC headgroups as P–P distance of PazePC lipids was larger than P–P distance of POPC lipids. By increasing the concentration of PazePC, P–P distance of both the PazePC and POPC lipids were reduced. However, in bilayers containing PoxnoPC lipids, the positions of the POPC headgroups were higher than the positions of PoxnoPC lipids. Increasing the concentration of the PoxnoPC did not have any major influence on the P–P distance of either of the lipid types.
3.2 Area per lipid
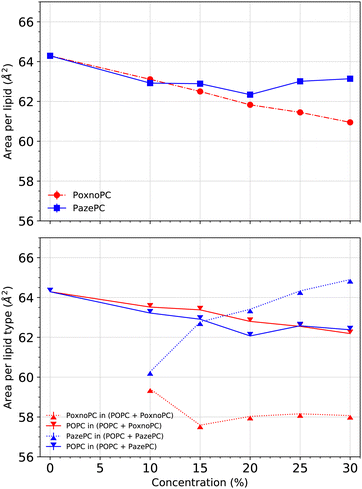
We calculated the area per lipid using the LiPyphilic62 analysis tool which utilizes 2D Voronoi tessellation63 and the locality module of the Freud software package.64 Each of the lipids was assigned to one of the two leaflets, and then the areas were calculated for each lipid type. The phosphorous atoms were used as lipid headgroup identifiers.Fig. 5 (top) shows the average area per lipid. When the concentration of PoxnoPC was increased, the average area per lipid decreased. The average area per lipid for pure POPC bilayer was about 64.3 Å2, while it was reduced to about 61.0 Å2 in the 30% PoxnoPC bilayer. Upon addition of 10% PazePC to the POPC bilayer, the average area per lipid decreased to about 63.1 Å2. Further increase in the concentration of PazePC up to 30% did not have any major influence. The bottom of Fig. 5 shows the average area per each lipid type. The average area per POPC was decreased upon the addition of oxidized lipids such that the decrease was almost independent of the type of oxidation, and, rather, dependent on the level of oxidation. In the POPC bilayers containing PoxnoPC, the average area per PoxnoPC was smaller than the average area per POPC such that it was about 59.4 Å2 at 10% PoxnoPC concentration. Further increase in the PoxnoPC concentration up to 30% did not affect it. On the contrary, in the POPC bilayers containing PazePC the average area per PazePC was increased upon concentration such that it was about 60.3 Å2 for the 10% PazePC bilayer and 65.0 Å2 in the 30% PazePC bilayer.
3.3 Deuterium order parameter
The order parameter per carbon for each acyl chain was computed using | (1) |
Fig. 6 shows SCD for the POPC sn-1 (top) and sn-2 (bottom) chains in the pure POPC bilayer and the bilayers containing PoxnoPC and PazePC oxidized products. The addition of PoxnoPC leads to slight increases of order in both of the POPC chains. However, the addition of PazePC decreases order in both the POPC chains. Fig. 7 shows the averaged order parameter as a function of oxidized lipid concentration. Overall, the addition of PoxnoPC increases order in both of the chains, whereas the addition of PazePC decreases POPC chain order. Moreover, the POPC sn-1 chain is more ordered than the POPC sn-2 chain.
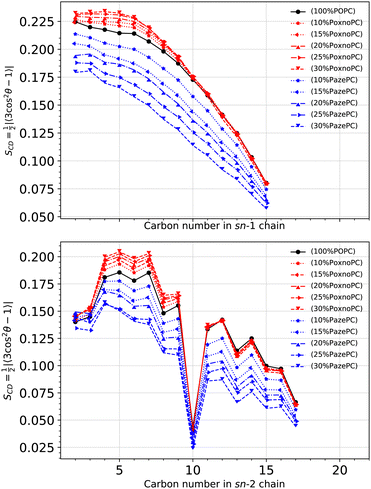 | ||
| Fig. 6 Deuterium order parameter for each carbon atom in the sn-1 (top) and sn-2 (bottom) POPC chains at different concentrations of oxidized lipids. The deuterium order parameter is calculated according to eqn (1). | ||
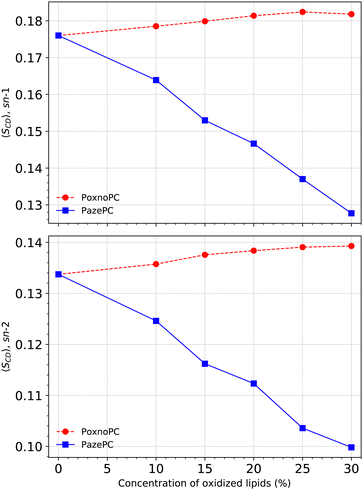 | ||
| Fig. 7 Averaged deuterium order parameter along the sn-1 (top) and the sn-2 (bottom) lipid chains at different concentrations. | ||
S CD for the PoxnoPC and PazePC sn-1 and sn-2 chains are plotted in Fig. 8. The PazePC sn-1 chain is less ordered than the PoxnoPC sn-1 chain. The PazePC sn-1 chain order becomes reduced as the concentration of PazePC increases. Increasing the concentration of PoxnoPC, however, does not influence its sn-1 chain order. For the PoxnoPC sn-2, the chain order increases by increasing the concentration which in turn induces slightly more order in the POPC acyl chains (see Fig. 6). On the contrary, by increasing the PazePC concentration, the order parameter of the carbon atoms 2–5 in the sn-2 chain increases with almost no effect on carbons 6–8. The ordering of the end carbon atoms (6–8) of the PazePC sn-2 chain supports the strong affinity of the anionic carboxyl group toward aqueous phase.
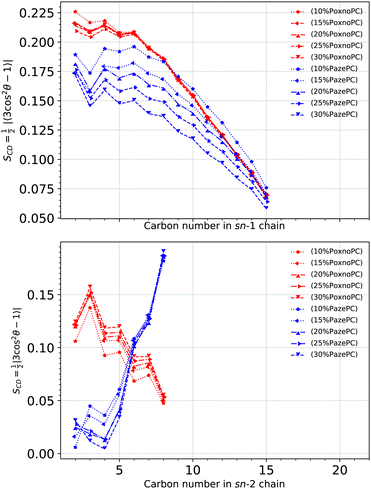 | ||
| Fig. 8 Deuterium order parameter for each carbon atom in the sn-1 (top) and sn-2 (bottom) chains of PoxnoPC and PazePC at different concentrations. The deuterium order parameter is calculated according to eqn (1). | ||
3.4 Density distribution of lipid components and water
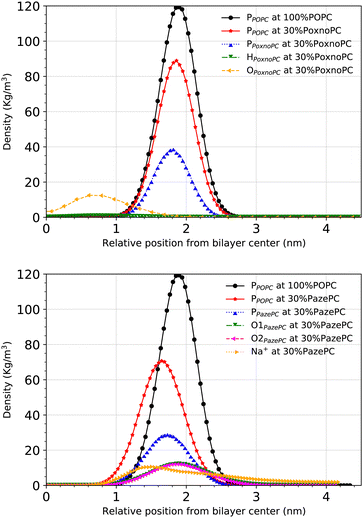
Partial densities of the lipid headgroups and the oxidized groups across the simulation box were calculated using the gmx density tool. The phosphorous (P) atoms were used as lipid head identifiers. The hydrogen (H) and oxygen (O) atoms were used as identifiers for PoxnoPC aldehyde group. The two oxygen atoms (O1 and O2) were used as identifiers for the PazePC carboxylic group.Fig. 9 shows the partial densities of the lipid headgroups and the components of the oxidized groups across the simulation box for bilayers containing 30% PoxnoPC (top) and PazePC (bottom), respectively. Fig. S4 (ESI†) also shows the density profiles of the POPC bilayers at 10%, 15%, 20%, and 25% PazePC and PoxnoPC. The aldehyde group of PoxnoPC is typically located in the interior part of the bilayer. The PazePC carboxylic group, however, prefers the bilayer–water surface. This is also evident from the snapshots in Fig. 2 and 3 where typical orientations of POPC and PoxnoPC and PazePC are presented. The sn-2 chain of PoxnoPC typically points toward the bilayer interior ((a) orientation in Fig. 3) and occasionally locates at the bilayer-water surface ((b) orientation in Fig. 3). The PazePC sn-2 chain, however, adapts the so-called extended conformation34,67 with the carboxylic group in the water phase or at the bilayer-water surface ((c) and (d) orientations in Fig. 3). In systems containing PazePC, the carboxylic groups are highly polar and able to form strong hydrogen bonds with the water molecules, and they prefer to stay at the interface. On the other hand, the aldehyde lipid tails are significantly more mobile than the carboxylic ones. The locations of the functional groups in the oxidized tails are in agreement with previous studies of oxidized PLPC bilayers.46,47
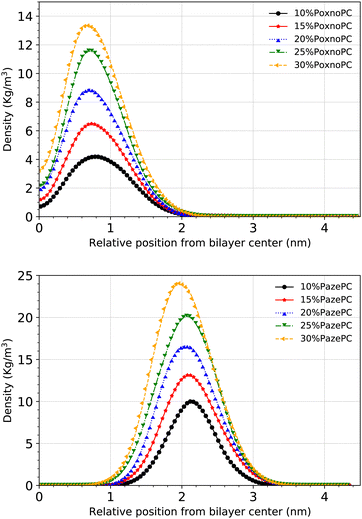
Fig. 10 shows the densities of the aldehyde and carboxylic functional groups across the simulation box for the POPC bilayer with various concentrations of PoxnoPC (top) or PazePC (bottom). By increasing the PoxnoPC concentration from 10% to 30% in the POPC bilayer, the location of the aldehyde functional group was shifted toward the bilayer center. A similar trend was appeared when the concentration of PazePC was increased from 10% to 30% in the POPC bilayer: the location of the carboxylic functional group was shifted slightly toward the bilayer interior.
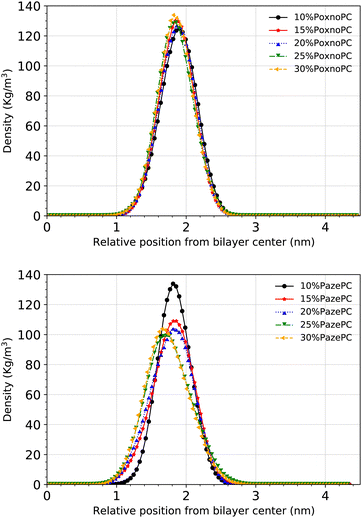
The density of the phosphorous atoms of the bilayers containing various concentrations of PoxnoPC or PazePC is plotted in Fig. 11. While the position of the lipid headgroups for the bilayers containing PoxnoPC lipids remain almost unaffected (for all the concentrations), it is moved slightly toward the center of the bilayer for the bilayers containing 25% and 30% PazePC lipids. This can be seen in Fig. 4 as well, where the average P–P distance is plotted in the bottom.
The average P–P distance of the PoxnoPC and POPC lipids did not vary as the concentration of PoxnoPC was increased. For the bilayers containing PazePC, however, the distance was reduced as the concentration of PazePC were increased. This, in turn, can be attributed to the position of the oxidized functional groups depending on whether they are located in the bilayer interior (Fig. 3(a)), in the water (Fig. 3(c)), or the headgroup region (Fig. 3(b and d)). As the PazePC concentration were increased to higher than 25%, the positions of the PazePC carboxylic groups were shifted from the water phase to the headgroup region. The latter distorts the positions of all the other headgroups which resulted in a reduction in bilayer thickness. On the contrary, with the PoxnoPC aldehyde group locating in the bilayer interior, the locations of lipid headgroups remain almost unaffected.
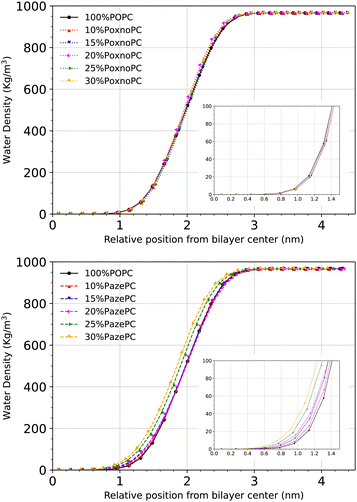
Fig. 12 shows the density distribution of the water molecules across the simulation box. The penetration depth depends on the type of oxidation. Upon the addition of 25% or 30% PazePC to the POPC bilayer, there is a visible enhancement in the penetration depth of the water molecules. The addition of PoxnoPC up to 30%, however, has no influence on the density distribution of water molecules across the simulation box.
4 Water permeability
We calculated the permeability of water molecules through the membrane bilayer by direct counting as in ref. 68 and 69. For each system, the last 500 ns trajectory is divided into 20 ns intervals. The number of water molecules which diffuse across the bilayer is counted during each of these intervals, providing a rate (Rt). Permeability is calculated by RtVw/NA in which Vw is the average volume of a single water molecule (equals to 18 cm3 mol−1), and NA is the Avogadro's number. Then we take the average over all the intervals. The result is plotted in Fig. 13 in which the standard error is used to estimate the error bars.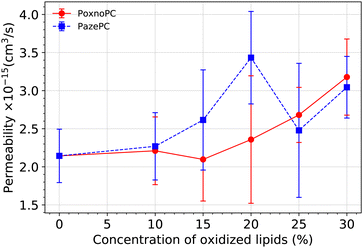 | ||
| Fig. 13 Permeability of water molecules through the bilayer at various concentration of oxidized lipids. The error bars are calculated based on standard error. | ||
Overall, the permeability of the POPC bilayer is increased upon the addition of oxidized products to the bilayer, the magnitude depending on the type and amount of oxidation. While the bilayer permeability is enhanced upon the addition of 10% or 15% PazePC to the POPC bilayer, a concentration of 20% of PoxnoPC is required to achieve an enhancement in the bilayer permeability. Although by increasing the concentration of PoxnoPC to higher than 20% the permeability is increased monotonically, there is a reduction when the concentration of PazePC is increased from 20% to 25%. At 25%, and 30% concentrations, the permeability of the bilayer containing PazePC is slightly smaller than the bilayer containing PoxnoPC. This is correlated with the position of the PazePC carboxylic groups and the PoxnoPC aldehyde groups (see Fig. 10), and the position of lipid headgroups (see Fig. 11) as their concentration in the bilayer is increased. While the position of PoxnoPC aldehyde groups monotonically shifts more toward the bilayer center, at 25% concentration the position of PazePC carboxylic group at the membrane-water interface shifts slightly more toward the water phase (slight increase in the area per lipid, see Fig. 5). At 30% concentration it again shifts slightly back toward the headgroup position. This, as well, can be seen from Fig. 11 where density distributions of all the phosphorous atoms along the z-axis with respect to the distance from the bilayer center is plotted. At 25% and 30% concentration of PazePC, the position of phosphorous atoms shifts slightly toward the center compared to systems with 10%, 15%, and 20% PazePC concentration.
5 Discussion
Kinnunen67 introduced extended conformation of lipids while describing qualitative models for the molecular mechanism of the fusion of lipid bilayers and for the lamellar-hexagonal (Lα → HII) phase transition. The main feature connecting these models was a hypothetical lipid conformation referred to as the extended conformation which could manifest itself at the contact site between two vesicles such that involves the extension of acyl chains of a phospholipid molecule in opposite directions while maintaining the headgroup in the interface. The importance of the extended conformation of lipids is that it allows for the fusion of two bilayer membranes to proceed with minimal exposure of the lipid hydrocarbon acyl chains to water. The energetic basis of this conformation was explained to arise from mitigating packing constraints due to geometric imbalance of the relative sizes of the hydrophobic and hydrophilic parts of the molecule. Later Sabatini et al.34 postulated the possibility of sn-2 chain reversal of PazePC and PoxnoPC toward the aqueous interface when the effect of these two lipids on the monolayer properties of DPPC were investigated using Langmuir balance, and it was concluded that both oxidized lipids expand the monolayers with a stronger expansion in monolayers containing PazePC. This was further studied in association with permeability of cationic protein cytochrome c in micelles composed of these lipids.35 As such, functional roles for PoxnoPC and PazePC in serving as potential drug targets for antimicrobial peptides and antipsychotic compounds in cells under oxidative stress was suggested.36,37 In another experiment,70 effect of PazePC on the model lipid rafts monolayer systems of ternary lipid mixtures of POPC, sphingomyelin (SM), and cholestrol were investigated where larger (more than 35%) molecular area of PazePC monolayer compared to POPC monolayer was attributed to the possible reversal of the PazePC sn-2 chain. Furthermore, it was concluded that the PazePC lipids efficiently opposes the miscibility transition and stabilizes micron-sized domain separation.70Khandelia and Mouritsen38 performed MD simulations to explore the possibility of chain reversal in oxidized phospholipids in bilayer containing binary mixtures of POPC with various concentrations (up to 25%) of PazePC or PoxnoPC during 100 ns simulation time (compared to 1 μs in our simulations) with Berger et al.71 force fields. The total number of lipids (POPC + oxidized) in their simulations was 128 (compared to 512 in our simulations). They concluded that the anionic chain of PazePC undergoes chain reversal, and its carboxyl group points into water which is in agreement with our results. However, they reported that PoxnoPC sn-2 tail adapts parallel conformation to the bilayer-water interface. This is contrary to our results. As discussed in Section 3.4 sn-2 tails of the PoxnoPC lipids are located in the interior part of the bilayer for all concentrations (10%, 15%, 20%, 25% and 30%).
The results of Khandelia and Mouritsen38 revealed an overall decrease in the average bilayer thickness with increasing the concentration of oxidized lipids. This is in agreement with our results. However, contrary to our results, bilayers containing PazePC lipids have a larger thickness than bilayers containing PoxnoPC: 36.2 Å (PazePC) compared to 34.60 Å (PoxnoPC) for the system with 25% oxidation. Thickness of about 38.2 Å was measured for the pure POPC bilayer. Our simulations predict a thickness of 35.1 Å for PazePC and 36.8 Å for PoxnoPC for the bilayer with 25% oxidation.
The discrepancy between our results and the results of Khandelia and Mouritsen38 is more reflected in the average area per lipids. According to Khandelia and Mouritsen,38 presence of PoxnoPC lipids in bilayers increases average area per lipids. However, presence of PazePC up to 6% decreases the average area per lipid while it remains unaffected by further increasing the concentration of PazePC to 12.5% or 25%. For the bilayer containing 25% PoxnoPC, the area per lipid is about 69.11 Å2 whereas for the bilayer containing PazePC, it is about 64.57 Å2. The average area per lipid for the pure POPC bilayer is about 65.5 Å2. Our simulations predict an area per lipid of about 64.3 Å2 for pure POPC, 63.0 Å2 for POPC − 25% PazePC, and 61.5 Å2 for POPC − 25% PoxnoPC bilayers.
Although the simulation results of Khandelia and Mouritsen,38 in particular the sn-2 chain reversal of both PoxnoPC and PazePC and the area per lipids of PoxnPC, seem to be in agreement with the postulated model of Sabatini et al.,34 their results of area per lipids for PazePC are in conflict with this model as areas are reduced upon the addition of PazePC to the bilayer. While computational bilayer models are not directly comparable to monolayer experiments, the authors in ref. 38 attributed this conflict to the presence of sodium counterions in the simulations.
In another study, Schumann-Gillett and O'Mara39 simulated POPC bilayers containing 10% PoxnoPC or PazePC (in total 140 lipids) for 0.5 μs using a modified force field by Poger and Mark50,51 with the focus of investigating the effect of 10% oxidation or 20% cholesterol concentration on structural properties of POPC bilayers. Their simulations predict extended conformation of the PazePC sn-2 tail pointing into the water phase, and orientation of the PoxnoPC sn-2 tail towards the bilayer center; in agreement with our results. According to Schumann-Gillett and O'Mara,39 incorporating 10% PazePC or PoxnoPC does not have a strong effect on the average bilayer thickness of systems with total 140 lipids. According to our results, bilayer thickness is reduced by about 1.5% and 0.8% upon the addition of 10% PazePC or PoxnoPC to POPC bilayer, respectively. Schumann-Gillett and O'Mara39 report a slight decrease in the area per lipid due to presence of oxidized products. Accordingly, the area per POPC for a pure bilayer is 60.4 Å2 ± 0.9 Å2. Upon the addition of 10% PoxnoPC or PazePC to the bilayer, the area per POPC is reduced to values 59.0 Å2 ± 1.0 Å2 and 58.1 Å2 ± 0.8 Å2, respectively. According to our results, the average area per lipid in the pure POPC bilayer is about 64.3 Å2 where it is reduced to about 63.5 Å2 for the POPC − 10% PoxnoPC bilayer and 63.2 Å2 for the POPC − 10% PazePC bilayer. These discrepancies between our results and those of Schumann-Gillett and O'Mara39 might be due to the low number of total lipids (140) which was used in their simulations. The system size is an important and understudied matter. The importance of size and the emergence of finite size effects have been recently demonstrated in the context of the bilayer ripple phase by Walter et al.72 and Davis et al.73
Bernova et al.74 studied properties of phospholipid bilayers containing mixtures of POPC and 10% PGPC or 10% POVPC using fluorescence spectroscopy and molecular dynamics simulations with Berger et al.71 force field. PGPC and POVPC are anionic and zwitterionic oxidized products of POPC in which the carbon 5 atom of the sn-2 acyl chain is truncated by carboxyl or aldehyde groups, respectively. Their bilayer systems contained 128 lipids which were equilibrated for 100 ns. In agreement with our results, they reported chain reversal of the negatively charged PGPC sn-2 chain into water. The sn-2 acyl chain with neutral but polar aldehyde terminal group reorients in all directions with a strong reduction in the 180 tilt angle region (180 tilt angle corresponds to a chain oriented completely parallel to the membrane normal and toward bilayer interior, 0 tilt angle characterises a chain pointing toward the water phase). In bilayers containing POPC and 10% PGPC studied by Bernova et al.,74 the membrane becomes more compact due to the removal of the sn-2 chains from the bilayer interior resulting in a decrease in the area per lipid to a value of 61 Å2, whereas the area per lipid calculated for pure POPC is about 66 Å2. In the case of POVPC enriched bilayers, no reduction in the area per lipid was observed. According to their simulations, POVPC adapts a combination of fully reversed sn-2 chains or sn-2 chains parallel to the membrane surface. While fully reversed chains cause membrane compactness, the parallel orientation of chains to the membrane surface leads to area expansion. In the case of POVPC, these two competing factors seem to cancel each other out. In agreement with our results, in bilayers containing POPC and 10% POVPC studied by Bernova et al.,74 a distinctive deeper water penetration into the bilayers was observed.
Our results of deuterium order parameter for pure POPC are in excellent agreement with those of Piggot and coworkers66 and Schumann-Gillett and O'Mara.39 Larger order parameter indicate straighter lipid chains, and are associated with the biophysical liquid ordered phase. Upon the addition of PoxnoPC to bilayers, the lipid chains tend to become slightly more ordered, whereas the addition of PazePC induces more disorder to the chains. While the latter agrees with Khandelia and Mouritsen,38 they predict more disorder upon the addition of PoxnoPC. Schumann-Gillett and O'Mara's results39 predict a lesser effect on the order parameter by the addition of 10% PazePC or PoxnoPC. In addition, the results of deuterium order parameter for PazePC and PoxnoPC chains are in good agreement with Schumann-Gillett and O'Mara39 and Ferreira et al.75
6 Conclusions
We have presented results of atomic scale MD simulations of bilayers containing pure POPC and its binary mixtures with 10%, 15%, 20%, 25%, and 30% PazePC or PoxnoPC. Our results show that even a modest addition (10%) of PazePC or PoxnoPC to the POPC bilayer has major influence on its structural properties:• The POPC bilayer thickness decreases upon the addition of oxidized lipids (PazePC/PoxnoPC) such that bilayers containing PazePC have a smaller thickness than bilayers containing PoxnoPC. In bilayers containing PoxnoPC, the POPC headgroups are located higher than the PoxnoPC headgroups. On the contrary, the PazePC headgroups are located higher than the POPC headgroups in the bilayers containing PazePC.
• The average area per lipid decreases upon the addition of PoxnoPC to bilayers. By adding 10% PazePC to the POPC bilayer, the average area per lipid decreases. However, it remained almost unchanged by further increase in the concentration up to 30%. The average area per POPC decreases upon the addition of oxidized lipids such that is almost independent of the type of oxidation. While increasing the concentration of PazePC increases its average area, increasing concentration of PoxnoPC has little effect on it.
• The addition of PoxnoPC to POPC bilayer induces slightly more order to both POPC chains, whereas the addition of PazePC decreases POPC chain order.
• The PazePC carboxylic group is located at the water–bilayer interface; indicating an extended conformation of PazePC sn-2 chain pointing towards aqueous phase, whereas the PoxnoPC aldehyde group is located in the interior part of bilayer.
The above structural changes in bilayers containing PazePC or PoxnoPC lead to a distinctive increase in permeability of water molecules across the bilayer which depends on the type, and the level of oxidation. While a concentration of 10% or 15% PazePC increases the permeability, a concentration of at least 20% PoxnoPC is required to induce a visible enhancement in the bilayer permeability. In the 10–20% range concentration, the permeability of bilayers containing PazePC is larger than bilayers containing PoxnoPC. At 25% concentration, however, the permeability of bilayer containing PazePC drops to slightly lower than the bilayer containing PoxnoPC. By increasing the concentration of oxidized products to more than 25%, the permeability of bilayers containing PazePC is slightly smaller than bilayers containing PoxnoPC. The possibility of chain reversal in PazePC is important for recognition of oxidation by various receptors. This may also suggest a mechanism for the selectivity of therapies such as cold plasma therapy toward cancerous cells compared to normal cells.76,77
Author contributions
All authors conceived the work and BB carried out the simulations. Data analysis was done by BB and PB, and all authors provided critical feedback on the interpretation of data, analysis and manuscript.Conflicts of interest
There are no conflicts to declare.Acknowledgements
The authors thank Antoinette Killian, Joseph Lorent, and Min Xie from the University of Utrecht for many fruitful discussions. BB thanks Björn Baumeier at the Technical University of Eindhoven (TU/e) for providing computational resources and the strategic alliance between TU/e, Utrecht University, and University Medical Center Utrecht for financial support. MK thanks the Natural Sciences and Engineering Research Council of Canada (NSERC) and the Canada Research Chairs Program for financial support. J. W. was financially supported by National Research Council of Thailand (NRCT) through the Research Grants for Talented Mid-Career Researchers with grant no. N41A640080.References
- G. Van Meer, D. R. Voelker and G. W. Feigenson, Nat. Rev. Molec. Cell. Biol., 2008, 9, 112–124 CrossRef CAS PubMed.
- E. Frankel, Prog. Lipid Res., 1984, 23, 197–221 CrossRef CAS PubMed.
- M. H. Brodnitz, W. W. Nawar and I. S. Fagerson, Lipids, 1968, 3, 59–64 CrossRef CAS PubMed.
- M. H. Brodnitz, W. W. Nawar and I. S. Fagerson, Lipids, 1968, 3, 65–71 CrossRef CAS PubMed.
- P. Spiteller, W. Kern, J. Reiner and G. Spiteller, Biochim. Biophys. Acta, Mol. Cell Biol. Lipids, 2001, 1531, 188–208 CrossRef CAS PubMed.
- D. A. Pratt, J. H. Mills and N. A. Porter, J. Am. Chem. Soc., 2003, 125, 5801–5810 CrossRef CAS PubMed.
- R. Chen, L. Yang and T. M. McIntyre, J. Biol. Chem., 2007, 282, 24842–24850 CrossRef CAS PubMed.
- B. Halliwell and J. M. Gutteridge, Meth. Enzym., 1990, 186, 1–85 CAS.
- B. Halliwell, Acta Neurol. Scand., 1989, 80, 23–33 CrossRef PubMed.
- D. A. Butterfield, J. Drake, C. Pocernich and A. Castegna, Trends Mol. Med., 2001, 7, 548–554 CrossRef CAS PubMed.
- J. Everse and P. W. Coates, Free Radical Biol. Med., 2005, 38, 1296–1310 CrossRef CAS PubMed.
- D. Berg, M. B. Youdim and P. Riederer, Cell Tissue Res., 2004, 318, 201–213 CrossRef PubMed.
- J. A. Berliner and J. W. Heinecke, Free Radical Biol. Med., 1996, 20, 707–727 CrossRef CAS PubMed.
- M. N. Diaz, B. Frei, J. A. Vita and J. F. Keaney Jr, N. Engl. J. Med., 1997, 337, 408–416 CrossRef CAS PubMed.
- L. Wood, P. Gibson and M. Garg, Eur. Respir. J., 2003, 21, 177–186 CrossRef CAS PubMed.
- X. Lu, G. V. Naidis, M. Laroussi, S. Reuter, D. B. Graves and K. Ostrikov, Phys. Rep., 2016, 630, 1–84 CrossRef CAS.
- K. Weltmann and T. Von Woedtke, Plasma Phys. Control. Fusion, 2016, 59, 014031 CrossRef.
- C. Ulrich, F. Kluschke, A. Patzelt, S. Vandersee, V. Czaika, H. Richter, A. Bob, J. V. Hutten, C. Painsi and R. Hüge, et al. , J. Wound Care, 2015, 24, 196–203 CrossRef CAS PubMed.
- S. Bekeschus, A. Schmidt, M. Napp, A. Kramer, W. Kerner, T. von Woedtke, K. Wende, S. Hasse and K. Masur, Exp. Dermatol., 2017, 26, 145–147 CrossRef CAS PubMed.
- M. Wirtz, I. Stoffels, J. Dissemond, D. Schadendorf and A. Roesch, J. Eur. Acad. Dermatol. Venereol., 2018, 32, e37–e39 CrossRef CAS PubMed.
- J. Heinlin, G. Isbary, W. Stolz, F. Zeman, M. Landthaler, G. Morfill, T. Shimizu, J. Zimmermann and S. Karrer, J. Eur. Acad. Dermatol. Venereol., 2013, 27, 324–331 CrossRef CAS PubMed.
- E. A. Ratovitski, X. Cheng, D. Yan, J. H. Sherman, J. Canady, B. Trink and M. Keidar, Plasma Process. Polym., 2014, 11, 1128–1137 CrossRef CAS.
- R. Rutkowski, M. Schuster, J. Unger, C. Seebauer, H. Metelmann, T. V. Woedtke, K. Weltmann and G. Daeschlein, Clin. Plasma Med., 2017, 7, 52–57 CrossRef.
- H.-R. Metelmann, C. Seebauer, V. Miller, A. Fridman, G. Bauer, D. B. Graves, J.-M. Pouvesle, R. Rutkowski, M. Schuster and S. Bekeschus, et al. , Clin. Plasma Med., 2018, 9, 6–13 CrossRef.
- G. O. Fruhwirth, A. Loidl and A. Hermetter, Biochim. Biophys. Acta, Molec. Basis Dis., 2007, 1772, 718–736 CrossRef CAS PubMed.
- A. Makky and M. Tanaka, J. Phys. Chem. B, 2015, 119, 5857–5863 CrossRef CAS PubMed.
- J. N. van der Veen, J. P. Kennelly, S. Wan, J. E. Vance, D. E. Vance and R. L. Jacobs, Biochim. Biophys. Acta, Biomembr., 2017, 1859, 1558–1572 CrossRef CAS PubMed.
- A. Hulbert, T. Rana and P. Couture, Comp. Biochem. Physiol., Part B: Biochem. Mol. Biol., 2002, 132, 515–527 CrossRef CAS PubMed.
- B. Antonny, S. Vanni, H. Shindou and T. Ferreira, Trends Cell Biol., 2015, 25, 427–436 CrossRef CAS PubMed.
- I. Hiroyuki, K. Toshihide and I. Keizo, Biochim. Biophys. Acta, Lipids Lipid Metab., 1988, 961, 13–21 CrossRef.
- C. Uhlson, K. Harrison, C. B. Allen, S. Ahmad, C. W. White and R. C. Murphy, Chem. Res. Toxicol., 2002, 15, 896–906 Search PubMed.
- S. S. Davies, A. V. Pontsler, G. K. Marathe, K. A. Harrison, R. C. Murphy, J. C. Hinshaw, G. D. Prestwich, A. S. Hilaire, S. M. Prescott and G. A. Zimmerman, et al. , J. Biol. Chem., 2001, 276, 16015–16023 CrossRef CAS PubMed.
- M. Ravandeh, H. Kahlert, H. Jablonowski, J.-W. Lackmann, J. Striesow, V. Agmo Hernández and K. Wende, Sci. Rep., 2020, 10, 1–15 CrossRef PubMed.
- K. Sabatini, J.-P. Mattila, F. M. Megli and P. K. Kinnunen, Biophys. J., 2006, 90, 4488–4499 CrossRef CAS PubMed.
- J.-P. Mattila, K. Sabatini and P. K. Kinnunen, Langmuir, 2008, 24, 4157–4160 CrossRef CAS PubMed.
- J.-P. Mattila, K. Sabatini and P. K. Kinnunen, Biophys. J., 2007, 93, 3105–3112 CrossRef CAS PubMed.
- J.-P. Mattila, K. Sabatini and P. K. Kinnunen, Biochim. Biophys. Acta, Biomembr., 2008, 1778, 2041–2050 CrossRef CAS PubMed.
- H. Khandelia and O. G. Mouritsen, Biophys. J., 2009, 96, 2734–2743 CrossRef CAS PubMed.
- A. Schumann-Gillett and M. L. O'Mara, Biochim. Biophys. Acta, Biomembr., 2019, 1861, 210–219 CrossRef CAS PubMed.
- M. J. Abraham, T. Murtola, R. Schulz, S. Páll, J. C. Smith, B. Hess and E. Lindahl, SoftwareX, 2015, 1, 19–25 CrossRef.
- N. Schmid, A. P. Eichenberger, A. Choutko, S. Riniker, M. Winger, A. E. Mark and W. F. van Gunsteren, Eur. Biophys. J., 2011, 40, 843–856 CrossRef CAS PubMed.
- J. Wong-Ekkabut and M. Karttunen, J. Chem. Theory Comput., 2012, 8, 2905–2911 CrossRef CAS PubMed.
- J. Wong-Ekkabut and M. Karttunen, Biochim. Biophys. Acta, Biomembr., 2016, 1858, 2529–2538 CrossRef CAS PubMed.
- P. Boonnoy, V. Jarerattanachat, M. Karttunen and J. Wong-Ekkabut, Biophys. J., 2021, 120, 4525–4535 CrossRef CAS PubMed.
- J. Wong-Ekkabut, Z. Xu, W. Triampo, I.-M. Tang, D. P. Tieleman and L. Monticelli, Biophys. J., 2007, 93, 4225–4236 CrossRef CAS PubMed.
- V. Jarerattanachat, M. Karttunen and J. Wong-Ekkabut, J. Phys. Chem. B, 2013, 117, 8490–8501 CrossRef CAS PubMed.
- P. Boonnoy, V. Jarerattanachat, M. Karttunen and J. Wong-Ekkabut, J. Phys. Chem. Lett., 2015, 6, 4884–4888 CrossRef CAS PubMed.
- P. Boonnoy, M. Karttunen and J. Wong-Ekkabut, J. Phys. Chem. B, 2018, 122, 10362–10370 CrossRef CAS PubMed.
- C. A. López, M. F. Swift, X.-P. Xu, D. Hanein, N. Volkmann and S. Gnanakaran, Structure, 2019, 27, 988–999 CrossRef PubMed.
- D. Poger, W. F. Van Gunsteren and A. E. Mark, J. Comput. Chem., 2010, 31, 1117–1125 CrossRef CAS PubMed.
- D. Poger and A. E. Mark, J. Chem. Theory Comput., 2010, 6, 325–336 CrossRef CAS PubMed.
- A. K. Malde, L. Zuo, M. Breeze, M. Stroet, D. Poger, P. C. Nair, C. Oostenbrink and A. E. Mark, J. Chem. Theory Comput., 2011, 7, 4026–4037 CrossRef CAS PubMed.
- M. Stroet, B. Caron, K. M. Visscher, D. P. Geerke, A. K. Malde and A. E. Mark, J. Chem. Theory Comput., 2018, 14, 5834–5845 CrossRef CAS PubMed.
- G. Bussi, D. Donadio and M. Parrinello, J. Chem. Phys., 2007, 126, 014101 CrossRef PubMed.
- M. Parrinello and A. Rahman, J. Appl. Phys., 1981, 52, 7182–7190 CrossRef CAS.
- B. Hess, J. Chem. Theory Comput., 2008, 4, 116–122 CrossRef CAS PubMed.
- T. Darden, D. York and L. Pedersen, J. Chem. Phys., 1993, 98, 10089–10092 CrossRef CAS.
- U. Essmann, L. Perera, M. L. Berkowitz, T. Darden, H. Lee and L. G. Pedersen, J. Chem. Phys., 1995, 103, 8577–8593 CrossRef CAS.
- H. J. Berendsen, J. P. Postma, W. F. van Gunsteren and J. Hermans, Intermolecular forces, Springer, 1981, pp. 331–342 Search PubMed.
- W. Humphrey, A. Dalke and K. Schulten, J. Mol. Graphics, 1996, 14, 33–38 CrossRef CAS PubMed.
- K. Pluhackova, S. A. Kirsch, J. Han, L. Sun, Z. Jiang, T. Unruh and R. A. Böckmann, J. Phys. Chem. B, 2016, 120, 3888–3903 CrossRef CAS PubMed.
- P. Smith and C. D. Lorenz, J. Chem. Theory Comput., 2021, 17, 5907–5919 CrossRef CAS PubMed.
- G. Lukat, J. Krüger and B. Sommer, J. Chem. Inf. Model., 2013, 53, 2908–2925 CrossRef CAS PubMed.
- V. Ramasubramani, B. D. Dice, E. S. Harper, M. P. Spellings, J. A. Anderson and S. C. Glotzer, Comput. Phys. Commun., 2020, 254, 107275 CrossRef CAS.
- T. J. Piggot, A. Pineiro and S. Khalid, J. Chem. Theory Comput., 2012, 8, 4593–4609 CrossRef CAS PubMed.
- T. J. Piggot, J. R. Allison, R. B. Sessions and J. W. Essex, J. Chem. Theory Comput., 2017, 13, 5683–5696 CrossRef CAS PubMed.
- P. K. Kinnunen, Chem. Phys. Lipids, 1992, 63, 251–258 CrossRef CAS PubMed.
- J. Wong-Ekkabut and M. Karttunen, J. Biol. Phys., 2016, 42, 133–146 CrossRef CAS PubMed.
- A. Krämer, A. Ghysels, E. Wang, R. M. Venable, J. B. Klauda, B. R. Brooks and R. W. Pastor, J. Chem. Phys., 2020, 153, 124107 CrossRef PubMed.
- R. Volinsky, R. Paananen and P. K. Kinnunen, Biophys. J., 2012, 103, 247–254 CrossRef CAS PubMed.
- O. Berger, O. Edholm and F. Jähnig, Biophys. J., 1997, 72, 2002–2013 CrossRef CAS PubMed.
- V. Walter, C. Ruscher, A. Gola, C. M. Marques, O. Benzerara and F. Thalmann, Biochim. Biophys. Acta, Biomembr., 2021, 1863, 183714 CrossRef CAS PubMed.
- M. Davies, A. Reyes-Figueroa, A. A. Gurtovenko, D. Frankel and M. Karttunen, Biophys. J., 2023, 122, 442–450 CrossRef CAS PubMed.
- L. Beranova, L. Cwiklik, P. Jurkiewicz, M. Hof and P. Jungwirth, Langmuir, 2010, 26, 6140–6144 CrossRef CAS PubMed.
- T. Mendes Ferreira, R. Sood, R. Bärenwald, G. Carlström, D. Topgaard, K. Saalwächter, P. K. J. Kinnunen and O. H. S. Ollila, Langmuir, 2016, 32, 6524–6533 CrossRef CAS PubMed.
- G. Bauer and D. B. Graves, Plasma Process. Polym., 2016, 13, 1157–1178 CrossRef CAS.
- D. Yan, W. Xu, X. Yao, L. Lin, J. H. Sherman and M. Keidar, Sci. Rep., 2018, 8, 1–10 CAS.
Footnote |
| † Electronic supplementary information (ESI) available: Fig. S1 shows bilayer thickness (left) and area per lipid (right) as a function of time for the pure POPC bilayer; Fig. S2 shows bilayer thickness as a function of time for the POPC bilayers containing 10%, 15%, 20%, 25%, and 30% PoxnoPC (left) and PazePC (right); Fig. S3 shows area per lipid as a function of time for the POPC bilayers containing 10%, 15%, 20%, 25%, and 30% PoxnoPC (left) and PazePC (right); Fig. S4 shows density distributions of the lipid head groups and oxidized functional groups along the z-axis with respect to the distance from the bilayer center for the POPC bilayer containing 10%, 15%, 20%, and 25% PazePC (left) and PoxnoPC (right). Movies of systems with 30% PazePC and 30% PoxnoPC are provided at DOI: https://doi.org/10.5281/zenodo.7810559. See DOI: https://doi.org/10.1039/d3cp01692g |
| This journal is © the Owner Societies 2023 |

