
 Open Access Article
 This Open Access Article is licensed under a Creative Commons Attribution-Non Commercial 3.0 Unported Licence
Resistive switching and role of interfaces in memristive devices based on amorphous NbOx grown by anodic oxidation†
Giuseppe
Leonetti
a,
Matteo
Fretto
b,
Katarzyna
Bejtka
a,
Elena Sonia
Olivetti
b,
Fabrizio Candido
Pirri
a,
Natascia
De Leo
b,
Ilia
Valov
 cd and
Gianluca
Milano
*b
cd and
Gianluca
Milano
*b
aPolitecnico di Torino, Department of Applied Science and Technology (DISAT), C.so Duca degli Abruzzi 24, 10129, Turin, Italy
bIstituto Nazionale di Ricerca Metrologica (INRiM), Advanced Materials Metrology and Life Science, Strada delle cacce 91, 10135 Turin, Italy. E-mail: g.milano@inrim.it
cJuelich, Institute of Electrochemistry and Energy System, Germany
dAcad. Evgeni Budevski (IEE-BAS, Bulgarian Academy of Sciences (BAS), Acad. G. Bonchev Str., Block 10, 1113 Sofia, Bulgaria
First published on 20th April 2023
Abstract
Memristive devices based on the resistive switching mechanism are continuously attracting attention in the framework of neuromorphic computing and next-generation memory devices. Here, we report on a comprehensive analysis of the resistive switching properties of amorphous NbOx grown by anodic oxidation. Besides a detailed chemical, structural and morphological analysis of the involved materials and interfaces, the mechanism of switching in Nb/NbOx/Au resistive switching cells is discussed by investigating the role of metal–metal oxide interfaces in regulating electronic and ionic transport mechanisms. The resistive switching was found to be related to the formation/rupture of conductive nanofilaments in the NbOx layer under the action of an applied electric field, facilitated by the presence of an oxygen scavenger layer at the Nb/NbOx interface. Electrical characterization including device-to-device variability revealed an endurance >103 full-sweep cycles, retention >104 s, and multilevel capabilities. Furthermore, the observation of quantized conductance supports the physical mechanism of switching based on the formation of atomic-scale conductive filaments. Besides providing new insights into the switching properties of NbOx, this work also highlights the perspective of anodic oxidation as a promising method for the realization of resistive switching cells.
1. Introduction
Resistive switching properties characterize all those devices able to vary their resistance state between a high resistance state (HRS) and a low resistance state (LRS) under an external voltage stimulus. In very recent years, the interest in the study of devices based on resistive switching has widely increased, and they have been proposed in many fields of electronics for in-memory computing solutions, next-generation memory storage, or bio-inspired computing.1–3 Typically, they are realized by sandwiching an insulating material (MIM) or a solid electrolyte between two metal electrodes.4,5 The switching occurs in the central layer of this structure, called a resistive switching layer, and it is caused by the overall change in the resistance of the device due to either internal redox reactions in the solid electrolyte or the formation and rupture of a conductive filament (CF) in the insulating layer under the action of an applied electric field. In particular, in the case of valence change memory (VCM) cells, the switching mechanism is related to the anion migration in the insulating layer, while in electrochemical metallization (ECM) cells, cation species are formed by the dissolution of the active electrode and a conductive filament formed by their electromigration through the switching medium.Using transition metal oxides (TMO) as insulating layers is becoming a very popular choice for the realization of both VCM and ECM cells and among them, NbOx is attracting widespread interest. Indeed, NbOx has shown high performances in terms of endurance and retention, making it a perfect candidate for the realization of non-volatile ReRAM in neuromorphic computing, and the emulation of artificial synapses.6–9 In addition, NbOx has been proposed for the realization of a new class of non-linear circuitry elements able to substitute the classical transistors in hardware applications.10 Memristive devices based on NbOx have been also largely studied for their threshold switching properties, useful as a selector in memory arrays.11–23 In all these works, the niobium oxide switching medium is obtained using conventional deposition techniques such as RF sputtering both starting from a NbOx target and from a pure Nb target in an oxygen atmosphere to control its stoichiometry and also by using pulsed laser deposition (PLD), ALD and sol–gel methods.24–29
Recently, anodic oxidation has been proposed as a promising alternative low-cost and easy-to-use technique in the realization of RS devices with high performances. Indeed, anodic oxidation is largely exploited in the fabrication of RS devices based on TMO such as HfOx, TaOx, TiOx, and also NbOx.30–40 However, in the literature, few studies have been conducted on the anodic oxidation of niobium as a resistive switching layer.30,35–37,41
In this work, we report on a comprehensive investigation of the resistive switching mechanism in amorphous NbOx realized by anodic oxidation by combining the analysis of the resistive switching properties of Nb/NbOx/Au devices together with a detailed chemical, structural and morphological analysis of the NbOx layer and its interfaces. For these devices, the switching mechanism is related to the formation/rupture of a sub-stoichiometric conductive channel generated by the motion of oxygen vacancies and/or Nb5+ ions in the NbOx layer under the action of an applied electric field. The results show that the conductive filament morphology can be tailored by an appropriate control of the maximum current flowing into the device, showing also that the filament can shrink down approaching the atomic scale under appropriate operational conditions in voltage and current sweep modes.
2. Results and discussion
2.1 NbOx by anodic oxidation
Resistive switching cells were fabricated by growing niobium oxide through the electrochemical anodization of Nb. A schematic of the experimental setup is reported in Fig. 1(a). Anodic oxidation represents an electrochemical method to produce an oxide film on a metallic substrate, where electrons are removed from the target material to oxidize the anode. The advantages of this technique are the easy set-up, which consists of an electrochemical cell, and the fast oxide growth. Here we use an ammonium pentaborate anodic solution to induce the oxidation of the niobium thin film that is also exploited as the bottom electrode of the switching device. Once the sample is in the solution, OH− oxidant species are produced by dissociations and travel at the interface with the metal where they react producing the metal oxide. The thickness of the oxide is fixed by the anodizing voltage that regulates the maximum depth at which oxidant species can travel under the surface, allowing fine nanometric control of the oxide growth.42Fig. 1(b) shows the typical anodization curves acquired during the oxidation of the niobium films, where curves obtained from the anodization of different samples with different anodizing voltages are reported. These curves can be divided into two regions, a first linear region in which the applied voltage increases with time at a fixed current density, and a second region characterized by a plateau in which the anodizing process happens at constant voltage and the oxide layer reaches the final chemical composition. Starting from the Si/SiO2 substrate covered by a thick Nb layer, different anodizing voltages are studied to obtain different NbOx thicknesses as shown in Fig. 1(c). Herein, it can be observed that the thickness of the NbOx thin film linearly increases as a function of the anodizing voltage, where the linear relationship is characterized by a slope of 2.7 nm V−1. The so-anodized samples are then subjected to lithography and metal deposition for the deposition of the 50 x 50 μm2 Au square top electrodes (TEs) to obtain the final Au/NbOx/Nb cell stack with a common Nb bottom electrode, and the schematics can be found in Fig. 1(d).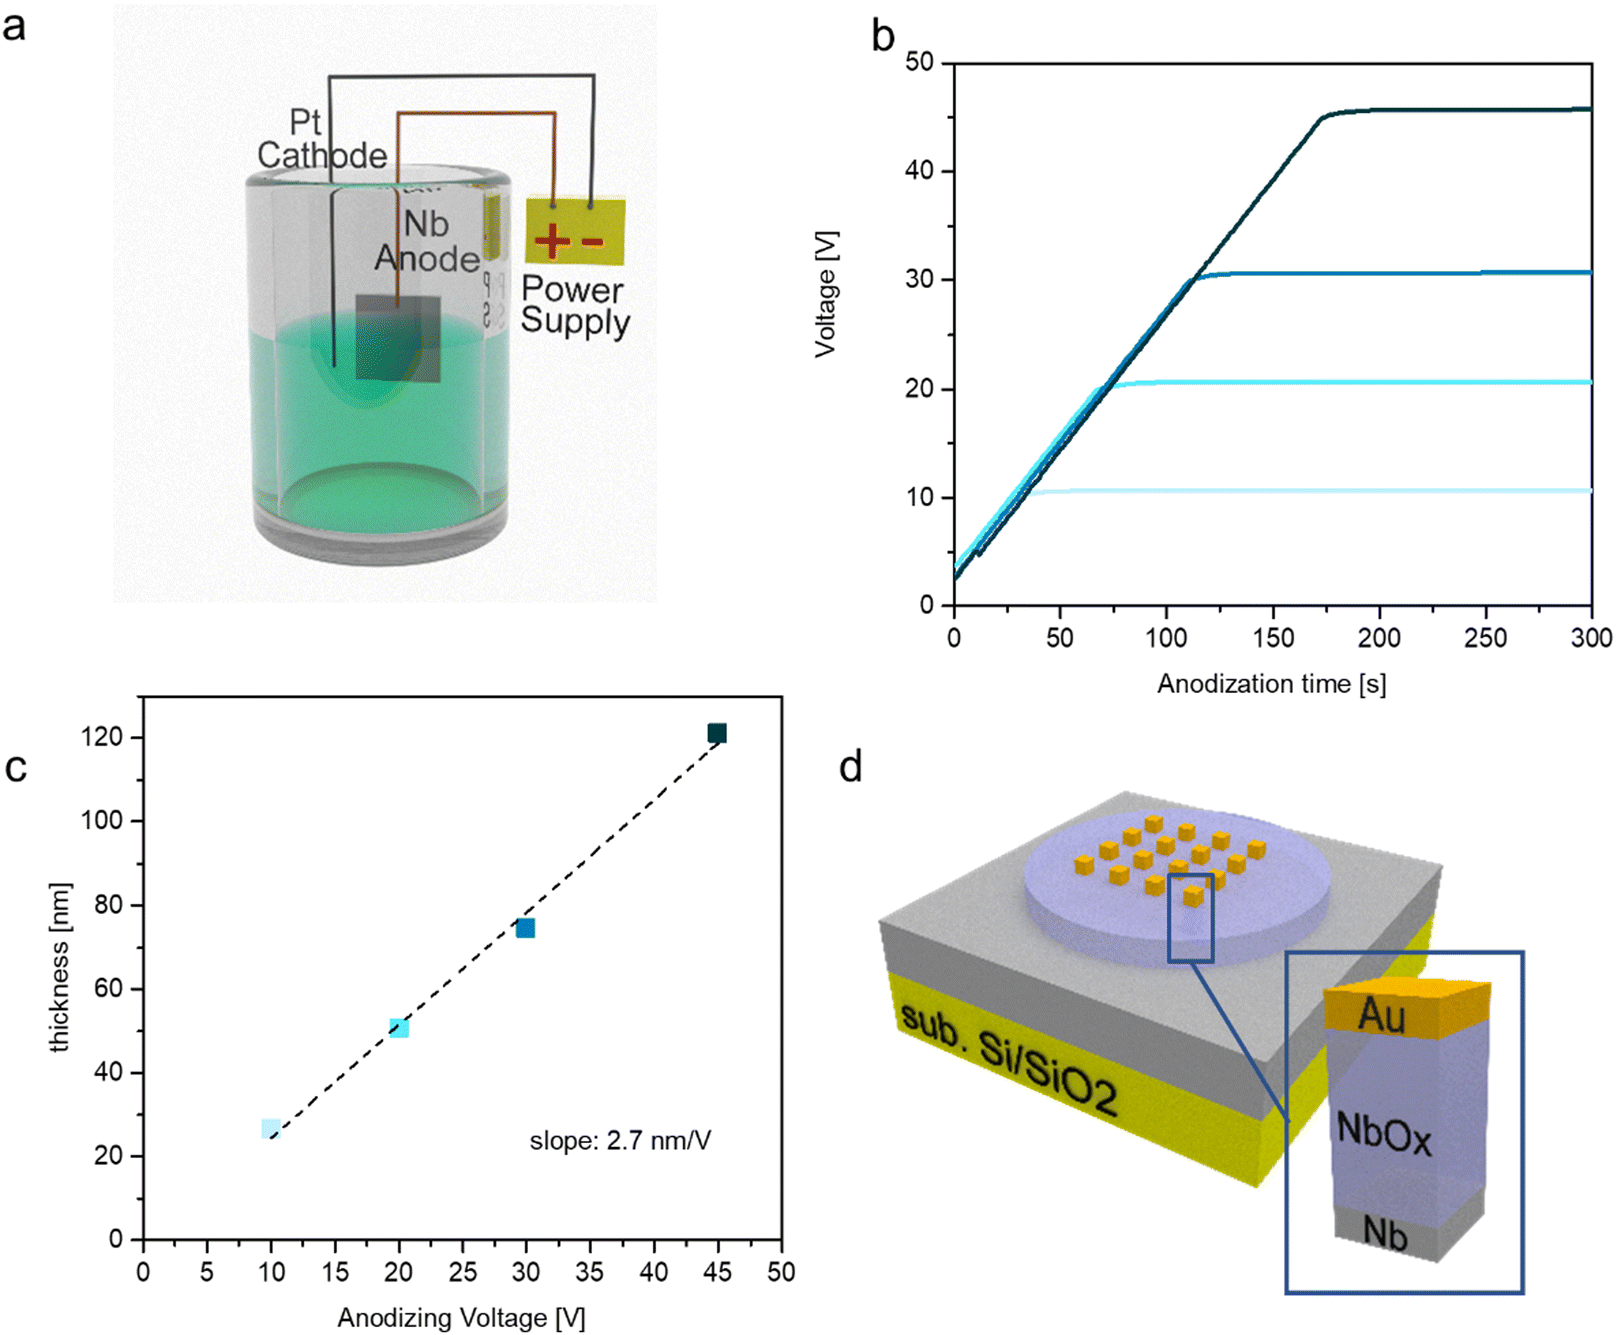 | ||
| Fig. 1 (a) Scheme of the anodization cell. (b) Anodization curves: the anodization is performed at constant voltage after an initial ramp at a fixed current of 1 mA. (c) Different thicknesses obtained by varying the limiting voltage, and the values obtained via ellipsometric measurements. (d) Scheme of the as-fabricated sample, and on the right, the single Au/NbOx/Nb device. | ||
2.2 Chemical, structural and morphological characterization
Fig. 2(a) shows the TEM cross-section of the Au/NbOx/Nb cell in a bright field mode. The topmost layer (on the left side in Fig. 2(a)) is Pt deposited as a protective cap during the sample preparation. The analysis shows that the Nb thin film bottom electrode is composed of columnar Nb crystals, characteristic of sputter deposition. The top layer of the Nb film is covered by NbOx, and the image clearly shows its great uniformity in the metal-oxide thickness. The thickness of the oxide of this specific sample can be estimated to be around 55 nm in accordance with ellipsometry measurements. High-resolution TEM (HR-TEM) was performed to investigate more in detail the three materials and is shown in Fig. 2(b). A more in-depth investigation of the structure of the three materials and in particular of the oxide layer can be obtained through Fast Fourier Transform (FFT) of the transmitted electron signal crossing the lamella and was performed in the regions highlighted corresponding to Au, NbOx, and Nb (Fig. 2(c)–(e)). The FFT reproduces the reciprocal lattice of the three components of the cell. In particular, gold and niobium are polycrystalline, as expected. The FFT of NbOx, shown in Fig. 2(d), gives evidence of its amorphous nature. A confirmation of this can be also found through X-ray diffraction (XRD) measurements performed on the top of the anodized niobium film in pseudo-parallel beam configuration: the diffractogram in Fig. 2(f) clearly shows the main peaks due to the niobium bottom electrodes, but no peaks of crystalline niobium oxides of any stoichiometry (NbO, NbO2 or Nb2O5) are found. In their place, a pronounced bump is present in the cyan region below 40 degrees, which is typical of the amorphous substances, in which, due to the lack of long-range order and due to the consequent distribution of bond lengths and angles, a broadened halo substitutes the Bragg peaks. The FFT measurements on the transmitted electron signal along with the XRD measurements reveal that the niobium oxide thin film grown by anodic oxidation with our electrolytic solution is amorphous. Our results are in accordance with previous results, where independent of the chosen anodic solution, niobium oxide grown by anodic oxidation at room temperature is amorphous unless higher temperatures are reached during the anodization process or subsequent annealing is performed.43,44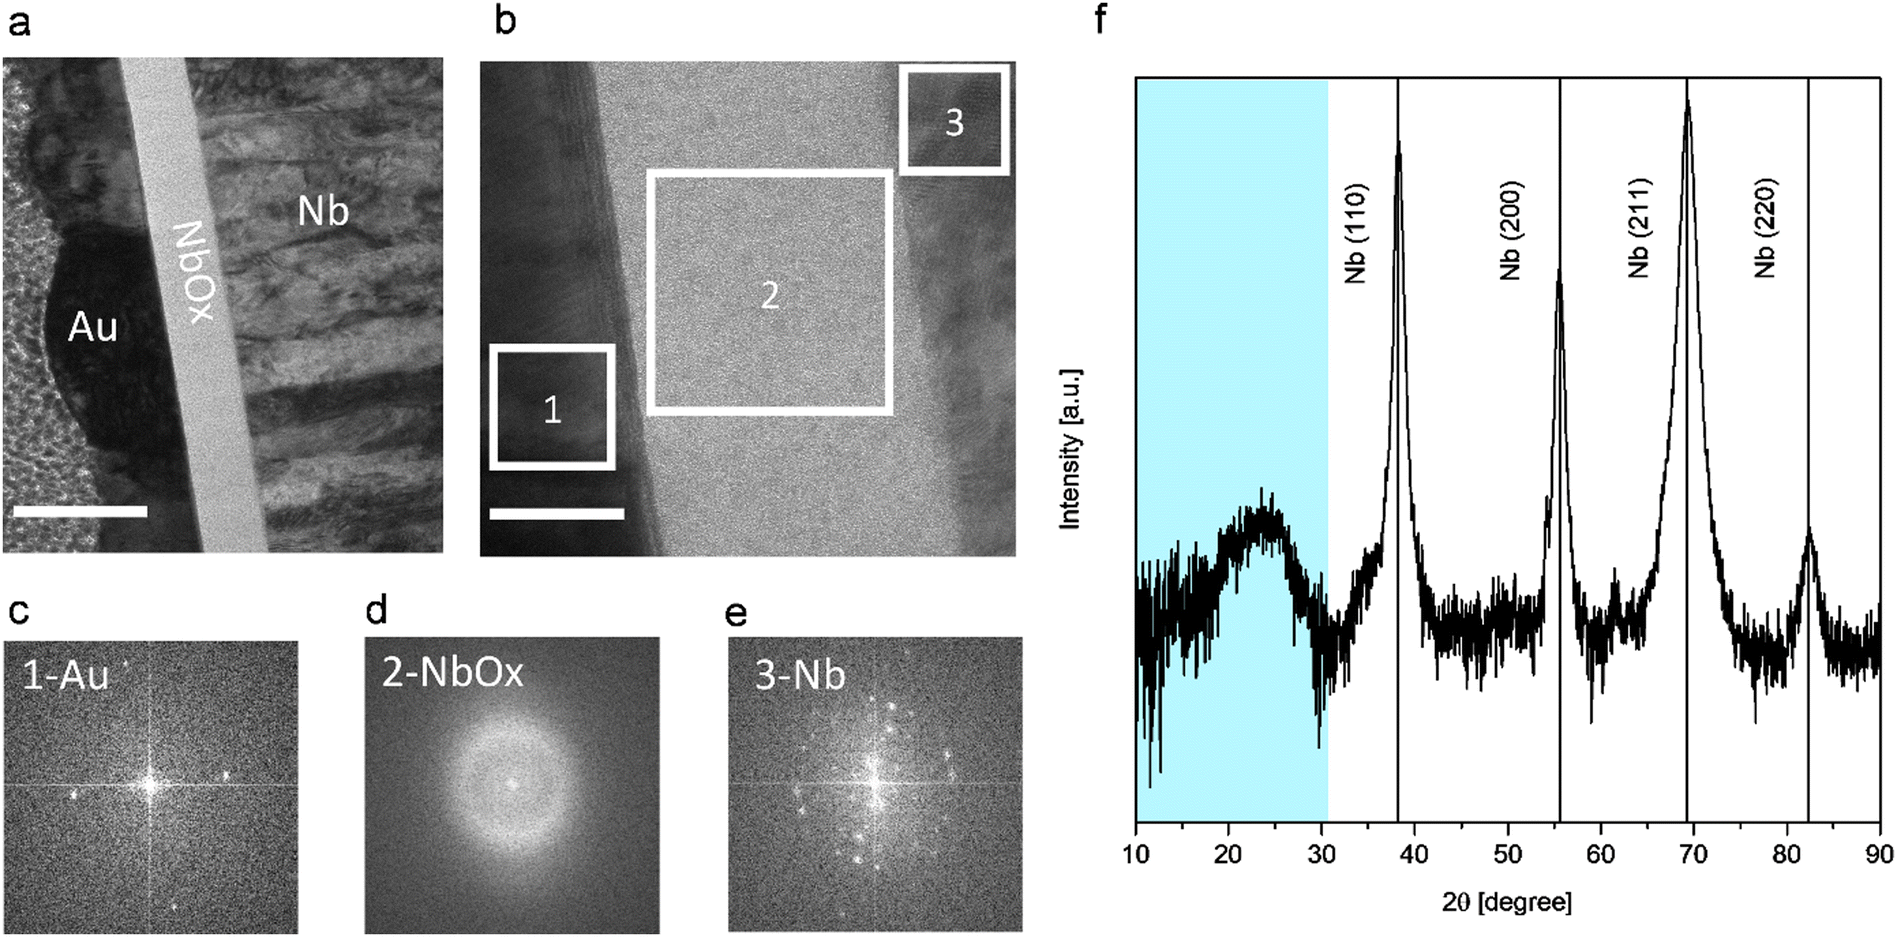 | ||
| Fig. 2 (a) Bright field image of the Au/NbOx/Nb structure showing the thickness uniformity in the oxide growth after the anodization process (the scale bar is 100 nm). (b) HR-TEM performed on the same structure in (a) (scale bar is 20 nm). The FFT of the transmitted electron signal allows the extraction of the structure of each layer; Au (c) and Nb (e) are monocrystalline and polycrystalline, respectively, NbOx is found to be amorphous (d). (f) XRD pattern of the sample, the cyan region below 40 degrees highlights the presence of an amorphous phase, identified through TEM as the oxide layer grown on the top of niobium after the anodization process (peaks of Si/SiO2 substrate removed). Measurements were acquired on the 20-V grown oxide sample. | ||
Fig. 3(a)–(c) show Electron Energy-Loss Spectroscopy (EELS) characterization performed on the specimen lamella. As indicated in Fig. 3(a), different regions of niobium oxide are studied. Fig. 3(b) and (c) show the energy loss spectra of the niobium and oxygen regions, M-edges and K-edges, respectively corresponding to locations shown in Fig. 1(a). The Nb M2,3-edge consists of two main peaks, and their shape is similar in all spectra. A chemical shift of both peaks is found, and this is related to the niobium oxidation state. Specifically, three different peak positions can be identified along the structure at the lowest energy positions for the metallic Nb film (about 364 eV), intermediate at the interface between Nb and the oxide layer (about 365.5 eV), and the highest energy position (366 eV) corresponding to Nb2O5 (the peak positions are referred to the M3 line and the separation between the M3 and M2 lines is constant and about 15.3 eV for each oxidation state).45 This analysis highlights a massive presence of Nb2O5 in the whole volume of the oxide due to the position of the M2 and M3 lines of niobium, and the shift of about 2.5 eV with respect to metallic Nb. Therefore, it can be concluded that the only appreciable difference in stoichiometry is at the interface with the niobium bottom electrode, where the red curve is subjected to a chemical shift that can be attributed to the presence of NbO.45 Besides the Nb M-edges, we also acquire the O K-edge at the same sample positions, as can be seen in Fig. 3(c). According to the literature, the O–K edge is characterized by a double-peak structure just above the ionization edge, followed by different bumps.45 The energy splitting of the two peaks differs for different oxidation states, that is, it reduces for lower oxidation states. The spectra of the O K-edges are very similar for the major part of the thickness of the oxide and are ascribed to Nb2O5.45 At the interface, a spectrum with a different shape is observed, and according to the literature, this can be ascribed to NbO.45
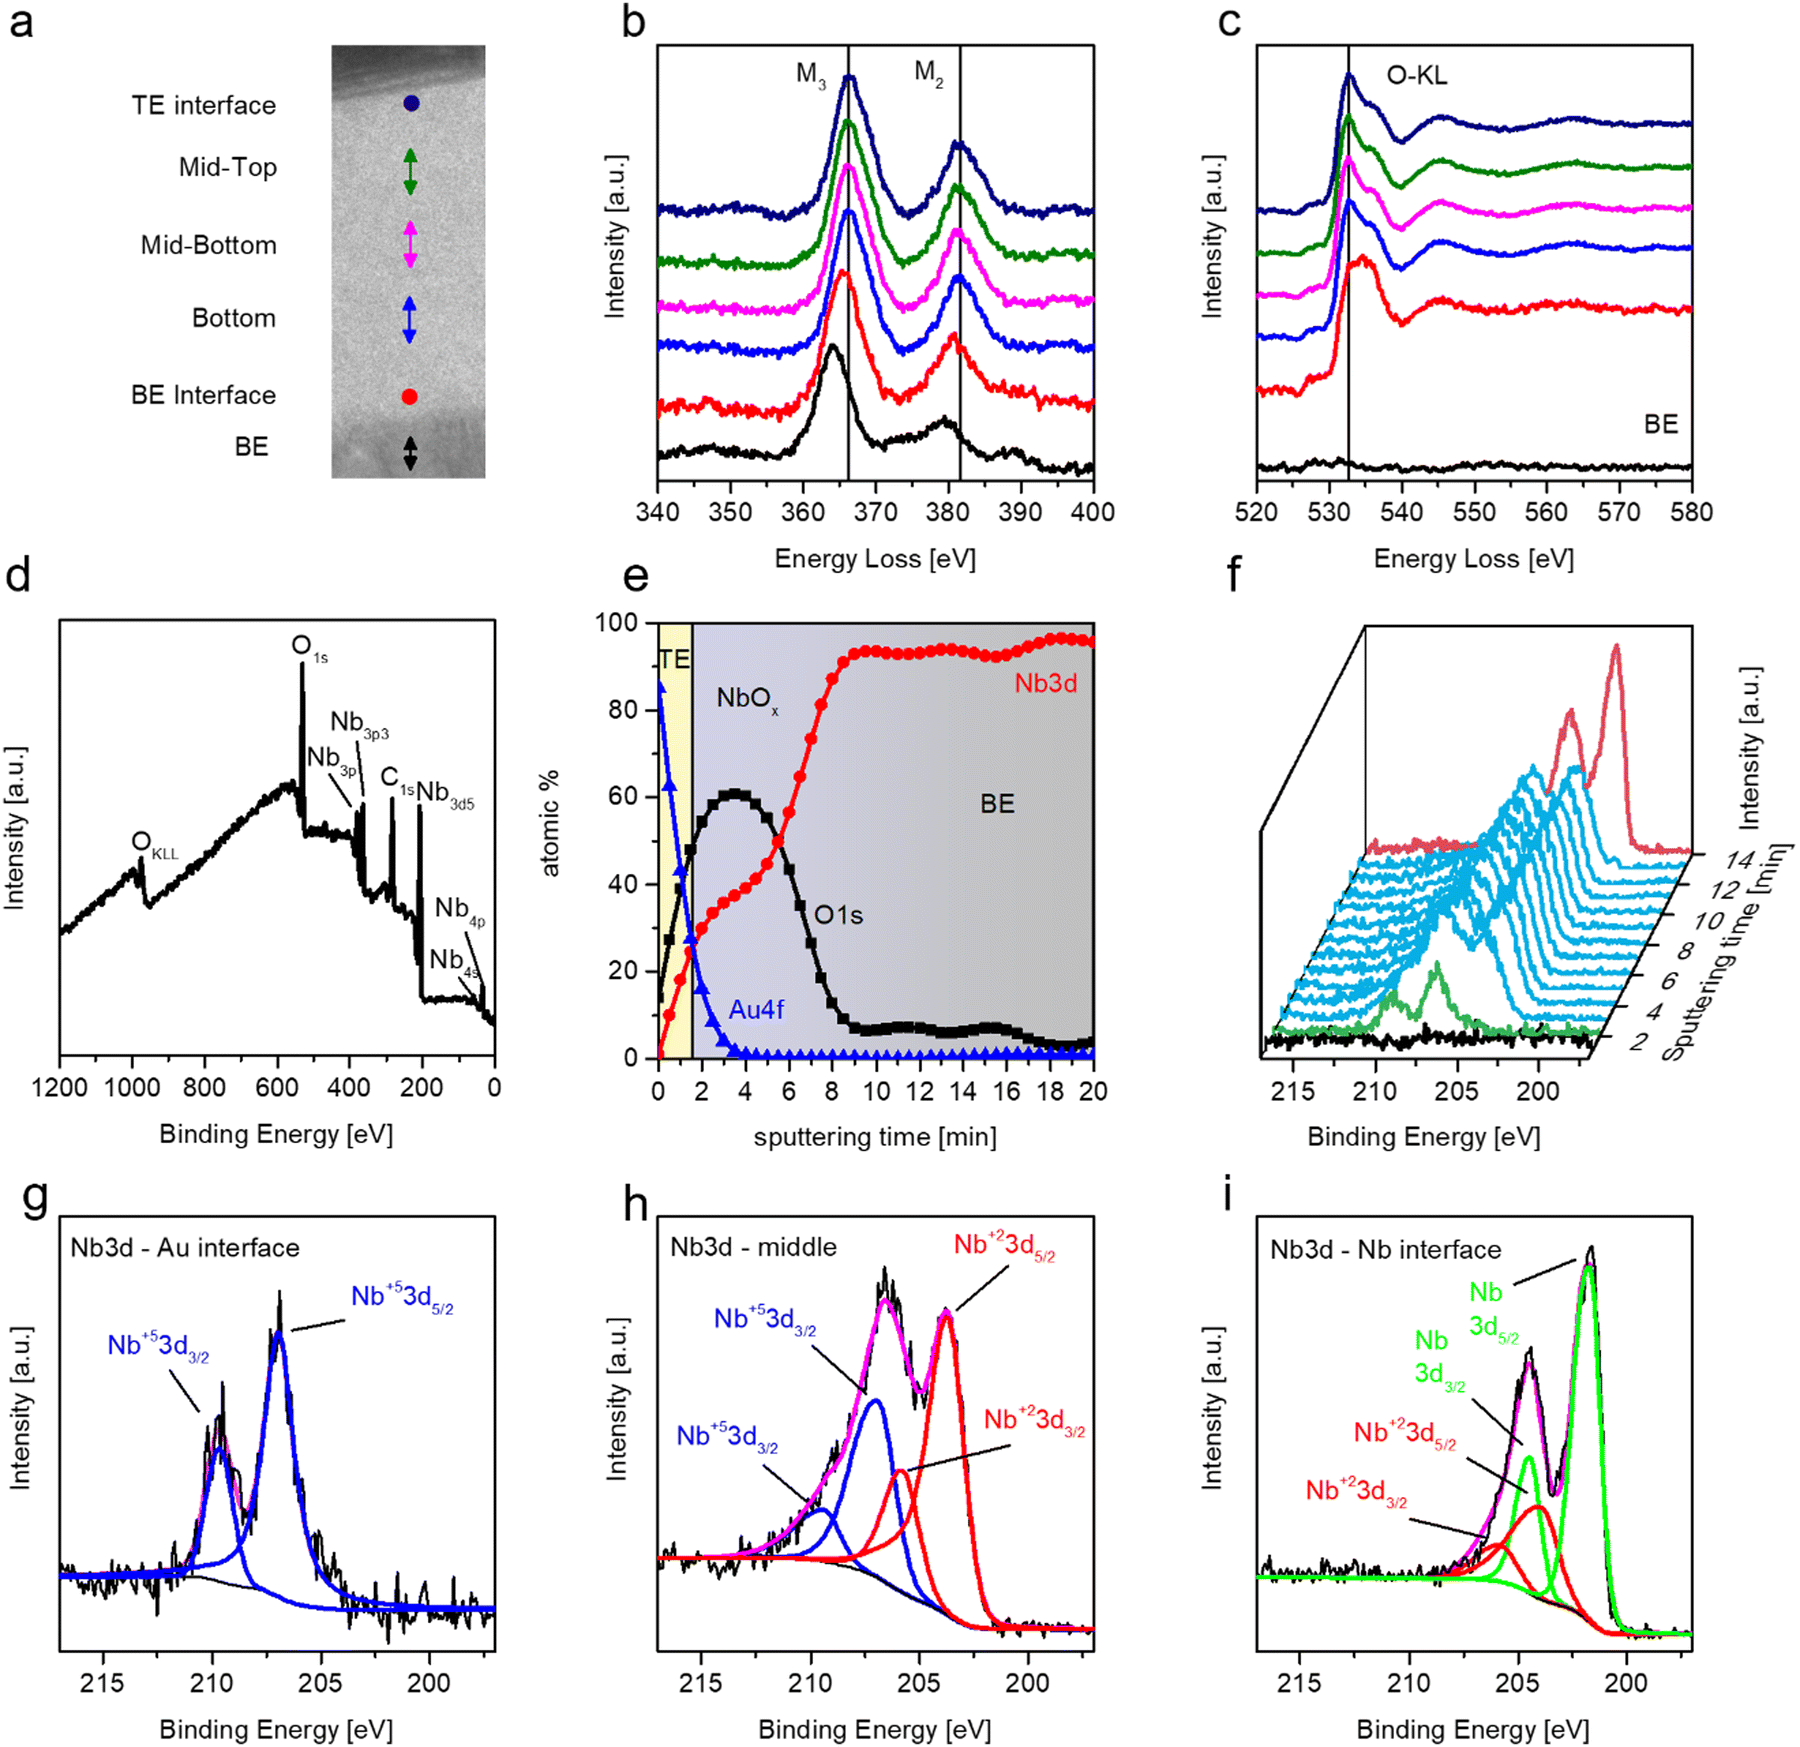 | ||
| Fig. 3 Chemical characterization of niobium oxide. (a) A cross-section of the Au/NbOx/Nb cell highlighting the region in which the EELS analysis is performed: the coloured circles and arrows refer to the entity of the investigated area. EELS analysis evidences the massive presence of Nb2O5 in the analysed sample lamella with a slight shift of the mean peaks approaching the Nb bottom electrode to be attributed to the presence of a very thin layer of NbO at the interface between the two materials. This can be observed for both niobium (b) and oxygen (c) lines. (d) XPS survey spectra at the NbOx surface. (e) Quantitative XPS analysis showing the atomic percentage of the different spaces in the specimen lamella. (f) XPS cumulative Nb3d spectra: niobium 3d peaks evolve going in deeper toward the bottom electrode. In the bottom row, particulars of the HR niobium spectra at the Nb3d region at the Au interface (g), in the middle (h) and at the Nb interface (i). | ||
A complementary analysis performed via XPS allows going deep into the chemical composition of our devices. Initially, the survey analysis is performed on the surface of niobium oxide (in the region without top electrodes). Fig. 3(d) highlights all the elements detected at the surface, where only Nb and O elements are present, besides C surface contaminations. A subsequent quantitative depth profile analysis performed on multilayered Au/NbOx/Nb (Fig. 3(e)) shows a higher concentration of oxygen in the region near the Au top electrode and a reduced content in the region approaching the Nb bottom one. Fig. 3(f) shows the HR spectra of the region of the Nb 3d peaks as a function of the sputtering time in the depth profile in which it is possible to notice the presence of three different oxide phases due to the evolution of the Nb peaks: at the interface of the Au top electrode (green curve), in the oxide volume (cyan curves) and at the interface with the Nb bottom electrode (red curve). Going deeper in detail, the results show that the niobium oxidation state is +5 at the interface with the TE, as can be observed in Fig. 3(g), where after Shirley background subtraction and peak fitting-deconvolution using a combination of Lorentzian–Gaussian functions, the doublet of the Nb3d peak can be observed at the positions 206.9 eV and 209.4 eV. In the bulky region, the oxidation state of niobium results from a mixture of Nb(+5) and Nb(+2), an example is the HR spectra of the niobium 3d peak region at 8 min sputtering time (Fig. 3(h)), in which following a similar procedure, the doublet related to Nb(+5) is encountered jointly with the doublet of Nb(+2) (BEs: 203.7 eV and 205.8 eV for Nb3d5/2 and Nb3d3/2, respectively). In the region at the interface with the Nb bottom electrode, only the Nb(+2) oxidation state and the Nb metallic state (BEs: 201.8 eV and 204.5 eV for Nb3d5/2 and Nb3d3/2, respectively) are encountered, meaning the interface between the oxide and the bottom electrode is constituted mainly by a thin layer of NbO. This is in accordance with the previous reports where niobium oxide was grown on the top of a niobium film, independent of the method chosen for the growth, and at the interface, there is a thin layer of 1–2 nm of NbO.46 The different oxidation states of Nb in the oxide layer can be explained by considering the different electrode reactivities of Nb2O5. In particular, the results confirm that Au is unreactive with niobium oxide, which means that it is not able to change its oxidation state, and that is confirmed by looking at the survey spectrum at the NbOx surface and the HR spectrum at the Au/NbOx interface (Fig. 3(d) and (g), see also Fig. S1a and b (ESI†) of the HR spectra of Nb3d and O1s spectra of the bare oxide surface in the ESI† for comparison). Moreover, it seems plausible that because of the amorphous nature of the niobium oxide layer, in the bulky region, a mixture of all the possible oxidation states of Nb should be found. Nevertheless, by the peak-deconvolution, it has not been possible to assume the presence of the Nb(+4) oxidation state even considering a further doublet in the region [204;207] eV.
In order to understand the presence of the Nb(+2) oxidation state at the Nb/NbOx interface, it is necessary to take into account the reaction paths occurring during anodic oxidation in between Nb and Nb2O5:
| Nb + 2Nb2O5 → 5NbO2 |
| NbO2 + Nb → 2NbO |
Both these reaction paths have negative Gibbs free energy, so they are spontaneous as reported in the literature.26 This means that Nb2O5 can spontaneously react at the interface with Nb-forming NbO2 that can further react with Nb to form NbO.25 These reactions result in a mixture of different oxidation states that can be observed in the bulky region with a reducing content of Nb2O5 for NbO approaching the Nb electrode, as observed experimentally.
In summary, structural, chemical, and morphological characterizations revealed that NbOx is amorphous with a uniform stoichiometry characterized by a mixture of Nb2O5 and NbO phases, except at the interfaces of the two electrodes, as shown in Fig. 3(f), with the presence of a NbO interlayer at the Nb/NbOx interface and Nb2O5 at the Au/NbOx interface.
2.3 Electrical characterization
After the fabrication process, the devices are in their pristine state, characterized by high resistance due to the insulating nature of NbOx. During measurements, the Nb bottom electrode is grounded, while the voltage is applied to the Au top electrode. Fig. 4(a) shows the typical pristine state curves of these devices, where nonlinear behavior can be ascribed to the presence of the blocking character of Schottky barriers at the interfaces that regulate the electronic flow. In particular, a high asymmetry can be observed in the two Schottky barriers formed at the Au/NbOx and Nb/NbOx interfaces. Generally, the Schottky barriers at the interfaces with the electrodes of resistive switching cells are related to the difference between the work function of the electrode and the electron affinity of the oxide. In addition, as deduced from the XPS measurements, the oxide stoichiometry is not the same in each section and thus contributes to altering the entity of the barrier at the interfaces with electrodes. At the Au interface, niobium oxide is definitively Nb2O5 and the difference between the Au work function and the niobium oxide electron affinity is at its maximum; on the contrary, at the Nb interface, the niobium oxide is nearly metallic (NbO) and this reduces the barrier with Nb.47 In addition, the Schottky barrier height at metal–insulator interfaces is strongly dependent also on chemical interactions in nanoscale devices.48,49 In the case of memristive cells, the metal–insulator–metal structure can thus be schematized as back-to-back connected Schottky diodes representing metal–insulator interfaces in series with the NbOx layer resistance. When a negative voltage is applied to the Au top electrode, the electronic conduction is meanly blocked by the reversely polarized barrier at the Au/NbOx interface. Instead, when a positive voltage is applied to the Au top electrode, a more conductive nonlinear I–V characteristic can be observed due to a more conductive behaviour of the reversely polarized Nb/NbOx junction.42 The high barrier for electronic transport resulting at the interface between NbOx and Au contributes to the increase in the pristine state resistance of the Au/NbOx/Nb cell, meaning that the initial resistance state does not completely depend on the insulating properties of the oxide alone but it is strictly dependent on the choice of metal electrodes. In this context, for the sake of completeness, it should be pointed out that the same structure terminated with Nb rather than Au in the Nb/NbOx/Nb structure is by far more conductive (details in Fig. S2, ESI†).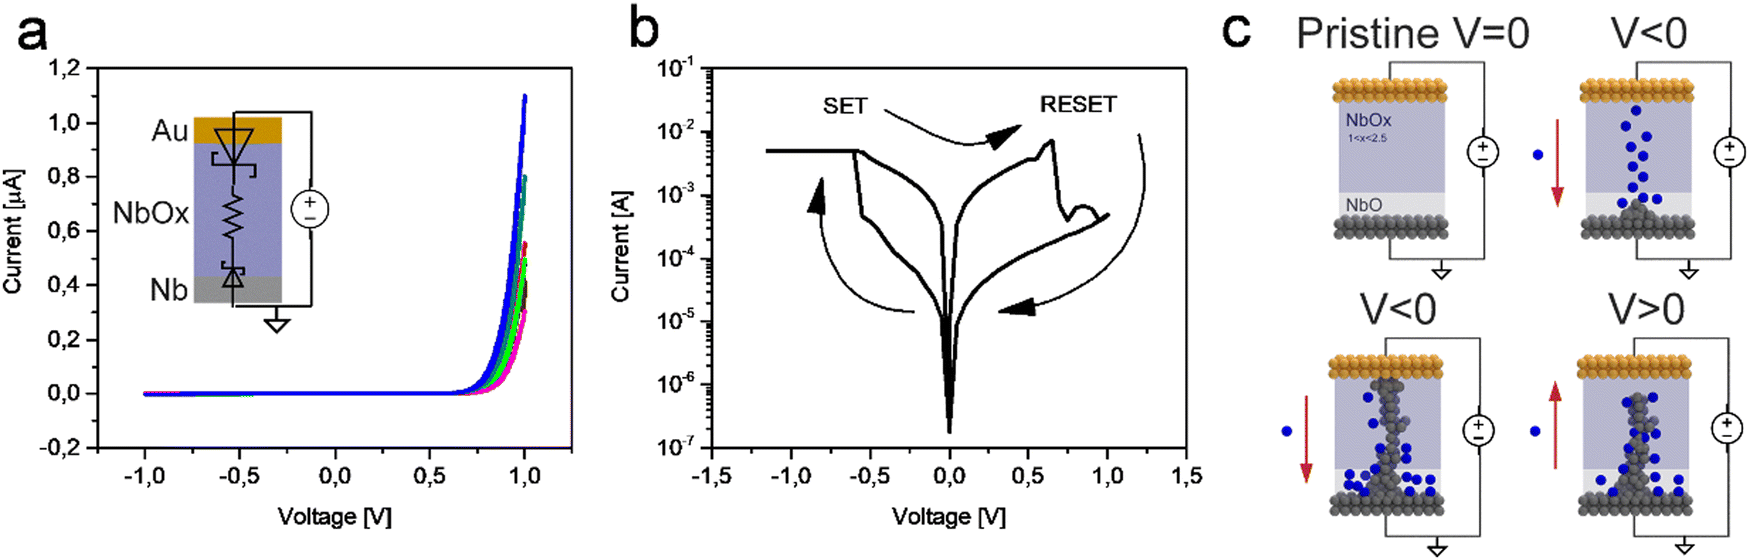 | ||
| Fig. 4 (a) Pristine state curves showing a high asymmetry Schottky barrier, in the inset a scheme of the equivalent circuit of the cell as the back-to-back diode: the two diodes represent the Schottky barriers at the interfaces with the electrodes, whilst the resistor represents the NbOx layer resistance. (b) A typical RS cycle of the Au/NbOx/Nb devices in which is shown the SET phase in the negative polarity and the reset phase in the positive one. (c) A scheme of the switching process: at the beginning, the devices are in their pristine state; after the application of a negative voltage, the electroforming process takes place, thanks to the oxygen vacancies mechanism (migration of blue spheres) that reveals a Nb channel in the oxide layer; once the conductive filament is formed and the LRS is reached, the HRS is recovered by applying a positive voltage. | ||
The electroforming process represents an essential step for the initialization of resistive switching properties of Au/NbOx/Nb devices. The electroforming process relates to an initial soft breakdown in the oxide layer under the action of an applied electric field. This is caused by the oxygen ion migration and, as a consequence, a sub-stoichiometric channel, deficient in oxygen, is formed in the NbOx layer (details on the electroforming curves can be found in Fig. S3, ESI†).
Fig. 4(b) shows a typical resistive switching I–V curve of these devices after electroforming. In particular, it highlights the SET process that occurs when a negative voltage is applied to the Au top electrode, while as the resistive switching behaviour is bipolar, a RESET can be observed by applying an opposite voltage polarity. The switching mechanism is attributable to the migration of oxygen-related species and/or migration of Nb5+ ions under the action of the applied electric field, with subsequent formation and rupture of a conductive filament, as schematized in Fig. 4(c). Here, according to chemical analysis, a region deficient in oxygen is depicted at the interface with the Nb electrode (light purple layer). When the electroforming process begins by applying a negative voltage on the Au electrode, the oxygen ions (blue spheres) start to move toward the Nb bottom electrode, driven by the electric field. At the interface, the deficient oxygen layer (scavenger layer) acts as a reservoir of oxygen able to collect the mobile ions.25,50 Oxygen ions continue to accumulate at the Nb interface until a conductive channel almost free of oxygen is formed. The formation of the conductive filament should be, moreover, facilitated by the presence of NbO produced in the oxide layer as a result of the anodizing process.51 In this context, it is worth noting that besides the migration of oxygen-related species, the migration of Nb5+ species is also expected to occur in NbOx. This is due to the high transport number of Nb5+ (in the range of 0.24–0.27),30,52–54 suggesting that the formation of the conductive filament is sustained not only by oxygen anions but also by Nb5+ ions. At this point, the device switches to its low resistance state (LRS). By reversing the voltage polarity, the oxygen ions move in the opposite direction, recovering the high resistance state (HRS), but at a resistance level lower than the initial pristine one. Indeed, the HRS can be achieved through the formation of a gap inside the conductive filament without the need for its complete dissolution. In this context, resistive switching is related to the formation/rupture of an oxygen-deficient conductive filament, where the NbO layer at the Nb/NbOx interface acts as an oxygen scavenger.
The resistive switching performances of the devices have been studied by means of endurance and retention tests. Fig. 5(a) reports I–V curves with DC measurements over more than 103 cycles of the endurance test. As can be observed, the device shows Ohmic behaviour in the LRS with linear I–V characteristics and non-linear behaviour in the HRS. Fig. 5(b) reports the endurance of the device, showing high stability of the LRS and HRS. An average ON/OFF ratio of 33 was observed, with an average LRS and HRS of 126 Ω and 4.2 kΩ, respectively. Fig. 5(c) reports SET and RESET voltages over cycling during the endurance test, while Fig. 5(d) reports the corresponding SET and RESET distributions, where SET and RESET mean voltages were observed to be −0.6 V and 0.6 V, respectively. Importantly, it is worth noticing the low variability of programming voltages over cycling. Fig. 5(e) reports the device retention, i.e. the capability to retain the programmed resistance states. As can be observed, Au/NbOx/Nb devices show high stability in the retention of the LRS over 104 s. Device-to-device variability has been evaluated by considering the response of a set of 10 devices characterized with the same measurement scheme. The results are reported in Fig. 5(f), where LRS and HRS distributions over cycling of different devices are compared. Despite small variabilities, all devices under test show two distinct distributions of resistance states for HRS and LRS well separated by at least one order of magnitude (see Table S1 in the ESI† for a comparative analysis with the literature). Note that the memory window can be further enlarged by appropriate tuning of programming conditions and/or through the appropriate selection of electrode materials.
 | ||
| Fig. 5 Resistive switching analysis. (a) I–V curves from the endurance test corresponding to the 1st, 128th, 256th, 384th, 512th, 640th, 768th, 896th and 1024th cycle, respectively (lighter to darker red). (b) HRS and LRS extracted from the endurance test. (c) SET and RESET voltages extracted from the 1024 cycles endurance test. (d) Histogram of the SET and RESET voltages distribution; the blue and green curves are fitting Gaussian distribution functions. (e) Retention analysis showing the high stability of the LRS. (f) Device-to-device variability performed on 10 devices under test trained in the same way, HRS and LRS extracted on the last 10 cycles of the endurance test. A reading voltage of 50 mV is assumed for the endurance tests, while a voltage of −10 mV is used to read the current during the endurance test. | ||
The multilevel capability of these devices was evaluated by programming the devices with different levels of compliance current (CC). Fig. 6(a) reports I–V characteristics obtained by tuning the CC from 500 μA up to 7.5 mA. As can be observed, a reduction in the LRS can be observed by increasing the CC level. In the LRS, the devices show the Ohmic behaviour for the tested currents, except for 500 μA (details in Fig. S4, ESI†). Fig. 6(b) reports the distribution of LRS over cycling for each level of CC. In particular, LRS evolves toward low resistances as the CC is increased showing that it is possible to tune the LRS in a range of two orders of magnitude, leading to the possibility of tuning the device memory window.
 | ||
| Fig. 6 Multilevel analysis. (a) Multilevel switching by changing the compliance current in the SET phase. (b) Cumulated resistances obtained by the analysis of the curves on the left: a reduction in the LRS is observed with an increase of the compliance current. The LRS values are extracted from the last 10 cycles of the endurance test assuming a reading voltage of 50 mV. (c) Low voltage sweep experiment: controlling the voltage sweep speed, it is possible to induce the formation of the channel in a controlled way to visualize integer steps in the conductance. (d) A similar result with the observation of half-integer steps of G0 can be obtained using low current voltage sweeps). | ||
A finer tuning in the LRS can be reached by resorting to low voltage and current sweep experiments where the morphology of the filament can be tailored down to the nearly atomic scale, where quantum conductance levels can be observed. In particular, discretized-like levels of conductance were observed by tailoring the device kinetics through slow voltage sweep rates. An example of quantum levels is reported in Fig. 6(c), where plateaux at integers and half-integers multiples of G0 were observed by operating the device in a voltage sweep mode with a rate of 250 μV s−1. Similar results were also observed by operating the device with a slow current sweep mode (rate of 73.5 nA s−1), as reported in Fig. 6(d). Conductance quantization is a phenomenon that interests all those structures in which electrons can move in a ballistic regime through a constriction whose lateral dimension is lower than their Fermi wavelength.55–57 The Landauer formula well describes the current passing through the constriction and assumes that its conductance is dependent on the number of active channels through which electrons are able to move and are activated at the moment the voltage is applied. The observation of staircase-like conductance in our structure is proof of the ballistic conduction through a filamentary structure (or, more in general, channel) whose dimensions are comparable with the electron wavelength. Previous observation reported conductance quantization in Pt/NbOx/Al switching devices, but, as far as we know, not with other combinations of electrodes.58 Different from a pure metallic structure (as the ones generated in some ECM cell-based devices), in which usually integer values of G0 can be observed, for a VCM cell-based device in which the electromigration is associated with the movement of oxygen ions (when TMO are taken into account), half-integer values of G0 can be observed too. The presence of metallic cations and oxygen vacancies in the NbOx matrix allows the movement of electrons in different sub-bands that are not the ones of the pure Nb, suggesting the possibility of observing both integer and half-integer values of G0.57 For our experiments, the application of the current sweeps was revealed to be the most recommended choice to observe the conductance quantization at a finer level, turning out to be the best strategy for slowing down the filament formation kinetics to make possible the observation of the electronic response of the filament while it is formed nearly atom-by-atom.
By the way, we are still far from precisely controlling the conductance increase during the SET phase, and the measurements in Fig. 6(c) and (d) are intended to be a demonstration that it is possible to observe the quantization in conductance also.
3. Experimental section
Anodic oxidation and device fabrication
The devices have been fabricated starting from a commercially available silicon wafer covered by 500 nm of thermal silicon oxide (SiMat) cut in 17 mm × 17 mm squares. Before the deposition, the substrates are washed sequentially in acetone and ethanol with the assistance of an ultrasonic bath cleaner and dried under continuous nitrogen flow. The deposition of the Nb bottom electrode is performed in a DC sputtering system equipped with a Nb target and evacuated at 1.7 × 10⁻⁷ mbar and the deposition was carried out for 4 min and 46 s at a pressure of 3 × 10⁻³ mbar to achieve a final thickness of 250 nm. Immediately after the deposition, the samples are anodized in an ammonium pentaborate with the ethylene glycol supersaturated solution. A Cu tape is used to short-circuit the bottom Nb film with the back of the sample in order to ground the sample during the anodization process. The anodization process was carried out in a custom-made electrolytic cell able to oxidize only the central part of the Nb film in a circular shape of 12 mm diameter as shown in the scheme of Fig. 1(d), by applying a constant current of 1 mA provided by a Keithley 220 current source meter. The current is kept constant until the anodizing voltage is reached; at this point, the current is automatically adjusted through a LabVIEW interface to keep the anodizing voltage constant. The voltage is applied using HP 34401a and the signal is acquired using a LabVIEW interface. A total anodizing time of 300 s is assumed for each anodizing voltage as reported in Fig. 1(b) and (c). The thicknesses of the NbOx transparent thin films were evaluated via spectroscopic ellipsometry (alpha-SE Ellipsometer J.A. Woollam). XRD measurements were performed on the bare niobium oxide in the pseudo-parallel beam configuration using the Panalytical XPERT-PRO diffractometer equipped with a Cu anode (K-alpha wavelength = 1.5419 Å) with a glancing incidence angle of 0.8°. TEM investigation was carried out using a TALOS F200X G2 microscope operated at 200 kV. High-angle annular dark field (HAADF) and electron energy loss spectroscopy (EELS) detectors (Continuum S/1077 spectrometer) were used in the scanning TEM (STEM) mode. The dispersion of core-loss EELS was 0.15 eV per channel for both the niobium M-edge spectra and oxygen K-edge spectra. The spectra post-treatment were recorded using the Gatan Digital Micrograph software. For each edge of interest, the background was fitted within an energy window positioned immediately before the edge and extrapolated beyond the edge onset. A power-law function was used. The extrapolated background was then subtracted from the edge. The samples for TEM characterization have been prepared in cross-section via a standard lift-out technique, using FIB operated at 30 kV, as described previously.45 A final cleaning step using a FIB voltage of 2 kV was also performed. Chemical characterization has been carried out through a PHI 5000 Versaprobe Scanning X-ray Photoelectron spectrometer equipped with a monochromatic Al-Kalpha X-ray source working at 1486.6 eV and using the C1s peak (position 284.8 eV) as calibration to correct the shift caused by the adventous carbon on the surface. The depth profile analysis has been performed with the assistance of an Ar+ ion source on the multilayered Au/NbOx/Nb considering a region fully coated by Au. For both the survey analysis and the HR one, a spot of 100 μm and a collection angle of 45° are used to record the signal. XPS HR spectra were interpolated using d-orbital functions for the Nb3d spectra and s-orbital functions for O1s ones. For Nb3d5/2, a doublet with a separation of 2.5 eV is assumed; in addition, peak fitting and deconvolution have been performed using a combination of Gaussian and Lorentzian functions in a measure of 10% (where 0% is Gaussian and 100% is Lorentzian) and assuming a peak asymmetry of 0.7. For the Nb3d peaks, a separation of 2.1 eV is assumed, with the same combination of Gaussian–Lorentzian distribution functions, but with 0.3 of asymmetry. For O1s spectra in the bulk region, a pure Gaussian distribution function (0% G–L) with 0 of asymmetry is assumed, whilst, on the surface, in which the spectrum is the result of the convolution of three distribution functions (see Fig. S2b in the ESI†), three different interpolation functions are assumed. For adsorbed water, 35% G–L with 0 of asymmetry centered at 532.7 eV, for the CO2 compound, 0% G–L with 0 of asymmetry centered at 531 eV and lately, at lower energy, for the chemisorbed Nb2O5 0% G–L with 0 of asymmetry and a peak at 530 eV are assumed. Shirley background subtraction has been performed before each interpolation. All the XPS spectral analyses have been carried out using the open-source software XPSPEAK41. The 50-μm × 50 μm Au top electrodes were defined through laser lithography (Heidelberg μpg101) and the top electrodes were deposited using DC sputtering equipped with an Au target. Before the deposition, the chamber was evacuated at 5 × 10⁻⁶ mbar and the deposition was carried out with the assistance of Ar plasma at a pressure of 3 × 10⁻³ mbar to achieve a final film thickness of 150 nm.Electrical measurement set-up
The electrical measurements have been carried out using a Keithley 4200A-SCS Parameter Analyzer equipped with two tungsten tips. During all the measurements, the Nb bottom electrode was always grounded and the voltage was directly applied to the Au top electrode. The I–V characteristic of the pristine state, the electroforming process, and the endurance test have been acquired in the voltage linear sweep operation mode assuming a step of 100 mV in the range [−1 V; 1 V] with a compliance current of 1 mA for the pristine state, a voltage step 100 mV in the range [−21 V; 0 V] with a compliance current of 5 mA for the electroforming process and, a voltage step of 50 mV in the range [−3.5 V; 1.4 V] with a current compliance of −5 mA in the negative polarity and the maximum allowed one of 100 mA in the positive sweep for the endurance tests. During all the endurance measurements, the current compliance is never reached to achieve the reset of the devices. Once the 1024 cycles have been reached, the measurements have been interrupted but actually, the devices were able to switch again. For the analysis of the HRS and LRS, a reading voltage of 50 mV is assumed and the resistances have been extracted by the ratio voltage over current for each cycle. The SET and RESET voltages have been calculated assuming the voltage at which the compliance is reached in the negative polarity and the voltage at which the current derivative changes sign in the positive polarity, respectively. For the retention analysis, the device under test has been set first in the LRS and the current has been recorded in time assuming a reading voltage of −10 mV, and the analysis takes place after 10![[thin space (1/6-em)]](https://www.rsc.org/images/entities/char_2009.gif) 000 s. The same has been done for the acquisition of the HRS and the device is reset after a complete I–V cycle; then assuming the same reading voltage of −10 mV, the acquisition of the current is carried out for other 10000 s. For both measurements, 1000 points have been acquired with an interval time of 10 s and a hold time of 1 s, and a compliance current of ±5 mA is assumed to be dependent on polarity to prevent unexpected damages. The multilevel analysis has been carried out assuming the same voltage step and range of the endurance test, but with different compliance currents. In particular, six different compliance currents have been set at 500 μA, 750 μA, 1 mA, 2.5 mA, 5 mA, and 7.5 mA in the negative polarity, whilst the maximum allowed one from the system is kept for the positive polarity. The comparative analysis of the endurance characteristics has been done based on the medians acquired on the last 10 cycles of each endurance after the switching stabilization and the HRS and LRS have been extracted assuming the same voltage reading of the previous endurance test. For the slow voltage sweep measurements, the analysis has been carried out starting from the device in the HRS and applying a linear voltage sweep from 0 to −0.5 V with a step of 250 μV and compliance current of 5 mA. For the slow current sweep measurements, a current step of 73.5 nA is assumed, starting from 0 to 150 μA (and reverse) with a compliance voltage of 3 V. In both experiments, the voltage/current step is provided with a time interval of 1 s. After each slow voltage/current sweep experiment, the device is reset to recover its HRS before the subsequent slow experiment using a complete I–V cycle with the same parameter of the endurance test.
000 s. The same has been done for the acquisition of the HRS and the device is reset after a complete I–V cycle; then assuming the same reading voltage of −10 mV, the acquisition of the current is carried out for other 10000 s. For both measurements, 1000 points have been acquired with an interval time of 10 s and a hold time of 1 s, and a compliance current of ±5 mA is assumed to be dependent on polarity to prevent unexpected damages. The multilevel analysis has been carried out assuming the same voltage step and range of the endurance test, but with different compliance currents. In particular, six different compliance currents have been set at 500 μA, 750 μA, 1 mA, 2.5 mA, 5 mA, and 7.5 mA in the negative polarity, whilst the maximum allowed one from the system is kept for the positive polarity. The comparative analysis of the endurance characteristics has been done based on the medians acquired on the last 10 cycles of each endurance after the switching stabilization and the HRS and LRS have been extracted assuming the same voltage reading of the previous endurance test. For the slow voltage sweep measurements, the analysis has been carried out starting from the device in the HRS and applying a linear voltage sweep from 0 to −0.5 V with a step of 250 μV and compliance current of 5 mA. For the slow current sweep measurements, a current step of 73.5 nA is assumed, starting from 0 to 150 μA (and reverse) with a compliance voltage of 3 V. In both experiments, the voltage/current step is provided with a time interval of 1 s. After each slow voltage/current sweep experiment, the device is reset to recover its HRS before the subsequent slow experiment using a complete I–V cycle with the same parameter of the endurance test.
4. Conclusions
In summary, we reported new insights into the resistive switching properties of amorphous NbOx by anodic oxidation connected with Nb and Au electrodes by correlating resistive switching properties with detailed chemical, structural and morphological characterization of involved materials and interfaces. The results highlight the role of metal/insulator interfaces in regulating the ionic transport properties. Indeed, the switching mechanism is facilitated by the presence of an oxygen scavenger layer at the Nb/NbOx interface while the counter Au/NbOx Schottky interface represents a blocking barrier for electrons, thus increasing the HRS state and, consequently, the resistance window of the device. Besides assessing device-to-device variability, endurance tests revealed stable SET and RESET operations for >103 full sweep cycles, while retention measurements revealed the stability of these states over time for >104 s. In addition, multilevel capability can be achieved by tailoring the filament morphology by external control of the maximum current flowing into devices. Moreover, the observation of step-like conductance when operating in the slow current/voltage sweep mode during the SET operation suggests the possibility to control the channel conductance in a finer way to approach conductances of the order of some G0. These results provide new insights into the filamentary-based switching mechanism in NbOx-based memristive cells and highlight the perspective of resistive switching memory devices based on thin films grown by anodic oxidation.Data availability
The data that support the findings of this study are available on Zenodo (https://doi.org/10.5281/zenodo.7322924). All other data are available from the authors.Conflicts of interest
The authors declare no conflicts of interest.Acknowledgements
Part of this work was supported by the European project MEMQuD, code 20FUN06. This project (EMPIR 20FUN06 MEMQuD) has received funding from the EMPIR program co-financed by the Participating States and from the European Union's Horizon 2020 research and innovation programme. Part of this work has been carried out at Nanofacility Piemonte INRiM, a laboratory supported by the “Compagnia di San Paolo” Foundation, and at the QR Laboratories, INRiM. This study was also supported by Ministero dell'Istruzione, dell'Università e della Ricerca—MIUR projects “Dipartimenti di Eccellenza 2018–2022”. The support by S. Guastella for performing XPS measurements is gratefully acknowledged.Notes and references
- Y. Zhang, Z. Wang, J. Zhu, Y. Yang, M. Rao and W. Song, et al., Brain-inspired computing with memristors: Challenges in devices, circuits, and systems, Applied Physics Reviews, American Institute of Physics Inc., 2020, vol. 7 Search PubMed.
- M. Lanza, A. Sebastian, W. D. Lu, M. le Gallo, M. F. Chang and D. Akinwande, et al., Memristive technologies for data storage, computation, encryption, and radio-frequency communication, Science, American Association for the Advancement of Science, 2022, vol. 376 Search PubMed.
- L. Gao, Q. Ren, J. Sun, S. T. Han and Y. Zhou, Memristor modeling: Challenges in theories, simulations, and device variability. Journal of Materials Chemistry C, Royal Society of Chemistry, 2021, vol. 9, pp.16859–16884 Search PubMed.
- M. Lanza, H. S. P. Wong, E. Pop, D. Ielmini, D. Strukov and B. C. Regan, et al., Recommended Methods to Study Resistive Switching Devices, Advanced Electronic Materials, Blackwell Publishing Ltd, 2019, vol. 5 Search PubMed.
- R. Waser and A. Masakazu, Nanoionics-based resistive switching memories, Nat. Mater., 2007, 6(11), 833–840 CrossRef CAS PubMed.
- P. H. Chen, C. Y. Lin, T. C. Chang, J. K. Eshraghian, Y. T. Chao and W. D. Lu, et al., Investigating Selectorless Property within Niobium Devices for Storage Applications, ACS Appl. Mater. Interfaces, 2022, 14(1), 2343–2350 CrossRef CAS PubMed.
- S. Kumar, N. Davila, Z. Wang, X. Huang, J. P. Strachan and D. Vine, et al., Spatially uniform resistance switching of low current, high endurance titanium-niobium-oxide memristors, Nanoscale, 2017, 9(5), 1793–1798 RSC.
- S. Deswal, A. Kumar and A. Kumar, NbOx based memristor as artificial synapse emulating short term plasticity, AIP Adv., 2019, 9(9), 095022, DOI:10.1063/1.5118980.
- J. C. Shank, M. B. Tellekamp, M. J. Wahila, S. Howard, A. S. Weidenbach and B. Zivasatienraj, et al., Scalable Memdiodes Exhibiting Rectification and Hysteresis for Neuromorphic Computing, Sci. Rep., 2018, 8(1), 12935, DOI:10.1038/s41598-018-30727-9.
- S. Kumar, R. S. Williams and Z. Wang, Third-order nanocircuit elements for neuromorphic engineering, Nature, 2020, 585(7826), 518–523 CrossRef CAS PubMed.
- M. Herzig, M. Weiher, A. Ascoli, R. Tetzlaff, T. Mikolajick and S. Slesazeck, Multiple slopes in the negative differential resistance region of NbOx-based threshold switches, J. Phys. D: Appl. Phys., 2019, 52(32), 325104, DOI:10.1088/1361-6463/ab217a.
- T. Mikolajick, M. Herzig, S. Slesazeck, M. Weiher, A. Ascoli and R. Tetzlaff Optimization and Application of Niobium Oxide based Memristive NDR devices. In: International Workshop on Cellular Nanoscale Networks and their Applications, IEEE Computer Society, 2021.
- A. Ascoli, M. Weiher, R. Tetzlaff, M. Herzig, S. Slesazeck and T. Mikolajick Control Strategies to Optimize Graph Coloring via M-CNNs with Locally-Active NbOxMemristors. In: 2021 10th International Conference on Modern Circuits and Systems Technologies, MOCAST 2021. Institute of Electrical and Electronics Engineers Inc., 2021.
- M. Herzig, M. Weiher, A. Ascoli, R. Tetzlaff, T. Mikolajick and S. Slesazeck, Improvement of NbOx-based threshold switching devices by implementing multilayer stacks, Semicond. Sci. Technol., 2019, 34(7), 075005, DOI:10.1088/1361-6641/ab1da3.
- R. Schroedter, A. S. Demirkol, A. Ascoli, R. Tetzlaff, E. Mgeladze and M. Herzig, et al. SPICE Compact Model for an Analog Switching Niobium Oxide Memristor.
- H. Mahne, H. Wylezich, S. Slesazeck, T. Mikolajick, J. Vesely and V. Klemm, et al. Room temperature fabricated NbOx/Nb2O5 memory switching device with threshold switching effect. In: 2013 5th IEEE International Memory Workshop, IMW 2013, 2013, pp. 174–177.
- T. Mikolajick, H. Wylezich, H. Maehne and S. Slesazeck Versatile resistive switching in niobium oxide. In: Proceedings – IEEE International Symposium on Circuits and Systems. Institute of Electrical and Electronics Engineers Inc., 2016, pp. 381–384.
- S. Slesazeck, M. Herzig, T. Mikolajick, A. Ascoli, M. Weiher and R. Tetzlaff Analysis of Vth variability in NbOx-based threshold switches, In: 2016 16th Non-Volatile Memory Technology Symposium, NVMTS 2016, Institute of Electrical and Electronics Engineers Inc., 2016, pp. 23–27.
- H. Wylezich, H. Mähne, J. Rensberg, C. Ronning, P. Zahn and S. Slesazeck, et al., Local ion irradiation-induced resistive threshold and memory switching in Nb2O5/NbOx films, ACS Appl. Mater. Interfaces, 2014, 6(20), 17474–17480 CrossRef CAS PubMed.
- S. Slesazeck, H. Wylezich and T. Mikolajick Analog memristive and memcapacitive properties of Ti/AI2O3/Nb2O5/Ti resistive switches. In: LASCAS 2017 – 8th IEEE Latin American Symposium on Circuits and Systems, R9 IEEE CASS Flagship Conference: Proceedings, Institute of Electrical and Electronics Engineers Inc., 2017.
- A. Ascoli, R. Tetzlaff, S. Slesazeck, H. Mahne and T. Mikolajick Stability analysis supports memristor circuit design. In: Proceedings – IEEE International Symposium on Circuits and Systems. Institute of Electrical and Electronics Engineers Inc., 2015, pp. 1138–1141.
- A. Ascoli, S. Slesazeck, H. Mahne, R. Tetzlaff and T. Mikolajick, Unfolding principle gives insight into physics behind threshold switching in a NbO memristor, In: 2015 International Conference on Memristive Systems, MEMRISYS 2015, Institute of Electrical and Electronics Engineers Inc., 2016.
- D. S. Jeon, T. D. Dongale and T. G. Kim, Low power Ti-doped NbO2-based selector device with high selectivity and low OFF current, J. Alloys Compd., 2021, 884 Search PubMed.
- X. Liu, S. M. Sadaf, S. Park, S. Kim, E. Cha and D. Lee, et al., Complementary resistive switching in niobium oxide-based resistive memory devices, IEEE Electron Device Lett., 2013, 34(2), 235–237 CAS.
- Z. Zhou, M. Yang, Z. Fu, H. Wang, X. Ma and H. Gao, Electrode-induced polarity conversion in Nb2O5/NbOx resistive switching devices, Appl. Phys. Lett., 2020, 117(24), 243502 CrossRef CAS.
- J. Aziz, H. Kim, S. Rehman, M. F. Khan and D. K. Kim, Chemical nature of electrode and the switching response of RF-sputtered NBOx films, Nanomaterials, 2020, 10(11), 1–11 CrossRef PubMed.
- K. Jung, Y. Kim, Y. S. Park, W. Jung, J. Choi and B. Park, et al., Unipolar resistive switching in insulating niobium oxide film and probing electroforming induced metallic components, J. Appl. Phys., 2011, 109(5), 054511, DOI:10.1063/1.3552980.
- L. Chen, Q. Q. Sun, J. J. Gu, Y. Xu, S. J. Ding and D. W. Zhang, Bipolar resistive switching characteristics of atomic layer deposited Nb2O5 thin films for nonvolatile memory application, Curr. Appl. Phys., 2011, 11(3), 849–852 CrossRef.
- H. Baek, C. Lee, J. Choi and J. Cho, Nonvolatile memory devices prepared from sol-gel derived niobium pentoxide films, Langmuir, 2013, 29(1), 380–386 CrossRef CAS PubMed.
- A. Zaffora, R. Macaluso, H. Habazaki, I. Valov and M. Santamaria, Electrochemically prepared oxides for resistive switching devices, Electrochim. Acta, 2018, 274, 103–111 CrossRef CAS.
- A. Wedig, M. Luebben, D. Y. Cho, M. Moors, K. Skaja and V. Rana, et al., Nanoscale cation motion in TaOx, HfOx and TiOx memristive systems, Nat. Nanotechnol., 2016, 11(1), 67–74 CrossRef CAS PubMed.
- A. Zaffora, D. Y. Cho, K. S. Lee, F. di Quarto, R. Waser and M. Santamaria, et al., Electrochemical Tantalum Oxide for Resistive Switching Memories, Adv. Mater., 2017, 29(43), 1703357, DOI:10.1002/adma.201703357.
- S. Chen, S. Noori, M. A. Villena, Y. Shi, T. Han and Y. Zuo, et al., Memristive electronic synapses made by anodic oxidation, Chem. Mater., 2019, 31(20), 8394–8401 CrossRef CAS.
- R. Tominov, V. Avilov, Z. Vakulov, D. Khakhulin, O. Ageev and I. Valov, et al., Forming-Free Resistive Switching of Electrochemical Titanium Oxide Localized Nanostructures: Anodization, Chemical Composition, Nanoscale Size Effects, and Memristive Storage, Adv. Electron. Mater., 2022, 8(8), 2200215, DOI:10.1002/aelm.202200215.
- I. Zrinski, M. Löfler, J. Zavašnik, C. Cancellieri, L. P. H. Jeurgens and A. W. Hassel, et al., Impact of Electrolyte Incorporation in Anodized Niobium on Its Resistive Switching, Nanomaterials, 2022, 12(5), 813 CrossRef CAS PubMed.
- N. A. Tulina, A. N. Rossolenko, I. Y. Borisenko, I. M. Shmytko, A. M. Ionov and A. A. Ivanov, Realization of rectifying and resistive switching behaviors of mesoscopic niobium oxide-based structures, Mater. Lett., 2014, 136, 404–406 CrossRef CAS.
- T. V. Kundozerova, G. B. Stefanovich and A. M. Grishin, Binary anodic oxides for memristor-type nonvolatile memory, Phys. Status Solidi C, 2012, 9(7), 1699–1701 CrossRef CAS.
- S. S. Kundale, A. P. Patil, S. L. Patil, P. B. Patil, R. K. Kamat and D. K. Kim, et al., Effects of switching layer morphology on resistive switching behavior: A case study of electrochemically synthesized mixed-phase copper oxide memristive devices, Appl. Mater. Today, 2022, 27, 101460, DOI:10.1016/j.apmt.2022.101460.
- S. M. Patil, S. S. Kundale, S. S. Sutar, P. J. Patil, A. M. Teli and S. A. Beknalkar, et al., Unraveling the importance of fabrication parameters of copper oxide-based resistive switching memory devices by machine learning techniques, Sci. Rep., 2023, 13(1), 4905, DOI:10.1038/s41598-023-32173-8.
- K. A. Nirmal, G. S. Nhivekar, A. C. Khot, T. D. Dongale and T. G. Kim, Unraveling the Effect of the Water Content in the Electrolyte on the Resistive Switching Properties of Self-Assembled One-Dimensional Anodized TiO2 Nanotubes, J. Phys. Chem. Lett., 2022, 13(33), 7870–7880 CrossRef CAS PubMed.
- T. V. Kundozerova, A. M. Grishin, G. B. Stefanovich and A. A. Velichko, Anodic Nb2O5 nonvolatile RRAM, IEEE Trans. Electron Devices, 2012, 59(4), 1144–1148 CAS.
- G. Amsel and D. Samuel, The mechanism of anodic oxidation, J. Phys. Chem. Solids, Pergamon Press, 1962, vol. 23 Search PubMed.
- G. Ramírez, S. E. Rodil, S. Muhl, D. Turcio-Ortega, J. J. Olaya and M. Rivera, et al., Amorphous niobium oxide thin films, J. Non-Cryst. Solids, 2010, 356(50–51), 2714–2721 CrossRef.
- D. M. Lakhiani and L. L. Shreir, Crystallization of amorphous niobium oxide during anodic oxidation, Nature, 1960, 188(4744), 49–50 CrossRef CAS.
- R. Tao, R. Todorovic, J. Liu, R. J. Meyer, A. Arnold and W. Walkosz, et al., Electron energy-loss spectroscopy study of metallic Nb and Nb oxides, J. Appl. Phys., 2011, 110(12), 124313, DOI:10.1063/1.3665193.
- M. Grundner and J. Halbritter, XPS and AES studies on oxide growth and oxide coatings on niobium, J. Appl. Phys., 1980, 51(1), 397–405 CrossRef CAS.
- C. Nico, T. Monteiro and M. P. F. Graça, Niobium oxides and niobates physical properties: Review and prospects, Progress in Materials Science, Elsevier Ltd, 2016, vol. 80, pp. 1–37 Search PubMed.
- Y. Liu, J. Guo, E. Zhu, L. Liao, S. J. Lee, M. Ding and X. Duan, Approaching the Schottky–Mott limit in van der Waals metal–semiconductor junctions, Nature, 2018, 557(7707), 696–700 CrossRef CAS PubMed.
- G. Milano, M. Luebben, Z. Ma, R. Dunin-Borkowski, L. Boarino and C. F. Pirri, et al., Self-limited single nanowire systems combining all-in-one memristive and neuromorphic functionalities, Nat. Commun., 2018, 9(1), 5151, DOI:10.1038/s41467-018-07330-7.
- X. Zhong, I. Rungger, P. Zapol, H. Nakamura, Y. Asai and O. Heinonen, The effect of a Ta oxygen scavenger layer on HfO2-based resistive switching behavior: Thermodynamic stability, electronic structure, and low-bias transport, Phys. Chem. Chem. Phys., 2016, 18(10), 7502–7510 RSC.
- A. Zaffora, F. di Quarto, H. Habazaki, I. Valov and M. Santamaria, Electrochemically prepared oxides for resistive switching memories, Faraday Discuss., 2019, 213, 165–181 RSC.
- H. Habazaki, T. Matsuo, H. Konno, K. Shimizu, S. Nagata and K. Matsumoto, et al., Influence of silicon species on the electric properties of anodic niobia, Electrochim. Acta, 2003, 48(23), 3519–3526 CrossRef CAS.
- J. P. S. Pringle, The anodic oxidation of superimposed metallic layers: theory, Electrochim. Acta, 1980, 25(11), 1423–1437 CrossRef CAS.
- J. A. Davies, B. Domeij, J. P. S. Pringle and F. Brown, The Migration of Metal and Oxygen during Anodic Film Formation, J. Electrochem. Soc., 1965, 112, 675 CrossRef CAS.
- Y. Li, S. Long, Y. Liu, C. Hu, J. Teng and Q. Liu, et al., Conductance Quantization in Resistive Random Access Memory, Nanoscale Research Letters, Springer, New York LLC, 2015, vol. 10 Search PubMed.
- W. Xue, S. Gao, J. Shang, X. Yi, G. Liu and R. W. Li, Recent Advances of Quantum Conductance in Memristors. Advanced Electronic Materials, Blackwell Publishing Ltd, 2019, vol. 5 Search PubMed.
- G. Milano, M. Aono, L. Boarino, U. Celano, T. Hasegawa and M. Kozicki, et al., Quantum conductance in memristive devices: fundamentals, developments, and applications, Adv. Mater., 2022, 2201248 CrossRef CAS PubMed.
- S. Deswal, A. Kumar and A. Kumar, Investigating unipolar switching in Niobium oxide resistive switches: Correlating quantized conductance and mechanism, AIP Adv., 2018, 8(8), 085014, DOI:10.1063/1.5040466.
Footnote |
| † Electronic supplementary information (ESI) available. See DOI: https://doi.org/10.1039/d3cp01160g |
| This journal is © the Owner Societies 2023 |