
 Open Access Article
 This Open Access Article is licensed under a
 Creative Commons Attribution 3.0 Unported Licence
Absolute quantum yield for understanding upconversion and downshift luminescence in PbF2:Er3+,Yb3+ crystals†
Eduard
Madirov
 a,
Dmitry
Busko
a,
Ian A.
Howard
ab,
Bryce S.
Richards
ab and
Andrey
Turshatov
*a
a,
Dmitry
Busko
a,
Ian A.
Howard
ab,
Bryce S.
Richards
ab and
Andrey
Turshatov
*a
aInstitute of Microstructure Technology, Karlsruhe Institute of Technology, Hermann-von-Helmholtz-Platz 1, 76344 Eggenstein-Leopoldshafen, Germany. E-mail: andrey.turshatov@kit.edu
bLight Technology Institute, Karlsruhe Institute of Technology, Engesserstrasse 13, 76131 Karlsruhe, Germany
First published on 10th April 2023
Abstract
The search for new materials capable of efficient upconversion continues to attract attention. In this work, a comprehensive study of the upconversion luminescence in PbF2:Er3+,Yb3+ crystals with different concentrations of Yb3+ ions in the range of 2 to 7.5 mol% (Er3+ concentration was fixed at 2 mol%) was carried out. The highest value of upconversion quantum yield (ϕUC) 5.9% (at 350 W cm−2) was found in the PbF2 crystal doped with 2 mol% Er3+ and 3 mol% Yb3+. Since it is not always easy to directly measure ϕUC and estimate the related key figure of merit parameter, saturated photoluminescence quantum yield (ϕUCsat), a method to reliably predict ϕUCsat can be useful. Judd–Ofelt theory provides a convenient way to determine the radiative lifetimes of the excited states of rare-earth ions based on absorption measurements. When the luminescence decay times after direct excitation of a level are also measured, ϕUCsat for that level can be calculated. This approach is tested on a series of PbF2:Er3+,Yb3+ crystals. Good agreement between the estimates obtained as above and the directly experimentally measured ϕUCsat values is demonstrated. In addition, three methods of Judd–Ofelt calculations on powder samples were tested and the results were compared with Judd–Ofelt calculations on single crystals, which served as the source of the powder samples. Taken together, the results presented in our work for PbF2:Er3+,Yb3+ crystals contribute to a better understanding of the UC phenomena and provide a reference data set for the use of UC materials in practical applications.
Introduction
The synthesis of materials with efficient upconversion (UC) luminescence is a hot topic in materials science due to their use in a wide range of applications. These include potential applications in photovoltaics and solar energy harvesting,1–3 security markers,4–7 luminescent thermometry,8,9 as well as tracers for advanced plastics sorting.10 Most of these applications are made possible by the unique optical properties of the trivalent ions of the lanthanides, which are defined by partially forbidden transitions within 4f electronic shells. UC processes in lanthanide doped materials can be realised by excited state absorption, photon avalanche or energy transfer up-conversion (ETU),11 with ETU providing the highest photoluminescence quantum yield (ϕUC) at intensities that can be regarded as low (<40 W cm−2).12–14Recently, efficient ETU in crystalline materials based on MF2 (M = Ca, Sr, Ba) hosts doped with Er3+ and Yb3+ has received increasing attention.15–19 These hosts generally have a cubic unit cell, which is considered unfavourable for radiative transitions and efficient energy transfer between doping ions, which is crucial for the ETU process. However, when doped with trivalent lanthanide ions, the symmetry of the local environment is reduced, increasing the probability of the transitions. This is because trivalent ions replace divalent cations and require charge compensation via F− ions taking interstitial positions in the lattice.20–23 In addition, MF2 hosts tend to have a lower maximum phonon energy than other fluoride hosts: CaF2 – 320 cm−1,24 SrF2 – 284 cm−1,24 BaF2 – 240 cm−1![[thin space (1/6-em)]](https://www.rsc.org/images/entities/char_2009.gif) 24versus β-NaYF4 – 360 cm−1,25 LaF3 – 350 cm−1,26 and LiYF4 – 460 cm−1.27,28 Low phonon energy hosts favour achieving high ϕUC values. For near-infrared (980 nm) to visible UC, the highest ϕUC values observed in MF2 materials are 6.5% in SrF2:Er3+,Yb3+16 and 10.0% in BaF2:Er3+,Yb3+,19 whereas the highest known ϕUC in a material doped with Er3+ and Yb3+ ions is 11% in β-NaYF4.13 However, to date, there have been only a small number of publications on lanthanide-doped crystalline PbF2 hosts. From the available data it can be inferred that PbF2 doped with Er3+ and Yb3+ should perform similarly to the other materials mentioned above due to low phonon energy (257 cm−1).29 In addition, the observed ϕUC increases when moving from SrF2 to BaF2 thus suggesting that heavier cations help to achieve high ϕUC values, thus PbF2 could offer even better UC performance.
24versus β-NaYF4 – 360 cm−1,25 LaF3 – 350 cm−1,26 and LiYF4 – 460 cm−1.27,28 Low phonon energy hosts favour achieving high ϕUC values. For near-infrared (980 nm) to visible UC, the highest ϕUC values observed in MF2 materials are 6.5% in SrF2:Er3+,Yb3+16 and 10.0% in BaF2:Er3+,Yb3+,19 whereas the highest known ϕUC in a material doped with Er3+ and Yb3+ ions is 11% in β-NaYF4.13 However, to date, there have been only a small number of publications on lanthanide-doped crystalline PbF2 hosts. From the available data it can be inferred that PbF2 doped with Er3+ and Yb3+ should perform similarly to the other materials mentioned above due to low phonon energy (257 cm−1).29 In addition, the observed ϕUC increases when moving from SrF2 to BaF2 thus suggesting that heavier cations help to achieve high ϕUC values, thus PbF2 could offer even better UC performance.
Usually, the UC samples can be obtained either in a form of micro/nanometer size particles or in a form of single crystals. While the characterisation of crystalline materials is best performed when the samples are in the form of single crystals due to the convenient and reliable measurement of the absorption coefficient, luminescence decay time and ϕUC value as well as Judd–Ofelt (JO) calculations, the micro- or nanoparticles are often more feasible for applications and easier to synthesise. Thus, it is crucial to compare the results obtained with these two forms of the material.
This paper presents a comprehensive study of PbF2 crystals doped with Er3+ and Yb3+ – the Er3+ concentration was set to either 2 or 1.5 mol% and the Yb3+ concentration was varied in the range 1.5–7.5 mol%. To gain insight the upconversion properties of the studied crystals, both the power density dependent ϕUC under 976 nm excitation and the down-shifting quantum yield (ϕDS) under 522 and 652 nm excitation were obtained. The analysis of ϕUC and ϕDS values and radiative lifetimes from JO calculations was used to understand the UC mechanism and to find factors limiting ϕUC in Yb3+/Er3+ codoped PbF2 crystals. In addition, powder samples prepared by grinding the above crystals were studied. JO analysis on crystalline and powder samples provided a useful comparison of three different methods for calculating JO parameters on powder materials.
Experimental part
Synthesis procedure
The single crystals based on PbF2 doped with Yb3+ and Er3+ were grown by the Bridgman technique in a vacuum using the CF4 fluorination atmosphere in multichannel graphite crucibles with a temperature gradient (7 deg mm−1). The growth rate (7 mm hour−1) was estimated from the stability function of a flat crystallization front.30 Based on the PbF2–RF3 (R = Yb, Er)31 phase diagrams, the single crystal growth temperature was chosen to be 870 °C. The crystalline samples were prepared in a shape of disks 10 mm in diameter and about 1.7 mm in thickness, cut perpendicular to the long axis of the crystal boule.Characterization
To estimate maximum host phonon energy, the Raman spectrum of the undoped PbF2 sample was recorded (Polytec i-Raman instrument) using 785 nm excitation and with a 3.5 cm−1 resolution. It was not possible to obtain the Raman spectrum of a doped PbF2 sample due to presence of emission from 4I9/2 energy level of Er3+ under 785 nm excitation that makes the detection of the pure Raman bands complicated.The crystalline structure of the samples was determined using the powder XRD patterns recorded with a diffractometer (Bruker, D2 PHASER) (CuKα radiation). A small part of the single crystal was ground into powder. The patterns were recorded in the 2 theta range from 10 to 70 degrees.
Absorption spectra of the crystals were recorded at a room temperature using a ultraviolet (UV)-visible (Vis)-NIR spectrophotometer (PerkinElmer Lambda 950) in absorbance mode. The instrument provided the absorbance data, which was then converted to the absorption coefficient using eqn (1):
 | (1) |
The concentration of Er3+ and Yb3+ ions (Table S2, ESI†) was determined by wavelength dispersive X-ray fluorescence (WDXRF) spectroscopy (Pioneer S4, Bruker AXS).
Excitation spectra were recorded using a calibrated spectrophotometer (Varian Cary Eclipse). Diffuse reflectance spectra were recorded at room temperature using a spectrophotometer (PerkinElmer Lambda 950) in absorbance mode with the sample placed inside an integrating sphere.
The setup and the methodology for estimating ϕUC under 976 nm excitation have been described previously.16,19,32 The setup is built around an integrating sphere (Labsphere, Ø6′′, 3 P-LPM-060-SL) and uses two calibrated spectrometers (Avantes, AvaSpec-ULS2048×64TEC, Thorlabs, CCS200/M) to register the intensity of the sample emission and the incident laser. A 976 nm laser diode (Roithner) driven by a laser diode controller (ITC4001, Thorlabs) is used as the excitation source and the incident intensity is varied with a variable filter wheel (Thorlabs, NDC-100C-2).
To record the ϕDS of the 4S3/2 → 4I15/2 and 4F9/2 → 4I15/2 transitions of the Er3+ ions, a tunable continuous wave (CW) laser (Solstis with EMM-Vis, M-Squared Lasers Ltd) pumped by 532 nm laser (Verdi-V18, Coherent) is used. The system is tuned to 522 nm for the direct excitation of the 4S3/2 level and to 652 nm for the direct excitation of the 4F9/2 level. For the measurement of ϕDS of the 4I13/2 → 4I15/2 transition under direct excitation the tunable laser kit (Thorlabs, TLK-L1550M) operating at 1495 nm was used as the excitation source. The rest of the setup was the same as described in our previous publication.19,32
Luminescence lifetimes are measured using an optical system described previously.17,19 525 nm, 976 nm, and 633 nm (Roithner) and 1550 nm (Thorlabs) laser diodes mounted in temperature stabilized mounts (TCLDM9, Thorlabs) and driven by a laser diode controller (ITC4001, Thorlabs) are used as the excitation sources. The luminescence wavelength is selected with a double monochromator (Bentham, DTMS300) and the signal is detected with a photomultiplier tube (R928P, Hamamatsu) mounted in a temperature-cooled housing (CoolOne, Horiba) in the UV-Vis region or with an infrared single-photon detector (ID Quantique, ID220) in IR region-both detectors are coupled to the multi-channel scaling card (TimeHarp 260, Picoquant).
Results and discussion
Crystal structure characterization
The measured powder XRD patterns are presented in Fig. 1(a). The data is in good agreement with JCPDS card # 76-1816. The XRD patterns show that the parameters of a unit cell change with doping concentration. To illustrate this the position of the [111] peak in samples with different Yb3+ contents is plotted in Fig. 1(b). The position of the [111] peak is shifted to the higher angles as the concentration of the dopant ions is increased. This is due to the fact that the ionic radius of the Er3+ and Yb3+ ions is smaller than that of the Pb2+ ions, which causes the shrinking of the unit cell in samples with higher doping concentration. The Raman spectrum for an undoped PbF2 crystal is presented in Fig. 1(c). It consists of a broad band with a maximum at 260 cm−1. This value agrees well with the previously reported phonon energy of a PbF2 crystal equal to 257 cm−1.29 | ||
| Fig. 1 (a) Powder XRD patterns of the PbF2:Er3+,Yb3+ samples; (b) change in the [111] peak position with increasing Yb3+ concentration; (c) room temperature Raman spectrum of the undoped PbF2 crystal. | ||
Absorption spectra and JO calculations
The absorption spectra of the samples investigated are given in Fig. 2. The spectra contain absorption bands in the UV, Vis and NIR regions typical for Er3+ and Yb3+ ions. The transitions corresponding to the most intense bands are labelled in Fig. 2. The positions of all bands remain the same in all samples and are in agreement with the available literature data.16,19 The absorption data can be used in the JO method to calculate key features of electron levels in luminescent materials, such as radiative lifetime and branching ratios. The comparison of these radiative lifetimes with experimentally obtained luminescence decays can additionally reveal the fraction of excitation energy emitted via radiative processes, which, in turn, can help to predict both the down-shifting quantum yield ϕDS and the upconversion quantum yield ϕUC.33,34 | ||
| Fig. 2 Absorption spectra of the PbF2:Er3+,Yb3+ crystals. | ||
A standard procedure was used to obtain JO parameters in our work.35,36 The JO theory uses absorption cross-sections to determine oscillator strengths (Table S1, ESI†). These values were then used to calculate JO parameters Ωt, which allow the description of a radiative transition between any two levels. To obtain the Ωt values, some additional parameters, such as the barycentre wavelength, the doping concentration of Er3+ ions, the refractive index and the reduced matrix elements should be accurately estimated beforehand. These values are given in Table 1 (reduced matrix elements37 and refractive index data38 were taken from the literature and are universal for all samples) and Table S2, ESI† (concentrations of doping ions estimated by the WDXRF method).
| Excited state | λ b, nm | [U(2)] | [U(4)] | [U(6)] | n |
|---|---|---|---|---|---|
| 4G11/2 | 378.5 | 0.9156 | 0.5263 | 0.1167 | 1.8314 |
| 2H9/2 | 406.5 | 0 | 0.0243 | 0.2147 | 1.8149 |
| 4F7/2 | 487.0 | 0 | 0.1465 | 0.6272 | 1.7857 |
| 2H11/2 | 522.0 | 0.7158 | 0.4128 | 0.0927 | 1.7774 |
| 4S3/2 | 542.0 | 0 | 0 | 0.2235 | 1.7740 |
| 4F9/2 | 653.0 | 0 | 0.55 | 0.4621 | 1.7593 |
| 4I13/2 | 1520.0 | 0.0195 | 0.1172 | 14.325 | 1.7335 |
Briefly, the parameters used in the JO calculations are obtained as follows. The absorption cross sections were calculated from the absorption spectra shown in Fig. 2 and the doping concentration of the Er3+ ions. The barycentre energy (Eb) and then the barycentre wavelength 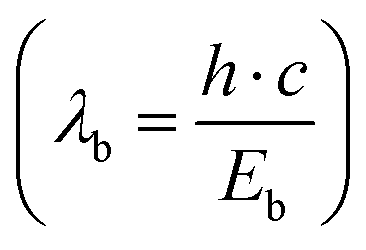 were determined using the method described by Hehlen et al.35 In general, when an absorption band spans over energies from E0 to E1 then Eb is defined as
  where α(λ) is absorption cross-section. The reduced matrix elements are taken from the work of Carnall et al.37 as Hehlen et al.35 demonstrated that the host has an insignificant effect on the values of the reduced matrix elements. The refractive indices n of the PbF2 corresponding to the wavelength of each absorption transition in the Er3+ ions are taken from the work of Malitson and Dodge.38 The root mean square (RMS) approach described by Hehlen et al.35 was used to calculate the JO parameters Ωt. This approach allows to reduce the influence of more intense absorption bands on the calculation result. The uncertainties in the JO parameters Ωt were calculated using the matrix approach described by Zhang et al.39 and by Görller–Walrand and Binnemans.40 The uncertainty of the radiative lifetime could also be calculated from the known uncertainty in Ωt (Table 2). The full results of the JO calculations are given in the Tables S2–S7 (ESI†), while Table 2 summarizes the values of radiative lifetimes (τrad) and branching ratios (β) that are important for the further discussion.
| Er1.5Yb15 | Er2Yb2 | Er2Yb3 | Er2Yb5 | Er2Yb7.5 | ||
|---|---|---|---|---|---|---|
| 4S3/2–4I15/2 | τ rad, ms | 1.12 ± 0.06 | 0.85 ± 0.05 | 0.81 ± 0.04 | 0.82 ± 0.04 | 0.63 ± 0.04 |
| β | 0.67 | 0.67 | 0.67 | 0.67 | 0.67 | |
| 4F9/2–4I15/2 | τ rad, ms | 1.47 ± 0.14 | 1.11 ± 0.12 | 1.06 ± 0.09 | 1.03 ± 0.11 | 0.86 ± 0.10 |
| β | 0.91 | 0.91 | 0.91 | 0.91 | 0.92 | |
| 4I13/2–4I15/2 | τ rad, ms | 9.71 ± 0.17 | 8.39 ± 0.20 | 8.12 ± 0.17 | 8.17 ± 0.19 | 7.00 ± 0.21 |
| β | 1.00 | 1.00 | 1.00 | 1.00 | 1.00 | |
| Judd–Ofelt parameters, ×10−20 cm2 | ||||||
| Ω 2 | 1.053 ± 0.105 | 1.342 ± 0.134 | 0.986 ± 0.099 | 0.952 ± 0.095 | 1.289 ± 0.129 | |
| Ω 4 | 0.836 ± 0.125 | 0.469 ± 0.070 | 1.163 ± 0.174 | 0.125 ± 0.019 | 1.381 ± 0.207 | |
| Ω 6 | 0.839 ± 0.042 | 1.795 ± 0.090 | 1.160 ± 0.058 | 1.140 ± 0.057 | 1.480 ± 0.074 | |
The following observations can be made from these results. Firstly, the increase in the doping concentration of Yb3+ leads to higher transition probabilities in Er3+ and thus shorter Er3+ radiative times. On the other hand, the branching ratios are similar in all samples. Unfortunately, in many cases there is no a simple relationship between the radiative lifetime and the number of emitted photons emitted, since non-radiative relaxation and various quenching processes must be taken into account. Nevertheless, the study of luminescence decay and knowledge of the radiative lifetime is a useful data set that can shed light on the quantum yield of luminescent materials.
Fig. 3(a) demonstrates the luminescence spectra of the PbF2:Er3+,Yb3+ crystals excited at a wavelength of 375 nm. The emission spectra consist of several peaks corresponding to 4S3/2–4I15/2, 4F1/2–4I15/2, 4S3/2–4I13/2, {Er3+:4I11/2 & Yb3+:2F7/2}–4I15/2 and 4I13/2–4I15/2 transitions. In order to correlate the results of the JO calculations with the experimental results, the luminescence decays of three states (4S3/2, 4F1/2 and 4I13/2) were studied (Fig. 3(b)–(d)) using the direct excitation of the above states. The first interesting observation based on these decays is that the decay time of the 4I13/2–4I15/2 transition (Fig. 3(d) and Table S8, ESI†) is always longer than the radiative lifetime calculated using the JO model (Table 2). The uncertainties of the experimentally determined decay times were calculated using a method described in the work of Fišerová and Kubala.41 It can be assumed that such an extension of the decay time is due to the re-absorption of emitted photons within the crystal.42,43 To test this hypothesis, two exemplary crystals (Er2Yb5 and Er2Yb2) were carefully ground and the powder was diluted with undoped PbF2 powder (the experimental protocol is inspired by the works of de Mello Donegá et al.42 and Rabouw et al.43) until the ratio between the undoped and doped fractions was 19 to 1. In such an experiment, the local concentration of Er3+ and Yb3+ remains unchanged, whereas the reabsorption can be significantly reduced by dilution. Indeed, the dilution led to a pronounced reduction in the decay time (Fig. 3(e)), which decreased from 8.8 ms to 5.4 ms for the powder with undoped/doped (Er2Yb5 crystal) ratios of 9/1 and 19/1 (Fig. 3(f)). The luminescence decays of the other two transitions 4S3/2–4I15/2 and 4F9/2–4I15/2 were also prolonged in the crystal (which may indicate an effect of re-absorption), but to a much lesser extent (Fig. S1, ESI†). Another example of data with a similar trend can be found in ESI† for the crystal Er2Yb2 (Fig. S2, ESI†).
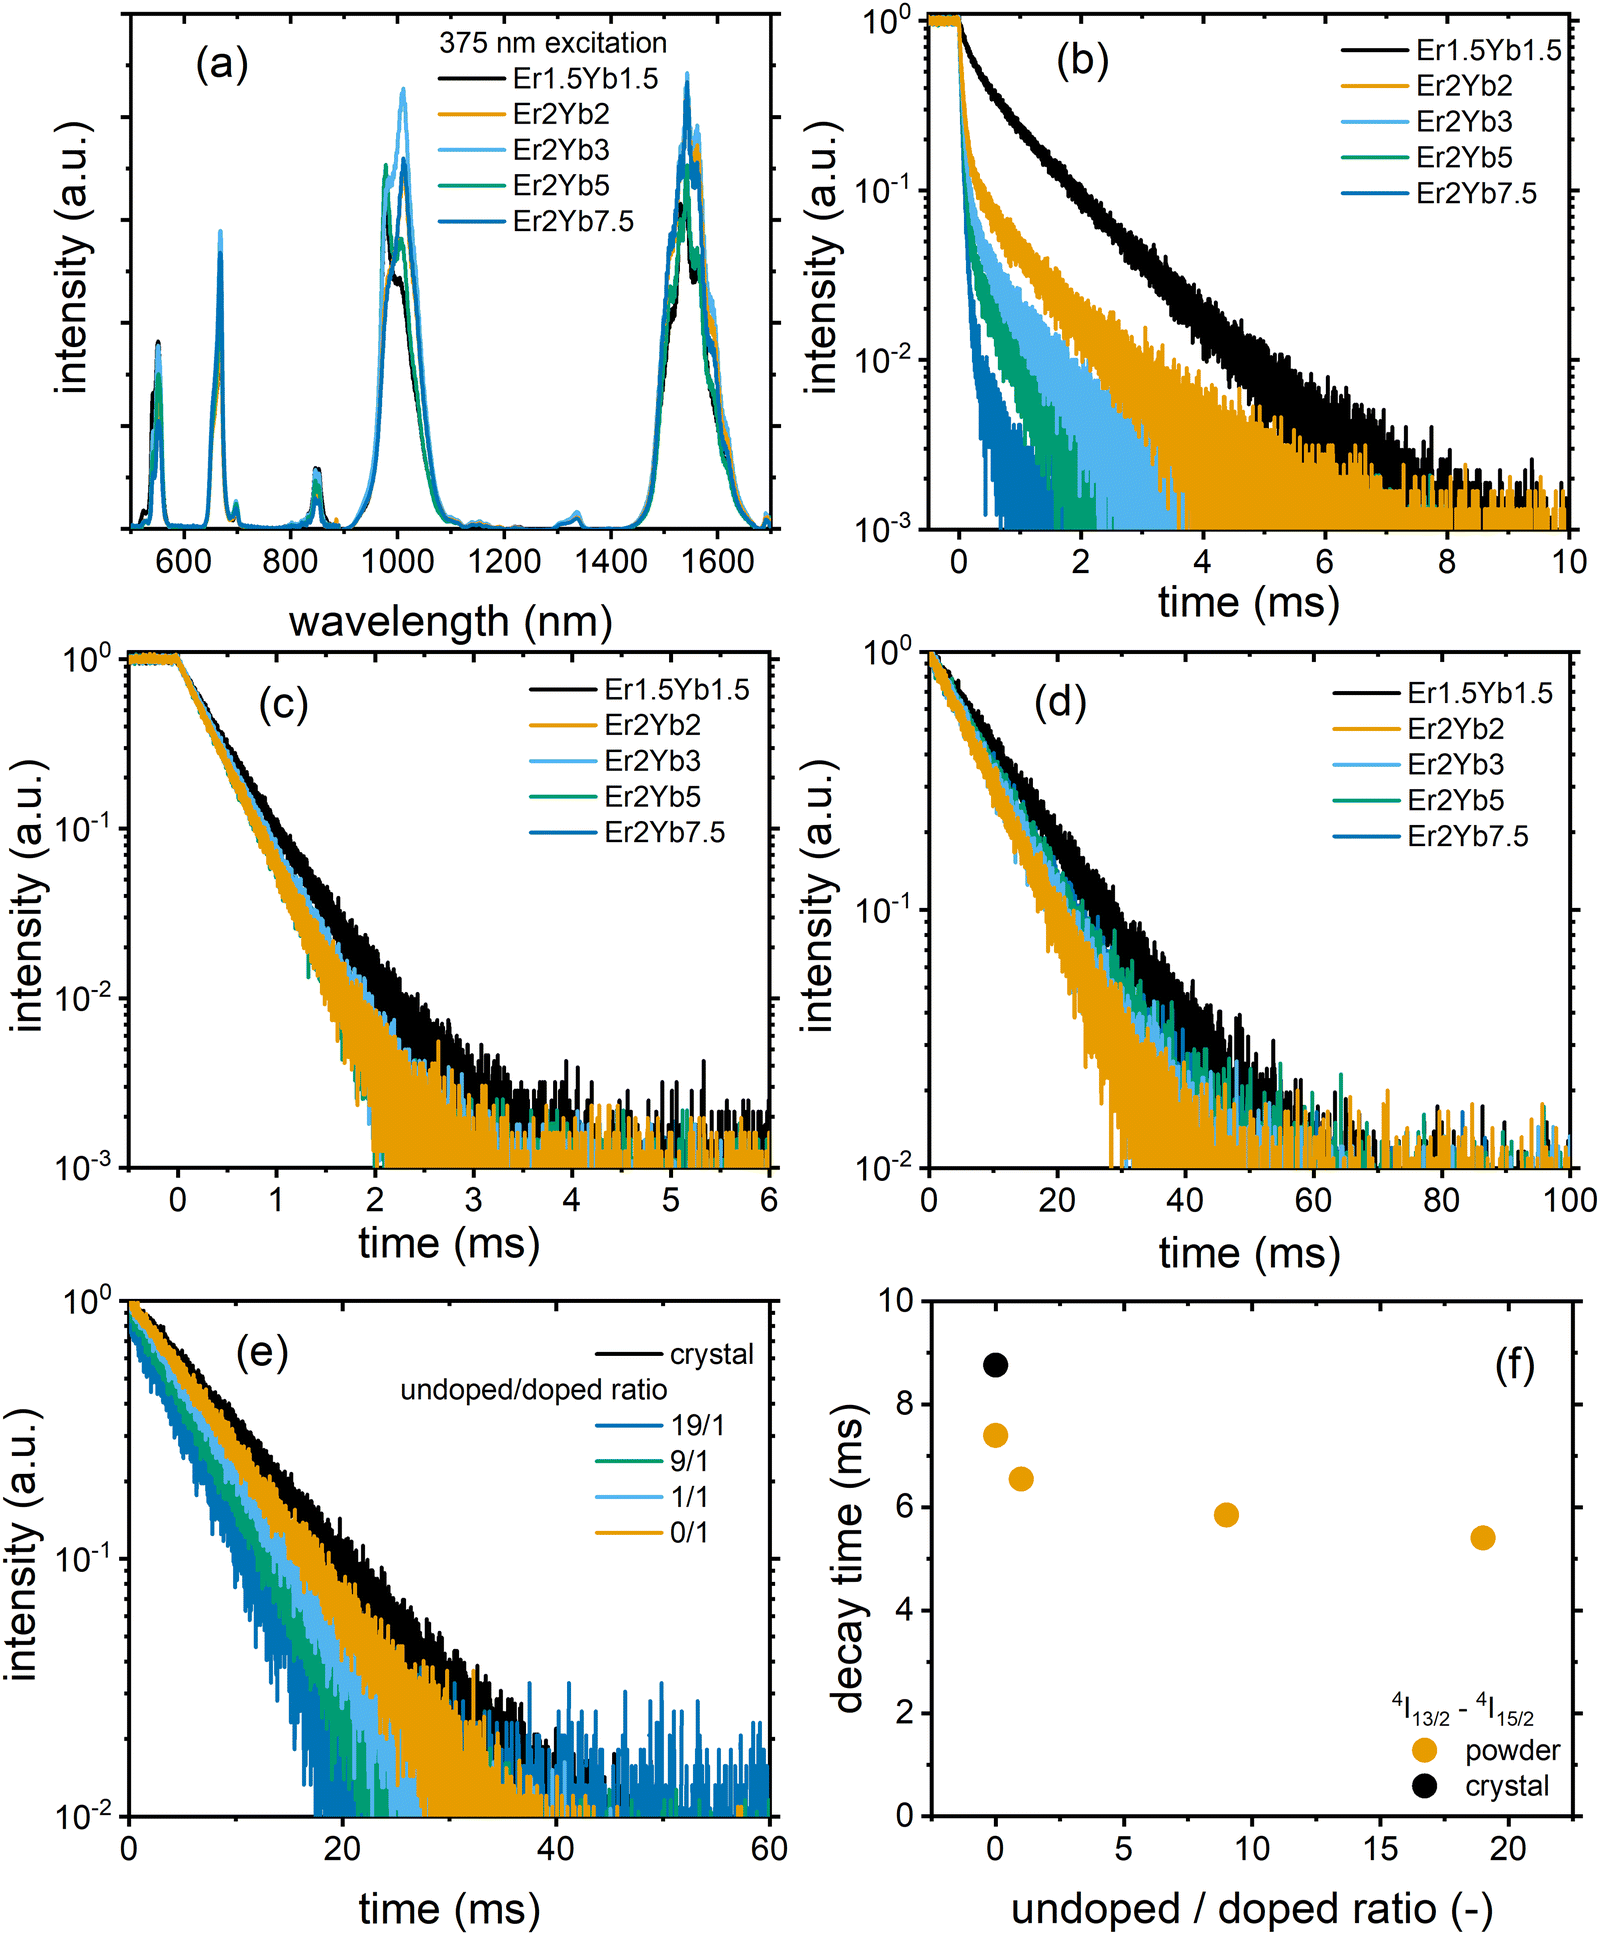 | ||
| Fig. 3 (a) Emission spectra under 375 nm excitation, (b) luminescence decay of the Er3+:4S3/2–4I15/2 transition under 525 nm excitation, (c) luminescence decay of the Er3+:4F9/2–4I15/2 transition under 640 nm excitation, (d) luminescence decay of the Er3+:4I13/2–4I15/2 transition under 1535 nm excitation in the PbF2:Er3+,Yb3+ samples; (e) luminescence decay and (f) luminescence decay time of the Er3+:4I13/2–4I15/2 of the PbF2:2 mol% Er3+,5 mol% Yb3+ crystal and diluted powders under 1535 nm excitation. | ||
A second interesting phenomenon can be observed in Fig. 3(b) with multi-exponential behaviour of all decays. It is well known that the 4S3/2 state of Er3+ undergoes cross-relaxation with the ground states of Er3+(4I15/2) and Yb3+(2F5/2).44 Due to the distribution of the inter-ion distance (Er3+–Er3+ or Er3+–Yb3+) the cross-relaxation rate can take different values, resulting in a multi-exponential decay. For simplicity, the decays in Fig. 3(b) were fitted with a bi-exponential model, giving the results shown in Table S8 (ESI†). It is important to note that crystals with the lowest Er3+ concentration (Er1.5Yb1.5 and Er2Yb2) demonstrate the presence of the short-lived component with decay times of 0.18 and 0.08 ms and a significant contribution from the long-lived component with decay times of 1.08 and 0.94 ms, respectively. Simultaneously, the JO calculation predicts radiative lifetimes of 1.12 and 0.85 ms (Table 2), respectively. Thus, the close examination of the decays for Er1.5Yb1.5 and Er2Yb2 crystals shows that the long-lived component of the decay is close to or even exceeds the radiative lifetime obtained with the JO method, which cannot be explained by simple re-absorption (with almost no extension of the experimental decay times in Fig. S1 and S2, ESI†) and requires a reasonable explanation.
It can be assumed that due to the formation of clusters of lanthanide ions in MF2 (M = Ca, Sr, Ba, Pb),20,45,46 which can affect the radiative transitions, the radiative decay time may have a distribution resulting in a multi-exponential decay. The long-lived component of the decay could correspond to Er3+ ions in a highly symmetric environment (cubic symmetry of the PbF2 crystal structure), whereas the short-lived component corresponds to Er3+ ions in a less symmetric environment (corresponding to ion clusters). These two symmetries are distinguishable in luminescence decays due to the strong cross-relaxation of the 4S3/2 state. The strong cross-relaxation is expected for the cluster environment (with a shorter interionic distance), which strongly reduces the lifetime of the short-lived component. The two different environments are more difficult to detect for the 4F9/2 and 4I13/2 states because these states do not participate in cross-relaxation and the difference between the radiative lifetimes is hardly noticeable in experimental decays.
Analysis of the amplitude ratio (Ai) for the short-lived and long-lived components (Table S8, ESI†) for decays of 4S3/2 state allows us to understand which fraction of the Er3+ ions are distributed in the two crystalline environments. The crystals with the lowest doping concentration of Er1.5Yb1.5 and Er2Yb2 have comparable A1 and A2 values (amplitudes of the short-lived and long-lived components, respectively). In this case, the processing of the absorption spectra with the JO model probably gives an “average” value of the radiative lifetime, although the correctness of the application of the JO model for a material with two radiative lifetimes may be questionable. As the concentration of Yb3+ increases (Er2Yb3, Er2Yb5 and Er2Yb7.5 crystals), the number of Er3+ ions in the cluster fraction increases and becomes >95% for the Er2Yb5 crystal. Therefore, the Er2Yb5 crystal (with a dominant radiative lifetime) was chosen for further analysis of the correlations between JO calculations and experimental results.
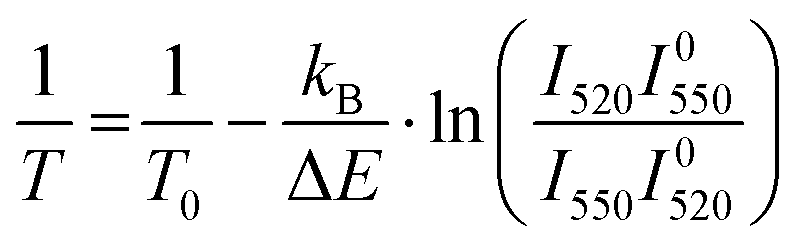
Assuming that in the Er2Yb5 crystal (i) there is only one value of the radiative lifetime for each 4S3/2, 4F9/2 and 4I13/2 state; (ii) there is a constant quenching rate for the 4S3/2, 4F9/2 and 4I13/2 states, where the quenching mechanism of the 4S3/2 state is cross-relaxation with the ground states (4I15/2 or 2F5/2); and (iii) the measurement artefact associated with the re-absorption of emitted photons is suppressed, the radiative lifetime, decay time, and quantum yield are bound by a simple equation:
 | (2) |
It is very likely that the conditions (i)–(iii) can be fulfilled for the 4S3/2–4I13/2 transition in the Er2Yb5 sample. Especially because this transition between two excited states is less affected by re-absorption. For example, Fig. S1c, and S3 (ESI†) indicate that there is a similar decay time for the 4S3/2–4I13/2 transition in the Er2Yb5 crystal and all powder mixtures prepared on the bases of this crystal. Taking into account the decay time (τ = 0.05 ± 0.01 ms), the radiative lifetime (τrad = 0.82 ± 0.01 ms) and the branching ratio of β = 0.28 (Table S6, ESI†), eqn (2) allows to calculate the quantum yield of the 4S3/2–4I13/2 luminescence as ϕDS = 1.4 ± 0.3%, which agrees very well with the measured value of ϕDS = 1.3% (Table 3). When the same equation is applied to the 4S3/2–4I15/2 and 4F9/2–4I15/2 transitions, the calculation gives values of quantum yield of ϕDS = 3.3 ± 0.07% and ϕDS = 29.2 ± 4.7% respectively. However, lower values of quantum yield of ϕDS = 3.1% and ϕDS = 24.7% (Table 3) have been measured experimentally using an integrating sphere and correction procedure in agreement to Wilson and Richards47 (Fig. S4, ESI†). The  values before the correction as measured in an integrating sphere are given in Table S9 (ESI†). It is assumed that the difference between the quantum yields predicted (based on lifetime) and experimentally measured quantum yields – 3.3% vs. 3.1% (for the 4S3/2–4I13/2 transition) and 29.2% vs. 24.7% (for the 4F9/2–4I15/2 transition) – illustrates the realistic degree of agreement that can be expected between the JO calculations and the experimental result.
| Excitation | Emission | Er1.5Yb1.5 | Er2Yb2 | Er2Yb3 | Er2Yb5 | Er2Yb7.5 |
|---|---|---|---|---|---|---|
| 522 nm | 4S3/2–4I15/2 | 5.4 | 3.2 | 3.5 | 3.1 | 2.5 |
| 4S3/2–4I13/2 | 2.0 | 1.2 | 1.5 | 1.3 | 0.9 | |
| 4F9/2–4I15/2 | 8.7 | 7.6 | 7.0 | 4.0 | 1.7 | |
| {Er3+:4I11/2 & Yb3+:2F7/2} | 46.7 | 51.9 | 57.0 | 48.3 | 42.0 | |
| 652 nm | 4F9/2–4I15/2 | 22.0 | 23.5 | 28.2 | 24.7 | 23.4 |
| {Er3+:4I11/2 & Yb3+:2F7/2} | 29.5 | 31.9 | 31.5 | 29.4 | 18.9 | |
| 940 nm | {Er3+:4I11/2 & Yb3+:2F7/2} | 37.3 | 60.6 | 69.4 | 52.9 | 43.2 |
| 4I13/2–4I15/2 | 3.0 | 4.4 | 4.5 | 2.7 | 3.0 | |
| 1495 nm | 4I13/2–4I15/2 | 85.1 | 74.8 | 69.2 | 68.6 | 69.5 |
Given the results presented in Table 3, the probabilities of the transitions 4S3/2–4F9/2 and {Er3+:4I11/2 & Yb3+:2F7/2}–4I13/2 can be also estimated from the values of ϕDS. Considering the model with three energy levels (0, 1 and 2) (Fig. S5, ESI†), the probability of transition (as the sum of radiative and non-radiative transitions) φ2−1 can be calculated using the quantum yields of the radiative transition (ϕ1−0) at excitations (0–1) and (0–2):
 | (3) |
The data in Table 4 demonstrates that φ2–1 for the {Er3+:4I11/2 & Yb3+:2F7/2}–4I13/2 transition is in the range of 0.04–0.07 for all Yb3+ concentrations and is slightly smaller than the probability for the 4I11/2–4I13/2 radiative transition, since it has been shown that the branching ratio for the 4I11/2–4I13/2 transition in Er3+ doped fluorides is in the range 0.11–0.15.33,48,49 In contrast, the φ2–1 value for the 4S3/2–4F9/2 transition decreases with increasing Yb3+ concentration, indicating the predominance of cross-relaxation over non-radiative relaxation in crystals with high Yb3+ doping concentration.
| φ 2–1 | Er1.5Yb1.5 | Er2Yb2 | Er2Yb3 | Er2Yb5 | Er2Yb7.5 |
|---|---|---|---|---|---|
| 4S3/2–4F9/2 | 0.40 | 0.32 | 0.25 | 0.14 | 0.07 |
| {Er3+:4I11/2 & Yb3+:2F7/2}–4I13/2 | 0.04 | 0.06 | 0.07 | 0.04 | 0.04 |
Judd–Ofelt calculations for powder samples
JO calculations can help predicting parameters like radiative transition rates, branching ratios and even quantum efficiencies that can give an insight into the applicability of the materials. However, it is not always possible to obtain single crystals of the desired chemical composition for the JO analysis. In most cases, newly synthesized materials are obtained in a form of micro- or nanoparticles. For such samples, it is not easy to obtain the absorption cross-section for the JO method as it first requires determination of the absorption coefficient that in turn can be defined if the light propagation path is known. Instead, powder samples are usually treated using excitation50 and diffuse reflection51–53 spectra. We assumed that the accuracy of JO calculations for a powder sample can be evaluated if the result of JO calculations for the equivalent crystal is already known. To test this approach a part of the Er2Yb5 crystal was ground into microparticles, followed by measurements of excitation and diffuse reflectance spectra.In the case of Er3+ ions, all methods of JO analysis of powder samples use the luminescence decay time of the 4I13/2–4I15/2 transition to calibrate the JO parameters Ωt. It is assumed that the luminescence decay time of the 4I13/2–4I15/2 transition is equal to the radiative lifetime and that the ϕDS of the 4I13/2–4I15/2 transition is equal to 100% upon the excitation of the 4I13/2 state. However, this assumption does not take into account the various quenching processes that can take place in the non-ideal sample. In order to quantify this effect, the ϕDS of the 4I13/2–4I15/2 transition was determined using 1495 nm excitation, giving a value of 68.8%. Furthermore, the results of the previous section clearly show that the decay times obtained for the crystal and for the powder with the same chemical composition differ significantly due to reabsorption effect.54 The decay time of the 4I13/2–4I15/2 transition in the Er2Yb5 crystal is 8.8 ms whereas the same transition in the powder has a decay time of 7.4 ms (5.4 ms for the diluted powder (Fig. 2(f))). It can be also noted that the experimentally measured lifetime in the crystal exceeds the radiative lifetime obtained from the JO analysis, which is 8.4 ms.
Using eqn (1) (with β = 1) it is possible to determine experimentally that the radiative lifetime of the 4I13/2–4I15/2 transitions as 7.9 ms (given ϕDS = 68.6% and τ = 5.4 ms), which is in the good agreement with the value of 8.4 ms obtained from the JO calculations for the crystal. The results lead to a rather curious observation: quenching decreases the luminescence decay time, whereas reabsorption increases it. Thus, the experimental decay time for the powder (7.4 ms) is only coincidently close to the radiation lifetime predicted by JO theory (8.4 ms) for the single crystal. For the sake of simplicity, the value of 8.4 ms (calculated using JO theory for the crystal) was taken as the radiative lifetime in the further calculations for the powder sample.
With the radiative lifetime of the 4I13/2–4I15/2 transition is defined (8.4 ms), it is now possible to perform the JO calculations on powder samples. First, the Method A described in the paper50 was tested. It uses the excitation spectrum recorder while monitoring the emission of the 4S3/2–4I15/2 transition. The spectrum obtained is given in Fig. 4(a). Using the transitions marked with arrows, the JO parameters Ωt were calculated in arbitrary units and then recalculated using the radiative lifetime (8.4 ms) of the 4I13/2–4I15/2 transition established above. These parameters were then used to estimate the transition probabilities and radiative lifetimes of other transitions. The algorithm of this method is illustrated in Fig. S6a (ESI†).
 | ||
| Fig. 4 (a) The excitation spectrum of the 4S3/2–4I15/2 transition (detection at 540 nm); (b) the reflectance (R) spectrum of the Er2Yb5 powder sample. The arrows indicate the bands used to calculate the Judd–Ofelt parameters. | ||
Secondly, the Method B described in the paper51 was evaluated. This approach uses the diffuse reflectance spectrum of the powder sample. The spectrum obtained is presented in Fig. 4(b). The band located around 800 nm was excluded from the calculation due to its extremely low signal to noise ratio. The band with a maximum at 980 nm was also not included in the calculations because the observed absorption band is an overlap of the 4I11/2–4I15/2 transition of Er3+ ions and the 2F7/2–2F5/2 transition of Yb3+ ions. To convert from arbitrary units of the diffuse reflectance spectrum to cm2 of the absorption cross-section, the experimentally determined oscillator strength of the 4I15/2–4I13/2 transition is calibrated to the radiative lifetime of the 4I13/2–4I15/2 transition. The treated spectrum is then used to calculate the JO parameters Ωt. The algorithm of this method is illustrated in Fig. S6b (ESI†).
The final approach that was tested was Method C described in ref. 52,53. Unlike the previous case, here the absorption in arbitrary optical density units is used to calculate the relative intensity parameters. The actual JO parameters Ωt are calculated afterwards using the radiative lifetime of the 4I13/2–4I15/2 transition. In this case, a diffuse reflectance spectrum was used in combination with Kubelka–Munk theory to perform the calculations in arbitrary units. The algorithm of this method is illustrated in Fig. S6c (ESI†).
In order to compare the results obtained using these three different methods the RMS values of the radiative lifetimes and Ωt values obtained for the crystalline and powder samples were calculated (Table 5). The results of lifetimes in Table 5 and the comparison branching ratios in Table S10 (ESI†) clearly show the difference between the three methods. Although none of these approaches provide a 100% consistency between transition probabilities, the Method A50 as well as Method C52,53 show adequate agreement between values calculated on a single crystal sample and results obtained on powder. If the difference in Ωt values and branching ratios is also taken into account, then the Method C52,53 is preferred. It should also be noted that the radiative lifetimes of the weak 4I9/2–4I15/2 transition show the greatest difference between the methods. This state has a lower absorption and emission intensity as well as a worse agreement between experimental and calculated transition probabilities compared to other emissive excited states of the Er3+.49 However, excluding this transition from the calculation of RMS (Table 5) did not change the conclusion that the method described in Method C52,53 better fits the parameters calculated for the single crystal.
| Emission band | Lifetime, ms | |||
|---|---|---|---|---|
| Crystal | Method A50 | Method B51 | Method C52,53 | |
| 4G9/2–4I15/2 | 0.56 | 0.40 | 0.58 | 0.50 |
| 2H11/2–4I15/2 | 0.62 | 0.35 | 0.89 | 0.77 |
| 4S3/2–4I15/2 | 0.82 | 0.73 | 0.71 | 0.61 |
| 4F9/2–4I15/2 | 1.03 | 0.51 | 1.66 | 1.43 |
| 4I9/2–4I15/2 | 8.42 | 3.81 | 17.56 | 14.69 |
| 4I11/2–4I15/2 | 9.02 | 8.44 | 9.01 | 7.26 |
| 4I13/2–4I15/2 | 8.17 | 8.19 | 12.71 | 8.09 |
| Relative RMS (with 4 I 9/2 ) | 0.91 | 1.44 | 0.94 | |
| Relative RMS (w/o 4 I 9/2 ) | 0.73 | 0.95 | 0.57 | |
| Judd–Ofelt parameters, × 10−20 cm2 | ||||
| Ω 2 | 0.95 | 1.08 | 0.68 | 0.73 |
| Ω 4 | 0.12 | 1.79 | 0.31 | 0.34 |
| Ω 6 | 1.14 | 0.95 | 1.00 | 1.08 |
| Relative RMS | 2.86 | 0.74 | 0.67 | |
As an additional proof, the same procedure was carried out with the Er2Yb2 crystal. Similarly, to the Er2Yb5 the JO calculations are first performed with the material in the form of a crystal, which was then ground to powder and the same three methods are tested. The results obtained are presented in Fig. S7 (ESI†), as well as Tables S11 and S12 (ESI†). The data allow the same conclusions to be drawn: Method C52,53 gave better agreement between the values obtained on a crystal sample and on a powder sample.
Up-conversion luminescence in PbF2:Er3+,Yb3+ crystals
Knowing the ϕDS of the 4S3/2 and 4F9/2 emitting states and the decay times of the {4I11/2 & Yb3+:2F7/2} and 4I13/2 intermediate states, one can estimate the efficiency of the UC process based on excited state energy transfer. In general, ϕUC should be less than or equal to 0.5ϕDS as UC is a two- or three-photon process. In addition, the longer decay time of {4I11/2 & Yb3+:2F7/2} and 4I13/2 states provides a greater probability of UC at lower excitation intensities, which is important for many applications.Fig. 5(a) demonstrates the upconversion emission spectra under 976 nm excitation with an intensity of 350 W cm−2, where all spectra are normalised to the maximum intensity of the 4F9/2–4I15/2 transition. First, the UC properties of the crystals were investigated experimentally using a direct approach: ϕUC was measured in the integrating sphere at different excitation intensities of the 976 nm laser. It is important to note that the results of measurements of ϕUC can be biased in a number of ways.55 First, at high intensities the samples can heat up, reducing the emission intensity. Second, the emission can be reabsorbed by the sample as it propagates trough the integrating sphere, reducing the luminescence. The last major source of the error in the estimation of the ϕUC is related to the geometry of the sample. During propagation through the sample, the excitation intensity is being absorbed. This leads to a decrease in the incident intensity inside the sample, and due to the non-linear nature of the up-conversion process, a decrease in observed ϕUC.
 | ||
| Fig. 5 (a) UC emission spectra under the 976 nm excitation (intensity of 350 W cm−2); (b) ϕUC in the intensity range of 0.1–350 W cm−2. | ||
The first problem can be solved by estimating the temperature of the sample from the ratio of the 2H11/2–4I15/2 and 4S3/2–4I15/2 emission bands, which are thermally coupled. The temperature can be calculated as
 | (4) |
 and
and  are the emission intensities at the initial temperature.
The procedure was described in detail in the literature56 and the results of the calculation with eqn (4) are displayed in Fig. S8 (ESI†). It can be seen that only in the sample with the highest concentration of Yb3+ (Er2Yb7.5) there is noticeable change in the temperature of the sample.
The problem of re-absorption within the integrating sphere can be solved as described previously for ϕDS in Table 3 and Fig. S4 (ESI†). Finally, in order to account for the effect of sample size on the calculated ϕUC values, several assumptions should be made. A crystalline sample of a given thickness is considered to be a seamless stack of 100 layers. The ϕUC of each layer was assumed to be ϕUC ∝ In where I is the incident intensity and n is varied from 0 to 1 in 0.1 steps to illustrate different power dependencies of ϕUC. It is then possible to calculate the number of incident and absorbed photons for each layer as well as the ϕUC of the layer. Combination of these two values (ϕUC and n) gives the number of photons emitted by each layer. By summing the emitted and absorbed photons in each layer, the ϕUC of the sample can be calculated based on measured ϕUC (Fig. S9, ESI†).
The ϕUC values after the above-mentioned corrections (similar to the detailed explanation given by Madirov et al.55) are presented in the Fig. 5(b). The data in Fig. 5(b) indicate that ϕUC increases as the incident intensity increases, reaching its maximum value of 5.9% observed at 350 W cm−2 for the Er2Yb3 crystal. It is known that the synthesis of PbF2 single crystals by the Bridgman method can lead to a certain amount of defects in the crystal lattice,57 which could quench the emission. As a result, it might lead to slightly lower observed ϕUC values compared to SrF2:Er3+,Yb3+ (6.5%)16 and BaF2:Er3+,Yb3+ (9.9%)19 crystals. As in BaF2:Er3+,Yb3+ and SrF2:Er3+,Yb3+, at low intensities (<10 W cm−2) the highest ϕUC is observed in the samples with the maximum amount of the Yb3+ ions (7.5%), whereas at higher intensities (>10 W cm−2) samples with a lower concentration (3%) of Yb3+ demonstrate the highest ϕUC.
The experimental dependence of ϕUC on excitation intensity can be examined using the approach proposed by Joseph et al. in order to estimate a single figure of merit parameter of the UC process – critical power density (CPD).32 Based on the CPD value, other important parameters of the UC process – the maximum value of the quantum yield (ϕUCsat) and the energy transfer rate between donor and acceptor ions (k12) can be derived.32 It should be noted that the CPD concept was derived for a two-photon UC process (such as population and emission from the 4S3/2 state) and not for a three-photon process (which sometimes refers to emission from the 4F9/2 state). Table 6 displays experimental values of the UC quantum yield at a maximum intensity of 350 W cm−2 (Max ϕUC), the values of the CPD, the values of ϕUCCPD (UC quantum yield at an intensity corresponding to the CPD), as well as ϕUCsat, and k12 derived from the CPD.
CPD); and saturation ϕUC (ϕUCsat) as well as energy transfer rate (k12) of the 4S3/2–4I15/2 transition
| Er1.5Yb1.5 | Er2Yb2 | Er2Yb3 | Er2Yb5 | Er2Yb7.5 | |
|---|---|---|---|---|---|
| Max ϕUC total, % | 4.3 | 4.4 | 5.9 | 4.7 | 5.8 |
| Max ϕUC4S3/2–4I15/2, % | 1.0 | 0.9 | 1.2 | 1.1 | 1.3 |
| CPD 4S3/2–4I15/2, W cm−2 | 48.4 | 37.9 | 17.8 | 16.0 | 9.2 |
|
ϕ
UCCPD, % |
0.4 | 0.3 | 0.4 | 0.2 | 0.2 |
| ϕ UCsat 4S3/2–4I15/2, % | 2.7 | 1.3 | 2.6 | 1.2 | 1.3 |
| k 12, ×10−17 cm3 s−1 | 0.6 | 1.5 | 2.1 | 1.9 | 5.4 |
The following conclusions can be drawn from the data in Table 6. The CPD value decreases as the concentration of the Yb3+ ions increases and reaches 9.2 W cm−2 for the Er2Yb7.5 sample. Slightly lower CPD values (∼1 W cm−2) have previously been reported for the most efficient hosts (NaYF4, YF3, YCl3, and La2O3) 32. However, these lower values were observed at a much higher concentration of Yb3+ (18%). Thus, a high concentration of Yb3+ is preferred to obtain a high quantum yield at a lower excitation intensity. In contrast, the highest value of ϕUCsat is expected for the sample with the lowest doping concentration (Er1.5Yb1.5), the sample with the lowest probability of the cross-relaxation. It is interesting to note that ϕUCsat (Table 6) is 0.5 ϕDS (Table 3) for most samples, with a slightly larger deviation for Er2Yb7.5. Furthermore, it could be assumed that in the case of the 4S3/2 state, the relatively low ϕDS is a limiting factor for achieving high ϕUC.
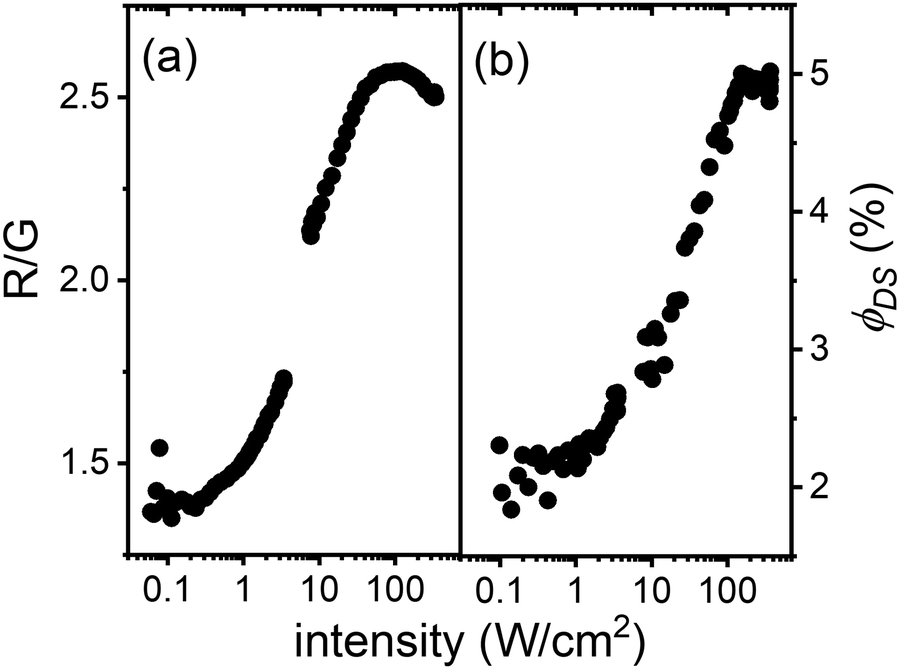
While it is well known that the green UC emission from the 4S3/2 state is a two-photon process, the red UC emission from the 4F9/2 state may have a more complex origin. It is hypothesized that if the 4F9/2 state is populated via relaxation of the 4S3/2 state (and also a two-photon process), the red-to-green (R/G) ratio in the UC spectra should be similar to the R/G ratio observed for the direct excitation of the 4S3/2 state. In the latter case, the R/G ratio can be estimated from the values of ϕDS given in Table 3. Therefore, a comparison of the R/G ratios for the UC and DS processes should shed light on the mechanism of the 4F9/2 state population. Fig. 6(a) demonstrates how the R/G ratio changes as a function of excitation intensity in the UC process for the Er2Yb5 sample. At low excitation intensities (<1 W cm−2), the R/G ratio in the UC spectra corresponds well to the R/G value obtained by direct excitation of the 4S3/2 state (R/G = 1.5). It is therefore likely that the 4F9/2 state originates from the 4S3/2 state via non-radiative relaxation. However, increasing the excitation intensity (>1 W cm−2) clearly leads to an increase in the R/G ratio. This rise in red emission can be explained either by the model proposed by Berry and May,58 where the 4F9/2 state results from the three-photon process of populating the 2H9/2 state and the subsequent back energy transfer to Yb3+, or by the ETU process involving 4I13/2 state.
 | ||
| Fig. 6 Er2Yb5 sample: (a) ratio of the intensities of the 4F9/2–4I15/2 (red) transition and the 4S3/2–4I15/2 (green) transition as a function of 976 nm excitation intensity in the 0.1–350 W cm−2; (b) ϕDS of the Er3+:4I13/2–4I15/2 transition as a function of intensity at 940 nm excitation. | ||
In turn, the 4I13/2 state can stem either by radiative transition from the 4I11/2 or 2S3/2 states, or by cross-relaxation of the 4S3/2 state. The probability of the 4I11/2–4I13/2 transition (0.04) was calculated earlier in Table 4 as the contribution of both radiative and phonon-assisted relaxation processes. This probability does not depend on the excitation intensity and, thus ϕDS of the 4I11/2–4I15/2 radiative process should also remain constant. However, an interesting observation can be found in Fig. 6(b). The quantum yield of the 4I11/2–4I15/2 luminescence increases with increasing laser intensity, suggesting that the 4I13/2 state is populated via a new pathway at high excitation intensity – mainly via cross-relaxation of the 2S1/2 state and minimally via the 2S3/2–4I13/2 radiative transition. Although it is rather difficult to decide how the 4F9/2 state is populated – either via the Berry and May model or via the 4I13/2 state – it can be assumed that the sublinear increase in the number of 4I13/2 states with excitation intensity leads to an increase in the number of 4F9/2 states (by the ETU process: 4I13/2 + 2F5/2 → 4F9/2 + 2F7/2) and thus to an increase in the R/G ratio. Fig. S11 (ESI†) also demonstrates the similar trends in the R/G ratio and ϕDS for other investigated samples. Thus, the assumption made about additional population of the 4F9/2 state via4I13/2 state can be valid for a wide range of Yb3+ concentrations (1.5–7.5%).
Conclusions
The optical properties of a series of crystalline PbF2:Er3+,Yb3+ samples (with fixed Er3+ concentration of 2 mol% and variable Yb3+) concentration of (2–7.5 mol%) were investigated. Since the luminescence properties of the 4S3/2 and 4F9/2 states of Er3+ are important for understanding of the UC in PbF2:Er3+,Yb3+ crystals, they were investigated by applying JO analysis, luminescence decay measurements and determination of the absolute luminescence quantum yield at the direct excitation of the corresponding states. It was shown that the quantum yield of the 4S3/2 and 4F9/2 states can be predicted using the JO model and luminescence decays, and that these values are in good conformity with experimental values of quantum yield measured by an integrating sphere. In the case study for the Er2Yb5 crystal, ϕDS values of 3.3% (4S3/2–4I15/2 transition) and 29.2% (4F9/2–4I15/2 transition) were obtained from the JO model, while 3.1% and 24.7%, respectively, were measured using an integrating sphere. The proposed method can also be applied to other upconversion materials doped with rare earth ions (Tm3+ and Ho3+), as long as it is possible to perform Judd–Ofelt analysis for the emitting ions and obtain luminescence decay times. Upon excitation with a 976 nm laser, all PbF2:Er3+,Yb3+ crystals exhibit bright UC emission. In the case study for the Er2Yb5 crystal, the value of ϕUCsat for the 4S3/2–4I15/2 transition was estimated to be 1.2%. This value follows an empirical rule ϕUCsat ≈ 0.5ϕDS, leading to the conclusion that the pure emission property of the 4S3/2 state is the limiting factor for a UC quantum yield. Overall, ϕUC can be as high as 4.4% for the Er2Yb5 crystal (at intensity of 350 W cm−2) because it also includes the 4F9/2–4I15/2 transition with much higher ϕDS. The 4F9/2 state originates from the 4S3/2via multi phonon relaxation (with probability of 0.136 for the Er2Yb5 sample) or via the ETU from the 4I13/2 state or via the 2H9/2 state. This complex path reduces the ϕUC for the 4F9/2–4I15/2 transition, although the emission property of the 4F9/2 state is good. The highest value of ϕUC 5.9% was measured for the Er2Yb3 crystal in the sample series.UC materials are often not available in the form of transparent crystals, but are synthesized as microcrystalline or nanocrystalline powders. Several methods of JO parameters calculation for powder samples are available in the literature. In the present work, comparison of three methods (for powder samples) with results obtained for a single crystal of identical material was done. The RMS analysis reveals that method,52,53 utilizing the reflection spectrum and giving Ωt parameters measured in arbitrary units, gives better agreement between the results obtained for the crystal and the powder. The true values of Ωt (in cm2) were then recovered by the known value of radiative lifetime for the 4I13/2–4I15/2 transition. However, it has been demonstrated that the radiative lifetime of the 4I13/2–4I15/2 transition cannot simply be considered equal to the measured decay time of the 4I13/2–4I15/2 transition, as very often due to the non-perfect crystalline materials and the presence of additional quenching channels ϕDS < 100%. More careful data evaluation of radiative rate for the 4I13/2–4I15/2 transition is therefore required before applying decay time of the 4I13/2–4I15/2 transition in the JO analysis.
Although ϕUC of PbF2:Er3+,Yb3+ crystals does not outperform SrF2:Er3+,Yb3+ (ϕUC = 6.5%) and BaF2:Er3+,Yb3+ (ϕUC = 10.0%) crystal series, the comprehensive data set presented in our work for PbF2:Er3+,Yb3+ crystals can contribute to a better understanding of UC phenomena and provide a reference data set for the use of UC materials in practical applications.
Conflicts of interest
There are no conflicts to declare.Acknowledgements
The reported study was funded DFG (project no. TU 487/8-1 for A. T. and B. S. R.). The financial support provided by the Helmholtz Association is gratefully acknowledged: (1) a Recruitment Initiative Fellowship for B. S. R.; (2) the funding of chemical synthesis equipment from the Helmholtz Materials Energy Foundry (HEMF); and (3) Research Field Energy—Program Materials and Technologies for the Energy Transition—Topic 1 Photovoltaics. The authors acknowledge T. Bergfeldt (IAM, KIT) for conducting WDXRF analysis.References
- R. Singh, E. Madirov, D. Busko, I. M. Hossain, V. A. Konyushkin, A. N. Nakladov, S. V. Kuznetsov, A. Farooq, S. Gharibzadeh, U. W. Paetzold, B. S. Richards and A. Turshatov, ACS Appl. Mater. Interfaces, 2021, 13, 54874–54883 CrossRef CAS PubMed.
- Q. Li, J. Lin, J. Wu, Z. Lan, Y. Wang, F. Peng and M. Huang, Electrochim. Acta, 2011, 56, 4980–4984 CrossRef CAS.
- B. S. Richards, D. Hudry, D. Busko, A. Turshatov and I. A. Howard, Chem. Rev., 2021, 121, 9165–9195 CrossRef CAS PubMed.
- N. Katumo, K. Li, B. S. Richards and I. A. Howard, Sci. Rep., 2022, 12, 2100 CrossRef CAS PubMed.
- A. Baride, J. M. Meruga, C. Douma, D. Langerman, G. Crawford, J. J. Kellar, W. M. Cross and P. S. May, RSC Adv., 2015, 5, 101338 RSC.
- J. Zhu, S. Wang, Z. Yang, S. Liao, J. Lin, H. Yao, F. Huang, Y. Zheng and D. Chen, Nanoscale, 2022, 14, 3407–3415 RSC.
- S. Wang, J. Lin, Y. He, J. Chen, C. Yang, F. Huang and D. Chen, Chem. Eng. J., 2020, 394, 124889 CrossRef CAS.
- M. S. Pudovkin, S. L. Korableva, D. A. Koryakovtseva, E. V. Lukinova, A. V. Lovchev, O. A. Morozov and V. V. Semashko, J. Nanopart. Res., 2019, 21, 266 CrossRef CAS.
- C. D. S. Brites, S. Balabhadra and L. D. Carlos, Adv. Opt. Mater., 2019, 7, 1801239 CrossRef.
- J. Woidasky, I. Sander, A. Schau, J. Moesslein, P. Wendler, D. Wacker, G. Gao, D. Kirchenbauer, V. Kumar, D. Busko, I. A. Howard, B. S. Richards, A. Turshatov, S. Wiethoff and C. Lang-Koetz, Resour., Conserv. Recycl., 2020, 161, 104976 CrossRef.
- F. Auzel, Chem. Rev., 2004, 104, 139–174 CrossRef CAS PubMed.
- I. Etchart, A. Huignard, M. Bérard, M. N. Nordin, I. Hernández, R. J. Curry, W. P. Gillin and A. K. Cheetham, J. Mater. Chem., 2010, 20, 3989–3994 RSC.
- M. Kaiser, C. Würth, M. Kraft, I. Hyppänen, T. Soukka and U. Resch-Genger, Nanoscale, 2017, 9, 10051–10058 RSC.
- M. Pokhrel, G. A. Kumar and D. K. Sardar, J. Mater. Chem. A, 2013, 1, 11595–11606 RSC.
- G. Wang, Q. Peng and Y. Li, J. Am. Chem. Soc., 2009, 131, 14200–14201 CrossRef CAS PubMed.
- D. Saleta Reig, B. Grauel, V. A. Konyushkin, A. N. Nakladov, P. P. Fedorov, D. Busko, I. A. Howard, B. S. Richards, U. Resch-Genger, S. V. Kuznetsov, A. Turshatov and C. Würth, J. Mater. Chem. C, 2020, 8, 4093–4101 RSC.
- S. Kuznetsov, Y. Ermakova, V. Voronov, P. Fedorov, D. Busko, I. A. Howard, B. S. Richards and A. Turshatov, J. Mater. Chem. C, 2018, 6, 598–604 RSC.
- S. Balabhadra, M. F. Reid, V. Golovko and J.-P. R. Wells, J. Alloys Compd., 2020, 834, 155165 CrossRef CAS.
- E. I. Madirov, V. A. Konyushkin, A. N. Nakladov, P. P. Fedorov, T. Bergfeldt, D. Busko, I. A. Howard, B. S. Richards, S. V. Kuznetsov and A. Turshatov, J. Mater. Chem. C, 2021, 9, 3493–3503 RSC.
- S. V. Chernov, W. Gunβer and I. V. Murin, Solid State Ionics, 1991, 47, 67–70 CrossRef CAS.
- R. Reisfeld and C. K. Jørgensen, Lasers and Excited States of Rare Earths, Springer Berlin Heidelberg, Berlin, Heidelberg, 1977, pp. 1–63 DOI:10.1007/978-3-642-66696-4_1.
- J. M. O’Hare, J. Chem. Phys., 1972, 57, 3838–3843 CrossRef.
- S. I. Mho and J. C. Wright, J. Chem. Phys., 1983, 79, 3962–3975 CrossRef CAS.
- D. G. Mead and G. R. Wilkinson, J. Phys. C-Solid State Phys., 1977, 10, 1063–1072 CrossRef CAS.
- H. Wu, Z. Hao, L. Zhang, X. Zhang, Y. Xiao, G.-H. Pan, H. Wu, Y. Luo, H. Zhao and J. Zhang, J. Phys. Chem. C, 2018, 122, 9611–9618 CrossRef CAS.
- M. J. Weber, Phys. Rev., 1967, 157, 262–272 CrossRef CAS.
- S. A. Miller, H. E. Rast and H. H. Caspers, J. Chem. Phys., 1970, 52, 4172–4175 CrossRef CAS.
- R. Moncorge, Ann. Chimie Sci. Materiaux, 2003, 28, 5–20 CrossRef CAS.
- P. Zhang, J. Yin, B. Zhang, L. Zhang, J. Hong, J. He and Y. Hang, Opt. Lett., 2014, 39, 3942–3945 CrossRef CAS PubMed.
- S. V. Kuznetsov and P. P. Fedorov, Inorg. Mater., 2008, 44, 1434–1458 CrossRef CAS.
- I. I. Buchinskaya and P. P. Fedorov, Russ. Chem. Rev., 2004, 73, 371–400 CrossRef CAS.
- R. E. Joseph, C. Jiménez, D. Hudry, G. Gao, D. Busko, D. Biner, A. Turshatov, K. Krämer, B. S. Richards and I. A. Howard, J. Phys. Chem. A, 2019, 123, 6799–6811 CrossRef CAS PubMed.
- D. K. Sardar, W. M. Bradley, J. J. Perez, J. B. Gruber, B. Zandi, J. A. Hutchinson, C. W. Trussell and M. R. Kokta, J. Appl. Phys., 2003, 93, 2602–2607 CrossRef CAS.
- J. Bergstrand, Q. Liu, B. Huang, X. Peng, C. Würth, U. Resch-Genger, Q. Zhan, J. Widengren, H. Ågren and H. Liu, Nanoscale, 2019, 11, 4959–4969 RSC.
- M. P. Hehlen, M. G. Brik and K. W. Krämer, J. Lumin., 2013, 136, 221–239 CrossRef CAS.
- I. Camarillo, E. Camarillo, F. Ramos, M. Flores and U. Caldiño, J. Phys.: Condens. Matter, 2004, 16, 5925 CrossRef.
- W. T. Carnall, H. Crosswhite and H. M. Crosswhite, Energy level structure and transition probabilities in the spectra of the trivalent lanthanides in LaF3, United States, 1978 Search PubMed.
- I. H. Malitson and M. J. Dodge, J. Opt. Soc. Am., 1969, 59, 500A Search PubMed.
- Y. Zhang, J.-M. Liu, M.-H. Liu, Z.-B. Zhang, W.-H. Wong and D.-L. Zhang, Spectrochim. Acta, Part A, 2020, 239, 118536 CrossRef CAS PubMed.
- C. Görller-Walrand and K. Binnemans, HPCRE, Elsevier, 1998, vol. 25, pp. 101–264 Search PubMed.
- E. Fišerová and M. Kubala, J. Lumin., 2012, 132, 2059–2064 CrossRef.
- C. de Mello Donegá, A. Meijerink and G. Blasse, J. Lumin., 1994, 62, 189–201 CrossRef.
- F. T. Rabouw, P. T. Prins, P. Villanueva-Delgado, M. Castelijns, R. G. Geitenbeek and A. Meijerink, ACS Nano, 2018, 12, 4812–4823 CrossRef CAS PubMed.
- A. Baride, P. S. May, Jr. and M. T. Berry, J. Phys. Chem. C, 2020, 124, 2193–2201 CrossRef CAS.
- F. Ma, F. Su, R. Zhou, Y. Ou, L. Xie, C. Liu, D. Jiang, Z. Zhang, Q. Wu and L. Su, Mater. Res. Bull., 2020, 125, 110788 CrossRef CAS.
- A. Gektin, N. Shiran, V. Nesterkina, Y. Boyarintseva, V. Baumer, G. Stryganyuk, K. Shimamura and E. Villora, J. Lumin., 2009, 129, 1538–1541 CrossRef CAS.
- L. R. Wilson and B. S. Richards, Appl. Opt., 2009, 48, 212–220 CrossRef CAS PubMed.
- H. Ebendorff-Heidepriem, D. Ehrt, M. Bettinelli and A. Speghini, J. Non-Cryst. Solids, 1998, 240, 66–78 CrossRef CAS.
- G. Yao, C. Lin, Q. Meng, P. Stanley May and M. T. Berry, J. Lumin., 2015, 160, 276–281 CrossRef CAS.
- W. Luo, J. Liao, R. Li and X. Chen, Phys. Chem. Chem. Phys., 2010, 12, 3276–3282 RSC.
- Y. Zhang, B. Chen, S. Xu, X. Li, J. Zhang, J. Sun, X. Zhang, H. Xia and R. Hua, Phys. Chem. Chem. Phys., 2018, 20, 15876–15883 RSC.
- E. Cantelar, M. Marin-Dobrincic, T. Jardiel, A. C. Caballero and F. Cussó, Opt. Mater., 2015, 41, 122–125 CrossRef CAS.
- A. Egaña, M. Tardío, C. de la Torre-Gamarra, A. Várez, E. Cantelar and J. E. Muñoz Santiuste, J. Lumin., 2018, 202, 232–238 CrossRef.
- J.-F. Cormier, M. Fortin, J. Frechette, I. Noiseux, M. Vernon and W. Long, The effects of self-absorption and detection geometry on fluorescence intensity and decay lifetime, SPIE, 2005 Search PubMed.
- E. Madirov, D. Busko, F. A. Cardona, D. Hudry, S. V. Kuznetsov, V. A. Konyushkin, A. N. Nakladov, A. A. Alexandrov, I. A. Howard, B. S. Richards and A. Turshatov, Adv. Photonics Res., 2022, 2200187 Search PubMed.
- G. Gao, D. Busko, N. Katumo, R. Joseph, E. Madirov, A. Turshatov, I. A. Howard and B. S. Richards, Adv. Opt. Mater., 2021, 9, 2001901 CrossRef CAS.
- G. Ren, D. Shen, S. Wang and Z. Yin, J. Cryst. Growth, 2002, 243, 539–545 CrossRef CAS.
- M. Y. Hossan, A. Hor, Q. Luu, S. J. Smith, P. S. May and M. T. Berry, J. Phys. Chem. C, 2017, 121, 16592–16606 CrossRef CAS.
Footnote |
| † Electronic supplementary information (ESI) available. See DOI: https://doi.org/10.1039/d3cp00936j |
| This journal is © the Owner Societies 2023 |