
 Open Access Article
 This Open Access Article is licensed under a Creative Commons Attribution-Non Commercial 3.0 Unported Licence
Synergic photoprotection of phenolic compounds present in tomato fruit cuticle: a spectroscopic investigation in solution†
Ana
González Moreno
 *a,
Jack M.
Woolley
b,
Eva
Domínguez
c,
Abel
de Cózar
de,
Antonio
Heredia
a and
Vasilios G.
Stavros
*b
*a,
Jack M.
Woolley
b,
Eva
Domínguez
c,
Abel
de Cózar
de,
Antonio
Heredia
a and
Vasilios G.
Stavros
*b
aIHSM-UMA-CSIC La Mayora, Departamento de Biología Molecular y Bioquímica, Universidad de Málaga (UMA), 29071, Málaga, Spain. E-mail: gonzalezana@uma.es
bDepartment of Chemistry, University of Warwick, Coventry, UK. E-mail: v.stavros@warwick.ac.uk
cIHSM-UMA-CSIC La Mayora, Plant breeding and Biotechnology, CSIC, 29750 Algarrobo-Costa, Málaga, Spain
dDepartamento de Química Orgánica I/Kimika Organikoa I Saila, Facultad de Química/Kimika Fakultatea, Universidad del País Vasco/Euskal Herriko Unibertsitatea (UPV/EHU) and Donostia International Physics Center (DIPC), P. K, 1072, 20018 San Sebastián – Donostia, Spain
eIkerbasque, Basque Foundation for Science, Plaza Euskadi 5, 48009, Bilbao, Spain
First published on 11th April 2023
Abstract
Coumaric acids and flavonoids play pivotal roles in protecting plants against ultraviolet radiation (UVR) exposure. In this work, we focus our photoprotection studies on p-coumaric acid and the flavonoid naringenin chalcone. Photoprotection is well-understood in p-coumaric acid; in contrast, information surrounding photoprotection in naringenin chalcone is lacking. Additionally, and vitally, how these two species work in unison to provide photoprotection across the UV-B and UV-A is unknown. Herein, we employ transient absorption spectroscopy together with steady-state irradiation studies to unravel the photoprotection mechanism of a solution of p-coumaric acid and naringenin chalcone. We find that the excited state dynamics of p-coumaric acid are significantly altered in the presence of naringenin chalcone. This finding concurs with quenching of the p-coumaric acid fluorescence with increasing concentration of naringenin chalcone. We propose a Förster energy transfer mechanism is operative via the formation of dipole–dipole interactions between p-coumaric acid and naringenin chalcone. To our knowledge, this is the first demonstration in plants of a synergic effect between two classes of phenolics to bypass the potentially damaging effects of UVR.
1. Introduction
Around 450 million years ago, plants started to migrate from water to dry land. This necessitated plants to develop mechanisms to protect them against new stresses, including harmful radiation.1 The most energetic radiation that reaches the Earth is ultraviolet radiation (UVR). It can be subdivided into UV-A (400–315 nm), UV-B (315–280 nm) and UV-C (280–100 nm). Since the ozone layer absorbs much of this radiation, notably UV-C and UV-B, only 5% of UVB and 95% of UV-A reach the Earth's surface.2UVR is required for plant survival and it is involved in photosynthesis and gene signalling, among other functions.3 Nevertheless, a strict balance is needed as excessive exposure to this radiation has deleterious effects such as DNA damage, protein and lipid damage, formation of reactive oxygen species (ROS), plant growth and development disruption.4 Plants respond to UVR exposure by accumulating aromatic ‘screening’ compounds, known henceforth as UV-filters.
UV-filters have a broad absorption within the UV-A and UV-B radiation range, often with critical wavelengths greater than 370 nm,5 typically dissipating this gained (usually electronic excitation) energy into non-harmful vibrational energy (or heat). Furthermore, these UV-filters are photostable even after prolonged periods of irradiation. Indeed, there is a growing library of such UV-filters being explored as potential plant-based sunscreens including sinapoyl malate. sinapic acid,6 sinapate ester derivates7,8 and symmetrical esterification of sinapic acid.9,10
The plant cuticle which covers the aerial parts of plants has been recently reported as a very efficient filter against UVR. Phenolic compounds accumulated within the cuticle, specifically p-coumaric acid (pca), have been reported to be responsible for this photoprotection.11 Interestingly, the tomato fruit cuticle also accumulates the flavonoid naringenin chalcone (nch) during ripening, which is responsible for the orange colour of the cuticle. Both pca and nch are secondary metabolites synthesised via the phenylpropanoid pathway and participate in plant protection against UVR.12 These molecules have complementary absorption spectra: pca mainly absorbs in the UV-B (λmax = 312 nm, Fig. 1b, see the Results and discussion section) and nch has its maximum in the UV-A13 (λmax = 365 nm, Fig. 1c). They also have a double bond which can undergo trans–cis photoisomerization; the chemical structures are shown in Fig. 1b and c.
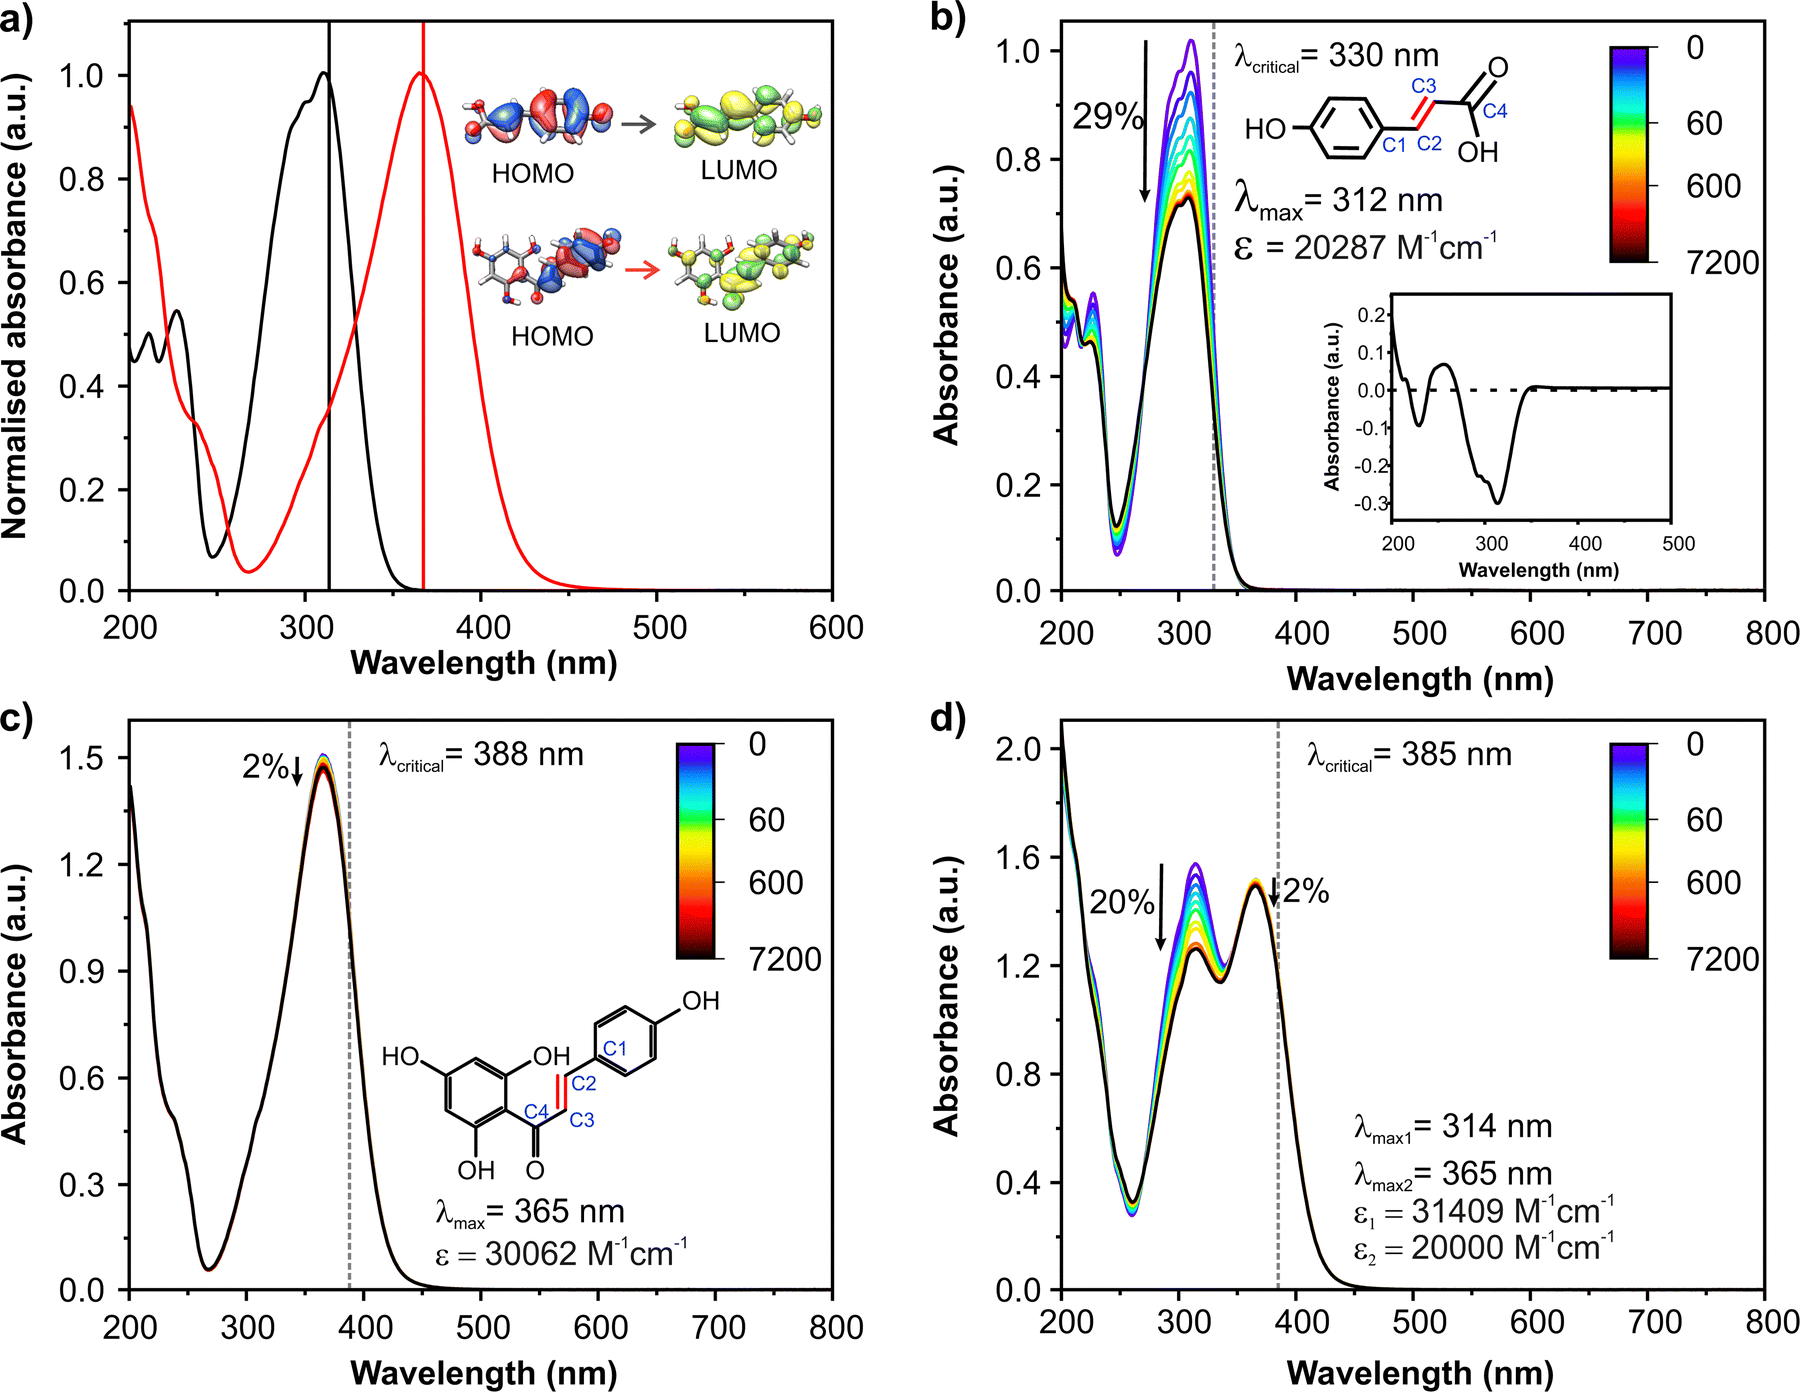 | ||
Fig. 1 (a) UV-Vis spectra of pca (black line) and nch (red line) in ethanol. Vertical lines give their theoretical peak absorptions associated with HOMO–LUMO transitions. Photostability of solutions of (b) pca, (c) nch and (d) a 1![[thin space (1/6-em)]](https://www.rsc.org/images/entities/char_2009.gif) :1 mixture of pca and nch in ethanol. The inset in (b) shows the difference spectrum after 2 h of solar irradiation. UV-Vis spectra were recorded at different time intervals of solar irradiation. The downwards arrows represent the absorbance difference before and after two hours of irradiation. The vertical dashed lines indicate the critical wavelength for each molecule. Molecular structures of pca and nch are shown in (b) and (c), respectively. Carbon atoms from the dihedral responsible of the potential trans–cis isomerization are numbered in blue in (b) and (c), respectively. Molar extinction coefficient (ε) and peak absorbance (λmax) are also highlighted. :1 mixture of pca and nch in ethanol. The inset in (b) shows the difference spectrum after 2 h of solar irradiation. UV-Vis spectra were recorded at different time intervals of solar irradiation. The downwards arrows represent the absorbance difference before and after two hours of irradiation. The vertical dashed lines indicate the critical wavelength for each molecule. Molecular structures of pca and nch are shown in (b) and (c), respectively. Carbon atoms from the dihedral responsible of the potential trans–cis isomerization are numbered in blue in (b) and (c), respectively. Molar extinction coefficient (ε) and peak absorbance (λmax) are also highlighted. | ||
The trans–cis isomerization of pca is a reported radiationless mechanism for energy dissipation in bacteria14 and plants.11 In contrast, and to the best of our knowledge, the excitation dynamics of nch have never been studied despite it being one of the few flavonoids that preserves this double bond. This information would be useful in assisting to unravel how this flavonoid provides photoprotection in the tomato fruit cuticle. Herein, we study the interaction between UVR and pca/nch present in the tomato fruit cuticle. Samples of pca and nch were dissolved in ethanol to simulate polar domains present in the tomato fruit cuticle. A combination of steady-state absorption and fluorescence spectroscopy and transient electronic absorption spectroscopy (TEAS) were employed to elucidate the photoprotective role of pca and nch, both separately and in a mixture. Moreover, we report the fluorescence quenching of pca in the presence of nch and its potential biological implications in photoprotection.
2. Experimental section
Materials
p-Coumaric acid (≥98%, pca) and naringenin chalcone (95%, nch) were purchased from Sigma-Aldrich and abcr GmbH, respectively. Ethanol absolute (≥99.8%, AnalaR NORMAPUR®) from VWR was used as a solvent in this research. All reactants were used without further purification.Steady-state spectroscopy
UV-Visible (UV-Vis) spectra were recorded using a Cary 60 spectrometer (Agilent technologies). Samples were placed in a 1 mm pathlength quartz cuvette. Steady-state irradiation measurements were performed irradiating a sample of pca or nch (in ethanol) with a solar simulator (Oriel Instruments, 94011A-ES) for 2 hours, recording the UV-Vis spectra at selected time points. To imitate solar incidence conditions, the output power was set to 1 sun (1000 W m−2). UV-Vis spectra of highly saturated solutions were recorded in a nanodrop™ one (controltecnica).Critical wavelengths were calculated for pure solutions of pca and nch along with solutions at equimolar mixtures and a 2:1 ratio of nch:pca. Critical wavelength for UV-filters sets the wavelength at which the integrated area beneath the absorbance spectrum equates to 90% of the total area within the 290 and 400 nm range.15
Fluorescence emission spectra were scanned using an FLS920 spectrofluorometer (Edinburgh Instruments) fitted with a 400 W Xe lamp employed for continuous measurements. The photomultiplier R928P (200–800 nm) was utilized as a detector. The Edinburgh Instruments FAST software was used for data processing.
1H-NMR measurements (500 MHz, DMSO-D6) of pre- and post-irradiated samples of 500 μM of nch in ethanol were carried out using a Bruker Avance III 400 NMR spectrometer. The sample was constantly irradiated at 365 nm for 5 hours using a TOPAS amplifier (Spectra Physics, USA) with a beam fluence of 0.1 mJ cm2.
Ultrafast transient electronic absorption spectroscopy (TEAS)
TEAS measurements were carried out in the department of chemistry at the university of Warwick. The setup has been described previously.16 Briefly, samples were set in a 1 mm pathlength quartz cuvette and were continuously translated to limit sample photodegradation. A spectrometer detector (Avantes, Avaspec-USL1650F-USB2) records the changes in the optical density of the transmitted probe beam after alternating photoexcitation and no photoexcitation of the sample.TEAS spectra of solutions of pca (500 μM), nch (500 μM) and an equimolecular mixture of these (500 μM each) were collected in ethanol. This concentration was chosen to closely mimic a dilute solution of phenolics, given that these are secondary metabolites of plants.17 Moreover, the concentration was optimized to be compatible with TEAS measurements, which gave a sample absorption commensurate with previous work.18 The photoexcitation wavelengths used corresponded to the maximum absorbance peaks of pca (312 nm) and nch (365 nm).
TEAS spectra were chirp corrected for visual purposes using the KOALA software package.19 Dynamical lifetimes with associated errors up to twice the standard error were extracted through a global sequential model using the Glotaran program which included a third order polynomial to model the chirp.20,21 The instrument response function (IRF) was modelled using a Gaussian, having a full width at half maximum of 100 fs and 185 fs for ethanol excited at 312 nm (integrated over 355–360 nm) and 365 nm (integrated over 420–425 nm), respectively (Fig. S1, ESI†). The quality of the fits was evaluated through the residuals shown in the (ESI,† Fig. S2). This fitting procedure provides a qualitative analysis for the excited state lifetimes, in both neat samples and the mixture.
Computational methods
DFT (Density Functional Theory)22 calculations were executed using Gaussian 16 software.23 TD-B3LYP24 with the def2tzvp25 basis set was used for the calculations of the vertical excitation energies using the geometries previously optimized with the B3LYP functional. This TD–B3LYP method has been chosen because it is the method that better reproduces the experimental values.13 ωB97XD26 in combination with the 6-31+g(d,p) basis set has been considered for the exploration of the isomerization process in S0 and S1 energetic surfaces. Conical intersections were computed by means of Complete Active Space-Self Consistent field (CASSCF27) calculations using the OpenMolcas software.28 The five occupied π-symmetry orbitals and the occupied bonding CO orbital and five unoccupied π-symmetry orbitals were chosen as the active space for the proper description of the system (namely CASSCF(12,11) method, see the ESI†) starting from Hartree–Fock initial Hessian.Ethanol (ε = 24.852) was included as model solvent through the polarizable continuum model (PCM)29 corresponding to the self-consistent reaction field (SCRF) approach to approximate some hydrophilic microenvironments present in the tomato fruit cuticle. MOs were represented with the software UCSF Chimera.30
3. Results and discussion
3.1. Photodegradation study
As a first step of this study, we investigated the photostability of solutions of pca and nch. UV-Vis spectra of pca and nch have their absorbance maxima around 312 and 365 nm, respectively (Fig. 1a and Fig. S3a, ESI†). They are in good agreement with the theoretically calculated UV-Vis spectra (Fig. 1a and Fig. S4 and S5, ESI†). Additionally molecular orbitals (MOs) were computed (Fig. S4 and S5, ESI†) to give a better assignment of the transitions from their optimized geometries in the ground state (Fig. S6, ESI†). An equimolar mixture of both compounds displays these two bands (312 and 365 nm) (Fig. 1d and Fig. S3a, ESI†). The sum of the spectra of the individual compounds returns almost the same UV-Vis spectrum as their equimolar mixture (Fig. S3b, ESI†), suggesting the lack of aggregation between these compounds in ethanol. An increase in concentration did not show any new band or change in the existing bands of the mixture (Fig. S3c, ESI†).Among the requirements to fulfil for the design of new UV-filters (for commercial sunscreen application), are a high absorption coefficient and a critical wavelength longer than 370 nm.15 A high absorption coefficient is observed for all solutions (see Fig. 1b–d and Fig. S7, ESI† for more details). Despite the low critical wavelength of pca (330 nm), nch and the mixtures of both compounds provide critical wavelengths in the range 385–388 nm (see Fig. 1b–d and Fig. S7, ESI†). Moreover, a mixture of both compounds results in an absorption spectrum spanning both the UV-A and UV-B.
Another crucial aspect for UV-filters is their degradation profile. The mild decrease in absorption intensity after two hours of solar irradiation is a good indication of the long term photostability of the molecules. The pca solution shows a drop of around 29% of its absorption after two hours of irradiation (Fig. 1b). From the difference spectrum before and after 2 h of solar irradiation (inset in Fig. 1b), two main features can be observed: the emergence of a new absorption band around 240–270 nm and the (very mild) broadening of the 350–500 nm band. These are indicative signals of the cis isomer formation31 and agree with previously reported isomerization of pca under UV irradiation.11 In contrast, very little degradation was observed for nch (≈2% Fig. 1c). The reason for this improvement in the photostability is ascribed to the lack of trans–cis isomerization in nch solution. To confirm its photostability, the NMR spectra of the solution of nch before and after 5 h of irradiation at its λmax (365 nm) were obtained (Fig. S8, ESI†). No new features related to the presence of the cis isomer were observed.
For the mixture, while the band associated with pca (312 nm) decreases to around 20% of its initial intensity after two hours of irradiation, the decrease in the 365 nm band is virtually identical to that for the nch solution. The lower percentage of degradation of the band at 312 nm of the mixture compared with the solution of pure pca could have multiple potential origins: (1) both pca and nch contribute to the absorption around 312 nm band; (2) nch could act as a stabilizer through an energy transfer process limiting the formation of the cis isomer of pca; and (related to (2)); (3) the formation of aggregates between the two molecules, albeit unlikely given the minimal impact on the ground state absorption spectra of the mixture compared to the individual solutions alongside the degradation intensity remaining at 20% for ratios of 1:1 (Fig. 1d) and 1:2 (Fig. S7, ESI†). Given the similar percentage of degradation found for pure pca solution and for the equimolar mixture after subtracting the contribution to the spectrum from nch (Fig. S9, ESI†), points towards the difference observed supra stemming from the spectral overlap of pca and nch (i.e. origin (1)).
Fluorescence quenching
pca in ethanol has an emission band centred at 380 nm (Fig. S10, ESI†). By increasing the nch/pca ratio, this band starts to decrease (Fig. 2a). The attenuation of this emission band is asymmetrical as the decrease in fluorescence is higher in the emission range where the maximum of absorbance of nch is located (350–370 nm). Fig. 2b illustrates the two mechanisms of relaxation which coexist in a solution of pca after UV irradiation: a radiative mechanism resulting in a blue fluorescence and a non-radiative mechanism mediated via a conical intersection (CI).11 With regards to quenching, there are two general mechanisms: static quenching and dynamic quenching (Fig. 2c and d). The main difference between them is that static quenching requires the formation of a complex, while dynamic quenching relies on the depopulation of the excited state of the fluorophore by collision with the quencher. Stern–Volmer kinetics showed a linear relationship at lower concentrations (up to 25 μM of the quencher), while a positive deviation from the linearity occurred at higher concentrations (see Fig. S11, ESI†). The occurrence of this upward curvature has been related to the combination of static and dynamic quenching by some authors.32,33 However, this positive deviation has also been ascribed to pure dynamic quenching in some systems.34 A definitive method to distinguish between dynamic and static quenching is the measurement of fluorescence lifetimes; this was not possible with the current set up due to experimental limitations. That being said, additional evidence points towards the hypothesis that in our system, dynamic quenching prevails: (1) The UV-Vis spectrum of an equimolar mixture of pca and nch and the sum of the individual pca and nch spectra are virtually identical. To add, the increase of concentration of the mixture up to 10 mM did not reveal any new band nor broadening of the existing ones, which one would expect upon the formation of a ground state complex. (2) Theoretical evaluation of pca–nch heterodimers in S0 (Table S1 and Fig. S12, ESI†) returns positive binding free energies (ΔGf0(X, Y) in Fig. S13 and S14, ESI†), suggesting that dimer formation is not energetically favourable. | ||
| Fig. 2 (a) Quenching of pca fluorescence with increasing concentrations of nch after excitation at 312 nm. (b) Schematic deactivation of pca after UV excitation. Representation of plausible mechanisms based on (c) collisional and (d) static quenching of mixtures of pca and nch. | ||
The absence of complex formation between nch and pca favours dynamic quenching. Förster resonance energy transfer is a type of dynamic quenching where the molecules can be separated by 10–100 Å.35 For this relaxation mechanism to occur, the emission spectrum of the fluorophore must overlap with the absorbance spectrum of the quencher. This requirement is met in the mixtures of pca and nch (Fig. S10, ESI†). Dynamic quenching may serve as a photoprotection mechanism in ripe tomato fruits. A portion of the UVR which reaches the fruit can be absorbed by the cuticle pca to be promoted to S1. This excited molecule would subsequently be deactivated via interaction with nch to potentially protect against photodamage.
The existence of dipole–dipole interactions between these molecules in solution could have biological implications. These interactions could only occur if pca and nch are in close proximity. Given the restricted mobility of these molecules within the plant cuticle, these interactions would imply a co-transport of both molecules from the cytoplasm to the outer cuticle, since an individual transport and further interaction within the cuticle would be highly unlikely. This scenario would be in agreement with the recently reported co-localization of both molecules within the ripe tomato fruit cuticle36 and opens a very interesting avenue of research. Moreover, blue enriched light is key in the plant kingdom: it increases the photosynthetic activity and the resistance against pathogens, relocates chloroplasts, promotes the flavonoid synthesis, etc.37 Thus fluorescence emission of pca after UV excitation, albeit weak, could be absorbed by other parts of the plant and/or act as a cue in plant-insect interaction.38 Quenching of this blue fluorescence associated to pca due to the action of nch coincides with tomato fruit ripening process, and its possible biological role needs to be evaluated.
3.3. Ultrafast transient absorption spectroscopy
 | ||
| Fig. 3 TAS (left) and evolution associated difference spectra (EADS) computed by sequential fit (right) of (a) 500 μM pca, (b) 500 μM nch and (c) a 1:1 mixture (500 μM: 500 μM) of pca and nch in ethanol (excitation at 312 nm). | ||
In the pca solution heat map (Fig. 3a, left) a strong excited state absorption (ESA) is observed at 375 nm. Additionally, three further absorptions can be seen centred at 330, 390 and 600 nm with increasing pump–probe time delay. A global sequential fit was performed to quantitatively assign lifetimes. Three lifetimes are required for pca solution (Table 1); evolution associated difference spectra (EADS) are also shown (Fig. 3a, right). The spectral features related to the two shortest lifetimes (τ1 and τ2) correspond to one-photon induced dynamics according to power dependence studies (Fig. S16a, ESI†). τ1 (180 fs) is assigned to the fast geometry relaxation within the first excited state (S1) towards the S1/S0CI; here the excited state population encounters the small barrier of 2.78 kcal mol−1 found in previous calculations11 (Fig. 4a). The second lifetime, τ2 (∼1.5 ps) is attributable to internal conversion through a ‘late’ CI (i.e.CI dihedral θC1C2C3C4 of 90.3°, structure notation shown in Fig. 1b).11 Therefore due to the geometrical similarity between CI and TS-S0 (see later), the subsequent vibrational cooling can proceed until reaching the trans or cis stabilized ground state geometry. The third and longer lifetime, τ3 (≫2 ns), displays three features, centred at 330, 390 and 600 nm respectively. The feature centred at 330 nm corresponds to the presence of the cis isomer photoproduct of pca, showing a one-photon induced dynamics (Fig. S16b, ESI†), and in agreement with previous work.11 The two features at 390 nm and 600 nm are multi-photon processes (Fig. S16c and d, ESI†). The band at 390 nm could be attributed to the formation of phenoxyl radicals in solution39 while the band centred at 600 nm is assigned to the appearance of solvated electrons in ethanol.40 Further evidence for this assignment is given by the two-photon dependence of the feature given in Fig. S16d (ESI†). A proposed relaxation mechanism is shown in Fig. 4a.
:1 mixture of both pca and nch after excitation at 312 nm in ethanol from a sequential fit. Errors are given as twice the standard error extracted from the Global fitting
| λ pump = 312 nm | |||
|---|---|---|---|
| τ 1 (fs) | τ 2 (ps) | τ 3 (ns) | |
| pca | 180 ± 50 | 1.52 ± 0. 05 | ≫2 ns |
| nch | 580 ± 50 | 3.14 ± 0.05 | 1.15 ± 0.06 |
| mix | 540 ± 50 | 4.01 ± 0.05 | ≫2 ns |
 | ||
| Fig. 4 Schematic representation of the different postulated isomerization reaction profiles, where τ1 and τ2 are shown, of (a) pca and (b) nch solutions in ethanol. These models are supported by data obtained by NMR, TAS and previously reported models.10,11 Notation of carbon atoms of pca and nch molecules are shown in Fig. 1b and 1c, respectively. | ||
Considering now the nch solution heat map (Fig. 3b, left) two main features are observed: a ground state bleach (GSB) around 360 nm and a strong ESA around 420 nm. Due to the lack of trans–cis isomerization in the NMR after irradiation (Fig. S8, ESI†), the deactivation mechanism is very likely different from that observed for pca in solution. A sequential fit extracts three lifetimes for the dynamics of nch in ethanol with associated EADS (Fig. 3b, right). We add, we have photoexcited nch at 365 nm (its λmax) (Fig. S15a, ESI†) and observed very similar features to those obtained after excitation at 312 nm (Fig. 3b, right). τ1 and τ2 are similar between both excitations, nevertheless, τ3 significantly differs (see Table 1 and Fig. S2, ESI†).
We assign the first lifetime, τ1 (580 fs) to fast geometry relaxation in the electronic excited state, which includes (en route to the CI) a small barrier calculated to be 2.96 kcal mol−1. The second lifetime, τ2 (∼3 ps) is assigned, once again, to traversal through a CI and population of vibrational hot ground electronic state and subsequent vibrational cooling. A third lifetime τ3 (∼1 ns) persists beyond the maximum time-window of our experiment suggesting some fraction of the population remains trapped in the excited state. Theoretical exploration of the S0 and S1 energetic surfaces for nch isomerization shows that it corresponds to the deactivation mechanism depicted in Fig. 4b.41 Within this scheme, after vertical excitation to the S1 electronic state, the molecule will relax in the excited towards S0/S1CI. In this case, contrary to pca, we find an ‘early’ CI where the isomerization of the double bond is not fully accomplished (CI dihedral angle θC1C2C3C4 = 108.1°, Fig. 5). That is, after relaxation to the S0 ground state, it would be necessary for an additional rotation of the dihedral angle in order to reach the TS-S0 geometry (dihedral angle θC1C2C3C4 = 92.1°, Fig. 5), i.e., an additional energy would be required. Therefore, the nch will cool down towards trans conformer rather to isomerize. This absence of isomerization accords with NMR and photodegradation studies (see Fig. 1c, and Fig. S8, ESI†). We finally add that the observed dynamics are one-photon induced for the 420 nm band (Fig. S16e, ESI†).
 | ||
| Fig. 5 Main geometrical features of conical intersection CI and TS-S0 associated with the nch isomerization reaction profile. | ||
Lastly, TAS measurements were then performed on an equimolar mixture of both compounds (Fig. 3c, left). If both molecules behave independently of one-another, one could predict that the extracted TAS would be a sum of the individual pca and nch TAS. However, the sum of the TAS maps from individual compounds (pca and nch) strongly differed from the experimental TAS map (Fig. S17, ESI†). A cursory inspection of the measured TAS (and associated EADS) of nch and the mixture show stark similarities. The EADS extracted from the global fit of the TAS (Fig. 3c, right) are dominated by nch dynamics; granted, small differences are observed in the lifetimes.
Within error, the value of τ1 (Table 1) for nch is comparable to that for the mixture; nevertheless, τ2 and τ3 are longer in the mixture, which points towards the interaction of nch with pca that slows down the relaxation of the molecules to the ground state. The τ3 (Table 1) EADS of the mixture (Fig. 3c, right) includes features from both nch and pca: a positive (albeit noisy) band around 330 nm from the cispca; a broad band around 600 nm of formation of solvated electron; and the GSB from nch around 360 nm. Importantly, the cispca signature is much weaker than photoexcitation of pca alone.
Based on quenching data presented in Fig. 2 as well as the data from TAS measurements shown in Fig. 3, the photoexcited state dynamics of transpca supports a Förster energy transfer mechanism, evidently born from substantial dipole–dipole interactions between pca and nch, even at 500 μM concentrations. The Förster energy transfer mechanism appears to severely impact the trans-to-cis isomerization mechanism operating in pca, to the point of almost extinguishing it; the TAS data show mild contributions from the cispca isomer photoproduct suggesting that the isomerization mechanism is still operative. We also note, in closing this section, that a 1:1 mixture (500 μM: 500 μM) of nch and pca in ethanol photoexcited at 365 nm (the peak maximum of nch) shows very similar EADS to those computed from the nch solution excited at the same wavelength (Fig. S15, ESI†), but their associated lifetimes are shorter (Table S2, ESI†). This implies that the interaction reported above would impact the lifetimes or it could be a convolution of nch molecules that are both interacting with pca and those that are isolated.
4. Conclusions
In the present work, a multi-pronged spectroscopic study of a coumaric acid and flavonoid which coexist in the ripe tomato fruit cuticle to provide photoprotection, p-coumaric acid (pca) and naringenin chalcone (nch), has been carried out. Photodegradation studies in combination with NMR have shown that in contrast to the well-established isomerization of pca, nch is not able to isomerize after solar irradiation, implying different mechanisms of photoprotection in both molecules. A mixture of both compounds has revealed a quenching mechanism of pca fluorescence with increasing proportions of nch. Förster energy transfer, a special type of dynamic quenching, is proposed to explain this observation through the formation of dipole–dipole interactions among both molecules, which potentially contributes to the prevention of photodamage in ripe tomato fruits.The hypothesis of a dipole–dipole interaction between both molecules is reinforced with data obtained by transient absorption spectroscopy (TAS) where importantly, the features of the equimolar mixture of pca and nch are dominated by the latter. Moreover, the combination of both compounds displays a UV spectrum which covers a wide range of the UV radiation acting as versatile UV filter.
Our study suggests an interaction between pca and nch within the cuticle where they provide a synergic photoprotection mechanism. The biological implications of this quenching in ripe tomato fruits deserves further exploration. Lastly, our study of different ratios of these plant-derived compounds offers a potentially new avenue to create biomimetic UV-screening formulas spanning both the UVA and UVB regions of the electromagnetic spectrum.
Author contributions
A. G. M., E. D., A. H. and V. G. S. conceived the presented idea. A. G. M. and J. M. W. carried out the experiments. A. G. M. and A. d. C. performed the computational calculations. All authors contributed to analysis of the experimental and theoretical results. A. G. M. wrote the manuscript with input from all authors. V. G. S. supervised the project.Conflicts of interest
There are no conflicts to declare.Acknowledgements
The authors acknowledge the facilities of the Universidad de Málaga (UMA) and the University of Warwick's Research Technology Platform, Warwick Centre for Ultrafast Spectroscopy, for the use of a Fluorolog, Agilent Cary 60 UV/Vis spectrometer and an Oriel Instruments, 94011A-ES Solar Simulator in the research described in this paper. A. G. M. is the recipient of a Formación Profesorado Universitario fellowship FPU17/01771. This project was funded by Agencia Estatal de Investigación, Ministerio de Ciencia e Innovación Spain, co-financed by the European Regional Development Fund (ERDF) (projects RTI2018-094277-B/AEI/10.13039/501100011033 and PID2021-126604OB). J. M. W. acknowledges FetOpen grant BoostCrop (Grant Agreement 828753) for funding. A. d. C. acknowledges funding from the Gobierno Vasco/Eusko Jaularitza (IT-1553-22). The authors thank Dr José María Montenegro for his technical work and Dr Ana Lucena for NMR assignments. V. G. S. thanks the Royal Society for a Royal Society Industry Fellowship and the support of FetOpen grant BoostCrop (Grant Agreement 828753). The computer resources and support of the SCBI (Supercomputing and Bioinformatics/UMA), DIPC (Donostia International Physics Centre) and the SGI–IZO–SGIker (UPV/EHU) are thankfully acknowledged.References
- L. E. Graham, Origin of land plants, Wiley, New York, NY, USA, 1993 Search PubMed.
- T. T. Abiola, A. L. Whittock and V. G. Stavros, Molecules, 2020, 25, 3945 CrossRef CAS PubMed.
- G. I. Jenkins, Annu. Rev. Plant Biol., 2009, 60, 407–431 CrossRef CAS PubMed.
- H. Frohnmeyer and D. Staiger, Plant Physiol., 2003, 133, 1420–1428 CrossRef CAS PubMed.
- N. D. N. Rodrigues and V. G. Stavros, Sci. Prog., 2018, 101, 8–31 CrossRef CAS PubMed.
- L. A. Baker, M. D. Horbury, S. E. Greenough, F. Allais, P. S. Walsh, S. Habershon and V. G. Stavros, J. Phys. Chem. Lett., 2016, 7, 56–61 CrossRef CAS PubMed.
- Y. Liu, X. Zhao, J. Luo and S. Yang, J. Lumin., 2019, 206, 469–473 CrossRef CAS.
- L. A. Baker, M. Staniforth, A. L. Flourat, F. Allais and V. G. Stavros, ChemPhotoChem, 2018, 2, 743–748 CrossRef CAS.
- M. D. Horbury, E. L. Holt, L. M. M. Mouterde, P. Balaguer, J. Cebrián, L. Blasco, F. Allais and V. G. Stavros, Nat. Commun., 2019, 10, 1–8 CrossRef CAS PubMed.
- J. M. Woolley, J. S. Peters, M. A. P. Turner, G. J. Clarkson, M. D. Horbury and V. G. Stavros, Phys. Chem. Chem. Phys., 2019, 21, 14350–14356 RSC.
- A. González Moreno, A. de Cózar, P. Prieto, E. Domínguez and A. Heredia, Nat. Commun., 2022, 13, 1786 CrossRef PubMed.
- G. Agati, C. Brunetti, M. Di Ferdinando, F. Ferrini, S. Pollastri and M. Tattini, Plant Physiol. Biochem., 2013, 72, 35–45 CrossRef CAS PubMed.
- A. González Moreno, P. Prieto, M. C. Ruiz Delgado, E. Domínguez, A. Heredia and A. De Cózar, Phys. Chem. Chem. Phys., 2021, 23, 18068–18077 RSC.
- G. Groenhof, M. F. Lensink, H. J. C. Berendsen, J. G. Snijders and A. E. Mark, Proteins: Struct., Funct., Genet., 2002, 48, 202–211 CrossRef CAS PubMed.
- B. L. Diffey, P. R. Tanner, P. J. Matts and J. F. Nash, J. Am. Acad. Dermatol., 2000, 43, 1024–1035 CrossRef CAS PubMed.
- S. E. Greenough, G. M. Roberts, N. A. Smith, M. D. Horbury, R. G. Mckinlay, J. M. Żurek, M. J. Paterson, P. J. Sadler and V. G. Stavros, Phys. Chem. Chem. Phys., 2014, 16, 19141 RSC.
- Y. Zhang, P. Cai, G. Cheng and Y. Zhang, Nat. Prod. Commun., 2022, 17, 1–14 Search PubMed.
- F. R. Kohl, C. Grieco and B. Kohler, Chem. Sci., 2020, 11, 1248–1259 RSC.
- M. P. Grubb, A. J. Orr-Ewing and M. N. R. Ashfold, Rev. Sci. Instrum., 2014, 85, 064104 CrossRef PubMed.
- K. M. Mullen and I. H. M. Van Stokkum, J. Stat. Softw., 2007, 18, 1–46 CrossRef.
- J. J. Snellenburg, S. Laptenok, R. Seger, K. M. Mullen and I. H. M. van Stokkum, J. Stat. Softw., 2012, 49, 1–22 Search PubMed.
- R. G. Parr and W. Yang, Density-Functional Theory of Atoms and Molecules, International Series of Monographs on Chemistry, Oxford Science Publications, New York, 1989, vol. 16 Search PubMed.
- M. J. Frisch et al. , Gaussian16 (Revis. A.03), Gaussian Inc., Wallingford CT, 2016 Search PubMed.
- A. D. Becke, J. Chem. Phys., 1993, 98, 5648–5650 CrossRef CAS.
- F. Weigend and R. Ahlrichs, Phys. Chem. Chem. Phys., 2005, 7, 3297–3305 RSC.
- J. Da Chai and M. Head-Gordon, Phys. Chem. Chem. Phys., 2008, 10, 6615–6620 RSC.
- K. Andersson, P. Å. Malmqvist and B. O. Roos, J. Chem. Phys., 1992, 96, 1218–1226 CrossRef CAS.
- I. Fernández Galván, et al. , J. Chem. Theory Comput., 2019, 15, 5925–5964 CrossRef PubMed.
- J. Tomasi, B. Mennucci and R. Cammi, Chem. Rev., 2005, 105, 2999–3093 CrossRef CAS PubMed.
- E. F. Pettersen, T. D. Goddard, C. C. Huang, G. S. Couch, D. M. Greenblatt, E. C. Meng and T. E. Ferrin, J. Comput. Chem., 2004, 25, 1605–1612 CrossRef CAS PubMed.
- K. M. Krokidi, M. A. P. Turner, P. A. J. Pearcy and V. G. Stavros, Mol. Phys., 2021, 119, 1–2 CrossRef.
- J. R. Lakowicz, Principles of fluorescence spectroscopy, Springer, 2006 Search PubMed.
- L. Mátyus, J. Szöllosi and A. Jenei, J. Photochem. Photobiol., B, 2006, 83, 223–236 CrossRef PubMed.
- B. Prusti and M. Chakravarty, Analyst, 2020, 145, 1687–1694 RSC.
- J. R. Albani, Structure and Dynamics of Macromolecules: Absorption and Fluorescence Studies, Elsevier Science, 2004, pp. 217–236 Search PubMed.
- A. González Moreno, E. Domínguez, K. Mayer, N. Xiao, P. Bock, A. Heredia and N. Gierlinger, Plant Phisiol., 2023, 191, 219–232 CrossRef PubMed.
- L. Huché-Thélier, L. Crespel, J. Le Gourrierec, P. Morel, S. Sakr and N. Leduc, Environ. Exp. Bot., 2016, 121, 22–38 CrossRef.
- S. Mori, H. Fukui, M. Oishi, M. Sakuma, M. Kawakami, J. Tsukioka, K. Goto and N. Hirai, J. Chem. Ecol., 2018, 44, 591–600 CrossRef CAS PubMed.
- T. A. A. Oliver, Y. Zhang, A. Roy, M. N. R. Ashfold and S. E. Bradforth, J. Phys. Chem. Lett., 2015, 6, 4159–4164 CrossRef CAS PubMed.
- A. V. Vannikov and V. S. Marevtsev, Int. J. Radiat. Phys. Chem., 1973, 5, 453–456 CrossRef CAS.
- A. L. Whittock, N. Auckloo, A. M. Cowden, M. A. P. Turner, J. M. Woolley, M. Wills, C. Corre and V. G. Stavros, J. Phys. Chem. Lett., 2021, 12, 3641–3646 CrossRef CAS PubMed.
Footnote |
| † Electronic supplementary information (ESI) available: Excited state lifetimes and EADS after excitation at 365 nm, solvent only scans, residuals’ data and power measurements for the TAS; cartesian coordinates, energy details and frontier orbitals related to the nch isomerization profile calculations; further UV-Vis spectra and photostability tests; cartesian coordinates, structural information, computed orbitals and assignments of UV-Vis spectra bands for pca and nch; quantum calculations on pca–nch heterodimers and their cartesian coordinates; 1H-NMR spectra; and Stern–Volmer plot. See DOI: https://doi.org/10.1039/d3cp00630a |
| This journal is © the Owner Societies 2023 |