
 Open Access Article
 This Open Access Article is licensed under a Creative Commons Attribution-Non Commercial 3.0 Unported Licence
Synthesis of hierarchical mesoporous cerium titanate brannerite and uranyl adsorption properties at pH 3.8†
Linggen
Kong
 *,
Tao
Wei
,
Inna
Karatchevtseva
and
Nicholas
Scales
*,
Tao
Wei
,
Inna
Karatchevtseva
and
Nicholas
Scales
Australian Nuclear Science and Technology Organisation, Lucas Heights, Sydney, New South Wales, Australia. E-mail: linggen.kong@ansto.gov.au
First published on 6th June 2023
Abstract
Cerium titanates possessing brannerite structure are produced by employing soft and hard templates via sol–gel processing. Powders synthesized with various hard template sizes and template to brannerite weight ratios are composed of nanoscale ‘building blocks’ with size ∼20–30 nm and characterized on macro-, nano- and atomic scales. These polycrystalline oxide powders exhibit specific surface area up to ∼100 m2 g−1, pore volume ∼0.4 cm3 g−1, and uranyl adsorption capacity ∼0.221 mmol (53 mg) U per gram powder. Remarkably, the materials possess significant proportion of mesopores with 5–50 nm pores representing 84–98% of total pore volume, which facilitate fast accessibility of the adsorbate to the internal surfaces of the adsorbent with adsorbed uranyl reaching over 70% of the full capacity within 15 min of contact. These mesoporous cerium titanate brannerites synthesized by the soft chemistry route are highly homogenous, stable at least in 2 mol L−1 acidic or basic solution, and may attract attention for other applications like catalysis at high temperature.
1. Introduction
Cerium titanate, possessing a brannerite crystal structure with the synergistic effect of Ce and Ti oxide, has many applications such as photocatalysis,1–8 electrochemistry,6,9,10 chemical-mechanical polishing materials,11,12 and actinide host matrices in nuclear waste forms.13–15 Recently,16 CeTi2O6 brannerite is revealed as the most promising candidate for solar thermochemical hydrogen production due to its essential characteristics including a smaller reduction enthalpy compared to ceria yet large enough to split water, a high thermal stability, and a large entropy of reduction associated with Ce4+ → Ce3+ redox reaction. The conventional synthesis methods, via either mixed oxide or soft chemistry route followed by calcination, employ high temperature treatment (1300–1350 °C) to form the brannerite structure.17–22 The elevated temperature treatment usually leads to the collapse of the pore structure, thus eliminating the porosity features like high specific surface area and pore volume, which are essentially required for most applications. The commonly used sol–gel processing1–6,23–25 ensures high composition homogeneity of the product due to the chemical reaction at the molecular level, and also likely maintain the porosity features because of the relatively low calcination temperature (500–900 °C).Various surfactants and/or dispersion agents have been attempted to fabricate porous CeTi2O6 brannerite. Zhang et al.1–4 have used either a dispersion agent polyethylene glycol (PEG) or a surfactant cetyltrimethyl ammonium bromide (CTAB) via sol–gel processing to prepare porous material with major CeTi2O6 brannerite phase, and minor CeO2 and rutile TiO2 phases. The surface area, pore volume and pore size are ∼22 m2 g−1, 0.044 cm3 g−1 and 36 nm, respectively, at 700 °C heat treatment; and ∼16 m2 g−1, 0.023 cm3 g−1 and 18 nm after 800 °C calcination, with crystallite sizes ∼38.0–42.9 nm. A close examination of the particulate morphology reveals that the final product is composed of agglomerated and/or coalesced nanoparticles. A coprecipitation method has been employed by Ding et al.5 to produce porous crystalline cerium titanate brannerite with ∼33.4 m2 g−1 surface area and 0.13 cm3 g−1pore volume after 500 °C calcination. However, the crystallinity is very low as shown by XRD pattern. Matějová et al.26 have employed sol–gel processing within reverse micelles followed by calcination at 800 °C to produce CeTi2O6 brannerite as a single crystalline phase at 7![[thin space (1/6-em)]](https://www.rsc.org/images/entities/char_2009.gif) :3 Ti:Ce molar ratio with surface area <10 m2 g−1, which is too low for adsorption application.
:3 Ti:Ce molar ratio with surface area <10 m2 g−1, which is too low for adsorption application.
Porous metal oxides have been often investigated in nuclear industry applications.27–34 Besides the requirements for exceptional porosity properties, the physico-chemical durability and the radiolytic stability need to be considered when designing a new adsorbent. Due to the easy control of the porosity and surface functionality, silica is usually studied for radionuclide adsorption. Nevertheless, the complex silicates with a greater proportion of 〈Si–O〉 bond are more susceptible to radiation-induced amorphization35 and pores are likely to collapse due to irradiation.36 Alternatively, non-siliceous mesoporous oxides with nanostructure morphology have been investigated extensively,37–49 and some have been studied for uranium adsorption.27–34,47–51 In order to increase the sorption capacity or selectivity, binary metal oxide nanoparticles possessing high surface area and/or functionalized groups have been primarily investigated.52–56 Compared with the binary oxides, the ternary metal oxides may provide increased performance.33 Nevertheless, the investigation of porous ternary metal oxides is limited, except the zirconium titanium oxides which can reach adsorption capacity for U ∼ 40.5 mg g−1.57–62 These mixed metal oxides possess superior characteristics over their single metal oxide counterparts, including improved surface areas and acidities, higher thermal, mechanical, and radiolytic stabilities,57–61 as well as the enhanced sorption capacity due to the synergistic effect of different metal elements.62 In addition, the adsorbent matrix could be converted into a highly durable inert ceramic waste form, following saturation with the radioactive species thus providing permanent radionuclide confinement.63,64 However, the synthesis of fully crystallized metal oxides with a ternary composition and porous morphology structure is rare because low temperature synthesis normally leads to low crystallinity of the materials whereas high temperature treatment results in the loss of the porosity.
In this work, hierarchical mesoporous cerium titanate with brannerite crystal structure is produced by using glucose as a dispersion agent (soft template) and colloidal silica as a hard template. The synthesized powders with different porosities are used to study the uranyl adsorption properties including capacities and kinetics at pH 3.8. Ideally, the overall particle morphologies (size and size range) can be controlled by selection of the dispersion agent and its quantity, while the pore features (specific surface area, pore size and volume) can be tailored by different sizes of the colloidal silica and the silica to brannerite weight ratios. The aim of this work is to synthesize porous brannerite material with minimum secondary phase in presence of colloidal silica, to produce the porous powder with high specific surface area in order to improve adsorption capacity and high proportion of mesopores to promote adsorption rate.
2. Experiments
2.1. Materials
Cerium(III) nitrate hexahydrate (99.9%+) and titanium(IV) (triethanolaminato) isopropoxide [Tyzor TE] (compound dissolved in 2-propanol) were used as-received. Ti content was quantitatively determined by ICP-MS with raw chemical containing 45.84 wt% Tyzor TE. Uranyl stock solution (0.5 mol L−1) was prepared by dissolving U3O8 in concentrated nitric acid (69 wt%), evaporating the acid on hotplate and adding water to form pH ∼ 4 solution. The exact uranyl [UO22+] concentration was measured by ICP-MS. All chemicals, including D-(+)-glucose, were A. R. grade and purchased from Sigma-Aldrich. Milli-Q grade water was used allover experiments. Various types of Ludox® colloidal silica (amorphous silica nanoparticle suspension in water) were purchased from Sigma-Aldrich and used as hard template. Based on the surface area provided by supplier, the average diameter (Φ) of the colloidal silica is calculated assuming the silica nanoparticles are rigid and spherical, and the density of the amorphous silica is 2.196 g cm−3.65 The surface areas are 320–400, 220, and 135 m2 g−1 for Ludox® SM-30, Ludox® HS-30, and Ludox® AS-40, respectively; the corresponding diameters are 6.8–8.5, 12.4, and 20.3 nm.2.2. Synthesis procedure
10 mmol Ce(NO3)3·6H2O and 22 mmol Tyzor TE were dissolved in 30 mL water to form an aqueous solution. In another container, 3.75 mL concentrated ammonia (25 wt% NH4OH) was mixed with 16.25 mL water. The ammonia aqueous solution was dropwise added into the above solution while vigorous stirring magnetically, which led to formation of a gel. The final ammonia concentration was ∼1 mol L−1 with pH = 11.6. The gel was aged for 4 h at 45 °C, forming an oligomer suspension upon stirring. 3.32 g D-(+)-glucose (glucose: metal oxide = 1:1 w/w) was added while stirring. Calculated Ludox aqueous suspension was added and subsequently stirred for 1 h to form a homogeneous mixture, which was dried overnight in an oven at 100 °C. The dried gelling material was calcined in a furnace in air at 800 °C (unless otherwise specified) for 6 h with 2 °C min−1 ramp rate, and 5 °C min−1 cooling rate. The calcined powders were stirred in 2.5 mol L−1 NaOH for > 8 h at 40 °C (30 mL of basic solution per 1 g powder) in a polypropylene bottle. This leaching process was repeated three times to remove the silica template. The resultant particulates were washed twice with water to eliminate Na+, and once with pH 3.8 HNO3 solution, followed by centrifugation and drying at 100 °C oven overnight.
2.3. Characterization
X-ray diffraction (XRD) analyses were conducted using a PANalytical X’Pert Pro diffractometer with Cu Kα radiation (λαav = 1.541874 Å) at 45 kV and 40 mA. Raman spectra were recorded using a Renishaw inVia Raman spectrometer equipped with the Argon ion laser (532 nm) and a Peltier cooled CCD detector at room temperature. Transmission electron microscopy (TEM) was performed on a JEOL 2200FS instrument, operated at 200 kV, to record selected area electron diffraction patterns (SAED). A Zeiss Ultra Plus Scanning electron microscopy (SEM) operating at 15 kV was used to analyze the microstructures. Surface area, pore volume and pore size were determined using nitrogen sorption analysis at 77 K on Autosorb IQ volumetric adsorption analyzer. Thermo-gravimetric analysis (TGA) was performed using a Netzsch STA 449F3 Jupiter apparatus to estimate the quantity of the surface hydroxyl groups. An Agilent 7900 inductively coupled plasma mass spectrometer (ICP-MS), fitted with a Micromist® concentric glass nebuliser and Peltier cooled glass spray chamber, was used to conduct the elemental analysis. The detailed description of the characterization and the method of the uranyl adsorption analyzing are elaborated in ESI.†3. Results and discussion
3.1. Crystal structure analyses
A sol–gel processing to fabricate the hierarchical porous crystal metal oxides with ternary composition has been proposed previously,66 and the advantages of employing a soft chemistry method instead of a mixed oxide route and using Tyzor TE as Ti precursor rather than traditional titanium alkoxides are elucidated. Even though the compositions of the gelling material cannot be defined due to the excessive complications of the reactants (the existence of many Ce and Ti species at high pH, temperature and concentrations) along with dual templates, calcination at 800 °C leads to the formation of the metal oxides. Heating temperature is critical for crystallinity of the metal oxides. The brannerite evolution as a function of calcination temperature in absence of colloidal silica is investigated. Fig. 1 shows the XRD patterns of the CeTi2.05O6 composition powders calcined for 6 h from 600 to 1250 °C. Almost phase pure CeTi2.05O6 brannerite is formed at 600–1050 °C with small amount of CeO2 (2θ ∼ 28.5°). Besides the main brannerite phase, other phases including CeO2 (JCPDS card No. 00-001-0800, space group Fd![[3 with combining macron]](https://www.rsc.org/images/entities/char_0033_0304.gif) m) and rutile-type TiO2 (2θ ∼ 27.5°) (JCPDS card No. 01-089-4920, space group P42/mnm) are observed at 1150 °C. Calcination at 1250 °C results in the decrease of the peak intensity suggesting a distortion (atom rearrangement) of the brannerite structure. This structure distortion starting from ∼ 1150 °C and following material decomposition at ∼1250 °C have been discussed previously19 and are mainly due to the thermodynamic stabilities of the brannerite at different temperatures. Calcination at 800 °C for 6 h is selected in all following studies. The presence of CeO2 in all samples implies that the brannerite main phase requires Ce to be deficient as previously reported,20,21 even though CeTi2.05O6 composition is used. As a result, more Ti is needed to minimize or eliminate the CeO2 phase. Fig. S1 (ESI†) displays XRD patterns of brannerite powders calcined at 800 °C for 6 h at various Ti to Ce molar ratios with silica to brannerite being 1:2 (w/w). The results show the CeO2 phase is gradually decreased with increase of Ti to Ce molar ratio from 2.05 to 2.15. At Ti to Ce molar ratio being 2.20 and 2.25, no CeO2 phase is observed, so CeTi2.2O6 composition is used for further studies.
m) and rutile-type TiO2 (2θ ∼ 27.5°) (JCPDS card No. 01-089-4920, space group P42/mnm) are observed at 1150 °C. Calcination at 1250 °C results in the decrease of the peak intensity suggesting a distortion (atom rearrangement) of the brannerite structure. This structure distortion starting from ∼ 1150 °C and following material decomposition at ∼1250 °C have been discussed previously19 and are mainly due to the thermodynamic stabilities of the brannerite at different temperatures. Calcination at 800 °C for 6 h is selected in all following studies. The presence of CeO2 in all samples implies that the brannerite main phase requires Ce to be deficient as previously reported,20,21 even though CeTi2.05O6 composition is used. As a result, more Ti is needed to minimize or eliminate the CeO2 phase. Fig. S1 (ESI†) displays XRD patterns of brannerite powders calcined at 800 °C for 6 h at various Ti to Ce molar ratios with silica to brannerite being 1:2 (w/w). The results show the CeO2 phase is gradually decreased with increase of Ti to Ce molar ratio from 2.05 to 2.15. At Ti to Ce molar ratio being 2.20 and 2.25, no CeO2 phase is observed, so CeTi2.2O6 composition is used for further studies.
 | ||
| Fig. 1 XRD patterns of (CeTi2.05)-complex powders calcined for 6 h at (a) 600 °C, (b) 700 °C, (c) 800 °C, (d) 900 °C, (e) 1050 °C, (f) 1150 °C, (g) 1250 °C. The red vertical markers beneath the brannerite patterns show the peak positions expected in the crystal structure. (▼) rutile-type TiO2, (■) CeO2. | ||
CeTi2O6 brannerite has a monoclinic crystal structure with space group C2/m, comprising planes of anatase-like corner and edge sharing TiO6 octahedra which form layers in the ab plane. These layers are linked along the c-axis by CeO6 octahedra (Fig. S2, ESI†). It has been determined that Ce-brannerite is O deficient.20–22 This O-deficient material is suggested to be charge balanced by the presence of a minor concentration of Ce3+ or by the Ce-deficient with the Ce4+ oxidation state. Stennett et al.21 have investigated the crystal structure of cerium brannerite, Ce0.975Ti2O5.95, by analyzing high resolution neutron diffraction data. The presence of both Ce and O vacancies is confirmed from Rietveld analysis, defect energy calculations, and careful investigation of the phase diagram. Formation of O vacancies at the O1 site, charge compensated by Ce vacancies, relieves considerable Coulombic repulsion and hence structural strain associated with short O1–O1 contacts forming the shared edge of neighboring TiO6 polyhedra.
Fig. 2 shows the XRD patterns of the CeTi2.20O6 brannerite powders after leaching silica template, with various silica to brannerite weight ratios and different sized colloidal silica. Fig. S3 (ESI†) shows the XRD patterns of the brannerite powders before leaching silica. The XRD patterns are almost identical for all samples before (Fig. S3, ESI†) and after (Fig. 2a–d) leaching of hard template. The presence of the hard template leads to formation of the less intense and slightly more broad XRD peaks, suggesting less crystallinity and smaller crystallites of the brannerite after adding silica. The XRD data show that silica remains as amorphous state after 800 °C calcination and its presence has no significant effect on the crystallization of the brannerite and slight effect on crystallize sizes (Table 1). Brannerite crystallite sizes are calculated to be ∼40 nm without hard template and ∼30 nm for all templated samples, and leaching process has no effect on crystallite size. Adding silica produces smaller crystallites suggesting silica inhibits brannerite crystal growth. CeO2 minor phase is observed when smaller silica (Φ = 6.8–8.5 nm) is used as template (Fig. 2e and f).
 | ||
| Fig. 2 XRD patterns of samples (a) w0, (b) Φ12w1–4, (c) Φ12w1–2, (d) Φ12w3–4, (e) Φ8w1–2, (f) Φ8w3–4, (g) Φ20w1–2, (h) Φ20w3–4, (■) CeO2. Sample details are shown in Tables 2 and 3. | ||
| SiO2/CeTi2.20O6 weight ratio | 0 | 1:4 |
1:2 |
3:4 |
| Before leaching (Φ = 12.4 nm) | 41.4 | 33.2 | 33.2 | 33.2 |
| After leaching (Φ = 12.4 nm) | 41.4 | 33.2 | 33.2 | 33.2 |
| After leaching (Φ = 6.8–8.5 nm) | 27.6 | 33.2 | ||
| After leaching (Φ = 20.3 nm) | 27.6 | 33.2 |
CeTi2O6 brannerite is higher in energy than its binary oxides with ΔHf-ox0 = +29.4 ± 3.6 kJ mol−1. This material is entropy stabilized with ΔSf-ox0 = +18.1 ± 2.2 J mol−1 K−1.67 At 298.15 K the standard molar heat capacities is 172.78 ± 0.17 J K−1 mol−1.68 The free energy of formation from the oxides at 298.15 K is +15.88 ± 0.03 kJ mol−1.68 As a result, high temperature calcination, over 1351 °C (T ≥ ΔHf-ox0/ΔSf-ox0), is generally required to form thermodynamically stable CeTi2O6 brannerite from the individual binary oxides via mixed oxide route.17–22 In this study, Ce-brannerite is formed ≥600 °C via sol–gel processing with crystallite size ∼30–40 nm after calcination at 800 °C. The formation of the stable Ce-brannerite powder could be due to the “critical crystallite size” effect, e.g., the tetragonal zirconia (t-ZrO2) is usually stable between 1175 and 2370 °C, but it is metastable at room temperature when its crystallite size is <30 nm.69,70 Large specific surface area and appreciable excess surface/interfacial free energy is to stabilize the small t-ZrO2 grains.70 These large surfaces are often found to be highly dynamic, which readily rearrange or react, so that energy can be reduced by processes such as adsorption. In addition, nanocrystalline ceramics (<100 nm) are expected to exhibit enhanced radiation resistance to amorphization as compared to bulk counterparts due to increased interfacial areas in the form of grain boundaries.71 This has been confirmed by titanate pyrochlores with crystallite sizes ∼20–30 nm.72–74 Radiation damage has been studied for brannerite-type materials,75–77 however, more radiation damage analyses are needed for brannerite with smaller crystalline sizes.
Raman spectroscopy is highly sensitive to short range environment of oxygen around the metal cations, i.e., the coordination geometry and oxidation states. So it is able to show the vibrational modes of various MO6 octahedral units comprising the lattice. Factor group analysis for Ce-brannerite predicts a total of 3N = 8Ag + 4Bg + 5Au + 10Bu Brillouin zone center modes (N denotes the number of atoms in the molecule), in which the Ag and Bg modes are Raman active.20,78 Raman spectra of eight template leached brannerite (CeTi2.20O6) powders calcined at 800 °C for 6 h (Fig. 3) at various template sizes and silica to brannerite weight ratios are nearly identical. Out of twelve theoretically predicted Raman modes, nine active modes are detected. Very strong peaks at 164 and 193 cm−1 are attributed to the lattice external modes. Two weak peaks at 273 and 334 cm−1 (Ag mode) and one very strong peak at 371 cm−1 (Bg mode) are due to a combination of deformation vibrations of the Ti–O–Ti units and stretching modes of CeO6 octahedra. The 486 cm−1 weak band (Ag mode) is due to the symmetric stretching while the 766 cm−1 weak band (Bg mode) is assigned to the asymmetric stretching vibration of the Ti–O–Ti units. Strong band at 571 cm−1 and medium intensity band at 641 cm−1 (Bg mode) are generated by the edge-sharing between pairs of octahedra.19,20,78 In addition, a weak peak observed at 464 cm−1 for samples using smallest template belongs to CeO2 possessing fluorite crystal structure (space group Fdm). All these Raman observations are in good agreement with the XRD results suggesting local structure of a small domain specimen is consistent with the average structure of the bulk material and the brannerite powder is highly homogeneous.
 | ||
| Fig. 3 Raman spectra of samples (a) w0, (b) Φ12w1–4, (c) Φ12w1–2, (d) Φ12w3–4, (e) Φ8w1–2, (f) Φ8w3–4, (g) Φ20w1–2, (h) Φ20w3–4, (■) CeO2. | ||
3.2 Powder morphology analyses
The SEM imaging (Fig. 4) is used to observe the morphology of the sub-macroscopic particulates, which are irregular shaped with size range between a few to tens of microns. These particulates are aggregation of the nanocrystals due to the introduction of the glucose as a dispersant agent. There are no significant differences for particulate size of the powders with different silica to brannerite weight ratios or different colloidal silica sizes. Further studies are needed to understand the effect of the quantity and type of the soft template/dispersant agent on the size and size distribution of the particulates. Close observation of the particulates (Fig. S4, ESI†) shows the product displays an interconnected porous network with a sponge-like structure. The size of the ‘building blocks’ (brannerite nanoparticles) is observed by TEM imaging. | ||
| Fig. 4 SEM images of samples (a) w0, (b) Φ12w1–4, (c) Φ12w1–2, (d) Φ12w3–4, (e) Φ8w1–2, (f) Φ20w1–2. | ||
The textural microstructure and the crystallinity of the porous brannerite after removing template are investigated using TEM. Fig. 5 and Fig. S5 (ESI†) show bright field TEM images of six brannerite samples. The microstructure of Φ12w1–4 looks like an iron sponge porous structure (Fig. 5b and Fig. S6, ESI†) because of small silica to brannerite ratio (0.57:1 v/v). This sponge-like crystalline microstructure has been reported for porous binary metal oxides.79 When more silica is introduced and the amount of the brannerite component remains constant, there is not enough brannerite composition to cover the entire silica, thus brannerite particles are formed in the void spaces between the silica particles (Fig. S5, ESI†). These crystalline beads are ∼15–25 nm and slightly smaller than the XRD estimation. The crystalline particles are fairly uniform suggesting the high homogeneity of the system during the synthesis. In contrast, for the sample without introducing colloidal silica (Fig. 5a), the brannerite particles are highly agglomerated, and the crystal size is ∼ 50–100 nm, much larger than those of other samples. The structure of the brannerite crystals is analyzed by the selected area electron diffraction (SAED) patterns. Fig. 5d and e show strong diffractions of the SAED patterns of the brannerite crystals in either [1 3 1] or [1 1 2] zone axis from sample w0 or Φ12w1–4. The sharp dots reflect the high degree of the crystallinity of the brannerite structure at 800 °C calcination. Fig. 5f shows high resolution transmission electron microscopy (HRTEM) image from sample Φ12w1–2 in [1 5 −2] zone axis. These observations indicate that the samples possess a reasonable high crystallographic order at the atomic scale in agreement with XRD data, even though it is subjected to a low calcination temperature and short reaction time. The d-spacing for (2 0 1) plane is estimated to be 0.29 nm from the HRTEM image, closing to the XRD measurement, i.e., 0.2883 nm (2θ = 31.02°). All TEM analyses confirm the formation of the brannerite structure under the selected synthesis conditions.
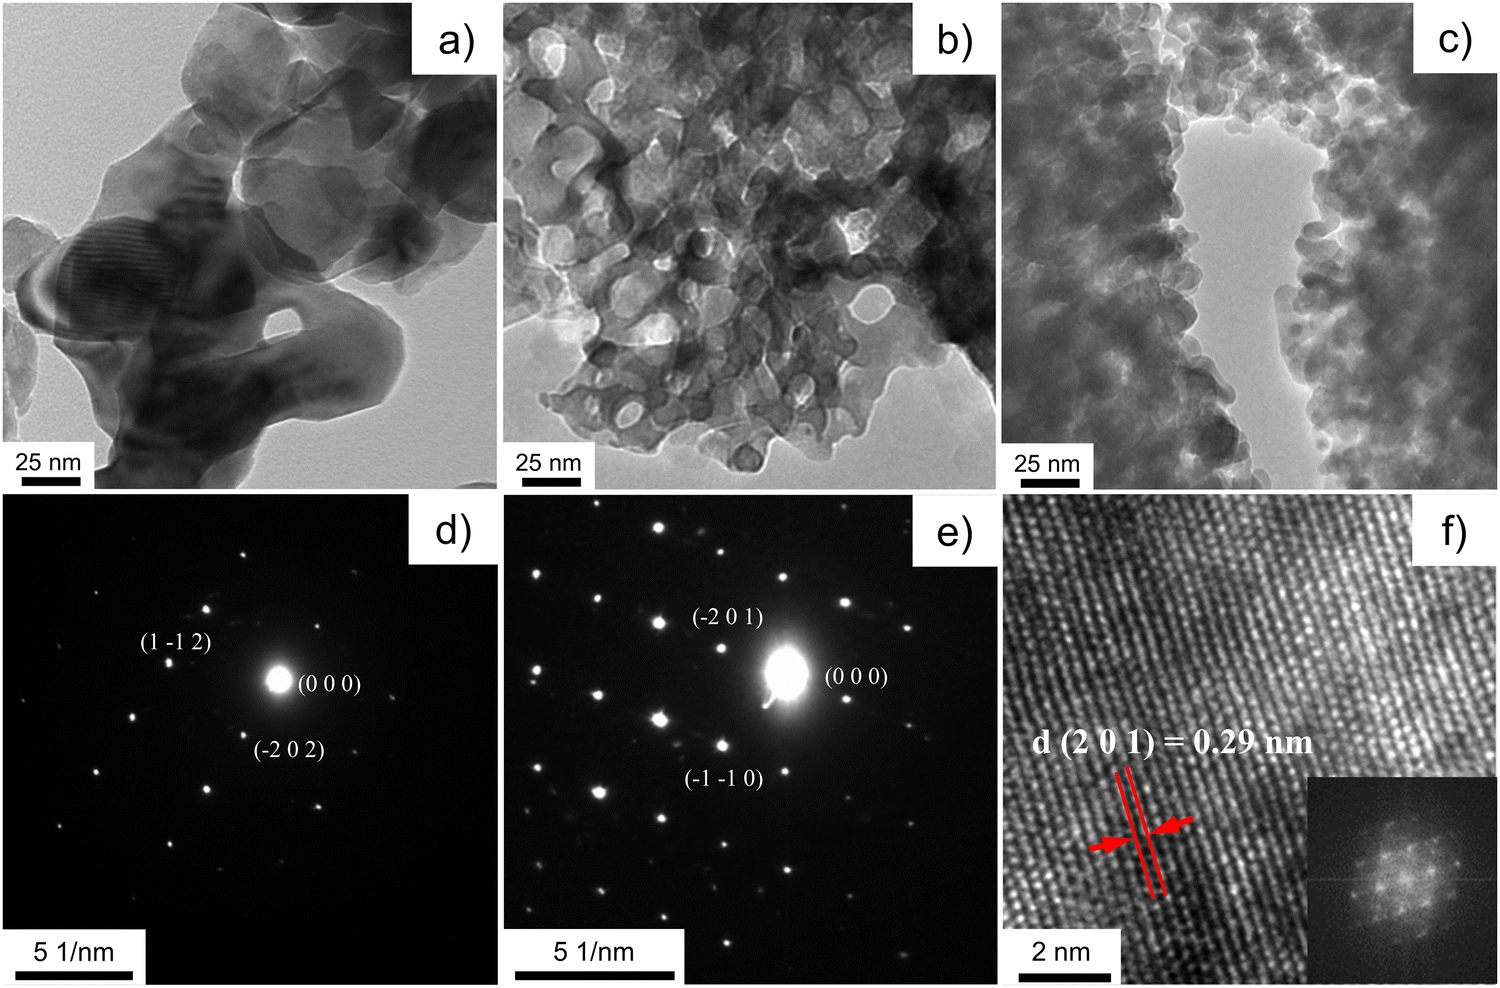 | ||
| Fig. 5 Bright field TEM images of samples (a) w0, (b) Φ12w1–4, (c) Φ12w1–2, (d) SAED pattern [1 3 1] zone axis for sample w0, (e) SAED pattern [1 1 2] zone axis for sample Φ12w1–4, (f) HRTEM image for sample Φ12w1–2 in zone axis of [1 5 -2] and inserted FFT image. | ||
Porosity features including specific surface area, pore volume and pore diameter of the template leached brannerite powders are analyzed by nitrogen adsorption technique. The Brunauer–Emmett–Teller (BET) and non-local density functional theory (DFT) methods are used to interpret sorption isotherms. The nitrogen sorption isotherms are displayed in Fig. 6 and Fig. S7 (ESI†) while the pore size distribution and cumulate pore volume are presented in Fig. S8 and S9 (ESI†). All nitrogen sorption diagrams display the characteristics of the Type IV isotherm80 featuring a hysteresis loop associated with the mesopores (2–50 nm). The BET results are shown in Tables 2 and 3 while the DFT data are displayed in Tables S4 and S5 (ESI†).
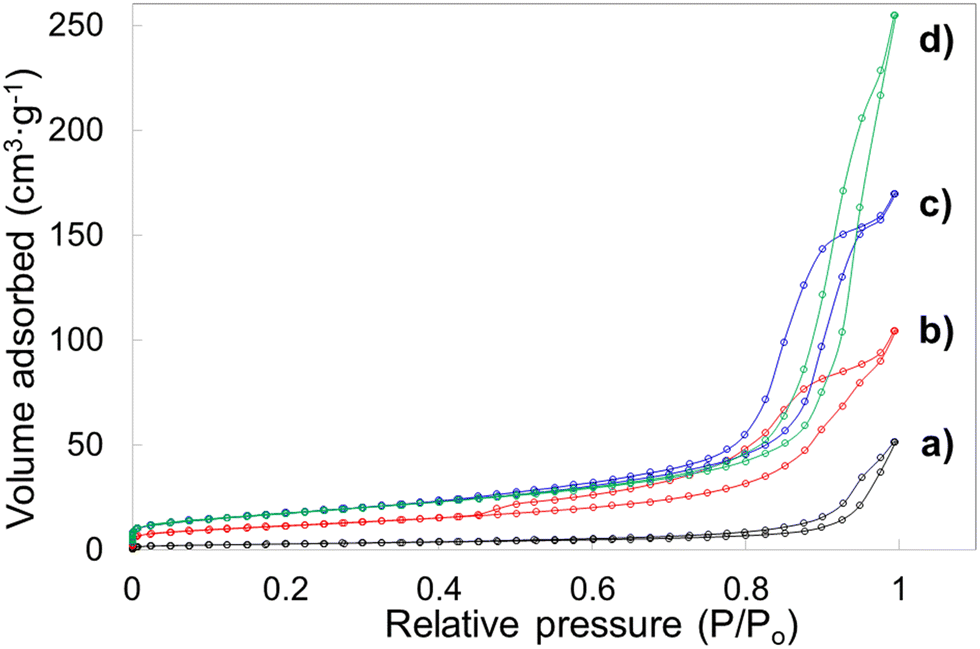 | ||
| Fig. 6 Nitrogen sorption isotherms for samples (a) w0, (b) Φ12w1–4, (c) Φ12w1–2, (d) Φ12w3–4. | ||
| Sample | w0 | Φ12w1–4 | Φ12w1–2 | Φ12w3–4 |
|---|---|---|---|---|
| a Single-point total volume of pores at P/P0 > 0.99. b Average pore diameter determined by BET (4V/A). c OH density (DOH). d OH content (× 1020 g−1). e OH content (mmol g−1) were calculated from TGA analysis. wt: weight; mol.: mole; vol.: volume. | ||||
| Silica to brannerite wt ratio | 0 | 1:4 |
1:2 |
3:4 |
| Silica to brannerite mol. ratio | 0 | 1.38:1 |
2.76:1 |
4.14:1 |
| Silica to brannerite vol. ratio | 0 | 0.57:1 |
1.13:1 |
1.70:1 |
| BET surface area (m2 g−1) | 10.3 | 42.2 | 63.3 | 64.3 |
| BET pore volume (cm3 g−1)a | 0.080 | 0.162 | 0.262 | 0.394 |
| Average pore diameter (nm)b | 30.9 | 15.3 | 16.3 | 24.9 |
| D OH (OH nm−2)c | 4.82 | 6.10 | 5.04 | 5.61 |
| OH (× 1020 g−1)d | 0.50 | 2.57 | 3.24 | 3.55 |
| OH (mmol g−1)e | 0.082 | 0.427 | 0.538 | 0.589 |
| Sample | Φ8w1–2 | Φ8w3–4 | Φ20w1–2 | Φ20w3–4 |
|---|---|---|---|---|
| a All denotations are the same as in Table 2. | ||||
| SiO2 (nm) | 6.8–8.5 | 6.8–8.5 | 20.3 | 20.3 |
| Silica to brannerite wt ratio | 1:2 |
3:4 |
1:2 |
3:4 |
| BET surface area (m2 g−1) | 76.5 | 55.1 | 99.6 | 97.2 |
| BET pore volume (cm3 g−1) | 0.221 | 0.253 | 0.257 | 0.451 |
| Average pore diameter (nm) | 11.5 | 18.3 | 10.3 | 18.6 |
| D OH (OH nm−2) | 4.78 | 5.90 | 5.62 | 5.75 |
| OH (× 1020 g−1) | 3.66 | 3.25 | 5.60 | 5.59 |
| OH (mmol g−1) | 0.607 | 0.540 | 0.929 | 0.929 |
For sample w0 (without introducing silica but undergoing leaching process), the BET surface area and pore volume are very low at ∼10 m2 g−1 and ∼0.08 cm3 g−1. Average pore diameter is calculated at ∼31 nm and these pores are primarily due to the presence of the soft template/dispersant agent which prevents the particles from heavy agglomeration during heating. When 12.4 nm colloidal silica is used as hard template and the silica to brannerite weight ratio increases from 1:4 to 3:4, the BET surface area, pore volume and average pore diameter increase from ∼42 m2 g−1, 0.16 cm3 g−1, 15 nm to ∼64 m2 g−1, 0.39 cm3 g−1, 25 nm, respectively. The DFT data follow the same trend with slightly different values. In addition, no pores with size <5 nm are observed, 93–98 vol% of pores are in the size range of 5–50 nm. The porosity in these samples is largely derived from intergranular voids after leaching silica templates. The addition of the hard templates not only creates vacancies in the powder after their removal, but also inhibits the growth of the brannerite grains. It is expected that increasing the amount of hard template will lead to higher intergranular volumes and smaller ceramic grains thus resulting in higher surface areas. However, this is more apparent for silica to brannerite weight ratio increment from 1:4 to 1:2, but less obvious from 1:2 to 3:4.
The porosity data using the other two types of colloidal silica are displayed in Table 3. When 20.3 nm colloidal silica is used, the BET surface area approaches to 100 m2 g−1 and the average pore size is ∼10–18 nm. One notable result, when larger size templates are used, is the development of pores peaked ∼4.8 nm after leaching silica. The DFT modelling indicates up to 16% pore volume is created by pores under 5 nm size. Compared with smaller template, larger template possesses small exposure curvature and this geometric factor may promote the chemical reaction rate on template surface.81 As a result, these small pores are more likely derived from the spaces between brannerite crystals, rather than the cavities occupied by hard templates.
For comparison, nitrogen adsorption analyses are also carried out for powders prior to leaching 12.4 nm templates, with sorption isotherms and pore size distribution shown in Fig. S10 (ESI†) and the porosity data displayed in Table S6 (ESI†). The nitrogen isotherms display Type IV features and BET surface area is reasonably low ∼2.7–13 m2 g−1 with pore volume <0.04 cm3 g−1, for all samples in the presence of the hard templates.
Caution is needed to interpret this type of inter-particular irregular shaped pores formed after leaching hard template since some colloidal silica might undergo dissolving and coalescing at elevated pH during drying the gelling mixture. Even though the cylindrical pore shape, which is considered for pore size calculation by DFT model, does not exactly match the voids remained after leaching silica, the pore size values should be in the same order of magnitude.82 In addition, the results are similar when either spherical or slit pore type is selected for DFT modelling.
The pore size distribution profiles demonstrate either broader pore size distribution or multimodal porous network, for better facilitating the adsorption. Pore size distribution directly influences the adsorption kinetics, that is, the ability of the probe molecules enabling to freely access the internal surface of the adsorbent particulates. This molecular accessibility is highly dependent on the pore size, especially the proportion of larger pores. The hydroxyl groups on the particle surface facilitate the affiliation between the adsorbent and the adsorbate. The surface hydroxyl group density (OH nm−2) and OH content (OH g−1) are estimated by TGA based on the mass loss during the heating and the results are displayed in Tables 2 and 3. Powder prepared without adding hard template has the lowest OH content, ∼0.08 mmol g−1. For porous brannerite powders using 12.4 nm (Φ) template, the OH content increases from ∼0.43 to 0.59 mmol g−1 with increasing silica to brannerite weight ratio from 1:4 to 3:4. Using 20.3 nm colloidal silica as template results in materials with highest OH content, ∼0.93 mmol g−1, due to the higher specific surface area (∼100 m2 g−1).
3.3. Uranyl adsorption analyses
Six porous brannerite powders (Table S1, ESI†) with different porosity features are used for uranyl adsorption analyses at pH 3.8 nitric acid solution, at which the UO22+ is the dominant uranium ionic species. The adsorption capacity is assessed by adsorbing UO22+ with the U initial concentration in the range of 50–700 mg L−1 and a solution volume to adsorbate mass ratio being 100 mL g−1. The uptake adsorption isotherms are shown in Fig. 7a–f and the corresponding constants for the Langmuir model are listed in Table 4. All Langmuir profiles represent strong binding interaction between uranyl and brannerite surfaces as described by the fast uptake at initial U concentrations. The adsorption behaviors are closely complied with the Langmuir fitting, suggesting a monolayer coverage mechanism. The adsorption monolayer capacities (qmax) are in the range of ∼0.094–0.221 mmol g−1 (22 to 53 mg g−1) of U, and there exists a linear relation between qmax and the specific surface area of the porous powders (Fig. 8A). In addition, sample Φ12w3–4 reveals an outstanding b value (∼ 27 in Table 4), which is an indicator for the affinity degree between adsorbent and adsorbate. This is probably due to the fact that this sample not only has larger pore diameter and pore volume, but also contains relatively higher numbers of hydroxyl groups per gram of powder.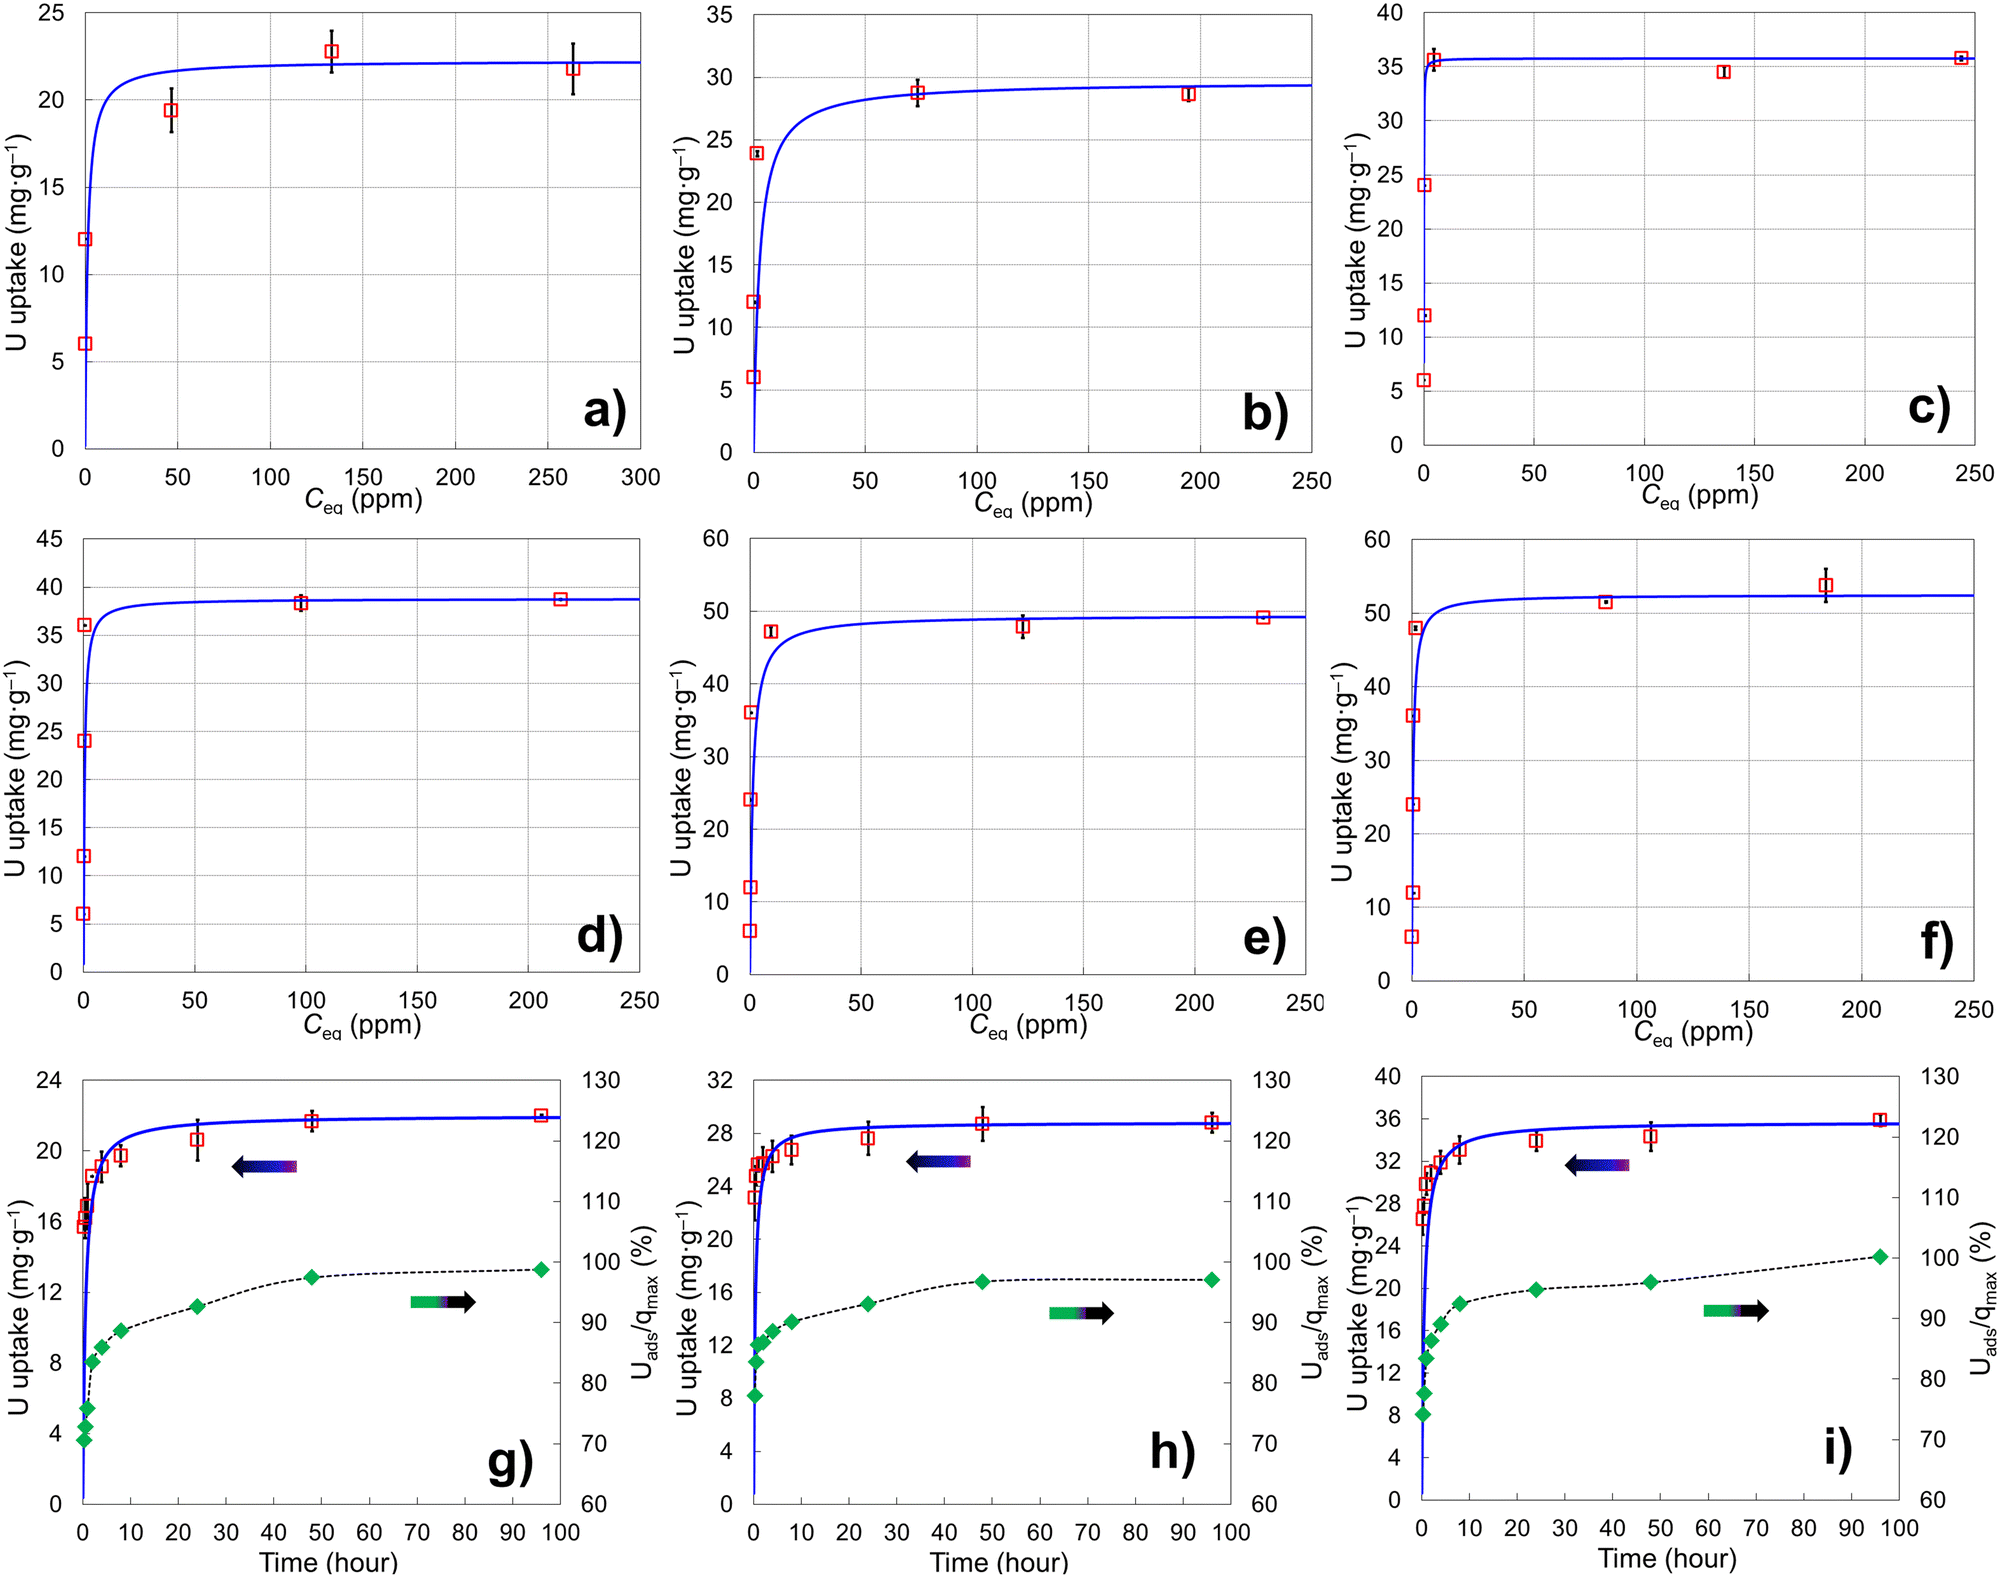 | ||
| Fig. 7 (a–f) Uranium uptake adsorption isotherms and (g–i) kinetics for samples (a and g) Φ12w1–4, (b and h) Φ12w1–2, (c and i) Φ12w3–4, (d) Φ8w1–2, (e) Φ20w1–2, (f) Φ20w3–4. Blue bold lines represent Langmuir fits for isotherms and pseudo-second-order fits for kinetics with initial U concentration 400 mg L−1. pH = 3.8, V/m = 100 mL g−1. The experimental data points are expressed as (average ± 3σ, N = 2) and where not visible are smaller than the markers. | ||
| Sample | SiO2a (nm) | Ratiob | q max (mg g−1) | q max (mmol g−1) | q max (μmol m2) | b | R 2 |
|---|---|---|---|---|---|---|---|
| a Template diameter. b Template to brannerite weight ratio. | |||||||
| Φ12w1–4 | 12.4 | 1:4 |
22.25 | 0.0935 | 2.314 | 0.7663 | 0.9986 |
| Φ12w1–2 | 12.4 | 1:2 |
29.65 | 0.1246 | 1.984 | 0.3905 | 0.9982 |
| Φ12w3–4 | 12.4 | 3:4 |
35.77 | 0.1503 | 2.472 | 27.28 | 0.9992 |
| Φ8w1–2 | 6.8–8.5 | 1:2 |
38.80 | 0.1630 | 2.277 | 2.192 | 1.000 |
| Φ20w1–2 | 20.3 | 1:2 |
49.45 | 0.2077 | 2.210 | 0.8002 | 0.9996 |
| Φ20w3–4 | 20.3 | 3:4 |
52.51 | 0.2206 | 2.204 | 1.8764 | 0.9999 |
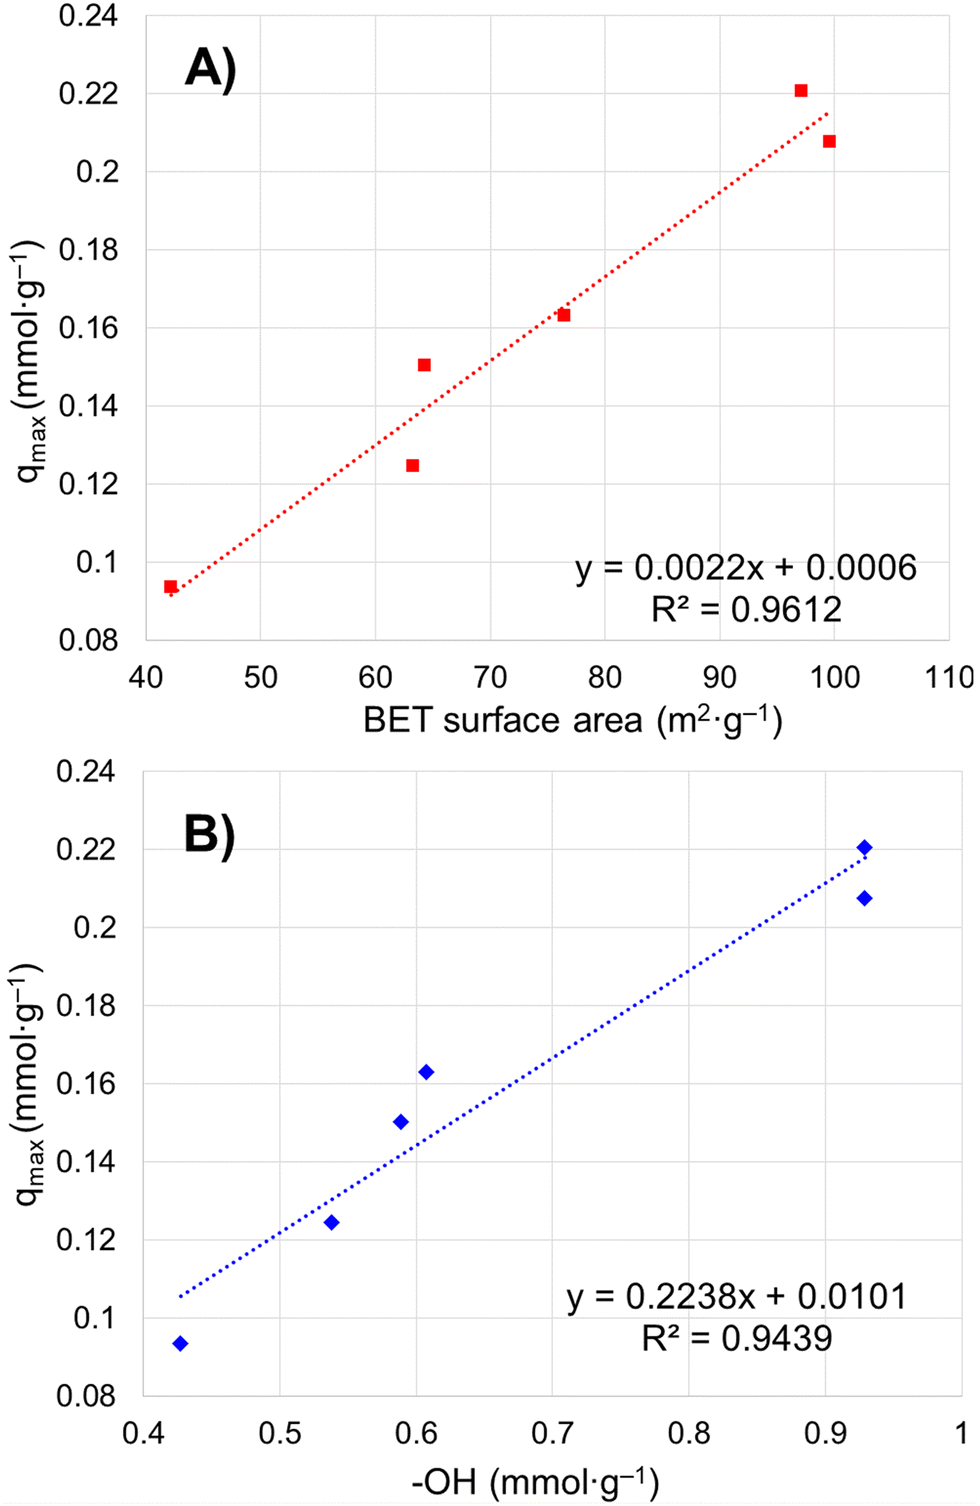 | ||
| Fig. 8 Relation between maximum uranium adsorption capacity and (A) particulate specific surface area by BET modelling; (B) –OH concentration on particle surface. | ||
The studies of the uranyl adsorption on porous ternary metal oxide surfaces are very limited and those using crystal porous ternary oxides are even scarcer. The porous zirconium titanium oxide mixtures are reported to undertake uranyl adsorption.57–59 However, the products are either in amorphous state or polycrystal mixtures, with the monolayer full adsorption capacity (qmax) reaching up to 0.170 mmol g−1 under 52 m2 g−1 surface area.57 Commercially available iron embedded Fe-MnO2 nanoporous composite has a surface area of 330 m2 g−1 with uptake capacity as 0.169 mmol g−1, and the surface area of the synthesized 8 nm Mn-doped iron oxides magnetic nanoparticles is 280 m2 g−1 with qmax being 0.153 mmol g−1.51 Mesoporous porous Y2Ti2O7 with pyrochlore structure has been formed under calcination at 900 °C with specific surface area up to 70 m2 g−1 and uranyl adsorption reaching 0.249 mmol g−1.66 Even though porous Y2Ti2O7 pyrochlore has slightly higher adsorption capacity than that of this brannerite, the latter provides alternative choice with different chemical composition and crystal structure, and higher specific surface area. It is apparent that the monolayer saturation adsorption capacity (qmax) has direct relationship with the specific surface area (Fig. 8A), but the ‘active surface area’, which the adsorbate is able to access, is more critical for effective adsorption. This ‘active surface area’ will be covered by the adsorbate, and may be only partial of the total specific surface area and directly related with the pore size and its distribution, as well as the pore volume. Surface area contributed by micropores, if there are any, may not be covered by the adsorbate due to the accessibility issue. Furthermore, other factors such as the crystallinity and the composition of the materials exert essential roles as well for adsorption.57
The adsorption rates of UO22+ on three brannerites powders are investigated using Ci (initial U concentration) 400 mg L−1 (Table S2, ESI†). The kinetic behaviors along with the percentage of adsorbed U with regard to the qmax are shown in Fig. 7g–i and the corresponding pseudo-second-order kinetic results are displayed in Table 5. The equilibrium sorption capacities (qe) are very close to the monolayer capacities (qmax) determined at capacity studies by Langmuir model. After soaking the powder for 15 min, adsorbed uranyl (Uads) reaches ∼71, 78, and 74% of the it full capacity (qmax), for sample Φ12w1–4, Φ12w1–2, and Φ12w3–4, respectively. At 24 h, the Uads/qmax increases to ∼93, 93, and 95% for corresponding samples. The adsorption rate closely follows the pseudo-second-order kinetic trend and over 93% of surfaces are covered by uranyl after 24 h immersion. The sample Φ12w1–2 shows slightly quicker of initial U uptake which is further demonstrated by k2 (the overall pseudo-second-order rate constant) and h0 (the initial adsorption rate). This could be because that the sample possesses highest proportion of mesopore volume fraction (Table 2), thus providing better pathways for UO22+ access to adsorption sites. In contrast, Φ12w1–4 shows a lower h0 likely due to the high proportion of the smaller pores as well as smaller pore volume, thus limiting the free accessibility of the adsorbates.
Free uranyl cations are the predominant species observed in pH < 5 acidic solution. In contrast, uranyl ions form a series of polynuclear uranium species present in varying proportions in solutions with pH ≥ 5.27 At pH 3.8, the UO22+ is the dominant species27,57–59 which demonstrates relatively simple uranyl adsorption mechanism in respect of the adsorbate features. At this pH, uranyl ions form aquocomplexes, with UO2(H2O)52+ identified as the most stable complex and the size of the hydrated molecular being ∼ 1 nm in diameter.83 Owing to the high proportion of the mesopores (>∼85 vol%) in the size range of 5–50 nm (Tables 2 and 3), it is reasonable to claim the diffusion rate of the complex ions is quite high, which is evidenced by the kinetics studies discussed previously. Considering the hydrogen bonded and physical adsorbed water molecule on oxide surface in an aqueous solution, porous material with micropores with size <2 nm would limit access to hydrated UO22+. Extremely limited micropores (<2 nm) are observed by nitrogen sorption analyses for all samples synthesized using this dual template method shown in pore size distribution figures. In addition, the porous particulates with size being about a few microns observed by SEM are supposed to have shorter diffusion path distances and thus higher cation sorption rates than those of the porous monolithic type of materials. The hierarchical mesoporous structure and high porosity improve diffusion efficiency. Hydroxyl groups on particle surface may act as adsorption sites to bind uranyl ions. This action groups in either –O− or –OH state depending on solution pH play an essential role for the adsorption process. For eight samples analyzed, the average OH surface density (DOH) is 5.45 ± 0.51 (average ± σ, N = 8) OH nm−2, indicating ∼5–6 hydroxyl species occupy one square nm on particle surface. This result is consistent with the literature data (DOH = 5.4 OH nm−2) for the sol–gel-made titania powders using water to titanium alkoxide precursor molar ratio being 1000 and dried at 150 °C for 24 h.84 It is reasonable that powders possessing high surface areas (m2 g−1) normally have high OH concentration (mmol g−1) (Tables 2 and 3), thus higher qmax (mg g−1) value. A linear relationship between qmax and –OH concentration is shown in Fig. 8B. The samples with higher –OH concentration ∼0.93 mmol g−1 obtain lower qmax than expected from the trend. One possible reason is these samples contain more smaller pores (peak pore size ∼4.8 nm). Even though almost all –OH groups should be measurable by TGA analysis, not all of them are reachable by uranyl due to high proportion of the smaller pores.
An inner-sphere bidentate and tridentate surface complexation mechanisms have been reported by binding uranyl on rutile surface85,86 and on zircon (ZrSiO4),87 respectively, at pH ∼ 3. In another study, the interaction between uranyl ions and montmorillonite edge sites occurs via both ![[triple bond, length as m-dash]](https://www.rsc.org/images/entities/char_e002.gif) AlOH and SiOH surface groups and involves three distinct surface complexes.88 The average ratio between the quantity of –OH groups (mmol g−1) and uranyl maximum adsorption capacity (mmol g−1) of six samples is 4.20 ± 0.33 (average ± σ, N = 6). It is reasonable to assume that an inner-sphere tetradentate surface complexation mechanism is applied for uranyl adsorption on cerium titanate brannerite surface, though further experimental evidence is required to confirm this hypothesis.
AlOH and SiOH surface groups and involves three distinct surface complexes.88 The average ratio between the quantity of –OH groups (mmol g−1) and uranyl maximum adsorption capacity (mmol g−1) of six samples is 4.20 ± 0.33 (average ± σ, N = 6). It is reasonable to assume that an inner-sphere tetradentate surface complexation mechanism is applied for uranyl adsorption on cerium titanate brannerite surface, though further experimental evidence is required to confirm this hypothesis.
The isoelectric point (IEP) is in the pH range of 6–10 and 4.5–7.3 for CeO2 and TiO2, respectively, with several exceptions, but the available IEP data of the mixed oxide are scarce, let alone the porous micron-sized polycrystal ternary oxides.89 The point of zero charge (PZC) of the crystalline ceria, titania, and cerium titanate brannerite nanoparticles have been determined to be pH = 9.0, 4.2, and 7.5, respectively.5 As the adsorption studies are carried out at pH 3.8, which is below the PZC of the cerium titanate, the oxide surface should be positively charged. UO22+ cation is the dominant species at pH 3.8, thus uranyl adsorption occurs on a positively charged oxide surfaces despite the electrostatic repulsion. As a result, the uranyl adsorption mechanism cannot be interpreted by electrostatic attraction based on the surface charge of the oxide, but an inner-sphere surface complexation.
Chemical stability tests are performed for three samples in 0.01–2 mol L−1 HNO3 solutions, with V/m = 100 mL g−1 and 48 h contact time at room temperature. The data (Table S3, ESI†) show that the maximum amount of Ce and Ti released is <0.65 wt% of the product. Trace amount of Na (max. 0.88 wt%) and Si (max. 0.38 wt%) in powders are detected suggesting Na and Si are not completely removed during washing and leaching procedures, but the remaining quantity is negligible. All powders keeping their original crystal structure (Fig. S11, ESI†) demonstrate the phase stability both in acidic media (chemical stability tests up to 2 mol L−1) and in basic solution (leaching processing at 2.5 mol L−1).
Even though the method used in this study is scalable, economic, energy and time efficient for the synthesis of a crystalline porous oxide by utilizing low cost colloidal silica as template,79 there are many unknowns for the adsorption mechanism. Many factors affect the adsorption capacity and the kinetic, and these influencing factors interact one another in many ways. In general, the ‘active surface area’ of the adsorbent is directly related to the sorption capacity, but this correlation cannot compare between different materials. The pore size and volume are closely linked to the sorption kinetics with larger pore volume and sizes enabling adsorbate molecules to easily access to internal surfaces, thus better facilitate the adsorption processing. The PZC/IEP and the presence of the functional groups on the material surface, along with the solution pH, are strongly related to the surface charge of the material, which affects the association between adsorbent and adsorbate, electrostatically. In addition, smaller size of the adsorbent particulate will have shorter diffusion distance for the adsorbate, whereas the dimension, shape, and the density of the adsorbate and its hydration connect with its accessibility to the internal surface of the adsorbent. Furthermore, the temperature, ion strength, volume/mass ratio and method of contacting have direct effect on the sorption capacity and kinetics. All these need to be investigated in detail. In addition, future work may also include the judicious selection the type of the templates and their quantity as well as the synthesis conditions to precisely control the porosity properties of the products. Finally various kinetic and isotherm models can be further employed27 to interpret the data to provide additional information for better understanding the interaction mechanism between the adsorbent and the adsorbate.
4. Conclusions
Hierarchical mesoporous cerium titanate powders possessing brannerite structure have been synthesized using dual templates via sol–gel processing. The molar ratio of Ti and Ce being 2.20 and the calcination at 800 °C for 6 h are used to produce the brannerite with minimum secondary phases. The brannerite powders are composed of ∼20–30 nm crystallized ‘building blocks’. Colloidal silica with diameter ∼8, 12, or 20 nm is used as the hard template, and the effect of the silica to brannerite weight ratio from 1:4 to 3:4 on material porosity is investigated. Hard template leached materials attain high specific surface area (up to ∼100 m2 g−1) and pore volume (up to ∼0.4 cm3 g−1), as well as the desired pore size range (5–50 nm) after degassing at 300 °C before nitrogen sorption analyzing. These 5–50 nm pores represent ∼84–98% of total pore volume. The monolayer uranyl adsorption capacity (qmax) has linear relationship with the specific surface area of the powders with the capacity reaching ∼0.221 mmol (53 mg) U per gram powder. The qmax and the concentration of the hydroxyl group (mmol g−1) on particle surface also shows a linear relation. The materials demonstrate a surprising fast uptake rate due to the high proportion of the mesopores with adsorbed uranyl reaching over 70% of the full capacity within 15 min of contact. The employed analyzing techniques have confirmed that the synthesized brannerite powders possess high composition homogeneity, high phase and chemical stability at least in ∼2 mol L−1 acidic and basic solutions. This porous brannerite, having unique composition, good porosity features and high physico-chemical stabilities, could be applied to applications under high temperature and strong acid and base environments.
Conflicts of interest
There are no conflicts to declare.Acknowledgements
We sincerely thank Kimbal Lu for supply of the uranyl stock solution; Ilkay Chironi for TGA data collection.References
- L. Yang, D. Chen, J. Zhang, Z. Lv and W. Zhang, Enhanced photocatalytic activity of porous cerium titanate using PEG4000 in sol-gel route, Optoelectron. Adv. Mater., Rapid Commun., 2019, 13, 555–559 CAS.
- W. Zhang, Y. Tao and C. Li, Effects of PEG4000 template on sol-gel synthesis of porous cerium titanate photocatalyst, Solid State Sci., 2018, 78, 16–21 CrossRef CAS.
- W. Zhang, J. Yang and C. Li, Role of thermal treatment on sol-gel preparation of porous cerium titanate: Characterization and photocatalytic degradation of ofloxacin, Mater. Sci. Semicond. Process., 2018, 85, 33–39 CrossRef CAS.
- W. Zhang, Y. Dong, Y. Zhou, J. Li, X. Xiao and C. Li, Role of cetyltrimethyl ammonium bromide on sol–gel preparation of porous cerium titanate photocatalyst, J. Sol-Gel Sci. Technol., 2018, 88, 202–210 CrossRef CAS.
- J. Ding, Q. Zhong and S. Zhang, A new insight into catalytic ozonation with nanosized Ce–Ti oxides for NOx removal: Confirmation of Ce–O–Ti for active sites, Ind. Eng. Chem. Res., 2015, 54, 2012–2022 CrossRef CAS.
- A. Verma, A. Goyal and R. K. Sharma, Microstructural, photocatalysis and electrochemical investigations on CeTi2O6 thin films, Thin Solid Films, 2008, 516, 4925–4933 CrossRef CAS.
- S. Otsuka-Yao-Matsuo, T. Omata and M. Yoshimura, Photocatalytic behavior of cerium titanates, CeTiO4 and CeTi2O6 and their composite powders with SrTiO3, J. Alloys Compd., 2004, 376, 262–267 CrossRef CAS.
- A. Verma and S. A. Agnihotry, Sol-gel process for the preparation of nanocrystalline CeTi2O6 powder, US Pat., 2013/8349284 B2, 2013 Search PubMed.
- V. Amita, A. S. Avinash and B. A. Kumar, Monoclinic CeTi2O6 thin film and sol-gel process for the preparation thereof, US Pat., 2010/7678413 B2, 2010 Search PubMed.
- A. Verma, A. K. Srivastava and K. N. Sood, Effect of precursor sol's aging on properties of nanostructured thin films with coexistent CeO2 and CeTi2O6 phases, Solid State Ionics, 2007, 178, 1288–1296 CrossRef CAS.
- M. Yoshida and S. Ueda, Ternary-type complex oxide abrasive for polishing of semiconductor wafer, contains ternary-type complex oxide particles containing cerium-titanium oxide phase which has brannerite structure of monoclinic system, Jpn Pat., 2007116081-A, 2007 Search PubMed.
- M. Yoshida, N. Koyama, T. Ashizawa, Y. Sakata and H. Imamura, A new cerium-based ternary oxide slurry, CeTi2O6, for chemical-mechanical polishing, Jpn. J. Appl. Phys., 2007, 46, 977–979 CrossRef CAS.
- D. J. Bailey, M. C. Stennett, B. Ravel, D. Grolimund and N. C. Hyatt, Synthesis and characterisation of brannerite compositions (U0.9Ce0.1)1−xMxTi2O6 (M = Gd3+, Ca2+) for the immobilisation of MOX residues, RSC Adv., 2018, 8, 2092–2099 RSC.
- S. V. Stefanovsky, S. V. Yudintsev, A. A. Shiryaev, V. Y. Murzin and A. L. Trigub, Phase partitioning and uranium speciation in brannerite-based ceramics, J. Eur. Ceram. Soc., 2017, 37, 771–777 CrossRef CAS.
- R. Gilligan and A. N. Nikoloski, The extraction of uranium from brannerite – A literature review, Miner. Eng., 2015, 71, 34–48 CrossRef CAS.
- S. Shahab Naghavi, J. He and C. Wolverton, CeTi2O6 – A promising oxide for solar thermochemical hydrogen production, ACS Appl. Mater. Interfaces, 2020, 12, 21521–21527 CrossRef PubMed.
- M. C. Dixon Wilkins, E. R. Maddrell, M. C. Stennett and N. C. Hyatt, The effect of temperature on the stability and cerium oxidation state of CeTi2O6 in inert and oxidizing atmospheres, Inorg. Chem., 2020, 59, 17364–17373 CrossRef CAS PubMed.
- E. R. Aluri, L. M. Bachiu, A. P. Grosvenor, S. H. Forbes and J. E. Greedan, Assessing the oxidation states and structural stability of the Ce analogue of brannerite, Surf. Interface Anal., 2017, 49, 1335–1344 CrossRef CAS.
- L. Kong, D. J. Gregg, E. R. Vance, I. Karatchevtseva, G. R. Lumpkin, M. G. Blackford, R. Holmes, M. Jovanovic and G. Triani, Preparation of cerium titanate brannerite by solution combustion, and phase transformation during heat treatment, J. Eur. Ceram. Soc., 2017, 37, 2179–2187 CrossRef CAS.
- L. Kong, D. J. Gregg, I. Karatchevtseva, Z. Zhang, M. G. Blackford, S. C. Middleburgh, G. R. Lumpkin and G. Triani, Novel chemical synthesis and characterization of CeTi2O6 brannerite, Inorg. Chem., 2014, 53, 6761–6768 CrossRef CAS PubMed.
- M. C. Stennett, C. L. Freeman, A. S. Gandy and N. C. Hyatt, Crystal structure and non-stoichiometry of cerium brannerite: Ce0.975Ti2O5.95, J. Solid State Chem., 2012, 192, 172–178 CrossRef CAS.
- L. T. Huynh, S. B. Eger, J. D. S. Walker, J. R. Hayes, M. W. Gaultois and A. P. Grosvenor, How temperature influences the stoichiometry of CeTi2O6, Solid State Sci., 2012, 14, 761–767 CrossRef CAS.
- V. Valeš, L. Matějová, Z. Matěj, T. Brunátová and V. Holý, Crystallization kinetics study of cerium titanate CeTi2O6, J. Phys. Chem. Solids, 2014, 75, 265–270 CrossRef.
- T. Kidchob, L. Malfatti, D. Marongiu, S. Enzo and P. Innocenzi, An alternative sol-gel route for the preparation of thin films in CeO2-TiO2 binary system, Thin Solid Films, 2010, 518, 1653–1657 CrossRef CAS.
- T. Kidchob, L. Malfatti, D. Marongiu, S. Enzo and P. Innocenzi, Formation of cerium titanate, CeTi2O6, in sol-gel films studied by XRD and FAR infrared spectroscopy, J. Sol-Gel Sci, Technol., 2009, 52, 356–361 CrossRef CAS.
- L. Matějová, V. Valeš, R. Fajgar, Z. Matěj, V. Holý and O. Šolcová, Reverse micelles directed synthesis of TiO2-CeO2 mixed oxides and investigation of their crystal structure and morphology, J. Solid State Chem., 2013, 198, 485–495 CrossRef.
- Y. Xie, C. Chen, X. Ren, X. Wang, H. Wang and X. Wang, Emerging natural and tailored materials for uranium-contaminated water treatment and environmental remediation, Prog. Mater. Sci., 2019, 103, 180–234 CrossRef CAS.
- H.-C. zur Loye, T. Besmann, J. Amoroso, K. Brinkman, A. Grandjean, C. H. Henager, S. Hu, S. T. Misture, S. R. Phillpot, N. B. Shustova, H. Wang, R. J. Koch, G. Morrison and E. Dolgopolova, Hierarchical materials as tailored nuclear waste forms: A perspective, Chem. Mater., 2018, 30, 4475–4488 CrossRef CAS.
- K. Vellingiri, K.-H. Kim, A. Pournara and A. Deep, Towards high-efficiency sorptive capture of radionuclides in solution and gas, Prog. Mater. Sci., 2018, 94, 1–67 CrossRef CAS.
- T. Le Nedelec, A. Charlot, F. Calard, F. Cuer, A. Leydier and A. Grandjean, Uranium adsorption from sulfuric acid media using silica materials functionalised with amide and phosphorous ligands, New J. Chem., 2018, 42, 14300 RSC.
- E. Rosenberg, G. Pinson, R. Tsosie, H. Tutu and E. Cukrowska, Uranium remediation by ion exchange and sorption methods: A critical review, Johnson Matthey Technol. Rev., 2016, 60, 59–77 CrossRef.
- M. Gao, G. Zhu and C. Gao, A review: Adsorption materials for the removal and recovery of uranium from aqueous solutions, Energy Environ. Focus, 2014, 3, 219–226 CrossRef.
- L. Chen, H. Xin, Y. Fang, C. Zhang, F. Zhang, X. Cao, C. Zhang and X. Li, Application of metal oxide heterostructures in arsenic removal from contaminated water, J. Nanomater., 2014, 2014, 793610 Search PubMed.
- P. Makowski, X. Deschanels, A. Grandjean, D. Meyer, G. Toquer and F. Goettmann, Mesoporous materials in the field of nuclear industry: Applications and perspectives, New J. Chem., 2012, 36, 531–541 RSC.
- R. K. Eby, R. C. Ewing and R. C. Birtcher, The amorphization of complex silicates by ion-beam irradiation, J. Mater. Res., 1992, 7, 3080–3102 CrossRef CAS.
- Y. Lou, S. Dourdain, C. Rey, Y. Serruys, D. Simeone, N. Mollard and X. Deschanels, Structure evolution of mesoporous silica under heavy ion irradiations of intermediate energies, Microporous Mesoporous Mater., 2017, 251, 146–154 CrossRef CAS.
- C. Jo, J. Hwang, W.-G. Lim, J. Lim, K. Hur and J. Lee, Multiscale phase separations for hierarchically ordered macro/sesostructured metal oxides, Adv. Mater., 2018, 30, 1703829 CrossRef PubMed.
- J. Wei, Z. Sun, W. Luo, Y. Li, A. A. Elzatahry, A. M. Al-Enizi, Y. Deng and D. Zhao, New insight into the synthesis of large-pore ordered mesoporous materials, J. Am. Chem. Soc., 2017, 139, 1706–1713 CrossRef CAS PubMed.
- A. Feinle, M. S. Elsaesser and N. Hüsing, Sol–gel synthesis of monolithic materials with hierarchical porosity, Chem. Soc. Rev., 2016, 45, 3377–3399 RSC.
- L.-B. Sun, X.-Q. Liu and H.-C. Zhou, Design and fabrication of mesoporous heterogeneous basic catalysts, Chem. Soc. Rev., 2015, 44, 5092–5147 RSC.
- D. Gu and F. Schüth, Synthesis of non-siliceous mesoporous oxides, Chem. Soc. Rev., 2014, 43, 313–344 RSC.
- A. Walcarius, Mesoporous materials and electrochemistry, Chem. Soc. Rev., 2013, 42, 4098–4140 RSC.
- V. Valtchev and L. Tosheva, Porous nanosized particles: preparation, properties, and applications, Chem. Rev., 2013, 113, 6734–6760 CrossRef CAS PubMed.
- W. Li and D. Zhao, An overview of the synthesis of ordered mesoporous materials, Chem. Commun., 2013, 49, 943–946 RSC.
- W. Li, Q. Yue, Y. Deng and D. Zhao, Ordered mesoporous materials based on interfacial assembly and engineering, Adv. Mater., 2013, 25, 5129–5152 CAS.
- Y. Ren, Z. Ma and P. G. Bruce, Ordered mesoporous metal oxides: Synthesis and applications, Chem. Soc. Rev., 2012, 41, 4909–4927 RSC.
- E. Broda, A. Gładysz-Płaska, E. Skwarek and V. V. Payentko, Structural properties and adsorption of uranyl ions on the nanocomposite hydroxyapatite/white clay, Appl. Nanosci., 2022, 12, 1101–1111 CrossRef CAS.
- E. Skwarek, A. Gładysz-Płaska, J. B. Choromańska and E. Broda, Adsorption of uranium ions on nano-hydroxyapatite and modified by Ca and Ag ions, Adsorption, 2019, 25, 639–647 CrossRef CAS.
- E. Skwarek, A. Gładysz–Płaska and Y. Bolbukh, Adsorption of uranyl ions at the nano-hydroxyapatite and its modification, Nanoscale Res. Lett., 2017, 12, 278 CrossRef PubMed.
- S. Huang, H. Pang, L. Li, S. Jiang, T. Wen, L. Zhuang, B. Hu and X. Wang, Unexpected ultrafast and high adsorption of U(VI) and Eu(III) from solution using porous Al2O3 microspheres derived from MIL-53, Chem. Eng. J., 2018, 353, 157–166 CrossRef CAS.
- W. Chouyyok, C. L. Warner, K. E. Mackie, M. G. Warner, G. A. Gill and R. Shane Addleman, Nanostructured metal oxide sorbents for the collection and recovery of uranium from seawater, Ind. Eng. Chem. Res., 2016, 55, 4195–4207 CrossRef CAS.
- E. Calì, J. Qi, O. Preedy, S. Chen, D. Boldrin, W. R. Branford, L. Vandeperre and M. P. Ryan, Functionalised magnetic nanoparticles for uranium adsorption with ultra-high capacity and selectivity, J. Mater. Chem. A, 2018, 6, 3063–3073 RSC.
- P. Singhal, S. K. Jha, S. P. Pandey and S. Neogy, Rapid extraction of uranium from sea water using Fe3O4 and humic acid coated Fe3O4 nanoparticles, J. Hazard. Mater., 2017, 335, 152–161 CrossRef CAS PubMed.
- M. J. O’Hara, J. C. Carter, C. L. Warner, M. G. Warner and R. Shane Addleman, Magnetic iron oxide and manganese-doped iron oxide nanoparticles for the collection of alpha-emitting radionuclides from aqueous solutions, RSC Adv., 2016, 6, 105239 RSC.
- L. Tan, X. Zhang, Q. Liu, X. Jing, J. Liu, D. Song, S. Hu, L. Liu and J. Wang, Synthesis of Fe3O4@TiO2 core–shell magnetic composites for highly efficient sorption of uranium (VI), Colloids Surf., A, 2015, 469, 279–280 CrossRef CAS.
- J. Veliscek-Carolan, K. A. Jolliffe and T. L. Hanley, Selective sorption of actinides by titania nanoparticles covalently functionalized with simple organic ligands, ACS Appl. Mater. Interfaces, 2013, 5, 11984–11994 CrossRef CAS PubMed.
- M. Chee Kimling, N. Scales, T. L. Hanley and R. A. Caruso, Uranyl-sorption properties of amorphous and crystalline TiO2/ZrO2 millimeter-sized hierarchically porous beads, Environ. Sci. Technol., 2012, 46, 7913–7920 CrossRef CAS PubMed.
- G. L. Drisko, M. Chee Kimling, N. Scales, A. Ide, E. Sizgek, R. A. Caruso and V. Luca, One-pot preparation and uranyl adsorption properties of hierarchically porous zirconium titanium oxide beads using phase separation processes to vary macropore morphology, Langmuir, 2010, 26, 17581–17588 CrossRef CAS PubMed.
- G. D. Sizgek, C. S. Griffith, E. Sizgek and V. Luca, Mesoporous zirconium titanium oxides. part 3. synthesis and adsorption properties of unfunctionalized and phosphonate-functionalized hierarchical polyacrylonitrile-F-127-templated beads, Langmuir, 2009, 25, 11874–11882 CrossRef CAS PubMed.
- Q. Yuan, Y. Liu, L.-L. Li, Z.-X. Li, C.-J. Fang, W.-T. Duan, X.-G. Li and C.-H. Yan, Highly ordered mesoporous titania–zirconia photocatalyst for applications in degradation of rhodamine-B and hydrogen evolution, Microporous Mesoporous Mater., 2009, 124, 169–178 CrossRef CAS.
- B. M. Reddy and A. Khan, Recent advances on TiO2-ZrO2 mixed oxides as catalysts and catalyst supports, Catal. Rev.: Sci. Eng., 2005, 47, 257–296 CrossRef CAS.
- S. Deng, Z. Li, J. Huang and G. Yu, Preparation, characterization and application of a Ce–Ti oxide adsorbent for enhanced removal of arsenate from water, J. Hazard. Mater., 2010, 179, 1014–1021 CrossRef CAS PubMed.
- V. Luca, W. K. Bertram, J. Widjaja, D. R. G. Mitchell, C. S. Griffith and E. Drabarek, Synthesis of mesoporous zirconium titanates using alkycarboxylate surfactants and their transformation to dense ceramics, Microporous Mesoporous Mater., 2007, 103, 123–133 CrossRef CAS.
- A. E. Ringwood, S. E. Kesson, N. G. Ware, W. Hibberson and A. Major, Immobilization of high-level nuclear-reactor wastes in synroc, Nature, 1979, 278, 219–223 CAS.
- CRC Handbook of Chemistry and Physics, ed. W. M. Haynes, CRC Press, Boca Raton, FL, USA, 92nd edn, 2011 Search PubMed.
- L. Kong, I. Karatchevtseva, T. Wei and N. Scales, Synthesis of hierarchical mesoporous Ln2Ti2O7 pyrochlores and uranyl adsorption properties, J. Mater. Sci. Technol., 2022, 113, 22–32 CrossRef.
- K. B. Helean, A. Navrotsky, G. R. Lumpkin, M. Colella, J. Lian, R. C. Ewing, B. Ebbinghaus and J. G. Catalano, Enthalpies of formation of U-, Th-, Ce-brannerite: Implications for plutonium immobilization, J. Nucl. Mater., 2003, 320, 231–244 CrossRef CAS.
- M. H. Donaldson, R. Stevens, B. E. Lang, J. Boerio-Goates, B. F. Woodfield, R. L. Putnam and A. Navrotsky, Heat capacities and absolute entropies of UTi2O6 and CeTi2O6, J. Therm. Anal. Calorim., 2005, 81, 617–625 CrossRef CAS.
- L. Kong, I. Karatchevtseva, H. Zhu, M. J. Qin and Z. Aly, Synthesis and microstructure characterization of tetragonal Zr1–xTixO2 (x = 0–1) solid solutions, J. Mater. Sci. Technol., 2019, 35, 1966–1976 CrossRef.
- R. C. Garvie, The occurrence of metastable tetragonal zirconia as a crystallite size effect, J. Phys. Chem., 1965, 69, 1238–1243 CrossRef CAS.
- S. Dey, J. W. Drazin, Y. Wang, J. A. Valdez, T. G. Holesinger, B. P. Uberuaga and R. H. R. Castro, Radiation tolerance of nanocrystalline ceramics: Insights from yttria stabilized zirconia, Sci. Rep., 2015, 5, 7746 CrossRef CAS PubMed.
- J. Wen, C. Sun, P. P. Dholabhai, Y. Xia, M. Tang, D. Chen, D. Y. Yang, Y. H. Li, B. P. Uberuaga and Y. Q. Wang, Temperature dependence of the radiation tolerance of nanocrystalline pyrochlores A2Ti2O7 (A = Gd, Ho and Lu), Acta Mater., 2016, 110, 175–184 CrossRef CAS.
- J. Zhang, J. Lian, A. F. Fuentes, F. Zhang, M. Lang, F. Lu and R. C. Ewing, Enhanced radiation resistance of nanocrystalline pyrochlore Gd2(Ti0.65Zr0.35)2O7, Appl. Phys. Lett., 2009, 94, 243110 CrossRef.
- J. Zhang, J. Lian, F. Zhang, J. Wang, A. F. Fuentes and R. C. Ewing, Intrinsic structural disorder and radiation response of nanocrystalline Gd2(Ti0.65Zr0.35)2O7 pyrochlore, J. Phys. Chem. C, 2010, 114, 11810–11815 CrossRef CAS.
- F. X. Zhang, M. Lang, Z. Liu and R. C. Ewing, Phase stability of some actinides with brannerite structure at high pressures, J. Solid State Chem., 2011, 184, 2834–2839 CrossRef CAS.
- J. Lian, L. M. Wang, G. R. Lumpkin and R. C. Ewing, Heavy ion irradiation effects of brannerite-type ceramics, Nucl. Instrum. Methods Phys. Res., Sect. B, 2002, 191, 565–570 CrossRef CAS.
- G. R. Lumpkin, K. L. Smith and M. G. Blackford, Heavy ion irradiation studies of columbite, brannerite, and pyrochlore structure types, J. Nucl. Mater., 2001, 289, 177–187 CrossRef CAS.
- E. J. Baran, C. I. Cabello and A. G. Nord, Raman spectra of some MIIV2O6 brannerite-type metavanadates, J. Raman Spectrosc., 1987, 18, 405–407 CrossRef CAS.
- K. U. Chan, A. Voskanyan and C. Y. V. Li, Method of producing a porous crystalline material with a highly uniform structure, US Pat., 2019/0062225 A1, 2019 Search PubMed.
- M. Thommes, K. Kaneko, A. V. Neimark, J. P. Olivier, F. Rodriguez-Reinoso, J. Rouquerol and K. S. W. Sing, Physisorption of gases, with special reference to the evaluation of surface area and pore size distribution (IUPAC technical report), Pure Appl. Chem., 2015, 87, 1051–1069 CrossRef CAS.
- C. Eun, Effect of surface curvature on diffusion-limited reactions on a curved surface, J. Chem. Phys., 2017, 147, 184112 CrossRef PubMed.
- J. V. Rocha, D. Barrera and K. Sapag, Improvement in the pore size distribution for ordered mesoporous materials with cylindrical and spherical pores using the Kelvin equation, Top. Catal., 2011, 54, 121–134 CrossRef.
- Y. S. Shin, M. C. Burleigh, S. Dai, C. E. Barnes and Z. L. Xue, Investigation of uranyl adsorption on mesoporous titanium-based sorbents, Radiochim. Acta, 1999, 84, 37–42 CrossRef CAS.
- S. Tsushima and A. Suzuki, Hydration numbers of pentavalent and hexavalent uranyl, neptunyl, and plutonyl, J. Mol. Struct. THEOCHEM, 2000, 529, 21–25 CrossRef CAS.
- H. Perron, J. Roques, C. Domain, R. Drot, E. Simoni and H. Catalette, Theoretical investigation of the uranyl ion sorption on the rutile TiO2(110) face, Inorg. Chem., 2008, 47, 10991–10997 CrossRef CAS PubMed.
- J. Vandenborre, R. Drot and E. Simoni, Interaction mechanisms between uranium(VI) and rutile titanium dioxide: From single crystal to powder, Inorg. Chem., 2007, 46, 1291–1296 CrossRef CAS PubMed.
- C. Lomenech, E. Simoni, R. Drot, J. J. Ehrhardt and J. Mielczarski, Sorption of uranium(VI) species on zircon: Structural investigation of the solid/solution interface, J. Colloid Interface Sci., 2003, 261, 221–232 CrossRef CAS PubMed.
- A. Kowal-Fouchard, R. Drot, E. Simoni and J. J. Ehrhardt, Use of spectroscopic techniques for uranium(VI)/montmorillonite interaction modeling, Environ. Sci. Technol., 2004, 38, 1399–1407 CrossRef CAS PubMed.
- M. Kosmulski, Isoelectric points and points of zero charge of metal (hydr)oxides: 50 years after Parks’ review, Adv. Colloid Interface Sci., 2016, 238, 1–61 CrossRef CAS PubMed.
Footnote |
| † Electronic supplementary information (ESI) available. See DOI: https://doi.org/10.1039/d3cp00528c |
| This journal is © the Owner Societies 2023 |