
 Open Access Article
 This Open Access Article is licensed under a
 Creative Commons Attribution 3.0 Unported Licence
Unique features of the structural phase transition in acetylene showing simultaneous characteristics of reconstructive, displacive and order–disorder
Jie
Peng
 b,
Sijie
Zhang
cb,
Keith
Refson
d and
Martin T
Dove
*aef
b,
Sijie
Zhang
cb,
Keith
Refson
d and
Martin T
Dove
*aef
aCollege of Computer Science, Sichuan University, Chengdu, Sichuan 610065, China. E-mail: martin.dove@icloud.com
bCollege of Physics, Sichuan University, Chengdu, Sichuan 610065, China
cGuizhou University of Engineering Science, Xueyan Road, Bijie, Guizhou 55170, China
dISIS Facility, Harwell Campus, Chilton, Didcot, OX11 0QX, UK
eSchool of Mechanical Engineering, Dongguan University of Technology, 1st Daxue Road, Songshan Lake, Dongguan, Guangdong 523000, China
fSchool of Physical and Chemical Sciences, Queen Mary University of London, Mile End Road, London, E1 4NS, UK. E-mail: martin.dove@qmul.ac.uk
First published on 17th March 2023
Abstract
We have studied the two phases of the molecular crystal acetylene, C2H2, using calculations of the lattice dynamics by Density Functional Theory methods. together with the use of classical molecular dynamics (MD) simulation methods. The two phases share the same simple face-centred cubic lattice arrangement of the molecular centres of mass, but with different molecular orientations. We show that the higher-temperature phase has lower phonon frequencies and hence higher entropy, giving thermodynamic stability at higher temperature. The calculated lattice dynamics of this phase show instabilities associated with phonons involving pure rotations of the molecules. The MD results show large amplitudes of librational motion in this phase. The MD simulations also showed a potential phase transition to a structure of tetragonal symmetry. The picture that emerges is that the phase transition in acetylene is a very rare example of one that encompasses elements of three types of transition: displacive, order–disorder and reconstructive.
1. Introduction: phase transitions in organic materials
Structural phase transitions are ubiquitous in molecular crystals. They include displacive, order–disorder, and reconstructive phase transitions. The set of displacive phase transitions includes some that preserve translational symmetry exactly – including some that are ferroelectric – and others in which the lattice periodicity changes. Order–disorder transitions include cases where highly-symmetric molecules are able to undergo three-dimensional rotations. The largest group of phase transitions, however, is where an organic molecule can exist in two or more distinctly different crystal structures, usually called polymorphs, and the phase transition is only accomplished through a reconstruction of the whole crystal structure rather than through the small symmetry-breaking changes in the positions or orientations of the molecules that characterise displacive (and orientational order–disorder) phase transitions. The existence of polymorphism has many practical important consequences, including in the design of drugs, where the polymorph of a drug molecule in the crystalline state may affect its efficacy drastically.Phase transitions in organic materials have been studied for many decades.† However, as recently as 2016 one of the leading scientists in this area, Jack Dunitz, reflected on how this field of research still has many open questions.2 Furthermore, new vibrancy has been given to the field through the introduction of new techniques, such as lattice dynamics based on methods using density functional theory,3,4 which have been the basis for more recent studies in this field.5–9
Whilst some phase transitions in organic materials involve relatively complex processes, such as charge transfer or conformational changes, there are many phase transitions that primarily involve changes in the arrangements of molecules within the periodic structure of the crystal. In this paper we discuss one of the simplest examples of this, namely of the molecular crystal of acetylene, C2H2.10–14 This has two crystalline phases; interesting both have similar positions of the molecular centres of mass within the unit cell, but with different orientations.14 The phase transition occurs at a temperature of 133 K,12 with melting occurring at 191 K.
The origin of such phase transitions, in broad terms, reflects the balance between relative energies and entropies. The low-temperature phase is that for which the configuration has the globally lowest potential energy. The high-temperature phase will have a slightly higher potential energy, but will have higher entropy to give a globally lowest free energy. The entropy comes from the lattice dynamics – phonons – in the system. Thus understanding the origin of the phase transition primarily involves understanding the origin of this balance.
We have chosen to study the phase transition in acetylene because the molecule has a small size and a simple rod structure. We have recently studied HCN as another example of a simple rod-shaped molecule.9 HCN undergoes a first-order displacive phase transition that only involves a shear strain distortion, which lowers the symmetry from tetragonal to orthorhombic.15,16 There are no accompanying molecular displacements or rotations. Thus this is a proper ferroelastic phase transition,17 with softening of a shear elastic constant that can be seen as a softening of the frequencies of the corresponding transverse acoustic modes at small wave vectors.18,19 The case of acetylene – details given below – is not, at first sight, that of a displacive phase transition, even though the molecular centres of mass have identical arrangements. These contrasting facts makes the case of acetylene particularly interesting. The results from our study will show that the characteristics of the phase transition are more complex than that of a standard reconstructive phase transition.
In this paper we use a combination of density function theory (DFT) lattice dynamics methods, with semi-empirical corrections for the dispersion energy, and molecular dynamics (MD) methods with classical force fields to study the phase transition in acetylene. In the next section we give more details about the phase transition in acetylene. The methods we used are then described in Section 3. We present the results in two sections. The first, Section 4, presents the analysis of the DFT calculations of structure and lattice dynamics, using two different implementations of semi-empirical dispersion corrections. The lattice dynamics calculations suggest possible instabilities of the cubic phase, and identify a high entropy of the cubic phase that provides the thermodynamic stability of this phase at high temperature. The nature of the phonon instability raised the question of the possible existence of orientational disorder, and thus in the second results section, Section 5, we discuss insights into rotational motions provided by the MD simulations. The MD simulations also give a suggestion of a potential third phase, which we explore in further detail. Finally in Section 6 we discuss the insights presented by these calculations.
2. Background information
Below its melting temperature of 191 K, acetylene exists in two crystal structures,14 one of cubic symmetry (space group Pa![[3 with combining macron]](https://www.rsc.org/images/entities/char_0033_0304.gif) ) at higher temperatures, and one of orthorhombic symmetry (space group Cmce‡) at lower temperatures. The phase transition occurs at around 133 K. The two crystal structures have an identical face-centred cubic arrangement of the molecule centres, but with different orientations of the molecules.
) at higher temperatures, and one of orthorhombic symmetry (space group Cmce‡) at lower temperatures. The phase transition occurs at around 133 K. The two crystal structures have an identical face-centred cubic arrangement of the molecule centres, but with different orientations of the molecules.
In the low-temperature orthorhombic phase, shown in Fig. 1a, the molecules are arranged in a two-dimensional herringbone structure within the (1,0,0) planes with molecules pointing in directions within 5° of the [0,1,±1] directions. In this arrangement much of the symmetry of the parent face-centred cubic phase is broken, although the conventional unit cell of the parent phase remains the unit cell of the orthorhombic structure. The b and c lattice parameters are very close in value (3% difference), with a larger relative contraction of a by nearly 10%.
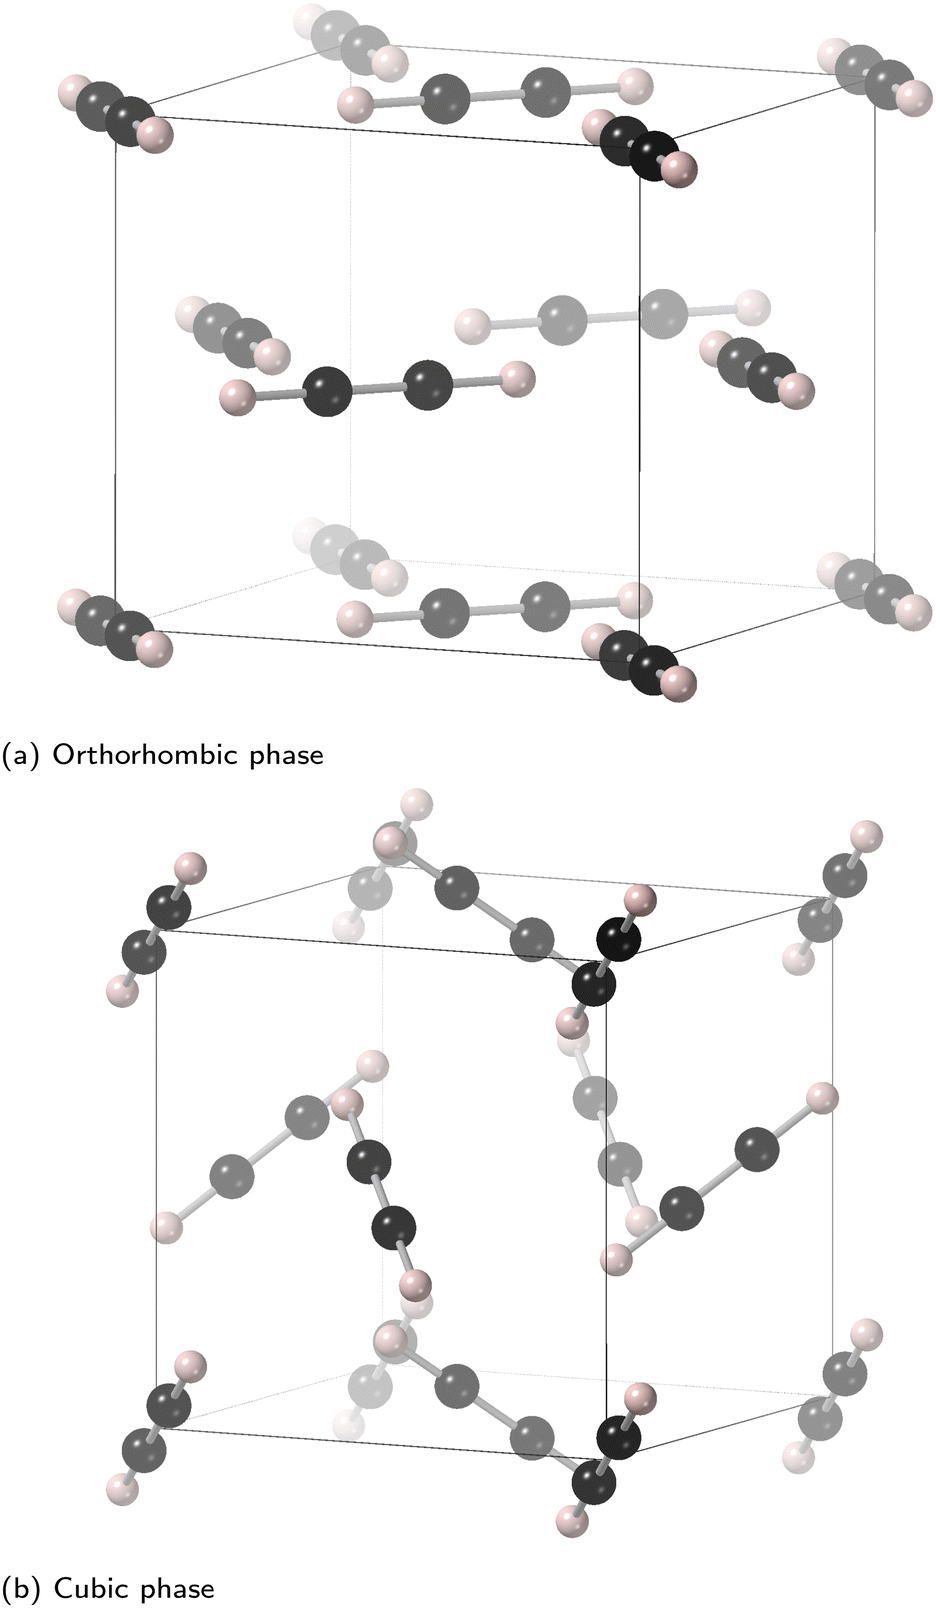 | ||
| Fig. 1 Crystal structures of the (a) orthorhombic (Cmce) and (b) cubic (Pa) phases of acetylene. In the orthorhombic phase (a) the vertical axis is [100] and the molecules are aligned close to the 〈011〉 axes within the (011) planes, whereas in the cubic phase (b) the molecules are aligned along the 〈111〉 axes. | ||
The crystal structure of the high-temperature cubic phase is shown in Fig. 1b. In this phase the molecules are oriented along all four of the 〈1,1,1〉 directions of the parent face-centred cubic phase, and the value of the lattice parameter is close to the average of the b and c lattice parameters of the orthorhombic phase. The fact that all four molecules have different directions for their orientations means that the conventional unit cell of the parent face-centred cubic phase becomes the primitive unit cell of the cubic phase.
The phase transition between the two phases of acetylene is accomplished by reorientations of the molecules with no displacements, together with the lattice tensile strains. The actual reorientations are simply a rotation of around 35° from, for example, the [1,1,1] to [1,1,0] directions. The values of the three lattice strains of the orthorhombic lattice compared to the cubic lattice are ε1 = −85 × 10−3, ε2= −12 × 10−3 and ε3 = + 17 × 10−3, giving an overall volume strain of εV = −80 × 10−3. The origin of ε1 comes from the fact that the molecules lie within the (100) planes, with the closest contacts lying between molecules within these planes rather than between planes. Thus the distance between planes is favourably reduced to bring molecules in neighbouring planes closer together. There is a small shear strain within the (1,0,0) planes to balance the intra-planar inter-molecular distances, but this effect is much smaller than the reduction of the distance between neighbour planes. Thus the orthorhombic phase has a more compact structure than the cubic one, implying that the molecules are more tightly packed together. This will give rise to a larger long-range cohesion energy from the dispersion forces, which scales with the density.
Of relevance to this study is the fact that the prior crystal structure analysis using neutron diffraction showed evidence for librational molecular motions of large amplitudes in the cubic phase.14 In fact there had been previous suggestions of orientational disorder, but deuterium NMR measurements had shown this to be unlikely.13
The lattice dynamics of the two phases of acetylene have previously been studied using force-field methods.20 The parameters of the model were tuned to ensure that the lattice dynamics of both phases were stable, which is an interesting point given the findings of the ab initio lattice dynamics discussed in this paper. In this sense, the ease of forming unstable dynamics in force-field models anticipated the key findings of this paper.
3. Methods
3.1 Density functional theory calculations
The DFT calculations were carried out using the CASTEP software,21 version 20.1. This method uses plane wave basis sets to represent the valence electrons, together with the pseudopotential method to represent the core electrons. Calculations were performed using the generalised gradient approximation (GGA) as formulated by Perdew, Burke and Ernzerhof (PBE).22 A cut-off energy of 900 eV was used for the plane wave basis set, together with a 5 × 5 × 5 Monkhorst-Pack grid23 for evaluation of electronic integrals. These quantities were chosen based on convergence tests of energy differences. Geometry optimisation was assessed based on convergence of the total energy to 10−10 eV per atom, and residual forces on atoms to 10−4 eV Å−1.The primary cohesion energy in molecular crystals is the dispersion energy, with only a weak contribution from electrostatic quadrupole–quadrupole (1/r5) interactions. We use two semi-empirical-dispersion correction (SEDC) functionals within CASTEP to calculate the contribution of the dispersion energy to the total energy, namely the schemes of Grimme,24 denoted here as G06, and of Tkatchenko and Scheffler,25 denoted here as TS09. These were chosen because both these functionals have been implemented within CASTEP with the density functional perturbation theory for the calculation of lattice vibrations, as we next discuss.
The lattice dynamics mode frequencies and associated mode eigenvectors were calculated by diagonalisation of the dynamical matrix formed using linear-response density functional perturbation theory (DFPT).3,4 The force constant matrix was calculated for a grid of wave vectors of size 5 × 5 × 5 within the Brillouin zone, and this was interpolated to form the dynamical matrix for all selected wave vectors. In the DFPT calculations a convergence tolerance for force constants of 10−5 eV Å−2 was used. The phonon acoustic sum rule was enforced.
In order to test the robustness of the approach, we have also calculated the crystal structures and phonon dispersion curves for the crystal structures of two other rod-shaped molecules, carbon suboxide (OC3O) and cyanogen (NCCN). Results are reported in the Appendix. It is sufficient to note here that the calculations reproduce the crystal structures of both phases, and more importantly give stable phonon frequencies for both structures. This gives us confidence that the instabilities in some of the phonon frequencies of the cubic phase of acetylene discussed below give a true indicator of dynamic instabilities in this phase.
3.2 Classical molecular dynamics methods
Molecular dynamic simulations were performed using the DL_POLY software,27 version 4.10.0. The MD simulations were performed for a configuration constructed as an 8 × 8 × 8 supercell of dimensions around 50 Å. Most simulations were run with constant stress28,29 and constant temperature30,31 ensembles, although the constant-volume and constant-energy simulations were used for some specific applications. The long-range Coulomb interactions were calculated using the particle-mesh Ewald method. The equations of motion were integrated using the leapfrog algorithm with a time step of 0.005 ps.The molecules interact through a sum of atom–atom pair interactions, combining a Coulomb interaction with the traditional Buckingham potential:
E(rij) = −Cijrij−6 + Aij![[thin space (1/6-em)]](https://www.rsc.org/images/entities/char_2009.gif) exp(−rij/ρij) exp(−rij/ρij) | (1) |
| Atom pair | A (eV) | ρ (Å) | C (eV Å6) |
|---|---|---|---|
| C–C | 1069.96 | 0.2778 | 14.87 |
| C–H | 374.98 | 0.2793 | 6.55 |
| H–H | 131.42 | 0.2809 | 2.89 |
The cut-off distance used for pair interactions was 20 Å. Each simulation was performed with an equilibration time of 20 ps followed by a run of 50 ps for detailed analysis. MD simulations for each phase were performed at 24 temperatures.
3.3 Caveats about accurate energies
One caveat to bear in mind is that the energy differences between different phases is relatively small, and come close to the inherent levels of accuracies of the methods being used. On one hand the DFT method itself contains approximations with regard to the exchange–correlation energies that add an implicit level of uncertainty, which is compounded by the approximations of using semi-empirical corrections for the dispersion energy. On the other hand, the approximations using a plane-wave basis set also creates some small errors. The basis set includes plane waves up to a certain energy, but how they are defined depends on the size and shape of the unit cell. Furthermore, the convergence in energy with respect to the cut-off energy is slow, and in practice the cut-off energy is chosen with respect to the energy differences. This will not affect the structure or lattice dynamics significantly. Indeed, these issues do not affect the overall energy significantly, but they will have an effect on very small energy differences. Whilst we make use of corrections to account for these effects, they will not compensate fully for these factors. As a result we do not seek to analyse the computed energy differences between different phases, although in general the energy differences, whilst small, are consistent with the experimental stability.Similarly, the transferable force fields also carry a level of uncertainty given that the models being used were developed from a database of crystal structures and not optimised specifically for the case of interest. They are also optimised based primarily on data (crystal structure) that reflect more closely the first derivatives of the energy, but without taking account of the energy directly.
These caveats should prevent over-interpretation of the simulation results, but given that interpretation is based on applying physical insights, they do not need to limit the strength of conclusions drawn here. In the tables of simulation results we report the optimised energies, but comparison between the energies of different structures are subject to these caveats. The one set of results for energies we will show, Fig. 4, involves variation of structure with a fixed unit cell, which means in this case the comparison of energies is free of the caveat regarding basis sets. There it is seen that the energy difference between the two structures, without relaxation of the orthorhombic phases, is as small as 15 meV molecule−1.
4. Results 1: DFT calculations of structure and dynamics
In this section we explore the atomic structures and lattice dynamics of both phases of acetylene, leading to a thermodynamic analysis of the phase transition.4.1 Crystal structures
The calculated crystal structures of the orthorhombic and cubic phases obtained for both SEDC functionals are reported in Table 2, and compared with the experimental data.14 We also report here the calculated energy per molecule, although direct comparison to the required level of accuracy is difficult in view of the caveats discussed in Section 3.3., and both atom types have fractional coordinates x = y = z. We also report the two bond lengths within the molecules
| Cmce | Experiment (15 K) | DFT G06 | DFT TS09 |
|---|---|---|---|
| a (Å) | 5.578(2) | 5.3038 | 5.5110 |
| b (Å) | 6.023(4) | 5.9003 | 5.9126 |
| c (Å) | 6.198(4) | 5.9988 | 6.1139 |
| C y | 0.0756(5) | 0.0775 | 0.0786 |
| C z | 0.0621(5) | 0.0659 | 0.0631 |
| H y | 0.2135(6) | 0.2151 | 0.2183 |
| H z | 0.1709(6) | 0.1832 | 0.1752 |
| C–C (Å) | 1.192 | 1.209 | 1.209 |
| C–H (Å) | 1.070 | 1.074 | 1.073 |
| Energy (eV molecule−1) | — | −352.8530 | −352.8736 |
|
Pa |
Experiment (131 K) | DFT G06 | DFT TS09 |
|---|---|---|---|
| a (Å) | 6.0940(8) | 5.7949 | 5.9881 |
| C x | 0.0562(2) | 0.0602 | 0.0582 |
| H x | 0.1524(6) | 0.1670 | 0.1615 |
| C–C (Å) | 1.186 | 1.209 | 1.208 |
| C–H (Å) | 1.017 | 1.072 | 1.071 |
| Energy (eV molecule−1) | — | −352.8415 | −352.8736 |
The first point of comparison is that of the bond lengths within the molecules. The C–C distance is nearly identical in both calculations, and is around 1.5% larger in the calculations compared to experiment at 15 K. This is consistent with normal errors using the GGA functional in DFT calculations. For the cubic phase, the experiment was performed at a temperature of 131 K, and the apparent shortening of bond lengths in the refinement of the crystal structure probably reflects the effects of librational motions. The calculated C–H bond lengths are also nearly identical using the two SEDC functions. They are in closer agreement with experimental data at 15 K than at 131 K, again reflecting the apparent shortening due to the effects of increased libration at higher temperature.
The second point of comparison is that the two calculations give smaller lattice parameters than experiment. The mean under-estimate of lattice parameters is 3.5% and 1.5% in the two cases. For comparison, the difference in lattice parameters in the cubic phase is 4.9% and 1.7% in the two cases, although this comparison will be affected by thermal expansion and the effects of librational motions.
The third point of comparison is that the results from the two DFT calculations reflect the effects of molecular orientation on the spontaneous strains reasonably well, giving lattice parameter values c > b > a. The difference between c and b is 0.175 Å in experiment, and calculated differences for the G06 and TS09 SEDC functionals are 0.099 and 0.201 Å respectively; the difference between b and a is 0.445 Å in experiment with corresponding values of 0.597 and 0.402 Å for the two SEDC functionals. Calculations with both functions reproduce the experimental trend that b − a > c − b, but the calculations with the TS09 functional are more accurate in this regards.
One conclusion pertinent for this study is that in this specific case of acetylene, both SEDC functionals over-bind the dispersion interaction, with the G06 functional doing so more. We will see next section that in the case of the G06 functions this has a significant effect on the low-frequency lattice dynamics.
4.2 Lattice dynamics calculations
The calculated phonon dispersion curves for the orthorhombic and cubic phases using both functionals, are shown in Fig. 2 and 3 respectively, displayed over the frequency range of the external modes. Full sets of calculated frequencies for both external and internal modes with zero wave vector for the orthorhombic and cubic phases are given in Tables 3 and 4 respectively. In these tables the calculated frequencies are compared with experimental results from Raman and infrared spectroscopy measurements.33–37 Broadly it can be seen that the external modes span the range of frequencies up to 250 cm−1 (7.5 THz), and the internal modes span the frequency range 650–3400 cm−1 (19.5–100 THz). We next discuss the results for the two phases separately.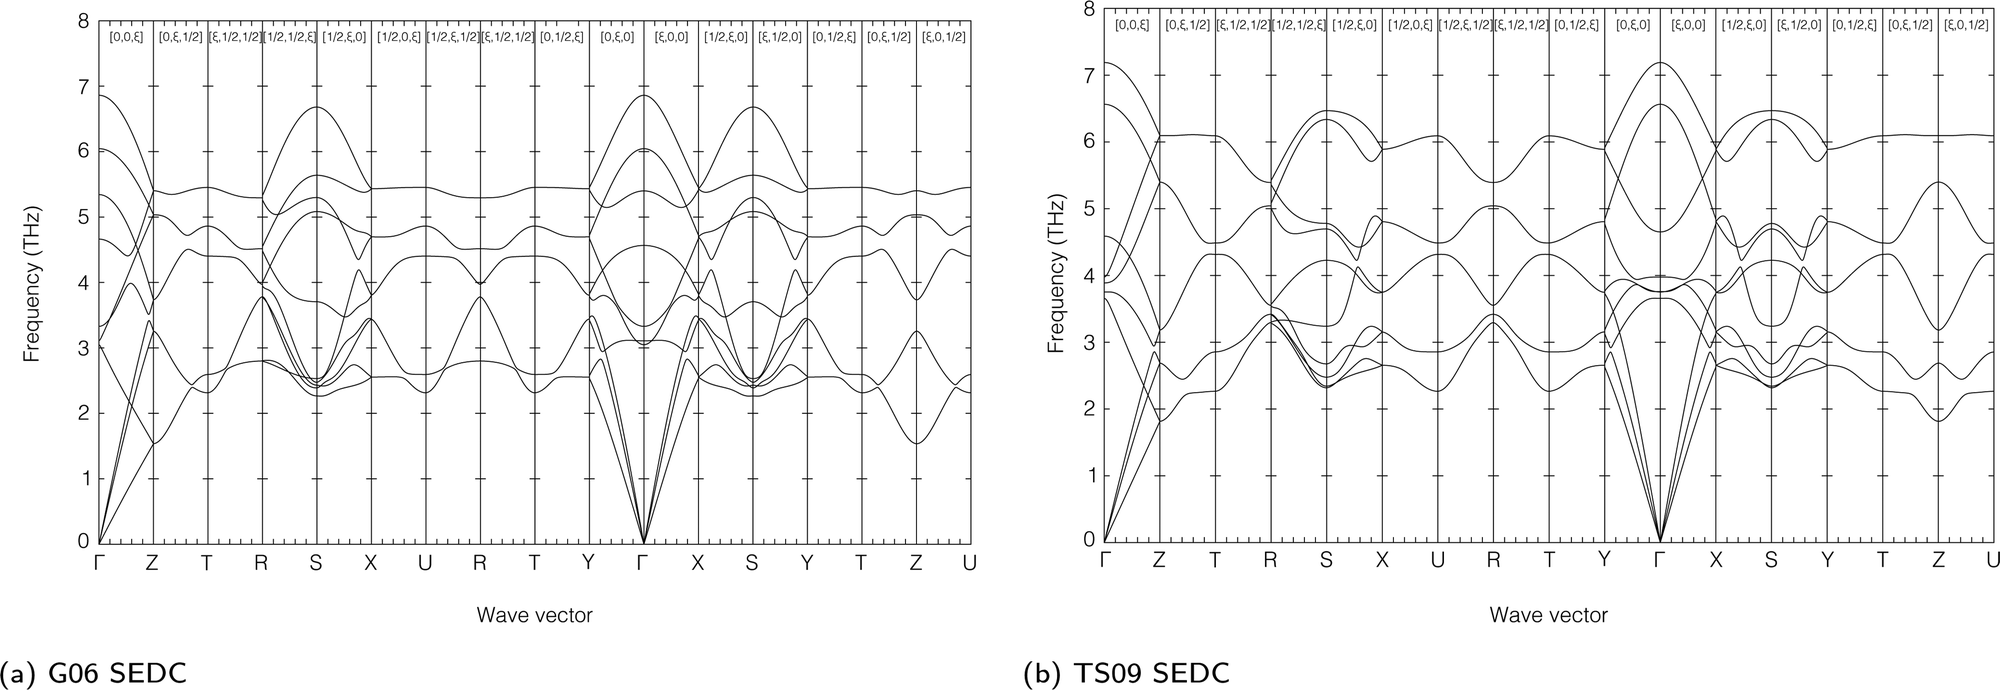 | ||
| Fig. 2 Dispersion curves of the external modes of the orthorhombic phase of acetylene using both the G06 (a) and TS09 (b) semi-empirical dispersion corrections. | ||
 | ||
| Fig. 3 Dispersion curves of the external modes of the cubic phase of acetylene using both the G06 (a) and TS09 (b) semi-empirical dispersion corrections. | ||
| G06 | TS09 | Experiment | |||
|---|---|---|---|---|---|
| cm−1 | THz | cm−1 | THz | cm−1 | |
| External modes | |||||
| Ag (R) | 111.1 | 3.3 | 125.2 | 3.8 | 88 |
| B1g (R) | 101.7 | 3.1 | 132.7 | 4.0 | 86 |
| B2g (R) | 201.6 | 6.1 | 239.8 | 7.2 | 175 |
| B3g (R) | 228.9 | 6.9 | 218.9 | 6.6 | — |
| Au | 103.7 | 3.1 | 122.0 | 3.7 | — |
| B1u (IR) | (152.3–155.5) | (4.6–4.7) | (125.4–129.7) | (3.8–3.9) | 106 |
| B2u (IR) | (178.2–182.3) | (5.4–5.5) | (153.1–156.6) | (4.6–4.7) | 127 |
| Internal modes | |||||
| 3Ag (R) | 648.0 | 19.5 | 644.5 | 19.4 | 638 |
| 1957.4 | 58.8 | 1964.0 | 59.0 | 1951 | |
| 3366.2 | 101.1 | 3372.1 | 101.3 | 3324 | |
| B1g (R) | 635.5 | 19.1 | 645.8 | 19.4 | 629 |
| B2g (R) | 675.0 | 20.3 | 691.2 | 20.8 | 657 |
| 3B3g (R) | 705.9 | 21.2 | 712.4 | 21.4 | — |
| 1976.0 | 59.3 | 1979.3 | 59.4 | 1961 | |
| 3374.9 | 101.3 | 3382.9 | 101.6 | 3315 | |
| Au | 792.8 | 23.8 | 813.6 | 24.4 | — |
| 2B1u (IR) | (803.5–811.3) | (24.1–24.3) | (809.7–812.8) | (24.3–24.4) | 760 |
| (3270.4–3282.1) | (98.0–98.4) | (3277.1–3286.9) | (98.2–98.5) | 3227 | |
| 2B2u (IR) | (784.4–791.15) | (23.5–23.7) | (787.8–798.6) | (23.6–24.0) | 769 |
| (3257.9–3259.3) | (97.67–97.71) | (3266.1–3266.9) | (97.92–97.94) | 3227 | |
| B3u (IR) | (761.6–779.0) | (22.9–23.4) | (774.0–785.0) | (23.2–23.57) | 748 |
| G06 | TS09 | Experiment | |||
|---|---|---|---|---|---|
| cm−1 | THz | cm−1 | THz | cm−1 | |
| External modes | |||||
| Eg (R) | −68.7 | −2.1 | −6.4 | −0.19 | 22 |
| 2Tg (R) | 62.1 | 1.9 | 83.4 | 2.5 | 33 |
| 166.5 | 5.0 | 169.2 | 5.1 | 67 | |
| Au | 103.9 | 3.1 | 94.9 | 2.8 | — |
| Eu | 110.5 | 3.3 | 108.1 | 3.2 | — |
| 2Tu (IR) | (79.8, 80.0) | (2.4, 2.4) | (84.4, 84.7) | (2.5, 2.5)) | 65 |
| (140.3, 141.0) | (4.2, 4.2) | (136.3, 136.9) | (4.1, 4.1) | 100 | |
| Internal modes | |||||
| 2Ag (R) | 1969.3 | 59.1 | 1976.2 | 59.3 | 1959 |
| 3393.5 | 101.9 | 3412.8 | 102.5 | 3330 | |
| Eg (R) | 611.5 | 18.4 | 612.7 | 18.4 | — |
| 4Tg (R) | 621.7 | 18.7 | 622.5 | 18.7 | — |
| 656.5 | 19.7 | 654.8 | 19.7 | — | |
| 1977.9 | 59.4 | 1984.1 | 59.6 | 1962 | |
| 3399.5 | 102.1 | 3417.8 | 102.6 | 3335 | |
| Au | 3295.8 | 99.0 | 3317.5 | 99.6 | — |
| Eu | 752.4 | 22.6 | 755.6 | 22.7 | — |
| 3Tu (IR) | (727.9, 747.8)) | (21.9, 22.5) | (730.7, 749.4), | (21.9, 22.5) | — |
| (756.4, 777.1) | (22.7, 23.3) | (759.3, 776.5) | (22.8, 23.3) | — | |
| (3294.4, 3302.1) | (98.9, 99.2) | (3315.4, 3321.8) | (99.6, 99.8) | — | |
The zone centre modes can be decomposed into the irreducible representations B1u + B2u + B3u (acoustic modes) and 4Ag + 2B1g+ 2B2g + 4B3g + 2Au + 3B1u + 3B2u + B3u (optic modes).38,39 The calculated frequencies of these zone-centre modes, together with a comparison with experimental measurements,33–37 are given in Table 4. Note that the frequencies of the B1u, B2u and B3u modes depend on the direction of the phonon wave vector q in the limit q → 0. The frequencies were calculated for a range of directions of q, and the resultant range of frequencies is given in Table 3.
In general there is very good agreement between the calculated and measured frequencies of the internal vibrations for both SEDC functionals; of course, this is the case where the choice of functional is unlikely to have much impact.
In the case of the external modes, the over-binding arising from the SEDC functionals referred to in analysis of the calculated structures above is seen in the over-estimation of some of the frequencies. For example, the Ag and B1g modes are clearly seen in spectroscopy measurements as a pair of frequency values of 88 and 86 cm−1 respectively,33–37 but the TS09 SEDC functional calculates one of the modes as high as 133 cm−1. This level of over-estimation of frequencies of external modes is found for the other three external modes for which there are experimental data.
The imaginary modes seen in the dispersion curves (Fig. 3) are centred around the double-degenerate Eg mode at zero wave vector. However, although both SEDC functionals show the instability in the same mode, they give different behaviour in the extent to which the imaginary mode generates softening across reciprocal space. It can be seen that for the G06 SEDC functional the unstable mode at zero wave vector also drags down one whole branch reaching to the the wave vector [0.5,0,0], whereas in the TS09 model the softening is more restricted to wave vectors close to the zone centre. In all other ways the phonon dispersion curves for the external modes are very similar for both SEDCs.
The existence of the imaginary mode clearly points to the potential existence of a phase transition, which will not be directly the phase transition to the orthorhombic phase because the two phases are not related to a simple displacive transformation – there is no group–subgroup relation, even though the two phases are based on the same face-centred cubic arrangement of lattice sites.
4.3 Analysis of the energy instability in the cubic phase
To gain some insight into the origin of the phonon instability in the cubic phase of acetylene, we evaluated the nature of the atomic displacements associated with the mode eigenvector computed using the CASTEP tool mode_follow. The mode generated one crystal structure with space group Pbca. The mode eigenvector has two components, which are best described with reference to the molecule that is aligned parallel to the [1,1,1] direction. The largest component is a rotation of the molecule about an axis parallel to the [1,![[1 with combining macron]](https://www.rsc.org/images/entities/char_0031_0304.gif) ,0] direction and passing through the molecule centre of mass; this is a rotation in the (1,,0) plane. The other component is a small additional rotation about the orthogonal [0,0,1] direction. Because the eigenvector is given in terms of infinitesimal atomic displacements, imposition of a strict set of finite atomic displacements exactly matching the mode eigenvector will lead to expansions of the bonds. In practice the stretching of bonds, although a second-order effect, dominates the calculated energy. Thus we generated a set of atomic configurations in which the molecules are rotated according to the major component of the eigenvector (rotation within the (1,,0) plane) with constant bond lengths, and neglecting the second component of the eigenvector. In fact when we consider finite rather than infinitesimal atomic displacements, it is impossible to know whether the relationship between the two components remains constant. Indeed, it is highly likely that it will not be, given that one end point – discussed below – will certainly have a zero value of this second component.
,0] direction and passing through the molecule centre of mass; this is a rotation in the (1,,0) plane. The other component is a small additional rotation about the orthogonal [0,0,1] direction. Because the eigenvector is given in terms of infinitesimal atomic displacements, imposition of a strict set of finite atomic displacements exactly matching the mode eigenvector will lead to expansions of the bonds. In practice the stretching of bonds, although a second-order effect, dominates the calculated energy. Thus we generated a set of atomic configurations in which the molecules are rotated according to the major component of the eigenvector (rotation within the (1,,0) plane) with constant bond lengths, and neglecting the second component of the eigenvector. In fact when we consider finite rather than infinitesimal atomic displacements, it is impossible to know whether the relationship between the two components remains constant. Indeed, it is highly likely that it will not be, given that one end point – discussed below – will certainly have a zero value of this second component.
The result of this calculation is shown in Fig. 4.§ Consistent with the phonon calculations, the arrangement in the cubic phase – zero angle – is seen as a maximum in the graph of energy as a function of rotation angle, and corresponds to a local saddle point in the multi-dimensional potential energy surface. The figure has two end cases. The global minimum of the potential energy function is found for the rotation angle of +35.3°. The crystal structure at this angle corresponds to the molecules lying in the (1,1,0) plane, and is identical to the arrangement of atoms in the low-temperature orthorhombic phase, Fig. 1a. The energy difference between the structures at 0° and + 35.3° is 15 meV molecule−1.
 | ||
| Fig. 4 Calculated potential energy of an initially-cubic phase of acetylene (energy per four molecules) in which for molecules are rotated about a perpendicular axis of the form 〈10〉 corresponding to the major part of the eigenvector of the imaginary phonon mode. The calculation was performed using the TS09 SEDC, using the crystal structure in space group Pbca. Zero value of rotation means that the system is in the ideal cubic phase with molecules parallel to the set of 〈111〉 directions, at an angle of 54.7° to the set of 〈001〉 axes. The angle value −54.7° corresponds to all molecules aligned along one of the cubic 〈001〉 directions. The angle value of 35.3° corresponds to all molecules lying perpendicular to the same 〈001〉 direction, and oriented along a set of 〈110〉 directions as in the low-temperature orthorhombic phase (Fig. 1a). | ||
The energy for a rotation angle of −54.7° has a large maximum value. The crystal structure in this case has all molecules parallel to the [0,0,1] axis, giving a crystal structure of space group symmetry I4/mmm, the centrosymmetric analogue of the crystal structure of HCN. Of course, this maximum will likely have a lower value if lattice relaxation had been allowed.
There is a second, shallower, minimum at a rotation angle of around −16°, reflecting the fact that the energy of the cubic phase is at a local maximum in the potential energy function and that the energy for rotation of −54.7° reaches another maximum in the potential energy.
We can understand the shape of the energy landscape represented in Fig. 4 in terms of the shortest intermolecular H–H distances. The variation of these distances with molecular rotation, together with some other distances that come into the same range of distances, is shown in Fig. 5. The configuration for 0° rotation, with the molecules aligned along the 〈1,1,1〉 directions, has 6 first and 6 second close neighbours, at distances of 3.15 and 3.70 Å. As the molecules rotate towards the corresponding 〈1,1,0〉 orientations (positive rotation in Fig. 4), the shortest distances both decrease and increase in value. The decreasing value is more significant, because it brings the distances closer to the minimum of the potential energy function. In terms of the Buckingham potential of eqn (1), the leading term at distances larger than the minimum, is the dispersion energy, varying as −r−6, and this varies faster as distances decrease rather than increase. The same shortening of near H–H distances is also seen as the molecules rotate towards the corresponding [001] direction (negative rotation in Fig. 4). Thus the potential energy landscape has a local maximum for molecular orientations along the 〈1,1,1〉 directions because the molecules would like to rotate slightly to form close H–H contact distances.
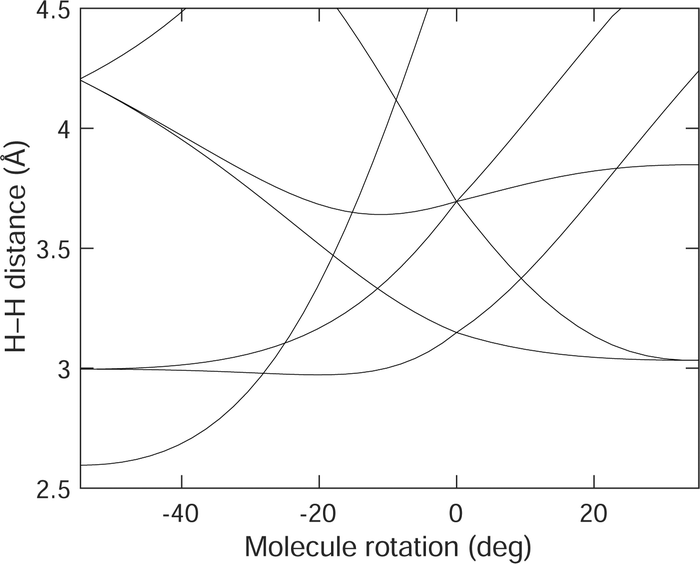 | ||
| Fig. 5 Variation of the shortest intermolecular H–H distances in acetylene with the molecular rotations shown in Fig. 4. | ||
From Fig. 5 it can be seen that the there are additional short contacts coming into range for positive rotations of the molecules towards the 〈1,1,0〉 orientations, and these distances remain lower than the shortest contact distances in the cubic phase. This is consistent with the potential energy in Fig. 4 falling to a minimum at the rotation of +35.3°. On the other hand, for negative rotations towards the [0,0,1] orientation, additional distances shorten to distances lower than the minimum of the H–H potential energy function, giving the rise to a maximum in the potential energy seen at a rotation angle of −54.7°.
This analysis has neglected the lattice strains that will accompany molecular rotations, and has also neglected the second rotation of the molecules within the mode eigenvector, but for small rotations from the ideal 〈1,1,1〉 orientations these factors are less important than the main rotation across the wider potential energy landscape. Thus from Fig. 5 we can draw the firm conclusion that the energy is a local maximum in the energy–rotation relationship (saddle point in the wider energy surface) because local H–H distances are also at maximum values. As a result we might expect to see some small degree of orientational disorder in the cubic phase as molecules rotate locally by a few degrees to reduce H–H contact distances and lower the potential energy locally. This may explain the larger atomic displacement parameters measured in diffraction experiments.14
From the phonon dispersion curves shown in Fig. 3 we can quantify this disorder further. It can clearly be achieved by a linear combination of normal modes, but which normal modes and to what extent? The phonon dispersion curves calculated using the TS09 SEDC, Fig. 3b, show that the instability mostly involves the Eg optic modes for wave vectors around q = 0. On the other hand, the phonon dispersion curves calculated using the G06 SEDC, Fig. 3a, give a softer instability that spans further into reciprocal space along all directions, but particularly involves the phonons with wave vectors along the set of 〈1,0,0〉 directions in reciprocal space. The phonon dispersion curves calculated with the TS09 SEDC show that the corresponding phonons along these directions are of lower frequency than along the other directions, reflecting the softer instabilities seen in the calculations with the G06 SEDC. Thus we conclude that the fluctuations associated with the local disorder that allow the formation of shorter H–H contact distances are constrained in reciprocal space.
In many ways this is reminiscent of the constrained fluctuations available to network silicates as explored with the Rigid Unit Mode mode,40,41 where phonon softening associated with whole-polyhedra motion is usually restricted to lines or planes of wave vectors in reciprocal space. Similar ideas were also explored for the case of HCN;9,42 in this case the phonon softening is restricted to lines of wave vectors in reciprocal space, which can be understood from the geometry of the crystal structure.42 Such restrictions in molecular crystals arise from the limited ways in which molecules can move without creating too close contact distances, effectively the ways in which they can mutually slide over their surfaces.
4.4 Phonon contributions to thermodynamic stability
The equilibrium phase or structure of a given material is that for which the free energy has the minimum value. In structural phase transitions, this arises from the balance between the potential energy and entropic contributions to the free energy: at low temperature the phase with lower energy is stable, and at higher temperatures the difference in potential energy is offset in the free energy by the term −TS, where T is the temperature and S is the entropy. Thus in a structural phase transition, the form of the free energy implies that the low-temperature phase has lower potential energy and the high-temperature phase has higher phonon entropy.The question we face concerns the origin of the excess entropy in the cubic phase of acetylene that gives rise to the phase transition. We have pointed out above that the molecules in the cubic phase sit on a potential energy maximum associated with locally longer H–H bonds than ideally so. This will result in lower phonon frequencies, and indeed inspection of the phonon dispersion curves in Fig. 2 and 3 shows that there is an enhancement of lower frequencies in the cubic phase. Some are associated with the apparent phonon instability around the Γ point, but there is an overall lowering of the phonon frequencies across the range of external modes. For example, in the orthorhombic phase we see bands of phonons with frequencies between 5–7 THz at the upper range of the external modes, but in the cubic phase this is lowered to the range 4–5 THz.
To examine the comparison of the phonon spectra in both phases of acetylene in more detail, we have calculated the phonon density of states in Fig. 6 using the TS09 SEDC functional. To avoid comparing phases where one has imaginary (unstable) frequencies, the calculations were performed at a pressure of −0.3 GPa in both phases. This negative pressure is sufficient to stabilise all phonons in the cubic phase. Several points emerge from the calculations shown in Fig. 6. First, and obviously, the range of frequencies for the external modes in the cubic phase is around 1 THz lower than in the orthorhombic phase, as we anticipated by comparing the dispersion curves. Second, the low-frequency Debye ω2 region of the density of states has larger value for the cubic phase, implying that the acoustic modes are also shifted to lower frequency. This implies a lower elastic stiffness of the cubic structure compared to the orthorhombic structure. Thirdly, we also see an enhancement in the lower-frequency part of the density of states beginning at around 1 THz and upwards. The differences in the phonon densities of states seen in Fig. 6 will lead to a difference in phonon free energies and entropy. These quantities (excluding the effects of zero point motion) are shown in Fig. 7. It is clear that the cubic phase has a significantly higher phonon entropy than the orthorhombic phase, and hence lower phonon free energy.
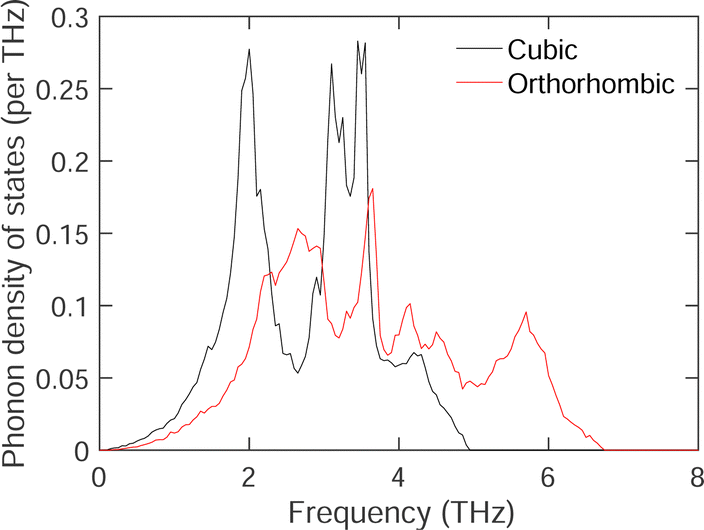 | ||
| Fig. 6 Calculated phonon densities of states of the cubic (black line) and orthorhombic (red line) phases for the external modes of acetylene, calculated using the TS09 SEDC functional at a pressure of −0.3 GPa. | ||
The phase transition occurs in experiment at 133 K.12 The calculations presented in Fig. 7 show that the differences in phonon free energy and entropy between the two phases of acetylene have values of 7.833 meV molecule−1 and 97.677 μeV molecule−1 K−1 respectively at 133 K. If we account for zero-point vibrations, the difference in the non-entropic part of the phonon free energy increases by a further 12.542 meV molecule−1. These values reflect the significant difference in the frequencies of the external modes between the two phases, with a significantly lowering of frequencies in the less-compact cubic phase.
 | ||
| Fig. 7 (a) Phonon free energies for the cubic (black line) and orthorhombic (red line) phases of acetylene calculated with the TS09 SEDC functional at a pressure of −0.3 GPa. (b) Phonon entropies for the cubic (black line) and orthorhombic (red line) phases of acetylene calculated with the TS09 SEDC functional at a pressure of −0.3 GPa. | ||
The detailed comparison of thermodynamics presented in Fig. 7 is, of course, dependent on the choice of negative pressure used to stabilise the lattice dynamics in the cubic phase. However, comparison of the dispersion curves of Fig. 3 at zero pressure and the density of states shown in Fig. 6 suggests that the effect of pressure mostly affects a small part of the density of states, and the larger shifts in the frequencies of the external modes are not too sensitive to the exact value of the negative pressure used to stabilise the cubic phase.
5 Results part 2: molecular dynamics simulations of cubic acetylene
The possibility of some degree of orientational disorder of the molecules within the cubic phase, as suggested by the calculation of some imaginary mode frequencies, motivated the simulation of this phase using classical molecular dynamics. The question is whether the cubic phase shows any degree of orientational order, as suggested in earlier publications,13,14 and which might be related to the lattice dynamics instabilities discussed in the previous section.In this section we explore the distributions of molecular orientations, and the collective dynamics through the calculation of the vibrational density of states. We also observe the formation of a third polymorph in the simulations.
5.1 Kinetic stability of the cubic phase
It was found that the simulated cubic phase remained stable down to very low temperature in the simulations, and had a melting temperature just below 120 K. The stability to low temperature is a kinetic effect given the relatively low temperature. Running simulations when starting with an atomic configuration with different orientations, such as the orthorhombic structure, did not yield a conversion to the cubic phase.Fig. 8 shows the thermal expansion of the cubic phase over the range of temperatures below the melting point. At higher temperatures the linear expansivity αa = a−1∂a/∂T ⋍ 1.9 × 10⁻⁴ K−1. This is a relatively large expansivity, but very similar to that of the crystal of HCN, which also is an arrangement of rod-like molecules.9
 | ||
| Fig. 8 Lattice parameter of cubic acetylene calculated from the molecular dynamics simulations. Data from simulation are shown as filled circles, and the curve is shown as a guide to the eye. | ||
5.2 Molecular orientations
Fig. 9a and b show the distribution of orientations of the acetylene molecules, defined in terms of the polar angles (θ,ϕ), where θ is the zenith angle subtended between the axial vector of the linear molecule and any of the lattice vectors, and ϕ is the azimuthal angle with respect to rotations about the same lattice vector. The two distributions shown in Fig. 9a and b are centred on angles![[small theta, Greek, macron]](https://www.rsc.org/images/entities/i_char_e0c9.gif) = 54.7° and
= 54.7° and ![[small phi, Greek, macron]](https://www.rsc.org/images/entities/i_char_e0d6.gif) = 45°. These values are consistent with the orientations lying along the set of 〈1,1,1〉 directions. The variances of both angles, shown in Fig. 9c and d, increase rapidly with temperature.
= 45°. These values are consistent with the orientations lying along the set of 〈1,1,1〉 directions. The variances of both angles, shown in Fig. 9c and d, increase rapidly with temperature.
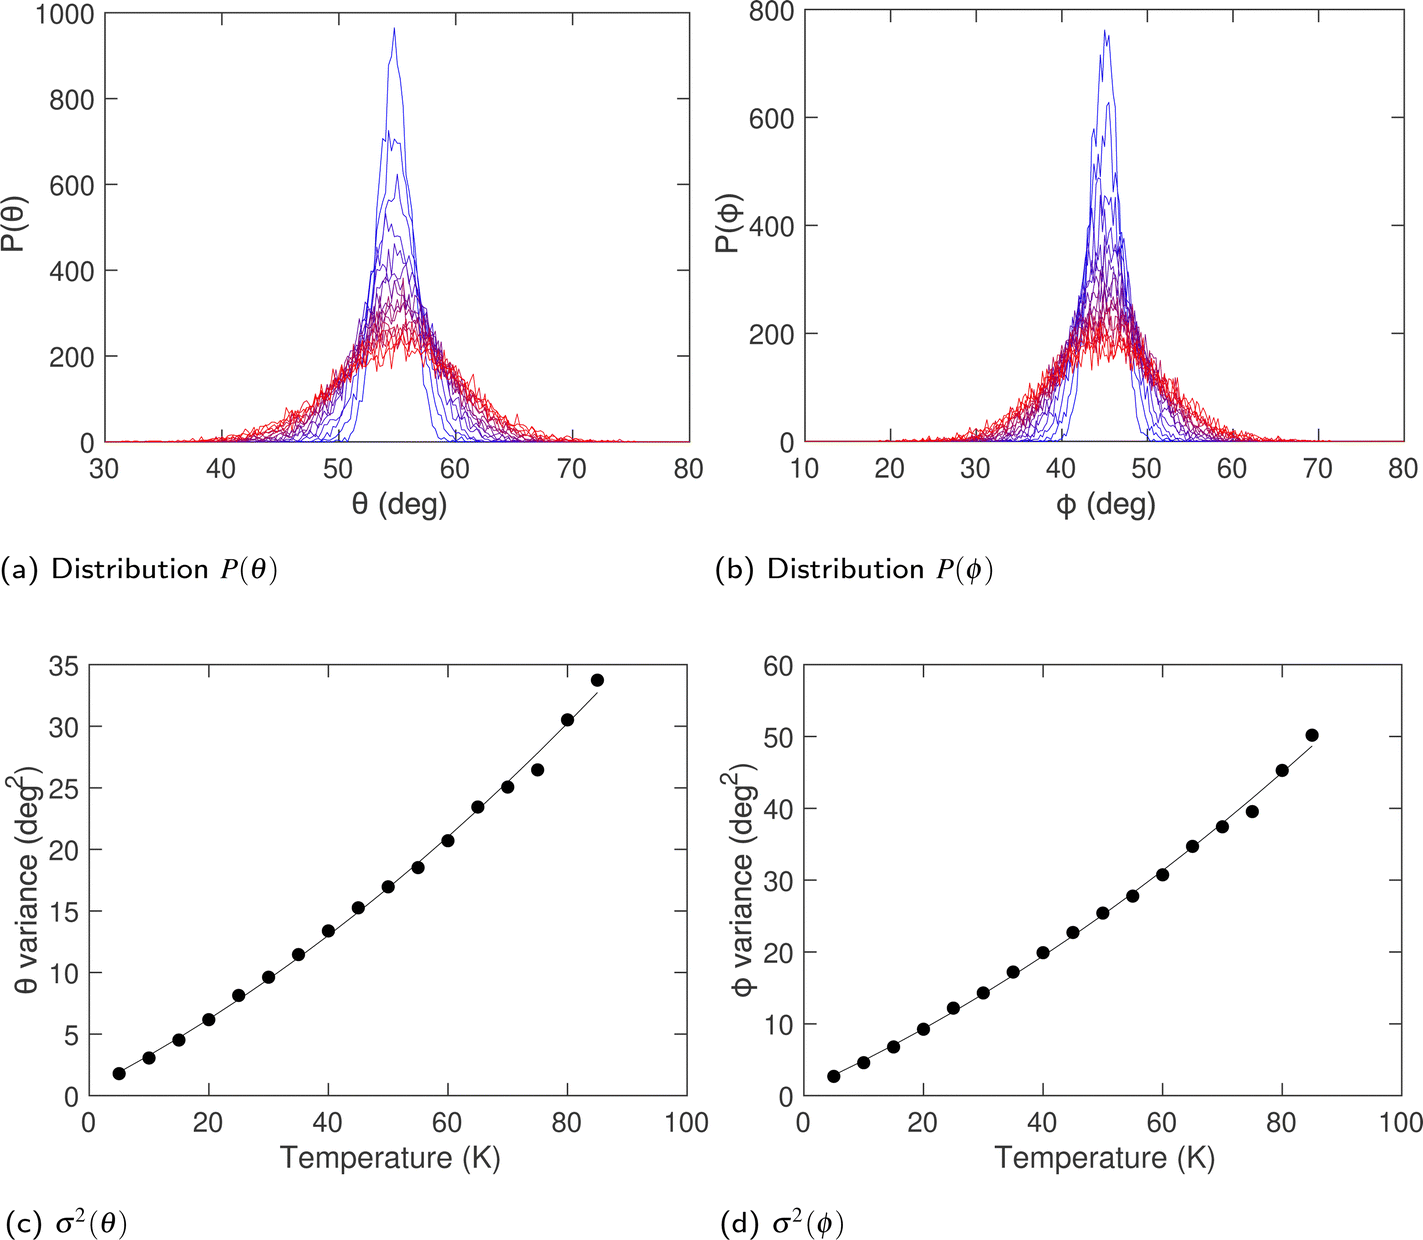 | ||
| Fig. 9 (a and b) Variation of the distributions of orientation angles of the acetylene molecules θ and ϕ respectively over a wide range of temperatures. Variation in temperature is indicated by the colour change from pure blue (cold) to pure red (hot) (c and d) corresponding variances of the angular distributions. Curves are guides to the eye. | ||
To link the rotations to structure, we show, in Fig. 10, the pair distribution function (PDF) g(r) for H–H distances. Recall that the definition of g(r) is such that the number of atoms surrounding a central atom at distance r and lying within a spherical shell of thickness dr is equal to 4πr2ρg(r)dr, where ρ is the number density. The H–H PDF from the MD simulations of acetylene at 100 K is shown in Fig. 10. Recall from the previous section that we might expect to see two short distances that differ by 0.5 Å. What we see from Fig. 10 is that the spread of H–H distances exceeds this difference in distances.
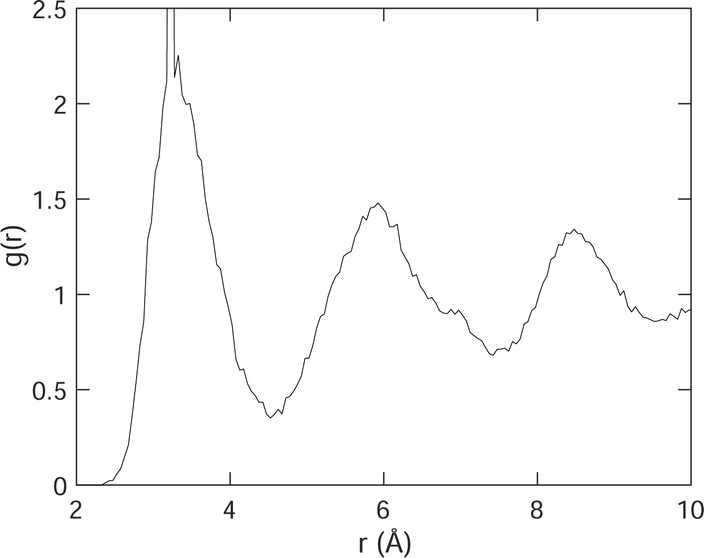 | ||
| Fig. 10 H–H pair distribution function g(r). The very sharp peak at 3.25 Å, whose height extends above the range of the axis in this plot, corresponds to the intramolecular H–H distance, which was not allowed to vary in the simulation. | ||
Whilst the distribution functions show an increasing degree of librational amplitude on heating towards the phase transition, there is no indication of larger-scale orientational disorder within these data. Thus we now consider the dynamics explicitly as librations rather than as rotations.
5.3 Dynamics from the velocity autocorrelation function
The dynamics of the cubic phase have been studied through calculations of the velocity autocorrelation functions (VACFs), defined as | (2) |
The VACFs for the molecular centre of mass, carbon atoms and hydrogen atoms are shown in Fig. 11a–c respectively. The key point to note from the data is that there is little variation with temperature in terms of the overall structure of the VACFs in all three cases, but that increased temperature leads to higher damping at larger times.
 | ||
| Fig. 11 (a–c) Velocity correlation functions for centre of mass, carbon and hydrogen atoms respectively, shown at four temperatures. (d–f) Corresponding power spectra. | ||
The power spectra obtained by Fourier transform of the VACFs are shown in Fig. 11d–f respectively. Within the harmonic approximation, the power spectrum is proportional to the phonon density of states. Comparison of the three power spectra shows us that the distribution of frequencies in the range 0–4 THz, with peaks at 1.2 THz and 1.6 THz, are from whole-molecule translation modes. This means that the distributions from 2.5–6 THz, with peaks at 3.2 THz and 4 THz, are from librational modes. This is consistent with the fact that the power spectra for hydrogen has the same features for the carbon atoms with an enhanced contribution from the librational modes, as expected given the positions of the two types of atoms within the acetylene molecules.
The power spectra do not vary significantly with temperature, with the overall structure of the three power spectra remaining largely unchanged. The only effect of temperature is to broaden the features in the power spectra, which is due to the anharmonic interactions, and which is reflected in the damping observed in the VACFs as mentioned above.
The power spectra obtained from the MD simulations can be compared with the overall phonon density of states from the DFT calculations as shown in Fig. 6. The two peaks in the density of states, corresponding to the bands of translational and librational motions, are reproduced over similar ranges of frequencies in both the DFT and MD densities of states.
The most important result from Fig. 11d–f is that the power spectra in the limit of low frequency appears to resemble the standard Debye form, namely ∝ω2, without a significant non-zero value at zero frequency. This suggests the absence of large-scale rotational diffusion, which would give a power spectrum with a non-zero value at zero frequency. This is consistent with our conclusion that the orientational disorder in the cubic phase of acetylene arises only from a small group of normal modes of low frequency centred around zero wave vector and along a set of symmetrically equivalent lines in reciprocal space. The volume of reciprocal space occupied by these modes is so small that they are not clearly evident in the densities of states.
5.4 Potential tetragonal phase
At one stage during the simulations, when starting from the lower-symmetry orthorhombic phase, the structure transformed to give a new phase of tetragonal symmetry. The structure of the new phase is shown in Fig. 12. It retains the same arrangement of the centres of mass of the molecules as that of the orthorhombic and cubic phases, but with different molecular orientations. By comparing the crystal structure of the new tetragonal phase, Fig. 12, with that of the orthorhombic phase shown in Fig. 1a it can be seen that the tetragonal phase has the same planar-type of arrangement, but with molecules in the tetragonal phase rotated by ±45° compared to the orientations in the orthorhombic phase. That is, in the orthorhombic phase the molecules lie along the cubic 〈0,1,1〉 directions parallel to the (1,0,0) plane, with nearest neighbours in the plane rotated by 90°, but in the tetragonal phase the molecules lie along the cubic 〈1,1,0〉 directions, again parallel to the (0,0,1) plane, with all molecules in the same plane having identical orientation. The tetragonal symmetry is reflected in the fact that the molecules in alternate (0,0,1) layers are rotated by 90°. | ||
| Fig. 12 Crystal structure of the tetragonal phase (space group P42/mnm) as generated by the MD simulations and relaxed by CASTEP (TS09 SEDC). The [001] axis is the vertical in this perspective. | ||
The structure of the tetragonal phase has space group P42/mnm, as deduced using the FINDSYM software package.43,44 Details of the crystal structure as optimised using the same DFT methods as before are given in Table 5.
| DFT G06 | DFT TS09 | |
|---|---|---|
| a (Å) | 5.0365 | 4.4918 |
| c (Å) | 3.9882 | 5.2221 |
| C x | 0.0849 | 0.0951 |
| H x | 0.2356 | 0.2635 |
| C–C (Å) | 1.209 | 1.208 |
| C–H (Å) | 1.074 | 1.070 |
| Energy (eV molecule−1) | −352.8503 | −352.8511 |
There is a striking point about the lattice parameters reported in Table 5, namely that the G06 model predicts a much flatter tetragonal cell than the TS09 model. The H–H distances between molecules along the axial direction within the same (0,0,1) plane are 3.347 Å for the TS model, and 3.356 Å for G06 model, suggesting that the G06 model creates a harder H–H contact potential. This clearly leads to relative expansion of the a lattice parameter, as seen in Table 5. This then leads to a contraction along c in order to bring molecules in neighbouring planes into closer contact.
The lattice dynamics for the external modes of this new phase calculated using the same DFT methods discussed in Section 4 are shown in Fig. 13. It can be seen that the two SEDC functions give similar results. Both show an instability at the A point, wave vector [1/2,1/2,1/2]. Both also show an instability associated with the line Γ–M, that is for wave vectors of the form [ξ,ξ,0]. For the G06 SEDC, the instability is part way along this line, whereas for the TS09 SEDC the instability is at the M point. Both SEDC functionals show complete stability at the Γ point.
 | ||
| Fig. 13 Dispersion curves of the external modes of the tetragonal phase of acetylene using both the G06 (a) and TS09 (b) semi-empirical dispersion corrections. | ||
We do not believe that this tetragonal phase is likely to have a stability region of its own in the full temperature-pressure phase diagram, but we have discussed it here to highlight the fact that there are additional phases with different molecular orientations with similar energies to those of the two observed phases. The point is that acetylene appears to have a rich energy landscape, with more potential low-energy phases showing different patterns of molecular orientations than observed. In this case, it has been seen in the MD simulations because energy differences are so small that slight ‘errors’ in the interatomic potentials can give the phase its own stability region.
6. Discussion and summary
The crystal structure of acetylene is particularly interesting because the molecule is small and linear (an iterative step from HCN), and because the crystal structure defined by the centres of mass of the molecules is particularly simple, namely the cubic closed packed structure. In this sense acetylene might have reminded us of other molecular crystals, such as methane45 and adamantane,46 which both have orientational order–disorder phase transitions with a high-temperature phase that have the cubic close-packed structure. Indeed, it had been suggested that acetylene might also have an orientationally disordered state in the high-temperature cubic phase.13Many phase transitions in organic crystals are between crystal structures that have little relationship to each other; these are known as reconstructive or polymorphic phase transitions. This is why materials such as acetylene are so interesting, because in this case the two phases are not dissimilar. However, there is not a simple displacive or order–disorder instability that links the two phases. Instead they are both different ordered structures when seen from the perspective of the parent phase of the cubic close-packed arrangement of molecules on a lattice without regard to their orientations. We do not suggest that there is an intrinsically orientationally-disordered phase, but the existence of the two experimental phases, and of a hypothetical tetragonal phase found in the MD simulations, shows that there are several possible ordered arrangement of orientations with similar energies.
Calculating an energy difference between two phases is at the limits of what can be achieved with DFT, or for that matter with a transferable force field, and the requirement to use a semi-empirical procedure to provide an estimate of the important dispersion energy also will affect the calculations of crystal structures and relative energies of different phases (recall the discussion in Section 3.3). Furthermore, the use of two SEDC functionals here show their limitations with regard to the calculations of the frequencies of the lower-energy external modes. Nevertheless, a consistent picture has emerged that enables us to understand the origin of the phase transition in acetylene in finer detail than the bare statement that the balance of the two terms in the free energy, lattice energy and that from phonon entropy, changes at the transition temperature. The following points are indicated from the study presented here:
1. The orthorhombic structure is more tightly packed than the cubic structure, ensuring that it has lower energy, both because the long-range dispersion energy varies as the density, and because on short length scales the atoms within neighbouring molecule can come closer to their equilibrium separations.
2. The cubic structure corresponds to a maximal point in the energy landscape, mostly because the closest hydrogen atoms are not as close to their equilibrium separation as can be achieved by lowering the symmetry and allowing rotations of the molecules.
3. In general the external modes, across the whole range, have lower frequencies in the cubic phase. In fact the difference in the phonon density of states (Fig. 6) is very striking; this is not a subtle effect. It gives rise to a significant difference in entropy between the two phases. This is the important factor in facilitating the phase transition.
4. The fact that the cubic structure corresponds to a saddle point in the energy landscape rather than a local minimum is reflected in one of the librational modes (symmetry Eg) having an imaginary frequency at zero wave vector. The rotational motions of this mode bring near-neighbour hydrogen atoms closer together, lowering the energy and hence leaving the ideal cubic structure as local maximum in the energy landscape.
5. The fact that small correlated rotations of the acetylene molecules may allow the cubic phase to be stabilised though enabling close H–H contacts to be made suggests the possibility of localised disorder in this phase. This has been confirmed by the MD results showing relatively large rotations of the molecules. On the other hand, the allowed fluctuations are constrained by the wave vectors of the appropriate normal modes rather than the molecules having complete freedom.
6. It is now clear that the low-temperature orthorhombic structure can be obtained from the cubic structure through rotations of the molecules from the orientational along the cubic 〈1,1,1〉 directions to the orientations along the corresponding cubic 〈1,1,0〉 directions. The symmetry of both the resultant space group and of the phonon eigenvector allows for a second rotation about the corresponding 〈0,0,1〉 axes. It appears that it may be that there is no barrier in the potential energy landscape against this reorientation, which we will now discuss.
The transition from the cubic structure of space group Pa to the orthorhombic structure of space group Cmce can proceed continuously through a structure of space group Pbca as the molecule rotates from one special orientation to another. It is interesting that this phase is never observed experimentally. Instead, it has no minimum in the energy landscape. Ordinarily we might expect the phase transition between the space groups Cmce to Pbca or Pa to Pbca to lead to the lower-symmetry structure being the stable phase at low temperature. However, this requires the lower symmetry phase to have lower energy than that of the Cmce structure, which appears not to be the case here. Generally phonon entropy tends to favour the higher-symmetry phase in the free energy, which is the case here with the Pa structure being stable at high temperature.
We next have the question of why the cubic phase is found to be stable at high temperature, given that the cubic phase is at an energy maximum in the potential energy landscape, and that superposition of the Eg mode is able to push the cubic structure towards the lower-energy orthorhombic stricture of space group Pbca initially and towards that of space group Cmce eventually. The likely explanation, consistent with our understanding of all displacive phase transitions, is that at high temperatures the unstable Eg modes are renormalised through quartic anharmonic interactions with the other phonons.47,48 This will create a minimum for the cubic structure in the overall free energy landscape. The energies required to stabilise the Eg modes are relatively light compared to many other cases. For example, in the major example of SrTiO3, much higher energies are required to stabilise the soft mode for the cubic phase, even though the transition temperatures are similar.¶
Whilst trying to make the discussion as clear as possible, it may appear that we are bringing in elements of three different types of phase transition. The cubic phase has a soft mode (the Eg mode) that is stabilised by anharmonic renormalisation as in any displacive phase transition. The high-temperature cubic phase has disorder as the molecules move locally together to reduce H–H contact distances in order to lower the local potential energy. And the transition from the cubic to orthorhombic phase involves a distinct rotation of all molecules by 35.26° to give a distinct change in symmetry rather than through symmetry-breaking distortions as in a standard displacive or order–disorder phase transition. This is consistent with a reconstructive phase transition, and the entropy change associated with the phonons gives the thermodynamic driving force for the phase transition.
This mixture of the characteristics of displacive phase transitions, order–disorder phase transitions and reconstructive phase transitions in acetylene is not a confusion; it represents the fact that this phase transition almost uniquely – at least to the authors' knowledge – contains elements of all three processes. The perovskite BaTiO3 is an analogue of a phase transition with characteristics of a displacive transition but which has a significant component of an order–disorder transition. In this case the Ti4+ cations show disordered displacements away from the centres of the TiO6 cations in order to reduce local Ti–O distances, analogous to the disorder we have identified in acetylene in which molecules rotate to reduce local H–H distances.
This new understanding of the phase transition in the relatively simple molecular crystal of acetylene brings us back to Jack Dunitz's recent argument2 that there remain many new things to be discovered in the field of phase transitions in molecular crystals. Whilst there may be a number of examples showing a mixture or two types of transition, the simultaneous occurrence of elements of displacive, order–disorder and reconstructive may be much rarer, but are worth looking for.||
Author contributions
Jie Peng: investigation, formal analysis, validation, writing (review & editing), visualisation. Sijie Zhang: resources, writing (review & editing), project administration, funding acquisition. Keith Refson: software, writing (review & editing). Martin T Dove: conceptualisation, methodology, software, validation, formal analysis, resources, writing (original draft; review & editing), visualisation, supervision, funding acquisition.Conflicts of interest
There are no conflicts to declare.Appendix
Calculations of carbon suboxide (OC3O) and cyanogen (NCCN)
In order to test that the methods described in this paper give reasonable results, we have performed calculations on the crystals of two other rod-shaped molecules, OC3O (carbon suboxide) and NCCN (cyanogen), using the TS09 functional for the dispersion energy.The calculated crystal structures of both materials are given in Tables 6 and 7 respectively, where they are compared with experimental data.50,51 In general lattice parameters in the calculation are over-estimated by around 3%, but the overall features of the experimental crystal structures are reproduced in the calculations.
| Calculated | Experiment | |
|---|---|---|
| a (Å) | 10.2129 | 9.8692 |
| b (Å) | 12.0708 | 12.0602 |
| c (Å) | 5.3365 | 5.1601 |
| C1 x | 0.8656 | 0.8623 |
| C1 z | 0.2971 | 0.3006 |
| C2 x | 0.7854 | 0.7836 |
| C2 z | 0.4862 | 0.4864 |
| C3 x | 0.7087 | 0.7080 |
| C3 z | 0.6784 | 0.6769 |
| C4 x | 0.5780 | 0.5767 |
| C4 y | 0.4968 | 0.4972 |
| C4 z | 0.1912 | 0.1887 |
| O1 x | 0.9390 | 0.9344 |
| O1 z | 0.1244 | 0.1295 |
| O2 x | 0.6391 | 0.6387 |
| O2 z | 0.8556 | 0.8520 |
| O3 x | 0.6488 | 0.6471 |
| O3 y | 0.4934 | 0.4944 |
| O3 z | 0.3668 | 0.3624 |
| O–C (Å) | 1.173 | 1.148 |
| C–C (Å) | 1.276 | 1.256 |
| C–C (Å) | 1.277 | 1.248 |
| O–C (Å) | 1.172 | 1.144 |
| Calculated | Experiment | |
|---|---|---|
| a (Å) | 6.2828 | 6.2013 |
| b (Å) | 6.4186 | 6.1509 |
| c (Å) | 7.2915 | 7.0652 |
| C x | 0.0309 | 0.0308 |
| C y | 0.9145 | 0.9080 |
| C z | 0.0498 | 0.0485 |
| N x | 0.0832 | 0.0835 |
| N y | 0.7689 | 0.7549 |
| N z | 0.1340 | 0.1300 |
| C–C (Å) | 1.373 | 1.377 |
| C–N (Å) | 1.165 | 1.151 |
The key point is that our calculated phonon dispersion curves (not reported in detail here) consistently give positive frequency-squared values across a wide range of directions of wave vectors. The full phonon densities of states for external modes of both phases are given in Fig. 14a and b. These results indicate that the calculations give stable crystal structures, in contrast with the unstable modes calculated here for the cubic phase (Fig. 3). This suggests that the methods used in this work can robustly give stable crystal structures for rod molecules when suggested by experiment, which gives us confidence to believe that the unstable phonons found for the cubic phase of acetylene reflect a genuine dynamic instability of the cubic phase if it could be cooled to low temperature.
 | ||
| Fig. 14 Calculated phonon density of states of (a) OC3O (carbon suboxide), and (b) NCCN (cyanogen). | ||
Acknowledgements
We acknowledge financial support from National Natural Science Foundation of China, grant numbers 61871451 (SZ) and 12174274 (MTD).Notes and references
- Faraday Discuss. Chem. Soc., 1980, 691–6 Search PubMed.
- J. D. Dunitz, Phys. Scr., 2016, 91, 112501 CrossRef.
- S. Baroni, S. de Gironcoli and A. D. Corso, Rev. Mod. Phys., 2001, 73, 515–562 CrossRef CAS.
- K. Refson, P. R. Tulip and S. J. Clark, Phys. Rev. B: Condens. Matter Mater. Phys., 2006, 73, R4954 CrossRef.
- Ł. Szeleszczuk, D. M. Pisklak and M. Zielińska-Pisklak, J. Comput. Chem., 2018, 39, 1300–1306 CrossRef PubMed.
- M. T. Ruggiero, J. Kölbel, Q. Li and J. A. Zeitler, Faraday Discuss., 2018, 211, 425–439 RSC.
- T. L. Prazyan, Y. N. Zhuravlev, O. V. Golovko and O. S. Obolonskaya, J. Mol. Struct., 2019, 1196, 271–279 CrossRef CAS.
- L. Tan, K. Refson and M. T. Dove, J. Phys.: Condens. Matter, 2019, 31, 255401 CrossRef CAS PubMed.
- J. Peng, S. Zhang, K. Refson and M. T. Dove, J. Phys.: Condens. Matter, 2022, 34, 095402 CrossRef CAS PubMed.
- Y. A. Schwartz, A. Ron and S. Kimel, J. Chem. Phys., 1969, 51, 1666–1667 CrossRef CAS.
- Y. A. Schwartz, A. Ron and S. Kimel, J. Chem. Phys., 1971, 54, 99–105 CrossRef CAS.
- S. Albert and J. A. Ripmeester, J. Chem. Phys., 1972, 57, 3953–3959 CrossRef CAS.
- C. E. Scheie, E. M. Peterson and D. E. O'Reilly, J. Chem. Phys., 1973, 59, 2758–2759 CrossRef CAS.
- R. K. McMullan, A. Kvick and P. Popelier, Acta Crystallogr., Sect. B: Struct. Sci., 1992, 48, 726–731 CrossRef.
- W. J. Dulmage and W. N. Lipscomb, Acta Crystallogr., 1951, 4, 330–334 CrossRef CAS.
- O. W. Dietrich, G. A. Mackenzie and G. S. Pawley, J. Phys. C-Solid State Phys., 1975, 8, L98–L102 CrossRef CAS.
- R. A. Cowley, Phys. Rev. B: Solid State, 1976, 13, 4877–4885 CrossRef CAS.
- A. I. M. Rae, J. Phys. C-Solid State Phys., 1972, 5, 3309–3321 CrossRef CAS.
- G. A. Mackenzie and G. S. Pawley, J. Phys. C-Solid State Phys., 1979, 12, 2717–2735 CrossRef CAS.
- Z. Gamba and H. Bonadeo, J. Chem. Phys., 1982, 76, 6215–6220 CrossRef CAS.
- S. J. Clark, M. D. Segall, C. J. Pickard, P. J. Hasnip, M. I. J. Probert, K. Refson and M. C. Payne, Z. Kristallogr., 2005, 220, 567–570 CAS.
- J. P. Perdew, K. Burke and M. Ernzerhof, Phys. Rev. Lett., 1996, 77, 3865–3868 CrossRef CAS PubMed.
- H. J. Monkhorst and J. D. Pack, Phys. Rev. B: Solid State, 1976, 13, 5188–5192 CrossRef.
- S. Grimme, J. Comput. Chem., 2006, 27, 1787–1799 CrossRef CAS PubMed.
- A. Tkatchenko and M. Scheffler, Phys. Rev. Lett., 2009, 102, 073005 CrossRef PubMed.
- D. E. Williams, J. Comput. Chem., 2001, 22, 1154–1166 CrossRef CAS.
- I. T. Todorov, W. Smith, K. Trachenko and M. T. Dove, J. Mater. Chem., 2006, 16, 1911–1918 RSC.
- M. Parrinello and A. Rahman, Phys. Rev. Lett., 1980, 45, 1196–1199 CrossRef CAS.
- S. Melchionna, G. Ciccotti and B. Lee Holian, Mol. Phys., 2006, 78, 533–544 CrossRef.
- S. Nosé, J. Chem. Phys., 1984, 81, 511–519 CrossRef.
- W. G. Hoover, Phys. Rev. A, 1985, 31, 1695–1697 CrossRef PubMed.
- R. Lindh and B. Liu, J. Chem. Phys., 1991, 94, 4356–4368 CrossRef CAS.
- M. Ito, T. Yokoyama and M. Suzuki, Spectrochim. Acta, Part A, 1970, 26, 695–705 CrossRef CAS.
- M. Marchi and R. Righini, Chem. Phys., 1985, 94, 465–473 CrossRef CAS.
- K. Aoki, Y. Kakudate, S. Usuba, M. Yoshida, K. Tanaka and S. Fujiwara, J. Chem. Phys., 1988, 88, 4565–4568 CrossRef CAS.
- O. S. Binbrek and A. Anderson, Phys. Status Solidi B, 1992, 173, 561–568 CrossRef CAS.
- R. Hudson, R. Ferrante and M. Moore, Icarus, 2014, 228, 276–287 CrossRef CAS.
- E. Kroumova, M. Aroyo, J. Perez-Mato, A. Kirov, C. Capillas, S. Ivantchev and H. Wondratschek, Phase Transitions, 2003, 76, 155–170 CrossRef CAS.
- H. T. Stokes, D. M. Hatch and B. J. Campbell, SMODES, ISOTROPY Software Suite, Accessed 11 November 2022, https://iso.byu.edu/iso/smodes.php.
- A. P. Giddy, M. T. Dove, G. S. Pawley and V. Heine, Acta Crystallogr., Sect. A: Found. Crystallogr., 1993, 49, 697–703 CrossRef.
- K. D. Hammonds, M. T. Dove, A. P. Giddy, V. Heine and B. Winkler, Am. Mineral., 1996, 81, 1057–1079 CAS.
- M. T. Dove, A. P. Giddy and V. Heine, Ferroelectrics, 1992, 136, 33–49 CrossRef CAS.
- H. Stokes and D. Hatch, J. Appl. Crystallogr., 2005, 38, 237–238 CrossRef CAS.
- H. T. Stokes, D. M. Hatch and B. J. Campbell, FINDSYM, ISOTROPY Software Suite, 2022, Accessed: 4 July 2022, https://iso.byu.edu.
- Y. Qin, S. Zhang, S. Zhang, M. G. Tucker, D. A. Keen, G. Cai, A. E. Phillips and M. T. Dove, J. Phys.: Condens. Matter, 2021, 34, 015401 CrossRef PubMed.
- E. O. R. Beake, M. G. Tucker, M. T. Dove and A. E. Phillips, Chem. Phys. Chem., 2017, 18, 459–464 CrossRef CAS PubMed.
- R. Blinc and B. Žekš, Soft Modes in Ferroelectrics and Antiferroelectrics, North Holland, American Elsevier, Amsterdam and Oxford, 1974 Search PubMed.
- M. T. Dove, Am. Mineral., 1997, 82, 213–244 CAS.
- L. Tan, V. Heine, G. Li and M. T. Dove, Rep. Prog. Phys., 2023 Search PubMed , manuscript accepted for publication.
- A. Ellern, T. Drews and K. Seppelt, Z. Anorg. Allg. Chem., 2001, 627, 73–76 CrossRef CAS.
- B. H. Torrie and B. M. Powell, J. Phys.: Condens. Matter, 1989, 1, 5827 CrossRef CAS.
Footnotes |
| † The corresponding author (MTD) attended a conference on the theme of phase transitions in molecular crystals as a young PhD student in 1980,1 where many of the different types of phase transitions in a wide range of organic and molecular crystals were discussed. |
| ‡ Note that in the earlier structure reports,14 the setting of the crystallographic axes (transformation by axis rotation about [0,1,0]) gave the space group Acam. This space group has a double glide plane, (0,0,1), in the setting of the C-centred lattice, and hence the space group name Cmce supersedes the former name Cmca. |
| § In Section 3.3 we discussed some caveats about the accuracy of calculating very small differences in energy between phases. In this case, because these calculations were performed with a constant volume, the issue of small changes in the basis set associated with changing size and shape of the unit cell does not apply. |
| ¶ This point is made explicit in a diagram in a new review article.49 |
| || It is worth reflecting on the fact that our discovery that the phase transition in acetylene has elements of displacive, order–disorder and reconstructive phase transitions has come from calculations of the lattice dynamics, supported by molecular dynamics simulations. Where lattice dynamics calculations are used, they are often only used for evaluation of thermodynamic functions. However, as we have demonstrated, they contain a wealth of information about mechanism of phase transitions, particularly when investigating instabilities across reciprocal space. |
| This journal is © the Owner Societies 2023 |