
 Open Access Article
 This Open Access Article is licensed under a
 Creative Commons Attribution 3.0 Unported Licence
Dynamics in the ordered and disordered phases of barocaloric adamantane†
Bernet E.
Meijer
a,
Richard J. C.
Dixey
a,
Franz
Demmel
b,
Robin
Perry
c,
Helen C.
Walker
*b and
Anthony E.
Phillips
 *a
*a
aSchool of Physical and Chemical Sciences, Queen Mary University of London, London E1 4NS, UK. E-mail: a.e.phillips@qmul.ac.uk
bISIS Neutron and Muon Source, Rutherford Appleton Laboratory, Didcot OX11 0QX, UK. E-mail: helen.c.walker@stfc.ac.uk
cDepartment of Physics and Astronomy, University College London, London WC1E 6BT, UK
First published on 1st February 2023
Abstract
High-entropy order–disorder phase transitions can be used for efficient and eco-friendly barocaloric solid-state cooling. Here the barocaloric effect is reported in an archetypal plastic crystal, adamantane. Adamantane has a colossal isothermally reversible entropy change of 106 J K−1 kg−1. Extremely low hysteresis means that this can be accessed at pressure differences less than 200 bar. Configurational entropy can only account for about 40% of the total entropy change; the remainder is due to vibrational effects. Using neutron spectroscopy and supercell lattice dynamics calculations, it is found that this vibrational entropy change is mainly caused by softening in the high-entropy phase of acoustic modes that correspond to molecular rotations. We attribute this difference in the dynamics to the contrast between an ‘interlocked’ state in the low-entropy phase and sphere-like behaviour in the high-entropy phase. Although adamantane is a simple van der Waals solid with near-spherical molecules, this approach can be leveraged for the design of more complex barocaloric molecular crystals. Moreover, this study shows that supercell lattice dynamics calculations can accurately map the effect of orientational disorder on the phonon spectrum, paving the way for studying the vibrational entropy, thermal conductivity, and other thermodynamic effects in more complex materials.
1 Introduction
With cooling and refrigeration accounting for over 25% of global energy consumption1 and 10% of emissions,2 it has become clear that innovation in this area is a key factor for reaching our climate goals. The emissions from prevalent vapour-compression technology are both direct and indirect: direct emissions come from the refrigerants, that are greenhouse gases commonly thousands of times more potent than CO2; indirect emissions originate from the electricity use, and unfortunately the efficiency of vapour-compression technology is plateauing.3 Improvements in sustainable cooling will therefore lie in alternative technologies. Currently, one of the most promising is solid-state cooling using caloric materials: these materials do not cause direct emissions and offer the potential of increased cooling efficiency.The functional behaviour of caloric materials relies on phase transitions with large entropy changes, induced by an external field. The group of barocalorics, which undergo a pressure-induced phase transition, is especially promising. These materials are abundant and cost-effective, and since they are pressure-driven, their deployment does not require a complicated refrigeration design. The remaining challenge in this field is to identify materials that can beat the efficiency of current vapour-compression technology, and that together give us a broad range of operating temperatures that is needed for widespread deployment.
The structure-space for barocalorics is vast, ranging from framework materials to shape memory alloys.4 A particularly promising group are the orientationally-disordered (or ‘plastic’) crystals, which have shown giant and colossal barocaloric effects,5–10 and it is hoped that this group might host many more efficient barocalorics. Since the efficiency is proportional to the entropy change over the phase transition, the search for these materials must be focused on entropy as a design principle. However, most studies only consider one type of entropy contribution11 and therefore fail to provide a complete picture of the entropy change. A first step towards finding the most efficient barocalorics is to unravel all contributions to the entropy, their importance in plastic crystals, and their corresponding molecular origins.
Here, we study the barocaloric effect and its microsopic origins in the plastic crystal adamantane. We chose this material for two reasons. First, adamantane is an archetypical example of a crystal that is both orientationally disordered and literally plastic, with a waxy consistency and high susceptibility to external stress. For these reasons, it seems highly likely to be a barocaloric; however, despite recent reports of barocaloric behaviour in adamantane derivatives,8 to our knowledge this has not previously been reported in adamantane itself. Second, adamantane's physical properties make it an ideal model system for plastic crystals: it has rigid, near-spherical molecules and its intermolecular interactions are dominated by van der Waals dispersion forces. This is both encouraging for generalising our results to the wider family of molecular barocaloric materials, and practically useful since its simplicity makes it a good test case for the analysis of vibrational entropy that we develop here.
In this work, we reveal adamantane's barocaloric effect through calorimetric measurements. The effect can be classed as ‘colossal’ (following barocaloric terminology4,8,10,12) and we predict it can be accessed with full reversibility under pressures as low as 200 bar. We show that more than half of adamantane's large entropy change can be attributed to vibrational effects, and therefore set out to uncover the microscopic mechanisms that give rise to the vibrational entropy change. We do this by performing supercell lattice dynamics calculations followed by band unfolding,13,14 here for the first time applied to an orientationally disordered supercell. The model is validated with single-crystal neutron spectroscopy and further supported by a quasielastic neutron scattering experiment under high pressure. In the high-temperature phase, the acoustic modes soften and are associated with rolling molecules, rather than translations. This behaviour can be attributed to the change from an interlocking structure at low temperatures to a spherical close-packed structure at high temperatures. The principal dynamical mechanism of this archetypical plastic crystal is thus revealed, which can be leveraged in future barocaloric design.
2 Methods
2.1 Sample preparation
The single crystal was grown using a slow cooling melt method. 1 g of powdered isotope-enriched adamantane (CDN Isotopes, 99.3%-d16‡) was sealed in a thin-walled, 1 cm diameter quartz tube under vacuum. The tube was heated to 300 °C in a conventional box furnace, then cooled at 2 °C per hour, through the melting point at 270 °C to 100 °C. The tube was then left at 100 °C for one month to anneal the crystal to improve grain size and crystallinity. The resultant crystal mass was around 0.95 g and confirmed to be a single grain by neutron diffraction.2. 2 Calorimetry
Calorimetry measurements, used for the determination of the barocaloric effects of adamantane, were performed on a Seteram MicroDSC7 EVO DSC with a microcalvet sensor. High pressure measurements were performed with a pair of hastelloy high pressure DSC cells, with the empty high pressure cell in the reference well to compensate for the heat capacity of the cell. A 47.3 mg sample of polycrystalline adamantane was sealed within a high pressure stainless steel hastelloy DSC cell, and cooled below the phase transition during temperature and pressure stabilisation. Quasi-direct barocaloric measurements were carried out between 225 to 240 K, under constant pressures between 925 and 1000 bar in 25 bar steps, using nitrogen as a hydrostatic pressure transmitting medium. A heating and cooling rate of 1 K min−1 was used for both the cooling and heating processes. The transition temperatures were determined from the maximum of each heat flow peak. This is for two reasons. First, at the maxima >50% of the material should be in the approached phase. Second, while in some fields the transition temperatures are determined from the onset temperature of the peaks, that methodology could in the case of materials with very small hysteresis result in an apparent negative hysteresis.Heat flow data after subtracting baseline background were used for calculation of the entropy changes. The phase transition temperature at ambient pressure is below the operating temperature range of this instrument: the lowest temperature we achieved was −50 °C and the recommended operating limit is −45 °C. Therefore, the phase transition was only detectable at pressures starting at 900 bar. Below 900 bar the heating curves have been extrapolated to lower temperatures using the high temperature data as a reference, and scaled to account for the increase in phase transition enthalpy at high temperatures. This ensured that the maximum isothermal entropy change is the same at all pressures. (In the measured high-pressure data, the maximum isothermal entropy change was indeed confirmed to be constant – see ESI† for further details.) Since entropy changes are likely to be suppressed by high pressure, we expect that this method slightly underestimates the entropy change at low pressures.
2.3 High-pressure neutron spectroscopy
![[thin space (1/6-em)]](https://www.rsc.org/images/entities/char_2009.gif) :1 mass ratio. In addition to the data collection at various pressures, and empty can measurement (for background subtraction) and low-temperature collection (to obtain experimental resolution) were performed in the same experimental setup. Data reduction and background subtraction was done in Mantid57 and further data analysis was done in python using our own code.59
:1 mass ratio. In addition to the data collection at various pressures, and empty can measurement (for background subtraction) and low-temperature collection (to obtain experimental resolution) were performed in the same experimental setup. Data reduction and background subtraction was done in Mantid57 and further data analysis was done in python using our own code.59
2.4 Calculation
Lattice dynamics calculations were performed using the General Utility Lattice Program (GULP).33 The model consists of intermolecular forces between nearest neighbours, which have been parameterised as a Buckingham potential (U(r) = Ae−r/ρ − C/r6) by Greig and Pawley.34 The parameter values are given in Table S3 (ESI†). The molecules itself are rigid, which is approximated in GULP by setting the harmonic intramolecular bend- and stretch force constants to a large value (k = 100 eV Å−2).The energy of the system was minimised using several algorithms as outlined in the ESI.† In the disordered high-temperature phase, none of the algorithms could find a global energy minimum. This led to the presence of imaginary modes after the dynamical matrix diagonalisation. Nevertheless, by sequential optimisation the imaginary frequencies were reduced to ∼580 modes in the supercell. This represents only 6.1% of all intermolecular modes in the Brillouin zone, and only 0.36% of all modes including molecular vibrations.
The phonon frequencies and eigenvectors were obtained by diagonalisation of the dynamical matrix. In the ordered low-temperature phase, the dynamical matrix of the quasicubic unit cell was used, while in the disordered high-temperature phase that of a disordered supercell was used, which is necessary to take into account disorder-induced phonon broadening. After the supercell calculation, the phonon frequencies were projected back onto the Brillouin zone of the cubic unit cell using the band unfolding method described by Overy et al.13 This works as follows: the dynamical matrix of an Mx × My × Mz supercell is diagonalised using GULP, resulting in 3ZN eigenvalues and corresponding eigenvectors, where Z is the number of atoms in the unit cell and N = MxMyMz is the number of unit cells in the supercell. These 3ZN modes are then unfolded over the first Brillouin zone of the unit cell using the following equation:
 | (1) |
 | (2) |
3 Background
Adamantane is a stable hydrocarbon with formula C10H16, which consists of a rigid tetrahedron of six-membered carbon rings in the “armchair” configuration (see Fig. 1). At room temperature and atmospheric pressure, the crystal structure is face centred cubic (Fm![[3 with combining macron]](https://www.rsc.org/images/entities/char_0033_0304.gif) m, a = 9.426 Å, Z = 4).15,16 In this phase, the molecules are randomly oriented in one of two orientations,17,18 and they can jump between them via rotation about the fourfold axes, as revealed by nuclear magnetic resonance (NMR) spectroscopy19 and quasielastic neutron scattering (QENS) studies.20 Upon cooling to T = 208 K at ambient pressure, adamantane undergoes a first-order structural phase transition to the tetragonal space group P
m, a = 9.426 Å, Z = 4).15,16 In this phase, the molecules are randomly oriented in one of two orientations,17,18 and they can jump between them via rotation about the fourfold axes, as revealed by nuclear magnetic resonance (NMR) spectroscopy19 and quasielastic neutron scattering (QENS) studies.20 Upon cooling to T = 208 K at ambient pressure, adamantane undergoes a first-order structural phase transition to the tetragonal space group P![[4 with combining macron]](https://www.rsc.org/images/entities/char_0034_0304.gif) 21c (a = 6.614 Å, c = 8.875 Å, Z = 2).16 In this phase there is no orientational disorder: the planes of molecules alternate down the tetragonal c axis between the two high-temperature orientations.
21c (a = 6.614 Å, c = 8.875 Å, Z = 2).16 In this phase there is no orientational disorder: the planes of molecules alternate down the tetragonal c axis between the two high-temperature orientations.
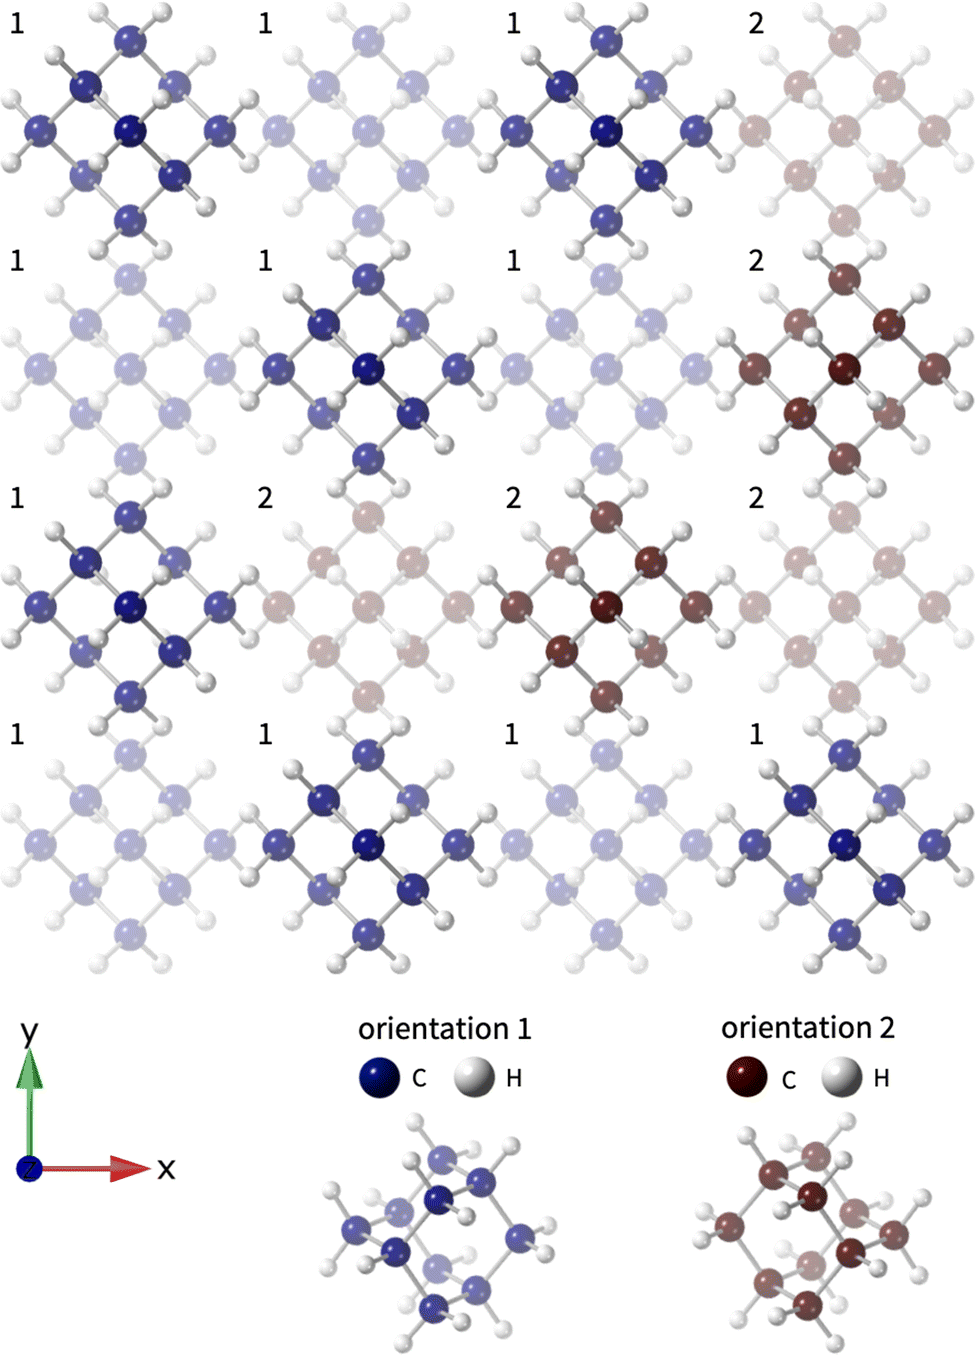 | ||
| Fig. 1 Relaxed configuration of a disordered supercell of adamantane. The two different orientations are highlighted by the numbers and differing colours; the depth fading shows two adjacent planes of the close-packed structure. This is a small part of an 8 × 8 × 8 supercell used in the calculations, in which the two orientations are present in equal amounts. | ||
The thermodynamic data of adamantane's phase transition are summarised in Table 1. As is hinted by the large volume change, the phase transition can also be induced by pressure: at ambient temperature, this happens at a pressure of p = 4.8 kbar.21–23 Both the large volume change and the phase transition temperature's strong sensitivity to pressure are indicators of potentially large barocaloric effects.
On top of the quasielastic neutron studies, inelastic neutron scattering studies have been performed in adamantane's plastic phase.25–27 Here we expand upon the quasielastic studies by measuring the reorientational dynamics under pressure; the inelastic studies are extended by probing the dynamics in both phases to reveal the phase transition mechanism.
4 Experiment
4.1 Colossal barocaloric effect
The barocaloric properties of adamantane were measured using high-pressure differential scanning calorimetry (DSC). Fig. 2(a) and (b) show the heat flow measurements and the corresponding phase diagram. The heat flow measurements were performed at pressures between 900 and 1000 bar. At lower pressures, the phase transition temperature is below the temperature range of the DSC so it could not be observed. The phase diagram confirms the strong pressure-induced shift of the phase transition temperature Tt, with dTt/dp = 18.57 K kbar−1 on cooling and dTt/dp = 19.40 K kbar−1 on heating. It also reveals an extremely low hysteresis up to 1.96 K at 1000 bar, which varies very slightly with pressure. By subtracting the integral of the heat flow peaks at p > 900 bar from the integral of the pbase = 900 bar peak, we can recover the isothermal entropy change for releasing pressure down to 900 bar (p → 900 bar) and adding pressure starting from 900 bar (900 bar →p). This is shown in Fig. 2(c). The maximum pressure-induced entropy change in this experiment is 116.92 J K−1 kg−1. Finally, the reversible entropy changes are shown in Fig. 2(d). Starting at a pressure of 900 bar, reversible effects are already achieved with a pressure of 50 bar to reach 950 bar. | ||
| Fig. 2 Colossal barocaloric effects in adamantane. (a) The phase diagram as deduced from heat-flow measurements shows a strong pressure-induced shift in the phase transition temperature (dTt/dp = 18.57 K kbar−1 on cooling and dTt/dp = 19.40 K kbar−1 on heating), and extremely small hysteresis up to 1.96 K at 1000 bar. The line shows a linear fit to the data extrapolated down to 0 bar. (b) Heat flow data: the solid lines are experimental data and the dotted line is extrapolated data of 0 bar following the procedure described in the main text. (c) Integrating under the heat flow peaks gives the quasi-direct isothermal entropy change ΔSit(qd) for 900 bar →p and p → 900 bar. The dotted lines are extrapolated entropy change: the navy dotted line is for 0 ↔ 200 bar and the grey dotted line is for 0 ↔ 1000 bar. (d) Reversible entropy change ΔSrev deduced from (c). | ||
To get an estimate of the barocaloric behaviour at low temperatures and pressures, and to find the pressure at which full reversibility is reached, the heat flow data were extrapolated down to 0 bar. First, the phase transition temperature was extrapolated down to 0 bar using a linear fit to the data shown in Fig. 2(a). Next, the 1000 bar heat flow peak was translated to those phase transition temperatures: as an example, the resulting predicted heat flow data for 0 bar are shown in Fig. 2(b). Note that it does not matter which heat flow peak (here the 1000 bar peak) is chosen for extrapolation: the extrapolated heat flow peaks have been scaled to account for the decrease in transition enthalpy at low temperatures. Using the predicted 0 bar data, the isothermal entropy change for p ↔ 0 bar can be estimated; the prediction for 1000 ↔ 0 bar is shown in Fig. 2(c), along with the prediction for 200 ↔ 0 bar (which uses the two extrapolated heatflow datasets of 0 and 200 bar). Further details of the extrapolation method and behaviour at intermediate pressures is available in the ESI.† Finally, this results in the extrapolated reversible entropy changes shown in Fig. 2(d). At <200 bar full saturation is thus expected, yielding a colossal reversible entropy change of 106 J K−1 kg−1. The small operating pressures that are necessary for adamantane's barocaloric exploitation are very appealing, and are a consequence of the extremely small hysteresis. With the reasonable assumption that the dTt/dP relation is linear, the hysteresis at 0 bar is estimated to have a value of only about 1.15 K, far smaller than that of some adamantane derivatives.8
The barocaloric properties of adamantane compare favourably against other caloric materials. The isothermal entropy change far surpasses that of electrocaloric and magnetocaloric materials (with maximum entropy changes not greater than ∼50 J K−1 kg−14,7). Moreover, the reversible entropy change is also among some of the largest observed in barocaloric plastic crystals (carboranes: 72–97 J K−1 kg−1;10 1-X-adamantanes: ∼150 J K−1 kg−1 (at 1 kbar)8; NPG: 389 J K−1 kg−16,7) and crucially, due to the phase transition temperature's high sensitivity to pressure, adamantane's maximum entropy change normalised by saturation pressure is larger than any barocaloric plastic crystal known so far, as shown in Fig. 3. This means that entropy changes can be achieved with minimal work. Although adamantane's low phase transition temperature makes it unsuitable for most domestic applications, it may be an excellent candidate for ultra-low temperature freezers used in vaccine storage28 (e.g. the Moderna29 and Johnson&Johnson30 COVID-19 vaccines), blood banks31 and forensic labs.32
 | ||
| Fig. 3 Maximum pressure-induced entropy change |ΔSmax| normalised by saturation pressure Psat for various barocaloric plastic crystals, including neopentane derivatives,6,7,9 carboranes,10 adamantane derivatives8 and adamantane as presented in this work (highlighted in blue). | ||
4.2 Probing phonons with neutron scattering
Dispersion curves for adamantane's low- and high-temperature phases were collected with a single-crystal, inelastic neutron scattering experiment and are shown in Fig. 4(a) and (c) respectively. The low-temperature tetragonal phase has been plotted in quasi-cubic coordinates to allow for direct comparison to the cubic high-temperature structure. Data in this phase has also been collected at T = 220 K by the application of pressure and the dispersion curve is available in the ESI.† These two dispersion curves show only small differences, which can be attributed to slightly different crystal twinning. | ||
| Fig. 4 Phonon dispersion of the tetragonal low-temperature phase and cubic high-temperature phase of adamantane. (a) and (b) are the measured and calculated disperions for the low-temperature tetragonal phase respectively; idem for (c) and (d) for the high-temperature cubic phase. The calculated dispersion in (b) is neutron-weighted and there has been accounted for crystal twinning by taking a weighted average of the dispersions of the three crystal twins. The high-temperature phase in (d) is not neutron-weighted because it has been calculated with the SCLD approach. An 8 × 8 × 8 cubic supercell was used, in which each molecule was randomly assigned one of the two possible orientations. The branches are sampled over a coarse wavevector grid, determined by the allowed wavevectors in eqn (2). | ||
In the high-temperature phase there is a substantial amount of phonon broadening, which can in principle be attributed to either disorder or anharmonicity. Nevertheless, the cell doubling between the two phases is clearly visible (as evidenced by the acoustic modes out of the X-point in the low-temperature phase), and the acoustic modes seem to soften in the high-temperature phase, especially in the Γ–L direction, which is the close-packing direction. Details of the softening of the acoustic modes and phonon density of states are available in the ESI.† Softening of acoustic modes is characteristic of the plastic phase, in which the elasticity decreases.
4.3 Reorientational dynamics under pressure
Previous studies have shown that in the high-temperature phase, adamantane molecules dynamically reorient between their two orientations with fourfold jumps.19,20 Our QENS experiment used a recently developed high-pressure gas cell to investigate this dynamical behaviour under pressure, i.e., under working conditions of a barocaloric cooling cycle.The key result of this experiment was that the reorientational dynamics are suppressed by pressure. Under 4 kbar pressure, the average time between jumps increases by a factor of 2.7 compared to ambient pressure. Not only the frequency, but also the fraction of dynamically activated molecules decreases with pressure: at 4 kbar, this fraction decreased by a factor of 0.6 compared to ambient pressure. Details of the results and data analysis are available in ESI.†
5 Modelling
5.1 Phonons in the ordered and disordered phases
Experimentally, the entropy change between the phases of adamantane is 106 J K−1 kg−1. However, the Boltzmann formula for configurational entropy predicts an entropy change of only Rln2 = 42.30 J K−1 kg−1 (or 5.76 J K−1 mol−1) due to the twofold configurational disorder in the high-temperature phase. A large part (about 60%) of the total entropy change must therefore originate from vibrational effects. To investigate the molecular mechanism that gives rise to the increase in vibrational entropy over the phase transition, we perform supercell lattice dynamics calculations validated against experimental dispersion curves. Large supercell calculations are necessary to model the orientational disordering in the high-temperature phase; simulation by first principles was therefore too expensive and instead an empirical potential was used.
The vibrations in adamantane were modelled using lattice dynamics calculations with the program GULP,33 using the forcefield parameterised by Greig and Pawley.34 In this model, the adamantane molecules are taken as rigid, and the intermolecular forces are parameterised by a Buckingham potential. This model has been shown to successfully predict both the ordered and disordered structure34 and also reproduces the pressure-induces phase transition to the ordered phase.35 The model could also be formulated with flexible rather than rigid molecules, but this has no substantial effect on the structural properties below 50 kbar.36
The phonon spectrum in the low-temperature phase, calculated using standard lattice dynamics calculations, is shown in Fig. 4(b) and shows good agreement with the measured dispersion. All features in the dispersion curve are reproduced, albeit with slightly higher energies in the calculation. This, however, is only a small discrepancy given the use of a classical forcefield. The accuracy of the vibrational energies might potentially be increased by further fitting of the forcefield. However, as mentioned above, the model reliably predicts adamantane's structure,34,35 and since all qualitative dispersion features are reproduced, we did not deem this necessary. We note that the good match of the experimental dispersion curve to our rigid-molecule model implies that internal vibrations of the adamantane molecules occur at high energies not accessible with this experiment. These modes, in turn, will therefore have a minor effect on the vibrational entropy change, as is clear from eqn (3) below.
In the high-temperature phase, a disordered supercell configuration is required to accurately capture the effect of the configurational disorder on the phonon dispersion relation. We use the Supercell Lattice Dynamics (SCLD)13,14 method, in which phonons are calculated in a disordered supercell at the Γ point and consequently unfolded over the first Brillouin zone of the unit cell. The resulting phonon dispersion can be directly compared to dispersion relations measured by experiment. To date, the SCLD approach has been used to model disorder-induced phonon broadening for mass- and force-constant disorder; here, we extend this approach to orientational disorder. Fig. 4(d) shows the calculated dispersion relation in the high-temperature phase: the Γ-point phonons were calculated for an 8 × 8 × 8 cubic supercell, in which each molecule was randomly assigned one of the two allowed orientations; the modes were consequently unfolded over the first Brillouin zone of the cubic unit cell. The calculation has imaginary frequencies at the Γ point (see ESI† for a dispersion plot). With the methodology explained in the next section, we were able to identify these dynamical instabilities as rotational modes of the adamantane molecules. The instability arises from the fact that the energy optimisation in this structure came close to but never reached a global minimum, despite the use of multiple optimisation strategies (see Methods). We suspect that this is due to the flatness of the energy landscape in the direction of molecular rotations, due to the weak van der Waals intermolecular forces and the molecules' near-spherical shape. In such a flat energy landscape, harmonic molecular rotations, if not unstable, would have very low energies.
The SCLD calculation reproduces a very substantial amount of the phonon broadening seen in experiment. This indicates that the phonon broadening in adamantane's high-temperature phase can for a large part be attributed to orientational disorder rather than anharmonic effects. The features that remain visible despite the broadening are reproduced by experiment, such as the acoustic mode extending to the L point at around 4 meV. (For additional comparison, cuts at specific Q-points are available in the ESI†).
As was seen in experiment, the calculated acoustic modes soften in the high-temperature phase. It is these modes specifically that seem to be responsible for most of the vibrational entropy change in this material. In the high-temperature limit, the vibrational entropy change between two harmonic phases α and β is given by37
 | (3) |
Care must be taken when the phonon calculations produce unstable modes, which is the case for adamantane's high-temperature phase. Imaginary frequencies, although unphysical, are not unexpected among the librational modes, since it is precisely these modes that soften to zero frequency in the order–disorder transition. This has two important consequences. First, these modes will have very low frequencies. Second, these mode frequencies must be very sensitive to small variations – such as rounding errors – in the potential, since this sensitivity is responsible for the phase transition itself. We therefore attribute these instabilities to numerical error in a calculation that involves summing many thousands of small terms.§
The effective harmonic frequencies of these modes are unknown, but the bounds of the entropy change can still be estimated by considering the following two scenarios. The minimum entropy of the high-temperature phase is that obtained when the unstable modes are so stiff that they contribute negligibly to the thermally accessible phonon density of states. The maximum entropy change is obtained when the unstable modes have the lowest possible effective harmonic frequencies. As seen in Fig. 6b, the low-energy region of the phonon density of states (up to ∼4.5 meV) follows a Debye model, where the density of states has a quadratic energy dependence: g(ε) = Aε2. Preserving this relation, the lowest possible energies of the unstable modes can thus be obtained by scaling up the constant of proportionality A, effectively decreasing the speed of sound (A ∝ cs−3). The Debye model is based on the low-energy behaviour of acoustic modes, while we know that these unstable modes are optic. However, it is implausible for optic modes to have frequencies substantially overlapping with the Debye region; there is indeed no evidence of deviations from the Debye behaviour in the low-energy region of of adamantane's neutron density of states (Fig. S3, ESI†). Hence, while it doesn't in itself represent a realistic scenario, scaling of the Debye density of states does set an upper bound on the vibrational entropy.
Using these limits, we find that that the entropy change between the low- and high-entropy phases lies between 93 and 102 J K−1 kg−1. This range is higher than the predicted excess of ∼64 J K−1 kg−1, but as good as an agreement as can be expected with this empirical forcefield. The discrepancy is likely due to the overestimation of the mode frequencies in the low-temperature phase as seen in the dispersion curves in Fig. 4(a and b), which leads to an underestimation of the entropy in this phase.
5.2 Investigating the high-entropy phonon modes
The softening of the modes in the high-temperature phase – the root of the vibrational entropy change – can be investigated further by analysing their character. With the program GASP39,40 we have decomposed the displacements caused by the mode eigenvectors into translations and rotations of the adamantane molecules. Since we consider a rigid-molecule model, molecular distortions are ignored. Each mode in the dispersion relation can then be characterised by its rotational character Mrot/Mtot, which is the absolute average displacement due to rotation divided by the total absolute average displacement. The modes are coloured by their rotational character in the dispersion curves in Fig. 5. | ||
| Fig. 5 Characterising the phonon dispersion in adamantane's low-and high-temperature phases. For each phase, the modes in the phonon dispersion are coloured by the rotational character of the corresponding eigenvectors, calculated with the SCLD method (8 × 8 × 8 supercell in high-temperature phase; 6 × 6 × 6 and 8 × 8 × 8 combined in low-temperature phase). The branches are sampled over a coarse wavevector grid, determined by the allowed wavevectors in eqn (2). The rotational character is the absolute average displacement due to molecular rotation divided by the total absolute average displacement: Mrot/Mtot. The rotational character of degenerate modes is averaged. In the high-temperature phase, projected intensity after band-unfolding determines the opacity of the colours (bottom colour bar): modes with a projected value > 1 have maximum opacity; modes with a projected value of 0 are transparent. The energy spectra show clear ‘zones’ of rotational or translational modes: the dashed lines on the left part of the plots are guides to the eye. | ||
In the low-temperature phase, we observe a band of rotational modes between approximately 5 and 10 meV. In the high-temperature phase, modes with significant rotational character occur at all energies below 9 meV. Notably, the acoustic modes, which were purely translational in the low-temperature phase, now have a large rotational character. As mentioned in the previous section, the few unstable modes are purely rotational (see Fig. S4, ESI†).
The dynamical changes between the two phases are also apparent in the phonon density of states, shown in Fig. 6. Each bin in the phonon density of states histogram is coloured by the average rotational character of the modes in that bin. We clearly see that the low-energy translational modes in the low-temperature phase are replaced by strong rotational modes in the high-temperature phase.
 | ||
| Fig. 6 Computational phonon density of states in the high- and low-temperature phases. Each bar in the histograms is coloured by the average rotational character Mrot/Mtot of the modes in that bin. | ||
A possible way of understanding this dynamical change is by contrasting the structures of the low- and high-temperature phase as interlocking molecules and spherical close-packed molecules, respectively. In the low-temperature tetragonal phase, interlocking decreases the molecules' ability to rotate and hence rotational modes occur at higher energies. At low energies, only translational modes can be excited. In the high-temperature phase, the structure changes to close-packed FCC. The weak intermolecular interactions between individual atoms no longer play an important role. Instead, the molecules behave as close-packed spheres. In this arrangement, the purely rotational degrees of freedom are the easiest to excite, since rotational motion of one molecule requires barely any cooperation from neighbouring molecules. These purely rotational modes occur at very low energies (and in some cases are unstable in our calculation). In the acoustic modes, the translational and rotational modes start to mix. Away from the Γ-point, the molecules' ability to translate is inhibited by their close packing, and hence the acoustic modes consist of a rolling behaviour, which is partly rotational and partly translational. The purely translational modes now only occur at higher energies, above 9 meV.
The ability of the molecules to either interlock (low temperature) or behave more like spheres (high temperature) is consistent with adamantane's reorientational dynamics observed by QENS and NMR. The existence of reorientational jumps in the high-temperature phase (and their absence in the low-temperature phase) implies that the rotational degrees of freedom are indeed easier to excite in the high-temperature phase. The fact that the reorientations in the high-temperature phase are suppressed by pressure can also be interpreted in the light of this simple model: as pressure pushes the molecules closer together, their behaviour slowly starts to shift from sphere-like (easy to reorient) to interlocked (hard to reorient).
6 Discussion and conclusions
Plastic crystals have shown to be promising candidates for efficient and environmentally-friendly barocaloric cooling. In this work, we have investigated the barocaloric effect of an archetypical plastic crystal, adamantane.Adamantane has a large isothermally reversible entropy change and, thanks to its very low hysteresis, unparalleled barocaloric strength. Due to the temperature limit of our calorimeter and adamantane's low phase transition temperature, its behaviour could only be measured at high pressures. We believe that the extrapolation to low pressure, although somewhat aggressive, is a good indication of its excellent barocaloric behaviour at ambient conditions, since the entropy changes will most likely be underestimated due to pressure suppression of entropy-producing vibrations.
The large entropy change over the phase transition originates from both orientational disorder (40%) and vibrational effects (60%). With supercell lattice dynamics calculations, we have been able to trace back the vibrational entropy change to the softening of (mainly) the acoustic modes. During the softening, these modes also obtain a substantial rotational component and so can be described by rolling molecules. We propose that the known structural change causes this dynamical behaviour in the following way. At low temperature, adamantane molecules form an interlocking structure, where rotational motions are less accessible. In the high-temperature phase, the structure allows for more rotational movement: at small angles of rotation, the dynamics of the molecules are reminiscent of close-packed spheres. The molecules furthermore undergo discrete jump-reorientations over larger angles, as previously observed by NMR and QENS. This behaviour is an example of a characteristic feature of a plastic crystal: the interactions in the plastic phase allow the molecules to obtain a higher apparent symmetry (here: spherical) than either its molecular symmetry (here: tetrahedral) or even its site symmetry (here: octahedral).
The SCLD approach to calculate the phonon spectrum has the great benefit that it allows us to trace the vibrational entropy change back to its microscopic origins via an eigenvector analysis. This opens up the possibility to use not only configurational but now also vibrational entropy as a design principle. The good match with the experimentally measured phonon dispersion in this paper demonstrates that the SCLD approach can be applied to orientational disorder, and can hence be a powerful tool in studying many plastic crystals. Forcefields for many plastic crystals are readily available in for example the OPLS all-atom force field for organic and ionic liquids,41–43 which has been successfully used in some previous plastic crystal studies.7,44 The SCLD approach can be readily extended to include quasi- and anharmonic effects by calculating the dynamical matrix from molecular dynamics,45 albeit at greater computational cost.
This case study of adamantane has brought insight into the specific properties of plastic crystals in which van der Waals forces dominate the intermolecular interactions. Although adamantane has large reversible entropy changes, its phase transition temperature may restrict its use to low-temperature cooling applications. In addition, though, our detailed analysis of the molecular mechanism underlying its entropy change can inform the design of more sophisticated barocaloric plastic crystals, and can set a benchmark for other plastic crystals in which (1) the interactions are determined by more than just van der Waals forces; and/or (2) the molecules deviate from adamantane's near-spherical shape.
An obvious first step in this regard will be to compare adamantane's barocaloric behaviour against that of adamantane derivatives such as the recently reported 1-haloadamantanes:8 these compounds have similar entropy changes, available at room temperature, although they show more hysteresis than adamantane. This might suggest that the spherical nature of adamantane's molecules promotes the transition to the close-packed high-temperature phase (low phase transition temperature), and might eliminate the need for a metastable state during the structural change (low hysteresis). However, a full analysis of the entropy contributions and dynamic behaviour (for example with the SCLD approach) of these compounds is needed to make definitive conclusions about the influence of molecular symmetry on barocaloric performance.
Finally, the SCLD approach demonstrated in this paper can help map out another material property vital to barocaloric deployment: thermal conductivity. Configurational disorder in barocalorics is a two-edged sword: on the one hand, configurational disorder in the high-temperature phase contributes to the entropy change; on the other hand, configurational disorder reduces phonon lifetimes and, with them, thermal conductivity. Good thermal conductivity is a key requirement for a working barocaloric cooling device, and this presents a challenge unique to solid-state cooling. In particular plastic crystals have low thermal conductivity,46,47 with adamantane having only ∼0.18 Wm−1 K−1 in the plastic phase.8,48 Several engineering solutions have been proposed to mitigate this issue (such as mixing the barocaloric with highly conductive materials8,46,49–53), but many open questions remain regarding the quantitative relation between disorder and thermal conductivity, and the specific conditions that might amplify or suppress this relation.54 By directly modelling the influence of disorder on phonon lifetimes via phonon broadening, the SCLD approach presents an opportunity to further the understanding of the interplay between disorder, configurational entropy, vibrational entropy (via the broadened density of states) and thermal conductivity, and can also perhaps inspire ways of tuning thermal conductivity14 in barocalorics.
Author contributions
RP prepared the adamantane single crystal. RJCD performed the calorimetry and analysed these data. BEM, RJCD, HCW and AEP performed the INS experiments; the data were analysed by BEM and HCW. BEM, RJCD, FD and AEP performed the QENS experiments; the data were analysed by BEM with support from FD and AEP. BEM performed the simulations with support from AEP. AEP and HCW were responsible for conceptualisation, funding acquisition, project administration and supervision. The original draft of the paper was written by BEM; it was revised and edited by BEM and AEP in collaboration with all authors.Data availability
Raw data from the neutron scattering experiments are available at https://doi.org/10.5286/ISIS.E.RB1920588-1 and https://doi.org/10.5286/ISIS.E.RB2010472-1.Conflicts of interest
There are no conflicts of interest to declare.Acknowledgements
Experiments at the ISIS Neutron and Muon Source were supported by a beamtime allocation RB1920588 and RB2010472 from the Science and Technology Facilities Council. HCW, AEP and RJCD thank EPSRC for financial support: EP/S035923/1 and EP/S03577X/1. BEM thanks ISIS for PhD studentship funding. The authors are indebted to R. Fair and M. D. Le for their assistance and guidance in the use of Euphonic, and to C. Goodway and M. Kibble for supporting the high pressure experiments. We are grateful to the UK Materials and Molecular Modelling Hub for computational resources, which is partially funded by EPSRC (EP/P020194/1 and EP/T022213/1).References
- United Nations Environment Programme, The Importance of Energy Efficiency in the Refrigeration, Air-Conditioning and Heat Pump Sectors. Briefing Note A, United nations environment programme technical report, 2018.
- University of Birmingham and Birmingham Energy Institute, Clean Cold and the Global Goals, University of birmingham and birmingham energy institute technical report, 2016.
- APEC Energy Working Group, Refrigerator / Freezer Energy Efficiency Improvement in the APEC Region: Review of Experience and Best Practices, APEC Energy Working Group Technical Report November, 2018.
- D. Boldrin, Appl. Phys. Lett., 2021, 118, 170502 CrossRef CAS.
- P. Lloveras, E. Stern-Taulats, M. Barrio, J. L. Tamarit, S. Crossley, W. Li, V. Pomjakushin, A. Planes, L. Mañosa, N. D. Mathur and X. Moya, Nat. Commun., 2015, 6, 8801 CrossRef CAS PubMed.
- P. Lloveras, A. Aznar, M. Barrio, P. Negrier, C. Popescu, A. Planes, L. Mañosa, E. Stern-Taulats, A. Avramenko, N. D. Mathur, X. Moya and J. L. Tamarit, Nat. Commun., 2019, 10, 1803 CrossRef CAS PubMed.
- B. Li, Y. Kawakita, S. Ohira-Kawamura, T. Sugahara, H. Wang, J. Wang, Y. Chen, S. I. Kawaguchi, S. Kawaguchi, K. Ohara, K. Li, D. Yu, R. Mole, T. Hattori, T. Kikuchi, S.-I. Yano, Z. Zhang, Z. Zhang, W. Ren, S. Lin, O. Sakata, K. Nakajima and Z. Zhang, Nature, 2019, 567, 506–510 CrossRef CAS PubMed.
- A. Aznar, P. Negrier, A. Planes, L. Mañosa, E. Stern-Taulats, X. Moya, M. Barrio, J. L. Tamarit and P. Lloveras, Appl. Mater. Today, 2021, 23, 101023 CrossRef.
- A. Aznar, P. Lloveras, M. Barrio, P. Negrier, A. Planes, L. Mañosa, N. D. Mathur, X. Moya and J. L. Tamarit, J. Mater. Chem. A, 2020, 8, 639–647 RSC.
- K. Zhang, R. Song, J. Qi, Z. Zhang, Z. Zhang, C. Yu, K. Li, Z. Zhang and B. Li, Adv. Funct. Mater., 2022, 32, 2112622 CrossRef CAS.
- K. T. Butler, A. Walsh, A. K. Cheetham and G. Kieslich, Chem. Sci., 2016, 7, 6316–6324 RSC.
- J. Li, M. Barrio, D. J. Dunstan, R. Dixey, X. Lou, J. L. Tamarit, A. E. Phillips and P. Lloveras, Adv. Funct. Mater., 2021, 31, 2105154 CrossRef CAS.
- A. R. Overy, A. Simonov, P. A. Chater, M. G. Tucker and A. L. Goodwin, Phys. Status Solidi B, 2017, 254, 1600586 CrossRef.
- A. R. Overy, A. B. Cairns, M. J. Cliffe, A. Simonov, M. G. Tucker and A. L. Goodwin, Nat. Commun., 2016, 7, 10445 CrossRef CAS PubMed.
- R. C. Fort and P. R. Von Schleyer, Chem. Rev., 1964, 64, 277–300 CrossRef CAS.
- C. E. Nordman and D. L. Schmitkons, Acta Crystallogr., 1965, 18, 764–767 CrossRef.
- J. P. Amoureux, M. Bee and J. C. Damien, Acta Crystallogr., Sect. B: Struct. Crystallogr. Cryst. Chem., 1980, 36, 2633–2636 CrossRef.
- E. O. Beake, M. G. Tucker, M. T. Dove and A. E. Phillips, ChemPhysChem, 2017, 18, 459–464 CrossRef CAS PubMed.
- J. P. Amoureux, M. Bee and J. Virlet, Mol. Phys., 1980, 41, 313–324 CrossRef CAS.
- M. Bee, J. P. Amoureux and R. E. Lechner, Mol. Phys., 1980, 40, 617–641 CrossRef CAS.
- S. M. Breitling, A. D. Jones and R. H. Boyd, J. Chem. Phys., 1971, 54, 3959–3964 CrossRef CAS.
- T. Ito, Acta Cryst., 1973, B29, 364 CrossRef.
- V. Vijayakumar, A. B. Garg, B. K. Godwal and S. K. Sikka, J. Phys.: Condens. Matter, 2001, 13, 1961–1972 CrossRef CAS.
- S. S. Chang and E. F. Westrum, J. Phys. Chem., 1960, 64, 1547–1551 CrossRef CAS.
- C. G. Windsor, D. H. Saunderson, J. N. Sherwood, D. Taylor and G. S. Pawley, J. Phys. C: Solid State Phys., 1978, 11, 1741–1759 CrossRef CAS.
- C. G. Windsor, J. C. Damien, J. Lefebvre and R. M. Richardson, J. Phys. C: Solid State Phys., 1981, 14, 1555–1567 CrossRef CAS.
- J. C. Damien, J. Lefebvre, M. More, R. Foure, B. Hennion and R. Currat, J. Phys. C: Solid State Phys., 1978, 11, 4323–4340 CrossRef CAS.
- U.S. Department of Health and Human Services – Centers for Disease Control and Prevention, Vaccine Storage and Handling Toolkit, 2022, https://www.cdc.gov/vaccines/hcp/admin/storage/toolkit/storage-handling-toolkit.pdf.
- Storage & Handling | Moderna COVID-19 Vaccine (EUA), https://eua.modernatx.com/covid19vaccine-eua/providers/storage-handling.
- Johnson & Johnson COVID-19 Vaccine Authorized by U.S. FDA For Emergency Use – First Single-Shot Vaccine in Fight Against Global Pandemic, https://www.jnj.com/johnson-johnson-covid-19-vaccine-authorized-by-u-s-fda-for-emergency-usefirst-single-shot-vaccine-in-fight-against-global-pandemic.
- M. Shabihkhani, G. M. Lucey, B. Wei, S. Mareninov, J. J. Lou, H. V. Vinters, E. J. Singer, T. F. Cloughesy and W. H. Yong, Clin. Biochem., 2014, 47, 258–266 CrossRef CAS PubMed.
- H. R. Dash and K. Vajpayee in Handbook of DNA Profiling, ed. H. R. Dash, P. Shrivastava, J. Lorente, Springer, Singapore, 2021 Search PubMed.
- J. D. Gale and A. L. Rohl, Mol. Simul., 2003, 29, 291–341 CrossRef CAS.
- D. W. Greig and G. S. Pawley, Mol. Phys., 1996, 89, 677–689 CrossRef.
- N. A. Murugan and S. Yashonath, J. Phys. Chem. B, 2005, 109, 2014–2020 CrossRef CAS PubMed.
- N. A. Murugan, R. S. Rao, S. Yashonath, S. Ramasesha and B. K. Godwal, J. Phys. Chem. B, 2005, 109, 17296–17303 CrossRef CAS PubMed.
- B. Fultz, Prog. Mater. Sci., 2010, 55, 247–352 CrossRef CAS.
- F. L. Bauer and C. T. Fike, Numer. Math., 1960, 2, 137–141 CrossRef.
- S. A. Wells, M. T. Dove and M. G. Tucker, J. Phys.: Condens. Matter, 2002, 14, 4567–4584 CrossRef CAS.
- S. A. Wells and A. Sartbaeva, Mol. Simul., 2015, 41, 1409–1421 CrossRef CAS.
- W. L. Jorgensen, D. S. Maxwell and J. Tirado-Rives, J. Am. Chem. Soc., 1996, 118, 11225–11236 CrossRef CAS.
- S. Tsuzuki, W. Shinoda, H. Saito, M. Mikami, H. Tokuda and M. Watanabe, J. Phys. Chem. B, 2009, 113, 10641–10649 CrossRef CAS PubMed.
- S. V. Sambasivarao and O. Acevedo, J. Chem. Theory Comput., 2009, 5, 1038–1050 CrossRef CAS PubMed.
- C. B. Park and B. J. Sung, J. Phys. Chem. B, 2020, 124, 6894–6904 CrossRef CAS PubMed.
- L. T. Kong, Comput. Phys. Commun., 2011, 182, 2201–2207 CrossRef CAS.
- A. I. Krivchikov, G. A. Vdovichenko, O. A. Korolyuk, F. J. Bermejo, L. C. Pardo, J. L. Tamarit, A. Jezowski and D. Szewczyk, J. Non-Cryst. Solids, 2015, 407, 141–148 CrossRef CAS.
- P. Lloveras and J.-L. Tamarit, MRS Energy Sustainability, 2021, 8, 3–15 Search PubMed.
- J. Wigren and P. Andersson, Mol. Cryst. Liq. Cryst., 1980, 59, 137–148 CrossRef CAS.
- B. Praveen and S. Suresh, Eng. Sci. Technol. Int. J., 2018, 21, 1086–1094 Search PubMed.
- E. S. Lee, S. M. Lee, D. J. Shanefield and W. R. Cannon, J. Am. Ceram. Soc., 2008, 91, 1169–1174 CrossRef CAS.
- O. Mesalhy, K. Lafdi, A. Elgafy and K. Bowman, Energy Convers. Manage., 2005, 46, 847–867 CrossRef CAS.
- A. I. Krivchikov, O. A. Korolyuk, I. V. Sharapova, J. L. Tamarit, F. J. Bermejo, L. C. Pardo, M. Rovira-Esteva, M. D. Ruiz-Martin, A. Jezowski, J. Baran and N. A. Davydova, Phys. Rev. B: Condens. Matter Mater. Phys., 2012, 85, 014206 CrossRef.
- G. A. Vdovichenko, A. I. Krivchikov, O. A. Korolyuk, J. L. Tamarit, L. C. Pardo, M. Rovira-Esteva, F. J. Bermejo, M. Hassaine and M. A. Ramos, J. Chem. Phys., 2015, 143, 084510 CrossRef CAS PubMed.
- F. DeAngelis, M. G. Muraleedharan, J. Moon, H. R. Seyf, A. J. Minnich, A. J. McGaughey and A. Henry, Nanoscale Microscale Thermophys. Eng., 2019, 23, 81–116 CrossRef CAS.
- M. G. Kibble, V. Laliena, C. M. Goodway, E. Lelièvre-Berna, K. V. Kamenev, S. Klotz and O. Kirichek, J. Neutron Res., 2020, 21, 105–116 Search PubMed.
- R. I. Bewley, J. W. Taylor and S. M. Bennington, Nucl. Instrum. Methods Phys. Res., Sect. A, 2011, 637, 128–134 CrossRef CAS.
- O. Arnold, J. C. Bilheux, J. M. Borreguero, A. Buts, S. I. Campbell, L. Chapon, M. Doucet, N. Draper, R. Ferraz Leal, M. A. Gigg, V. E. Lynch, A. Markvardsen, D. J. Mikkelson, R. L. Mikkelson, R. Miller, K. Palmen, P. Parker, G. Passos, T. G. Perring, P. F. Peterson, S. Ren, M. A. Reuter, A. T. Savici, J. W. Taylor, R. J. Taylor, R. Tolchenov, W. Zhou and J. Zikovsky, Nucl. Instrum. Methods Phys. Res., Sect. A, 2014, 764, 156–166 CrossRef CAS.
- R. A. Ewings, A. Buts, M. D. Le, J. van Duijn, I. Bustinduy and T. G. Perring, Nucl. Instrum. Methods Phys. Res., Sect. A, 2016, 834, 132–142 CrossRef CAS.
- B. E. Meijer, simpleQENS, 2021, https://github.com/bernetmeijer/simpleQENS.
Footnotes |
| † Electronic supplementary information (ESI) available. See DOI: https://doi.org/10.1039/d2cp05412d |
| ‡ INS measurements require perdeuterated samples to avoid the huge incoherent scattering cross section of hydrogen which would swamp the phonon signal. |
| § This effect is further magnified by a technical point: the matrix eigenvalues represent the squares of the vibrational frequencies rather than the frequencies themselves. If a Hermitian matrix is randomly perturbed, the Bauer-Fike theorem38 gives the same upper bound on the variation of each of the eigenvalues; but because we must take the square root to get the frequencies from the eigenvalues, this has a greater effect on small than large eigenvalues. |
| This journal is © the Owner Societies 2023 |