 Open Access Article
Creative Commons Attribution 3.0 Unported Licence
Energy-dependent timescales in the dissociation of diiodothiophene dication†
Edwin
Kukk
 *af,
Lassi
Pihlava
 a,
Kuno
Kooser
ab,
Christian
Stråhlman
 c,
Sylvain
Maclot‡
 d and
Antti
Kivimäki
 e
e
aDepartment of Physics and Astronomy, University of Turku, FI-20014 Turku, Finland. E-mail: edwin.kukk@utu.fi
bInstitute of Physics, University of Tartu, W. Ostwaldi 1, EE-50411 Tartu, Estonia
cDepartment of Materials Science and Applied Mathematics, Malmö University, SE-20506 Malmö, Sweden
dDepartment of Physics, Gothenburg University, Box 100, SE-40530 Gothenburg, Sweden
eMAX IV Laboratory, Lund University, SE-22100 Lund, Sweden
fCNRS, Laboratoire de Chimie Physique - Matière et Rayonnement, 4 Pl. Jussieu, 75005, Paris, France
First published on 26th January 2023
Abstract
Photodissociation molecular dynamics of gas-phase 2,5-diiodothiophene molecules was studied in an electron-energy-resolved electron-multi-ion coincidence experiment performed at the FinEstBeAMS beamline of MAX IV synchrotron. Following the photoionization of the iodine 4d subshell and the Auger decay, the dissociation landscape of the molecular dication was investigated as a function of the Auger electron energy. Concentrating on an major dissociation pathway, C4H2I2S2+ → C4H2S+ + I+ + I, and accessing the timescales of the process via ion momentum correlation analysis, it was revealed how this three-body process changes depending on the available internal energy. Using a generalized secondary dissociation model, the process was shown to evolve from secondary dissociation regime towards concerted dissociation as the available energy increased, with the secondary dissociation time constant changing from 1.5 ps to 129 fs. The experimental results were compared with simulations using a stochastic charge-hopping molecular mechanics model. It represented the observed trend and also gave a fair quantitative agreement with the experiment.
1 Introduction
Photoexcited molecular dynamics has long been an active area of research both in physical chemistry and chemical physics, both because of fundamental interest and the relevance of these processes in materials exposed to radiation, from visible light to hard X-rays. From the fundamental point of view, tracking photoinduced molecular dynamics allows stringent tests of quantum chemistry models over a broad range of conditions. Such experimental studies, many of which have been performed at synchrotron radiation sources, have gained momentum in the past decade owing to the new possibilities offered by free electron laser (FEL) radiation sources,1–7 high-order harmonic generation (HHG)8–15 and the development of various time-resolved techniques.8,16–19 Consequently, there is a wealth of new information on time evolution of photoinduced molecular dynamics in small quantum systems. An interesting category of such a system is formed by thiophene, its derivatives, oligo- and polymers, since these aromatic aromatic organic compounds display a very rich photoinduced nuclear and electron dynamics.20–27 They also have present and potential applications in, e.g., molecular electronics and photovoltaics.28–31 Another category of interest are various halogenated organic compounds, particularly the ones where hydrogen substitution by heavy elements iodine or bromine create absorption “hot-spots” for X-rays.4,32–40 Targeting various electron shells in these hot-spots allows for versatile control in creating molecular dynamics, from intricate dissociation pathways of low-charge states to high-energy Coulomb explosions of highly charged states created by deep core ionization and/or multiphoton absorption.In this study, we focus on the dissociation of a halogenated aromatic compound 2,5-diiodothiophene, initiated by soft X-ray ionization of iodine 4d subshell. This shallow inner-shell ionization is followed by Auger decay and the dissociation then proceeds in a dicationic electronic state. The thiophene molecule and its halogenated derivatives are know to exhibit a very rich dissociation landscape in their dicationic state, presenting an excellent model system. Furthermore, that landscape is also very dynamic, strongly dependent on the initial conditions such as the energy levels populated by the Auger decay. On the one hand, electron-energy-resolving electron-ion coincidence studies using synchrotron radiation are invaluable in relating the outcome of the dissociation, in the form of ionic and neutral fragments, to the initial conditions of the electronic structure of the parent molecule. However, such investigations are by the nature of the light source not time-resolving, therefore tracking the time-evolution of the dissociation pathways is challenging. On the other hand, free electron laser sources (FELs) are excellent and direct probes into the time evolution of molecular photodynamics in the femto- and picosecond timescales. But combining both aspects – fine control over the initial conditions (e.g., defining the dicationic electronic state), and direct time-dependent probing of the dynamics as it proceeds – is still a challenge.
Here, we present an approach to reveal time-dependent information on the dissociation pathways in a synchrotron experiment, with a precise control over the initial electronic state via Auger electron–ion coincidence measurement. Starting from the energetically low-lying Auger final states, the diiodothiophene molecule has a dominant three-body dissociation pathway, RI2++ → R+ + I+ + I (R marks the thiophene ring C4H2S), on which we will concentrate in this study. In the time domain, such three-body reactions are commonly characterized as concerted or secondary dissociation reactions, or deferred charge separation reactions. The latter two are two-step processes with the neutral or charged iodine separating in the second step, correspondingly. We investigate this pathway covering a broad range of dicationic Auger final states and, using careful momentum correlation analysis, access the timescales of the two stages of the reaction. We will extract quantitative timescale information and show that it is strongly dependent on the amount of internal energy in the molecular dication, available for the molecular dynamics.
Following a major dissociation channel as a function of both time and energy provides a much more informative picture of the underlying processes and the essential factors governing the dynamics. Here, we use a generalized secondary dissociation (GSD) model, spanning the range of reactions from concerted to “pure” secondary dissociation, in the interpretation of the experiment. We also carried out a point-charge, simplified force-field, stochastic charge hopping model simulations, accessing both the energy and timescales of the molecular dynamics.
2 Experimental setup
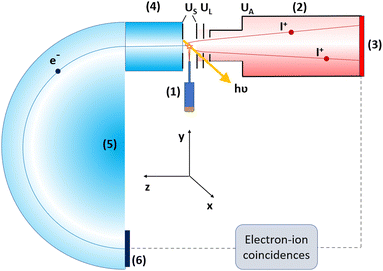
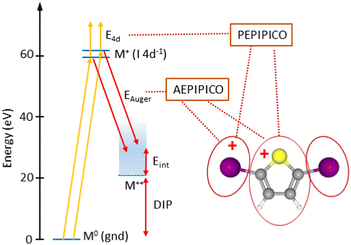
The experiment was performed at the Finnish–Estonian beamline (FinEstBeAMS) of the MAX IV synchrotron radiation source in Lund, Sweden. The beamline41,42 is equipped with a SX700 type monochromator manufactured by FMB Feinwerk-und Messtechnik GmbH, receiving radiation from an Apple II type undulator. Horizontally polarized radiation was used in this experiment. The 2,3-diiodothiophene (C4H2I2S, Merck, purity ≥97.5%) molecules were introduced by direct evaporation from a Knudsen-cell-type crucible at a temperature of 80–100 °C. The molecular beam crossed the monochromatized photon beam at the centre of the sample region (Fig. 1). Photoelectrons were detected by a modified Scienta R4000 hemispherical electron analyzer, equipped with a fast 40 mm diameter microchannel plate (MCP) and a resistive anode (Quantar Inc.) position-sensitive detector. The electron detector provided triggers for the pulsed ion extraction voltage US across the source region of a modified Wiley–McLaren type ion time-of-flight (TOF) spectrometer.43 The ions were then accelerated to the final energy by the drift tube voltage UA, first passing a lens element with UL, modifying the radial distribution and focusing. Ions were detected by a Roentdek 80 mm MCP and HEX-anode detector, recording ion flight times (TOFs) and radial hit positions. The electron energy and ion TOFs and ion positions of impact data were combined into a coincidence dataset. In addition, non-coincident “random” triggers for ion extraction were generated at a constant rate, interleaved with the “true coincidence” electron triggers. The ions collected using the random triggers were used for statistical subtraction of the false coincidence background from the ion TOF spectra, electron–ion–ion coincidence maps, coincident ion pair yields and ion momentum distributions.The electron energy window for a coincidence dataset is determined by the electron acceleration/retardation and the pass energy Ep of the analyzer, its width being about 8% of Ep. Two electron-multi-ion coincidence datasets were collected, one with the Auger electron from the decay of the iodine 4d−1 vacancy created by 110 eV photons (we'll refer to it as AEPIPICO) and another with the iodine 4d photoelectron in coincidence with ions, using the 85 eV photon energy (the PEPIPICO dataset). In addition, a noncoincident ion TOF spectrum recorded at hν = 21 eV is reported.
Pass energy of 200 eV and entrance slit of 0.5 mm was used in the AEPIPICO measurement, giving the estimated electron energy resolution of about 250 meV full-width at half-maximum (FWHM). The photon flux was adjusted to give a low average electron count rate of 24 el s−1. The PEPIPICO dataset was recorded using 100 eV pass energy.
3 Experimental results
3.1 Fragmentation mass spectra
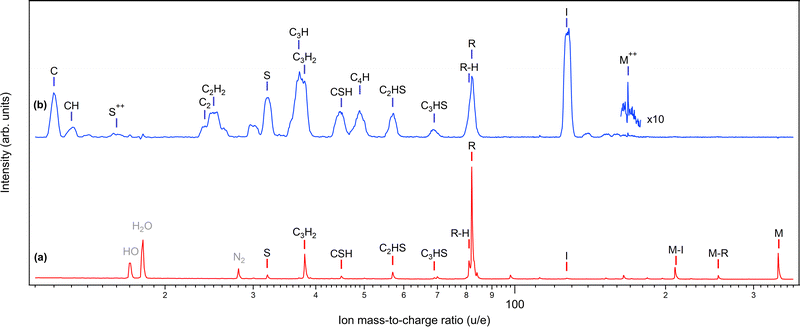
In photoinduced molecular dynamics, the dissociation landscape is primarily determined by the charge state of the molecule. Fig. 2 shows the mass spectra of diiodothiophene for singly charged (a) and doubly charged (b) parent molecule, the first following valence ionization and the second resulting from iodine 4d ionization and subsequent Auger decay of the I 4d−1 inner-shell hole state (see also Fig. 3). The spectra are converted to the mass/charge scale from the original time-of-flight (TOF) measurement and the various species are labeled in Fig. 2. Throughout the paper, M refers to the parent molecule C4H2I2S and R to the thiophene ring fragment C4H2S. Under valence ionization conditions, the singly charged parent molecule has a considerable survival probability. If dissociation occurs, it is prevalently via the ejection of neutral iodine(s), producing the (M–I)+ and the thiophene ring R+ fragments. The latter is accompanied by a hydrogen loss peak. Additional fracturing of the ring fragment can also occur, producing ions such as C3H2+. Note that the possible proton fragments fall outside the measurement range and the peaks below the S+ peak arise from the rest-gas due to the sample temperature and density being kept low.Spectrum (b) is the result of dissociation of a wide range of dicationic electronic states populated by the Auger decay of the 4d−1 state. In contrast to the valence-ionized spectrum (a), iodine cation ejection now occurs and it is the strongest detected fragment, followed by the intact thiophene ring (including hydrogen loss(es)). The ring fractures now, however, with a much higher probability, creating essentially all possible ring fragment ions. The peaks (except M++) in spectrum (b) are broadened compared to the ones in spectrum (a), due to the Coulomb repulsion between fragments, resulting in high fragment momenta. There is also a very small probability of creating stable parent dications (M++) in spectrum (b). The unlabelled peak at M = 30 u is likely NO+ and, as it appears in coincidence with I+, is due to nitrosyl iodide impurity.
3.2 Ion–ion coincidences, dissociation pathways and ion pair yields
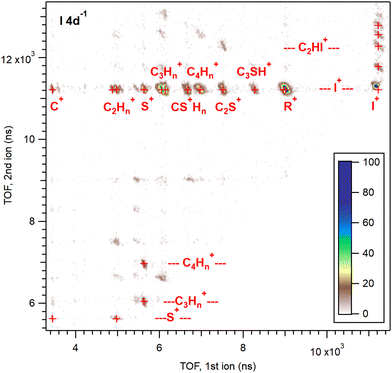
A more detailed picture of the dissociation pattern of multiply charged molecules is obtained by coincident analysis of the emitted ions. Fig. 4 shows the ion pairs in the PEPIPICO dataset, detected in coincidence with the iodine 4d photoelectrons. They are presented in the form of an ion–ion coincidence (PIPICO) map, where the flight times of the faster and slower ionic fragments in the ToF spectrometer are given by the x and y-axis, respectively. The number of ion pairs is color-coded in the 2D histogram. The third particle – the photoelectron detected in coincidence – acts as a filter in this presentation, allowing only the dissociation events arising from the 4d ionization. There is, however, a chance of combining electrons and ions from different ionization events, if those occur sufficiently close in time. Such “false” coincidences were subtracted from the PIPICO map using a random-triggered dataset measured simultaneously as interleaved with the electron triggers. A precise false background subtraction from a histogram representing a multi-particle coincidence requires a number of parameters to be known about the detection efficiencies etc.44 Here, we applied a more empirical technique where background PIPICO maps were constructed from (a) the random-triggered data and (b) combining ions from electron- and random-triggered data. These maps were then subtracted from the electron-triggered map, fine-tuning the multiplication coefficients by checking the intensity of the features that can only be false coincidences. For what will be our main region of interest, the (R+,I+) ion pairs, the coincidence purity was the following: 26 times more (R+,I+) ion pairs were produced in coincidence with the I 4d photoelectrons than by random triggers; 6.8 times more in coincidence with the Auger electrons (Ekin = 26–32 eV).Various ion pairs form islands in the PIPICO map, as labeled in Fig. 4. The most abundant fragment in Fig. 2, I+, combines with all other ionic fragments, but most prominently with the intact thiophene ring R+. In addition, the map contains weak patterns with both charges localized to the ring fragments and two neutral iodines ejected. The top quarter of the map contains pathways where one iodine remains attached to the ring or ring fragments. Outside the region shown, there are a few very weak two-body dissociation channels, (I+,RI+) and (CnHmI+,C4−nSH2−mI+).
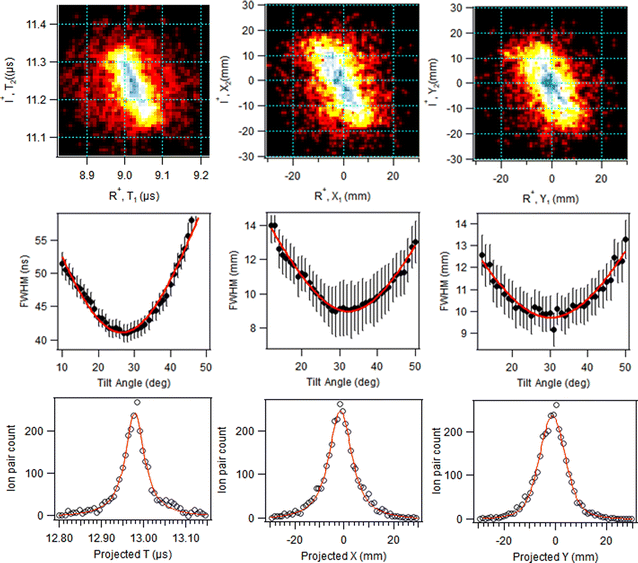
In the PIPICO map, the patterns for each ion pair are bar-shaped with a negative slope. The flight time of an ion increases from its nominal value (for the ion initially at rest), if the initial momentum from the dissociation points away from the ion detector (see Fig. 1), and decreases if the initial momentum is towards the detector. In a two-body dissociation, the momenta of the two ions are strictly antiparallel, therefore if the first ion's flight time decreases, the flight time of the second ion increases and vice versa. The slope of the pattern (in that case −1) thus represents the momentum correlation between the fragment ions. Note that the (I+,I+) pair exhibits only a half-pattern above the diagonal in this presentation.
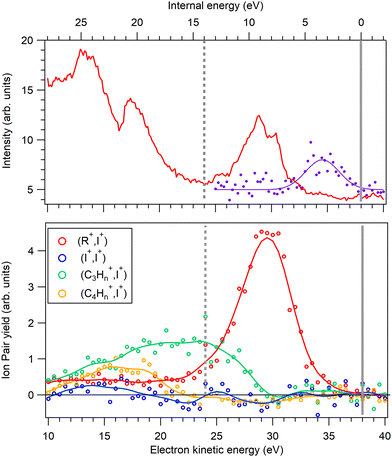
The PIPICO map in Fig. 4 presents an overall dissociation landscape associated with the I 4d ionization. By measuring these fragment ions in coincidence with the Auger electrons, one would obtain a much more differential picture with the dissociation landscape changing as different Auger final electronic states are populated (see Fig. 3). First, the top panel of Fig. 5 shows a noncoincident Auger electron spectrum following the I 4d ionization. The spectrum covers an about 30 eV range of the final dicationic states and the highest energy of the Auger electrons corresponds to the lowest possible energy of the final dicationic state M++. The energy of that state, relative to the neutral ground state, is the double ionization potential (DIP, Fig. 3).
It is difficult to locate this energy value in the electron spectrum, since the Auger intensities to the low-lying dicationic states can be quite weak. Therefore, we used the coincident ion yield (CIY) of the M++ ions with the Auger electron for DIP determination. M++ is the first ion to appear in the mass spectrum as the lowest M++ states are populated; as the internal energy increases, fragmentation becomes possible and the M++ signal disappears. From the right-hand slope of the M++ CIY curve in Fig. 5(top), we determined the DIP to be 22.6 eV above the neutral ground state energy, corresponding to 38.0 eV Auger electron's energy. DIP defines the origin of the the internal energy scale (the top axis). An inherent uncertainty in the correspondence between the Auger electron energy, DIP and the internal energy Eint arises because of the 1.7 eV spin–orbit splitting of the I 4d−1 state. The Auger spectrum therefore consists of two replicas, shifted by 1.7 eV, which imposes the uncertainty of the experimental internal energy scale.
Let us now turn to various other ion yields in the lower panel of Fig. 5. Since the dicationic dissociation pathways are much better defined by the ion pairs than single ions, we extracted coincident ion pair yields (CIPYs) as a function of the Auger electron energy, and consequently also as a function of the internal energy. The lower panel of Fig. 5 shows the CIPY curves of some of the most prominent ion pairs seen in the PIPICO map of Fig. 4. Since in the AEPIPICO measurement, the electron energy window was limited to about 16 eV, two separate datasets were recorded in order to cover the entire Auger spectrum. The datasets were joined together for the CIPY curves in Fig. 5, with the dataset separation energy shown as the dashed vertical line. One can see that, moving in the direction of increasing internal energy, after the M++ signal disappears, the first dissociation channel to open is (R+,I+). At higher internal energies, the ring starts to fragment, thus suppressing the (R+,I+) CIPY. The (I+,I+) CIPY is quite weak in the covered energy region, but it was a strong pattern in the overview PIPICO map. This is explained by (I+,I+) being a high-energy dissociation pathway, that only opens up at the high internal (low electron kinetic) energies that are to the left of the detected Auger electron energy windows in Fig. 5.
3.3 Timescales of the main dissociation pathway
Before reporting the experimental findings on momentum sharing in the (R+,I+) pattern, let us introduce the generalized secondary dissociation (GSD) model as a means of interpretation.
Thus, the basic description for the two-step three-body dissociation predicts the PIPICO slope of either −1 or −2.55, or the tilt angles of 45° and 21.4°, respectively. The tilt angle in the overview PIPICO map was 30.5°. It thus conforms to none of the three scenarios.
An obvious way to improve the model is by introducing a finite secondary dissociation distance in the process (iii), making a smooth transition from concerted to secondary dissociation. The momentum sharing and the resultant slope of the PIPICO pattern can be calculated knowing the masses of the charged fragments in the first stage:
| RI2++ → I+ + RI+, M(I+) = 127 u, M(RI+) = 209 u |
| RI+ → I + R+, M(I) = 127 u, M(R+) = 82 u. |
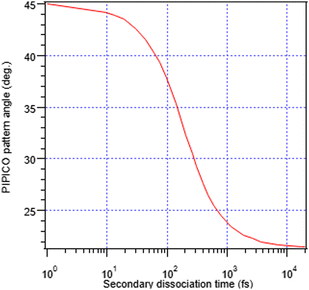
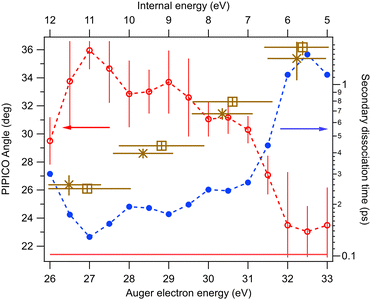
In addition, the initial separation of the I+ and RI+ fragments for the first stage is needed. We used 4.07 Å, the distance between I+ and the weighted centre of the RI+ fraction in the initial geometry, with weights according to the number of possible atomic valence vacancies. The variable in the model is the separation between the I+ and RI+ fragments at the moment of the secondary dissociation Tsec. Fig. 7 shows the relationship between the PIPICO pattern's tilt angle and Tsec, i.e., evolution from concerted to “pure” secondary dissociation in the GSD model. For example, the experimental tilt angle of 30° of the (R+,I+) pattern in the overview map in Fig. 4 corresponds to the secondary dissociation distance of 7.5 Å, which is reached in Tsec = 286 fs after the I+, RI+ charge separation. It should be noted that the model is quite sensitive to the initial distance parameter: using the unweighted mean of the atomic coordinates of the RI+ fragment gives about 0.25 Å shorter distance and a 25 fs smaller value for Tsec; a change of the initial distance by 1 Å gives about a 100 fs change in Tsec at this particular slope angle.
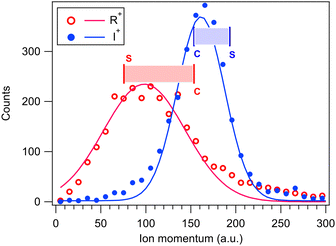
The GSD model predicts also the magnitudes of the momenta of the dissociation products, and as a consistency check, they are compared with the experimental momentum distributions from the PEPIPICO dataset in Fig. 8. The curves were extracted from (R+,I+) ion pairs and show quite broad momentum distribution for the R+ fragment and a narrower one at higher values for I+. Also marked at the figure are the GSD model values at the concerted and “pure” secondary dissociation limits, calculated using the I+,RI+ initial separation of 4.07 Å. The shaded ranges correspond to the transition region, where the R+ momentum increases and I+ momentum decreases. As can be seen, these ranges fit very well with the observed distributions.
One can see that at the lowest internal energies, near the appearance threshold of the (R+,I+) ion pair (Fig. 5), the angle approaches that of “pure” secondary dissociation (dashed horizontal line), where Tsec → ∞. The blue dots show the corresponding secondary dissociation times Tsec, as calculated from the GSD model (Fig. 7). In the low-internal-energy region, Tsec reaches 1.5 ps. It then decreases as the tilt angle increases with the internal energy. The largest angle, 36°, corresponds to Tsec of about 130 fs, approaching the faster process of concerted dissociation. At the highest internal energies, Eint > 10.5 eV, the tilt angle decreases again, although we note that in this region the PIPICO pattern has become quite diffuse and the tilt angle determination less accurate. This would be an unexpected behaviour, unless we consider the entire dissociation landscape. At around this energy, the next fragmentation pathway, the ion pair (C2Hn+,I+) (Fig. 5), opens up. Here, the ring itself fragments: R+ → C2Hn+ + C2SH2−n. Other factors than the internal energy, such as the electronic nature of the dicationic state of the parent molecule, may influence, which pathway the dissociation embarks on. Then there can be a subset of the initial ensemble following the slow RI2++ → R+ + I+ + I pathway and another, “fast” subset branching out into the more energetic 4-body pathway. Thus, opening up a new dissociation pathway may explain the reversal of the three-body pathway towards the slower secondary dissociation.
In general, the main experimental finding is the continuous change of the RI2++ → R+ + I+ + I process from nearly pure secondary dissociation as the pathway becomes energetically possible and opens, towards a faster, concerted three-body process as the available energy increases.
4 Computational simulations of dissociation timescales and comparison with experiment
In reality, even under precisely determined initial conditions, the C–I bond breakage times obviously vary from event to event; a statistical aspect that the analytical GSD model is not able to reproduce. In order to create a statistically more realistic description, we developed further the point charge Coulomb explosion model from earlier studies36,45 that has been specifically designed to simulate statistical distributions of experimentally measurable quantities – fragment charges, momenta and their correlations. There are many more advanced computational molecular dynamics tools,24,25,46–49 that give a much more accurate representation of the dynamics within the range of the molecular field, but are severely limited in determining the asymptotic behaviour of dissociation such as the charge localization and, consequently, the momenta obtained by the fragments. The model as presently applied is a stochastic charge hopping molecular mechanics model with simplified force field of molecular bonding. This light approach is focused on the asymptotic result and allows to generate large datasets directly comparable with the experiment. The detailed description and the used parameters are given in the ESI,† but the essential elements in modeling the fragmentation dynamics are:1. Atoms are treated as point charges with integer values (0, +e, +2e). The total molecular charge was +2e and the initial allocation of the charges was randomized, giving a basic representation of the broad range of the final states of the Auger transitions.
2. The +e unit charges are allowed to hop across the bonds between atoms during the dynamics. The hops are cut off at a critical distance given by the classical over-the barrier model.35
3. The molecular bonds are described by a simplified force field that includes the bond stretching and bending vibrations. For our purposes, obtaining and maintaining the optimum molecular and fragment geometries is not the primary objective; instead, the force field should be suited for realistic bond breakage description. Therefore, Morse potential energy curves were chosen to describe the bonds. Bending vibrations were included using a common force constant and the equilibrium angles were chosen either from the initial geometry of the molecule or as a linear geometry of the opened thiophene ring. The latter choice was made for the simulations reported here, due to supporting experimental and theoretical findings.21,22,24,25,50,51 Optionally, the bending force constant was also applied to restrict deviation of bonds from the initial plane of the molecule. No torsional forces were included. As non-bonding interactions, a repulsive potential wall was created around atoms.
At the start of the dynamics, the molecule was given internal energy, in addition to the potential energy of the coulombic repulsion of point charges. It is in the form of randomly distributed atomic velocities (internal temperature). Randomization for simulated datasets was obtained by (i) choice of the initial atomic velocities, (ii) initial charge localizations and (iii) redistributing charges across bonds during the hops.
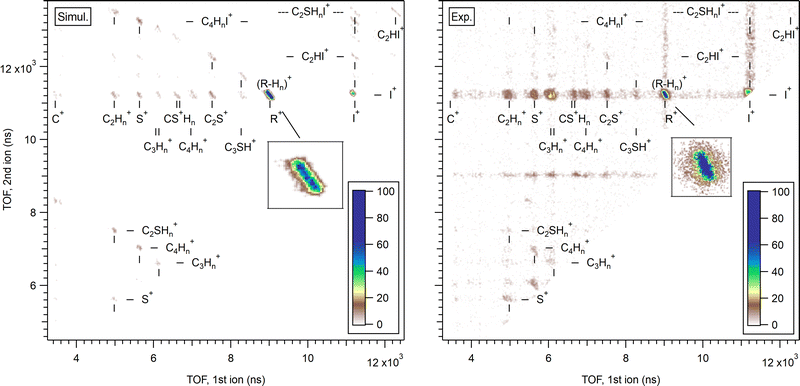
First, let us confirm whether the stochastic charge hopping molecular mechanics model gives a reasonable statistical description of the overall dissociation landscape. Fig. 10 shows a comparison of a simulated PIPICO map with the experimental one. The fragment mass and charge values together with the pz projections of their momenta were converted to the ion TOF values, using the conversion factors corresponding to our experimental conditions. The ion momenta were obtained in the fixed frame-of-reference for the Monte Carlo dataset of trajectories, but random, isotropic frame rotation was then applied for each trajectory in order to simulate the isotropic orientation of the gas-phase molecules in the experiments. The simulation was run with Eint = 7 eV initial energy. However, charge hopping in this point-charge model tends to create a drift towards higher internal energies, due to the molecule starting to accommodate its geometry to a particular charge configuration between the hops, which then tend to bring the molecule into an energetically less favourable geometry. This slight random drift causes the trajectories to be generated for a range of eventual internal energies. Although at first glance a completely unphysical feature, such energy drift can in fact be regarded as a basic representation of internal energy conversion, where the seemingly external energy source would be the relaxation of the electronic structure that is not a part of this model. Here, only the trajectories with the internal energy less than 9 eV were selected for generating the left-hand PIPICO map in Fig. 10. As noted above, the equilibrium C–C–C, C–C–S and C–S–C bond angles of a linear geometry were chosen, and the trajectories therefore started from a non-equilibrium cyclic geometry. Equivalent simulations were run with the equilibrium bond angles of the ring structure; no significant differences in the outcome as the PIPICO map were found.
The right-hand side shows the experimental AEPIPICO map constructed from the events with the Auger electron energy Ekin = 29–32 eV (Eint = 6–9 eV). Note that this experimental map is quite different than the overview PEPIPICO map in Fig. 4, since the latter, measured in coincidence with the I 4d photoelectrons, includes all Auger transitions. The experimental map shows faint horizontal and vertical bands, especially associated with the strongest fragment ions I+ and R+. These are due to residual false coincidence events. Both have the (R+,I+) pattern as the dominating one, followed by the weaker (I+,I+) pattern. In contrast to the overview PEPIPICO map, here all other patterns are of much less intensity. These are, however, present in both the simulated and experimental map. The simulation also has a very weak two-body pattern (C2HI+,C2SHI+) in the top-right corner of the map; it is unobservable in the experimental map. The excess heavy-fragment patterns in the simulations is most likely due to the limited integration time (2 ps), as secondary dissociation events would slowly deplete these patterns, were the simulation to continue.
Let us now concentrate once again on the main pathway of interest, RI2++ → R+ + I+ + I. The insets of Fig. 10 show the corresponding PIPICO pattern for both the simulated and experimental dataset. It appears to have a larger slope in the latter, suggesting that the simulation is not well describing the momentum sharing. However, this discrepancy is explained below after scrutinizing the time information from individual trajectories. While for the experiment, the secondary dissociation time Tsec was deduced from the tilt angle of the (R+,I+) pattern using the GSD model, in the simulation the bond breakage times are directly available from each trajectory. Fig. 11 shows the histogram of the I–C bond breakage times, for yielding both the charged and neutral atomic iodine fragments. Same as for the PIPICO map, the analyzed trajectories were restricted to the Eint < 9 eV range.
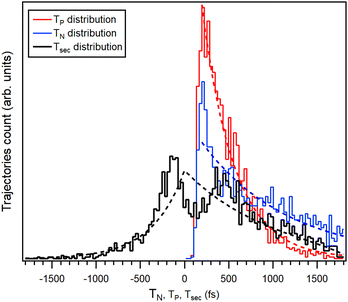 | ||
| Fig. 11 Time distributions of the C–I bond breakage events in the simulated trajectories with Eint = 7 eV, for neutral (blue) and charged (red) iodine separtion. Colored dashed lines are fits by exponential decay function. The black curve is the distribution of the trajectories by the secondary dissociation time Tsec and the black dashed line is the distribution obtained by eqn (1). | ||
The simplest statistical description of these distribution functions is that of constant-rate, exponential decay. The distributions from the simulation were fitted with a delayed exponential function, the delay occuring due to the minimum time required to reach the bond breakage distance. The decay time constants τP = 366(14) fs and τN = 974(75) fs were obtained for the ejection of charged and neutral iodine fragments, respectively. It can thus be seen that in the simulation, the neutral iodine separation is a significantly slower process. The difference between the neutral and charged iodine separation times from the ring gives the secondary dissociation time Tsec in each trajectory and the corresponding histogram is also shown in Fig. 11. Trajectories in the histogram at Tsec = 0 are concerted dissociation and at Tsec > 0 develop into secondary dissociation. There is also a large number of trajectories with Tsec < 0 that represent deferred charge separation.
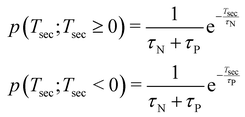
The basic assumption regarding the the two iodine separation events can be either that they are independent or that they are correlated, such as when the first bond break significantly changes the likelihood of the second bond breakage within a certain time period. Let us consider the former, simpler case. We mark the probability distribution function of the neutral and charged iodine separating as fN(t;t ≥ 0) and fP(t;t ≥ 0), respectively. Then, the probability that the second bond break occurs after time Tsec is given as
 | (1) |
 | (2) |
Fig. 11 also shows the secondary dissociation time distribution, calculated using eqn (1) and the fitted exponential decay time constants. As seen, the asymptotic behaviour reaching the deferred charge separation and the “pure” secondary dissociation limits is well described by independently occuring neutral and charged iodine separations, with their respective rate constants. In the region near the concerted dissociation, |Tsec| < 500 fs, the simulations exhibit significant correlation between the two events. Namely, by suppressing the separation of the second iodine, whether neutral or charged, for up to ≈200 fs after the first event and with the corresponding pile-up at ≈200–400 fs. However, we are reluctant to ascribe a physical relevance to these correlation features without further studies. Furthermore, the entire deferred charge separation wing of the distribution cannot be confirmed by experimental data. All the trajectories with Tsec negative or zero contribute as PIPICO patterns with the tilt angle of 45° and constitute about 36% of the simulated trajectories in the Eint < 9 eV range. The basic charge hopping model used in the simulations allows for charge location and delocation on the iodine atoms with fixed probability up to the C–I bond length at which the Coulomb barrier is reached (5.51 Å), dropping abruptly to zero after that. Due to lack of experimental evidence, we regard the deferred charge separation branch at this stage of the model development, as a possible model artefact. This also explains the difference in slopes of the simulated and experimental PIPICO patterns, as the slope of the simulated pattern, with the trajectories with Tsec < 0 discarded, becomes steeper.
Lastly, we note that the exponential time constants τN and τP are not the best measure to compare with the GSD model values from the experiment, since about 63% of the events occur before that time. We therefore use the “half-life” value T1/2 = ln![[thin space (1/6-em)]](https://www.rsc.org/images/entities/char_2009.gif) 2 ×τ: T1/2P = 254(10) fs and T1/2N = 675(52) fs, where the error bars reflect the confidence level of the exponential fit.
2 ×τ: T1/2P = 254(10) fs and T1/2N = 675(52) fs, where the error bars reflect the confidence level of the exponential fit.
Similar simulations and and the time analysis of the RI2++ → R+ + I+ + I pathway was carried out for a number of internal energies, Eint = 3, 5, 7, 9 and 11 eV. The secondary dissociation times Tsec thus obtained are plotted in Fig. 9 together with the Tsec values derived from the Auger electron-ion–ion coincidence experiment. The two sets of simulated values differ by the absence (×) or presence (⊡) of forces returning the atoms to the molecular plane. The predictions of the model for the secondary dissociation time fit well with the 100 fs to 1 ps timescale range of the experiment. A closer look at the modeled trajectories shows that the C–I bond breaks do not occur at a particular point in the evolution of the overall geometry, but are described more as a statistical process due to fluctuating internal energy and Coulomb repulsion. The stochastic molecular mechanics model used here included the strongest vibrational interactions – bond stretching and bending – with the highest capacity to store the high amount of internal energy. While a more advanced modeling can well achieve a better quantitative agreement with the experiment, it is unlikely that low-energy vibrational modes such as torsional motion significantly affect the characteristic timescales of the dissociation reaction.
When the simulated ln(1/Tsec) values are plotted against 1/Eint, they follow a linear trend. In accordance to the Arrhenius equation, the slope of that trend is the activation energy of the reaction and from a linear fit, we obtained the activation energy value as 20 eV. This is much higher than the C–I bond dissociation energy, which in the model was taken as 1.78 eV. This large difference indicates that even in our quite simple model, the bond breaks cannot be statistically reduced to simply the issue of average internal energy in a degree of freedom vs. bond dissociation energy.
5 Conclusions
A detailed momentum correlation analysis of the main dicationic dissociation pathway of 2,5 diiodothiophene, RI2++ → R+ + I+ + I, allowed us to retrieve quantitative time-scale information on this three-body reaction from a non-time-resolved experiment. By utilizing the high electron energy resolution in a synchrotron-based Auger-electron multi-ion coincidence measurement, the dependence of the time-scale of this unimolecular reaction on the available internal energy was revealed. We observed that the reaction model approached that of secondary dissociation at low available energies near the appearance energy of this dissociation pathway. In the analysis using the generalized secondary dissociation model, and connecting it to the momentum correlations in the PIPICO patterns of (R+,I+), we determined the longest secondary ionization time between the separation of charged and neutral iodines to be 1.5 ps when the internal energy was less than 6 eV. As the energy increased, the secondary dissociation time decreased rapidly, reaching the shortest experimental value of 129 fs at the internal energy of 11 eV just before this dissociation pathway was quenched by other, more energetic pathways. Thus, over the energy range of this pathway, more than tenfold increase of the reaction speed occurred, moving closer to the concerted dissociation dynamics.The experimental results were compared to the statistical analysis of stochastic charge-hopping molecular mechanics simulations. Somewhat unexpectedly, given the simplicity of the description of the molecular environment, the model gave results with a fair quantitative agreement with the experiment. This suggests that the timescales of such unimolecular reactions, although very sensitive to the initial conditions, do not require accurate details of the electronic structure for modeling. Instead, in a molecule of this size, inclusion of the available energy in the form of internal temperature leads to a reasonable representation of the timescales of the bond-breaks. In other words, the molecule's ability to contain the energy in the reservoir of its vibrational degrees of freedom over a statistical, energy-dependent time period appears to be a key factor.
Such reconstructions of early dissociation events and timescales from energy-resolved multi-particle coincidence experiments, based on the accumulated momentum “history” of fragments, can be a valuable complement to time-resolved experiments as they can be combined with a precise control over the initial conditions at the onset of the molecular dynamics that is achievable in experiments at synchrotron radiation sources.
Conflicts of interest
There are no conflicts to declare.Acknowledgements
EK acknowledges funding by the Academy of Finland. LP acknowledges financial support from The Vilho, Yrjö and Kalle Väisälä Foundation of the Finnish Academy of Science and Letters. SM acknowledges financial support from Knut and Alice Wallenberg Foundation and the COST Action CA18212 – Molecular Dynamics in the GAS phase (MD-GAS), supported by COST (European Cooperation in Science and Technology). KK acknowledges funding by Academy of Finland and Estonian Research Council (grant PRG551). We acknowledge MAX IV Laboratory for time on Beamline FinEstBeAMS under proposal 20190446. Research conducted at MAX IV, a Swedish national user facility, is supported by the Swedish Research council under contract 2018-07152, the Swedish Governmental Agency for Innovation Systems under contract 2018-04969, and Formas under contract 2019-02496. We also thank Dr J. Niskanen for fruitful scientific discussions on the topic.References
- L. Young, K. Ueda, M. Gühr, P. H. Bucksbaum, M. Simon, S. Mukamel, N. Rohringer, K. C. Prince, C. Masciovecchio, M. Meyer, A. Rudenko, D. Rolles, C. Bostedt, M. Fuchs, D. A. Reis, R. Santra, H. Kapteyn, M. Murnane, H. Ibrahim, F. Légaré, M. Vrakking, M. Isinger, D. Kroon, M. Gisselbrecht, A. LHuillier, H. J. Wörner and S. R. Leone, J. Phys. B: At., Mol. Opt. Phys., 2018, 51, 032003 CrossRef.
- N. Berrah, Phys. Scr., 2016, T169, 014001 CrossRef.
- C. Milne, T. Penfold and M. Chergui, Coord. Chem. Rev., 2014, 277–278, 44–68 CrossRef CAS.
- J. W. McManus, T. Walmsley, K. Nagaya, J. R. Harries, Y. Kumagai, H. Iwayama, M. N. Ashfold, M. Britton, P. H. Bucksbaum, B. Downes-Ward, T. Driver, D. Heathcote, P. Hockett, A. J. Howard, E. Kukk, J. W. L. Lee, Y. Liu, D. Milesevic, R. S. Minns, A. Niozu, J. Niskanen, A. J. Orr-Ewing, S. Owada, D. Rolles, P. A. Robertson, A. Rudenko, K. Ueda, J. Unwin, C. Vallance, M. Burt, M. Brouard, R. Forbes and F. Allum, Phys. Chem. Chem. Phys., 2022, 24, 22699–22709 RSC.
- E. Kukk, H. Fukuzawa, J. Niskanen, K. Nagaya, K. Kooser, D. You, J. Peschel, S. Maclot, A. Niozu and S. Saito, Phys. Rev. Res., 2021, 3, 013221 CrossRef CAS.
- T. Jahnke, R. Guillemin, L. Inhester, S.-K. Son, G. Kastirke, M. Ilchen, J. Rist, D. Trabert, N. Melzer, N. Anders, T. Mazza, R. Boll, A. De Fanis, V. Music, T. Weber, M. Weller, S. Eckart, K. Fehre, S. Grundmann, A. Hartung, M. Hofmann, C. Janke, M. Kircher, G. Nalin, A. Pier, J. Siebert, N. Strenger, I. Vela-Perez, T. Baumann, P. Grychtol, J. Montano, Y. Ovcharenko, N. Rennhack, D. Rivas, R. Wagner, P. Ziolkowski, P. Schmidt, T. Marchenko, O. Travnikova, L. Journel, I. Ismail, E. Kukk, J. Niskanen, F. Trinter, C. Vozzi, M. Devetta, S. Stagira, M. Gisselbrecht, A. Jäger, X. Li, Y. Malakar, M. Martins, R. Feifel, L. Schmidt, A. Czasch, G. Sansone, D. Rolles, A. Rudenko, R. Moshammer, R. Dörner, M. Meyer, T. Pfeifer, M. Schöffler, R. Santra, M. Simon and M. Piancastelli, Phys. Rev. X, 2021, 11, 041044 CAS.
- K. Ueda, E. Sokell, S. Schippers, F. Aumayr, H. Sadeghpour, J. Burgdörfer, C. Lemell, X.-M. Tong, T. Pfeifer, F. Calegari, A. Palacios, F. Martin, P. Corkum, G. Sansone, E. V. Gryzlova, A. N. Grum-Grzhimailo, M. N. Piancastelli, P. M. Weber, T. Steinle, K. Amini, J. Biegert, N. Berrah, E. Kukk, R. Santra, A. Müller, D. Dowek, R. R. Lucchese, C. W. McCurdy, P. Bolognesi, L. Avaldi, T. Jahnke, M. S. Schöffler, R. Dörner, Y. Mairesse, L. Nahon, O. Smirnova, T. Schlathölter, E. E. B. Campbell, J.-M. Rost, M. Meyer and K. A. Tanaka, J. Phys. B: At., Mol. Opt. Phys., 2019, 52, 171001 CrossRef CAS.
- P. Çarçabal, D. Descamps, S. Petit, Y. Mairesse, V. Blanchet and R. Cireasa, Faraday Discuss., 2016, 194, 407–425 RSC.
- R. Geneaux, H. J. B. Marroux, A. Guggenmos, D. M. Neumark and S. R. Leone, Philos. Trans. R. Soc., A, 2019, 377, 20170463 CrossRef CAS PubMed.
- N. Hartmann, S. Bhattacharyya, F. Schlaepfer, M. Volkov, Z. Schumacher, M. Lucchini, L. Gallmann, U. Rothlisberger and U. Keller, Phys. Chem. Chem. Phys., 2019, 21, 18380–18385 RSC.
- A. Boyer, M. Hervé, V. Despré, P. Castellanos Nash, V. Loriot, A. Marciniak, A. Tielens, A. Kuleff and F. Lépine, Phys. Rev. X, 2021, 11, 041012 CAS.
- A. Boyer, M. Hervé, A. Scognamiglio, V. Loriot and F. Lépine, Phys. Chem. Chem. Phys., 2021, 23, 27477–27483 RSC.
- F. Lépine, M. Y. Ivanov and M. J. J. Vrakking, Nat. Photonics, 2014, 8, 195–204 CrossRef.
- S. Maclot, J. Lahl, J. Peschel, H. Wikmark, P. Rudawski, F. Brunner, H. Coudert-Alteirac, S. Indrajith, B. A. Huber, S. Díaz-Tendero, N. F. Aguirre, P. Rousseau and P. Johnsson, Sci. Rep., 2020, 10, 2884 CrossRef CAS PubMed.
- H. Köckert, J. W. L. Lee, F. Allum, K. Amini, S. Bari, C. Bomme, F. Brauße, M. Brouard, M. Burt, B. Cunha de Miranda, S. Düsterer, P. Eng-Johnsson, B. Erk, M. Géléoc, R. Geneaux, A. S. Gentleman, R. Guillemin, G. Goldsztejn, D. M. P. Holland, I. Ismail, L. Journel, T. Kierspel, J. Küpper, J. Lahl, S. R. Mackenzie, S. Maclot, B. Manschwetus, A. S. Mereshchenko, T. Mullins, P. K. Olshin, J. Palaudoux, F. Penent, M. N. Piancastelli, D. Rompotis, A. Rouzée, T. Ruchon, A. Rudenko, N. Schirmel, M. Simon, S. Techert, O. Travnikova, S. Trippel, C. Vallance, E. Wang, J. Wiese, F. Ziaee, T. Marchenko, D. Rolles and R. Boll, J. Phys. B: At., Mol. Opt. Phys., 2022, 55, 014001 CrossRef.
- T. Arion and U. Hergenhahn, J. Electron Spectrosc. Relat. Phenom., 2015, 200, 222–231 CrossRef CAS.
- M. Wöstmann, R. Mitzner, T. Noll, S. Roling, B. Siemer, F. Siewert, S. Eppenhoff, F. Wahlert and H. Zacharias, J. Phys. B: At., Mol. Opt. Phys., 2013, 46, 164005 CrossRef.
- N. Berrah, L. Fang, B. F. Murphy, E. Kukk, T. Y. Osipov, R. Coffee, K. R. Ferguson, H. Xiong, J.-C. Castagna, V. S. Petrovic, S. C. Montero and J. D. Bozek, Opt. Express, 2016, 24, 11768 CrossRef CAS PubMed.
- S. Serkez, W. Decking, L. Froehlich, N. Gerasimova, J. Grünert, M. Guetg, M. Huttula, S. Karabekyan, A. Koch, V. Kocharyan, Y. Kot, E. Kukk, J. Laksman, P. Lytaev, T. Maltezopoulos, T. Mazza, M. Meyer, E. Saldin, E. Schneidmiller, M. Scholz, S. Tomin, M. Vannoni, T. Wohlenberg, M. Yurkov, I. Zagorodnov and G. Geloni, Appl. Sci., 2020, 10, 2728 CrossRef CAS.
- G. Lanzani, G. Cerullo, S. Stagira and S. De Silvestri, J. Photochem. Photobiol., A, 2001, 144, 13–19 CrossRef CAS.
- R. Weinkauf, L. Lehr, E. W. Schlag, S. Salzmann and C. M. Marian, Phys. Chem. Chem. Phys., 2008, 10, 393–404 RSC.
- S. Salzmann, M. Kleinschmidt, J. Tatchen, R. Weinkauf and C. M. Marian, Phys. Chem. Chem. Phys., 2008, 10, 380–392 RSC.
- P. Kölle, T. Schnappinger and R. de Vivie-Riedle, Phys. Chem. Chem. Phys., 2016, 18, 7903–7915 RSC.
- E. Kukk, D. T. Ha, Y. Wang, D. G. Piekarski, S. Diaz-Tendero, K. Kooser, E. Itälä, H. Levola, M. Alcamí, E. Rachlew and F. Martín, Phys. Rev. A: At., Mol., Opt. Phys., 2015, 91, 043417 CrossRef.
- T. Schnappinger, P. Kölle, M. Marazzi, A. Monari, L. González and R. de Vivie-Riedle, Phys. Chem. Chem. Phys., 2017, 19, 25662–25670 RSC.
- S. Pathak, L. M. Ibele, R. Boll, C. Callegari, A. Demidovich, B. Erk, R. Feifel, R. Forbes, M. Di Fraia, L. Giannessi, C. S. Hansen, D. M. P. Holland, R. A. Ingle, R. Mason, O. Plekan, K. C. Prince, A. Rouzée, R. J. Squibb, J. Tross, M. N. R. Ashfold, B. F. E. Curchod and D. Rolles, Nat. Chem., 2020, 12, 795–800 CrossRef CAS PubMed.
- L. Pihlava, J. Niskanen, K. Kooser, C. StrÅhlman, S. Maclot, A. Kivimäki and E. Kukk, Phys. Chem. Chem. Phys., 2021, 23, 21249 RSC.
- G. Turkoglu, M. E. Cinar and T. Ozturk, Top. Curr. Chem., 2017, 375, 84 CrossRef PubMed.
- L. Vallan, E. Istif, I. J. Gómez, N. Alegret and D. Mantione, Polymers, 2021, 13, 1977 CrossRef CAS PubMed.
- T. Yamamoto, NPG Asia Mater., 2010, 2, 54–60 CrossRef.
- B. Capozzi, E. J. Dell, T. C. Berkelbach, D. R. Reichman, L. Venkataraman and L. M. Campos, J. Am. Chem. Soc., 2014, 136, 10486–10492 CrossRef CAS PubMed.
- D. You, H. Fukuzawa, Y. Luo, S. Saito, M. Berholts, T. Gaumnitz, M. Huttula, P. Johnsson, N. Kishimoto, H. Myllynen, A. Nemer, A. Niozu, M. Patanen, E. Pelimanni, T. Takanashi, S.-I. Wada, N. Yokono, S. Owada, K. Tono, M. Yabashi, K. Nagaya, E. Kukk and K. Ueda, Phys. Chem. Chem. Phys., 2019, 22, 2648–2659 RSC.
- S. Makurat, P. Spisz, W. Kozak, J. Rak and M. Zdrowowicz, Int. J. Mol. Sci., 2019, 20, 1308 CrossRef CAS PubMed.
- T. Takanashi, K. Nakamura, E. Kukk, K. Motomura, H. Fukuzawa, K. Nagaya, S.-I. Wada, Y. Kumagai, D. Iablonskyi, Y. Ito, Y. Sakakibara, D. You, T. Nishiyama, K. Asa, Y. Sato, T. Umemoto, K. Kariyazono, K. Ochiai, M. Kanno, K. Yamazaki, K. Kooser, C. Nicolas, C. Miron, T. Asavei, L. Neagu, M. Schöffler, G. Kastirke, X.-J. Liu, A. Rudenko, S. Owada, T. Katayama, T. Togashi, K. Tono, M. Yabashi, H. Kono and K. Ueda, Phys. Chem. Chem. Phys., 2017, 19, 19707–19721 RSC.
- R. Boll, B. Erk, R. Coffee, S. Trippel, T. Kierspel, C. Bomme, J. D. Bozek, M. Burkett, S. Carron, K. R. Ferguson, L. Foucar, J. Küpper, T. Marchenko, C. Miron, M. Patanen, T. Osipov, S. Schorb, M. Simon, M. Swiggers, S. Techert, K. Ueda, C. Bostedt, D. Rolles and A. Rudenko, Struct. Dyn., 2016, 3, 043207 CrossRef PubMed.
- K. Motomura, E. Kukk, H. Fukuzawa, S.-I. Wada, K. Nagaya, S. Ohmura, S. Mondal, T. Tachibana, Y. Ito, R. Koga, T. Sakai, K. Matsunami, A. Rudenko, C. Nicolas, X.-J. Liu, C. Miron, Y. Zhang, Y. Jiang, J. Chen, M. Anand, D. E. Kim, K. Tono, M. Yabashi, M. Yao and K. Ueda, J. Phys. Chem. Lett., 2015, 6, 2944–2949 CrossRef CAS PubMed.
- B. Erk, R. Boll, S. Trippel, D. Anielski, L. Foucar, B. Rudek, S. W. Epp, R. Coffee, S. Carron, S. Schorb, K. R. Ferguson, M. Swiggers, J. D. Bozek, M. Simon, T. Marchenko, J. Kupper, I. Schlichting, J. Ullrich, C. Bostedt, D. Rolles and A. Rudenko, Science, 2014, 345, 288–291 CrossRef CAS PubMed.
- K. Nagaya, K. Motomura, E. Kukk, H. Fukuzawa, S. Wada, T. Tachibana, Y. Ito, S. Mondal, T. Sakai, K. Matsunami, R. Koga, S. Ohmura, Y. Takahashi, M. Kanno, A. Rudenko, C. Nicolas, X.-J. Liu, Y. Zhang, J. Chen, M. Anand, Y. Jiang, D.-E. Kim, K. Tono, M. Yabashi, H. Kono, C. Miron, M. Yao and K. Ueda, Phys. Rev. X, 2016, 6, 21035 Search PubMed.
- L. Fang, H. Xiong, E. Kukk and N. Berrah, Appl. Sci., 2017, 7, 529 CrossRef.
- F. Allum, M. Burt, K. Amini, R. Boll, H. Köckert, P. K. Olshin, S. Bari, C. Bomme, F. Brauße, B. Cunha de Miranda, S. Düsterer, B. Erk, M. Géléoc, R. Geneaux, A. S. Gentleman, G. Goldsztejn, R. Guillemin, D. M. P. Holland, I. Ismail, P. Johnsson, L. Journel, J. Küpper, J. Lahl, J. W. L. Lee, S. Maclot, S. R. Mackenzie, B. Manschwetus, A. S. Mereshchenko, R. Mason, J. Palaudoux, M. N. Piancastelli, F. Penent, D. Rompotis, A. Rouzée, T. Ruchon, A. Rudenko, E. Savelyev, M. Simon, N. Schirmel, H. Stapelfeldt, S. Techert, O. Travnikova, S. Trippel, J. G. Underwood, C. Vallance, J. Wiese, F. Ziaee, M. Brouard, T. Marchenko and D. Rolles, J. Chem. Phys., 2018, 149, 204313 CrossRef PubMed.
- R. Pärna, R. Sankari, E. Kukk, E. Nõmmiste, M. Valden, M. Lastusaari, K. Kooser, K. Kokko, M. Hirsimäki, S. Urpelainen, P. Turunen, A. Kivimäki, V. Pankratov, L. Reisberg, F. Hennies, H. Tarawneh, R. Nyholm and M. Huttula, Nucl. Instrum. Methods Phys. Res., Sect. A, 2017, 859, 83–89 CrossRef.
- K. Chernenko, A. Kivimäki, R. Pärna, W. Wang, R. Sankari, M. Leandersson, H. Tarawneh, V. Pankratov, M. Kook, E. Kukk, L. Reisberg, S. Urpelainen, T. Käämbre, F. Siewert, G. Gwalt, A. Sokolov, S. Lemke, S. Alimov, J. Knedel, O. Kutz, T. Seliger, M. Valden, M. Hirsimäki, M. Kirm and M. Huttula, J. Synchrotron Radiat., 2021, 28, 1620–1630 CrossRef CAS PubMed.
- K. Kooser, A. Kivimäki, P. Turunen, R. Pärna, L. Reisberg, M. Kirm, M. Valden, M. Huttula and E. Kukk, J. Synchrotron Radiat., 2020, 27, 1080–1091 CrossRef CAS PubMed.
- G. Prümper and K. Ueda, Nucl. Instrum. Methods Phys. Res., Sect. A, 2007, 574, 350–362 CrossRef.
- E. Kukk, H. Myllynen, K. Nagaya, S. Wada, J. D. Bozek, T. Takanashi, D. You, A. Niozu, K. Kooser, T. Gaumnitz, E. Pelimanni, M. Berholts, S. Granroth, N. Yokono, H. Fukuzawa, C. Miron and K. Ueda, Phys. Rev. A, 2019, 99, 023411 CrossRef CAS.
- D. Marx and J. Hutter, Ab Initio Molecular Dynamics: Basic Theory and Advanced Methods, Cambridge University Press, 1st edn, 2009 Search PubMed.
- N. Sakhaee, S. Sakhaee, E. Doustkhah and A. Mobaraki, Curr. Organocatal., 2021, 8, 228–237 CrossRef CAS.
- Z. Li, L. Inhester, C. Liekhus-Schmaltz, B. F. E. Curchod, J. W. Snyder, N. Medvedev, J. Cryan, T. Osipov, S. Pabst, O. Vendrell, P. Bucksbaum and T. J. Martinez, Nat. Commun., 2017, 8, 453 CrossRef PubMed.
- D. T. Ha, K. Yamazaki, Y. Wang, M. Alcamí, S. Maeda, H. Kono, F. Martin and E. Kukk, J. Chem. Phys., 2016, 145, 094302 CrossRef CAS PubMed.
- B. Marchetti, T. N. V. Karsili, O. Kelly, P. Kapetanopoulos and M. N. R. Ashfold, J. Chem. Phys., 2015, 142, 224303 CrossRef PubMed.
- V. S. Petrović, M. Siano, J. L. White, N. Berrah, C. Bostedt, J. D. Bozek, D. Broege, M. Chalfin, R. N. Coffee, J. Cryan, L. Fang, J. P. Farrell, L. J. Frasinski, J. M. Glownia, M. Gühr, M. Hoener, D. M. P. Holland, J. Kim, J. P. Marangos, T. Martinez, B. K. McFarland, R. S. Minns, S. Miyabe, S. Schorb, R. J. Sension, L. S. Spector, R. Squibb, H. Tao, J. G. Underwood and P. H. Bucksbaum, Phys. Rev. Lett., 2012, 108, 253006 CrossRef PubMed.
Footnotes |
| † Electronic supplementary information (ESI) available. See DOI: https://doi.org/10.1039/d2cp05309h |
| ‡ Present address: Institut Lumière Matière UMR 5306, Université Claude Bernard Lyon 1, CNRS, Univ Lyon, 69100 Villeurbanne, France. |
| This journal is © the Owner Societies 2023 |

