
 Open Access Article
 This Open Access Article is licensed under a
 Creative Commons Attribution 3.0 Unported Licence
Can the absolute configuration of cyclic peptides be determined with vibrational circular dichroism?†
Karolina Di Remigio
Eikås
 *a,
Monika
Krupová
a,
Tone
Kristoffersen
b,
Maarten T. P.
Beerepoot
b and
Kenneth
Ruud
*ac
*a,
Monika
Krupová
a,
Tone
Kristoffersen
b,
Maarten T. P.
Beerepoot
b and
Kenneth
Ruud
*ac
aHylleraas Centre for Quantum Molecular Sciences, Department of Chemistry, UiT The Arctic University of Norway, 9037 Tromsø, Norway. E-mail: karolina.s.eikas@uit.no; kenneth.ruud@uit.no
bDepartment of Chemistry, UiT The Arctic University of Norway, 9037 Tromsø, Norway
cNorwegian Defence Research Establishment, P.O. Box 25, 2027 Kjeller, Norway
First published on 16th May 2023
Abstract
Cyclic peptides show a wide range of biological activities, among others as antibacterial agents. These peptides are often large and flexible with multiple chiral centers. The determination of the stereochemistry of molecules with multiple chiral centers is a challenging and important task in drug development. Chiroptical spectroscopies such as vibrational circular dichroism (VCD) can distinguish between different stereoisomers. The absolute configuration (AC) of a stereoisomer can be determined by comparing its experimental spectra to computed spectra of stereoisomers with known AC. In this way, the AC of rigid molecules with up to seven chiral centers has been assigned (Bogaerts et al., Phys. Chem. Chem. Phys., 2020, 22, 18014). The question arises whether this is possible with more conformationally flexible molecules such as cyclic peptides. We here investigate to what extent the AC of cyclic peptides can be determined with VCD. More specifically, we investigate the maximum number of chiral centers a cyclic peptide can have in order to be able to unambiguously assign the AC with VCD. We present experimental and computed IR and VCD spectra for a series of eight tetrapeptides and hexapeptides with two, three and four chiral centers. We use our recently developed computational protocol with a conformational search based on sampling with meta-dynamics. We use visual inspection to compare the computed spectra of different stereoisomers with an experimental spectrum of the corresponding cyclic peptide with known AC. We find that the AC of the investigated cyclic peptides with two chiral centers can be unambiguously assigned with VCD. This is however not possible for all of the cyclic peptides with three chiral centers and for none of those with four chiral centers. At best, one can limit the number of possible stereoisomers in those cases. Our work shows that other techniques are needed to assign the AC of cyclic peptides with three or more chiral centers. Our study also constitutes a warning that the spectra of all stereoisomers should be computed before attempting to match to an experimental spectrum, to avoid an accidental erroneous match.
Introduction
Cyclic peptides show a wide range of biological activities as antitumor drugs, immunosuppressors and antimicrobial agents, to name a few.1–3 They are often large, flexible and can include multiple chiral centers. The determination of the stereochemistry of molecules with multiple chiral centers is a challenging and important task in drug development. Indeed, the physiological function of a medicinal drug depends strongly on its stereochemistry. Two enantiomers of a chiral compound may have different effects on the human organism; one of them can function as a life-saving drug, while the other may have no function or, in the worst case, cause severe damage to the patient.4 Although enantiomers can have different biological effects, almost all of their physical properties are the same. Hence, common structure elucidation techniques such as mass spectrometry, nuclear magnetic resonance (NMR) or infrared spectroscopy (IR) are often not sufficient to determine their absolute configuration (AC), even though a combination of computational methods and advanced statistical methods has shown promise in structure elucidation of small molecules with NMR.5 One technique that has been frequently used to determine the AC of chiral molecules is X-ray crystallography. This method requires extensive experimental work and may fail in certain cases.6 Many molecules fail to crystallize, and even if a crystal can be obtained and the AC determined, the crystal structure may deviate from the structure in solution, preventing a clear identification of structure–activity relationships.Various methods of chiroptical spectroscopy can be used to determine the chirality of organic compounds.7–9 Vibrational circular dichroism (VCD)10 has recently been extensively used in the pharmaceutical industry to determine the AC of chiral drugs.8,11,12 While IR measures the absorption of infrared light, VCD measures the difference in absorption of left- and right-circularly polarized light in the infrared energy range. Since this differential absorption varies for enantiomers, VCD, in contrast to IR, can distinguish between enantiomers and help to determine the AC of chiral compounds, since two enantiomers have equal VCD spectra with opposite sign. The situation gets more complicated, however, for molecules with more than one chiral center where one distinguishes between enantiomers and diastereomers. Enantiomers have different stereochemistry in all chiral centers, are mirror images of each other and have equal VCD spectra with opposite signs. Diastereomers have different stereochemistry in at least one but not all chiral centers and may have VCD spectra that are more different than only a sign change.
Unambiguous assignment of the stereochemistry for a range of both synthetic and natural chiral compounds has been done using VCD.8,13–15 In most cases where VCD alone has been used to determine the stereochemistry, the compounds were limited to a maximum of three chiral centers.16 However, a recent work by Bogaerts et al. demonstrated that VCD could be used to unambiguously assign the AC of artemisinin and artesunate with six and seven chiral centers, respectively.17 Another success was achieved by Koenis et al., who could determine AC and diastereomeric contamination levels as low as 5 percent for a molecule with six chiral centers, dydrogesterone.15 This was facilitated by the fairly rigid structure of these molecules. The situation becomes more complex and challenging for conformationally flexible systems such as cyclic peptides,18 where VCD alone may not be successful in an unambiguous AC determination. For cyclic peptides, an additional complication may arise from the fact that the dominating VCD bands of these molecules are amide modes in which the chiral centers are not significantly involved, the bands instead reflect the secondary structure of the peptides. Moreover, the VCD spectral signatures may be influenced by the nature of the solvent,19,20 which places further demands on the calculations needed to interpret the experimental spectra. Exploring whether the VCD spectra reflect the nature of the chiral centers or the secondary structure for cyclic peptides of increasing size is therefore of importance in order to assess the predictive power of VCD for this class of compounds.
To assign the unknown AC of a chiral compound, a measured VCD spectrum is compared with computed spectra for different stereoisomers of the compound. A computational protocol to simulate the spectra typically consists of a conformational search and quantum-chemical calculations of the VCD spectra.8,18 Since the spectra are measured in solution, the solvent environment is often included in calculations through the use of a continuum model.21,22 The conformational search is a key step in the computational protocol for flexible molecules, since different conformers with the same AC may provide VCD intensities with different signs in the same frequency range. When relevant conformers are missing, this can easily lead to an erroneous assignment of the AC. In a previous work,18 we established a reliable computational protocol for the calculation of conformationally flexible molecules with known AC, using several cyclic peptides as test systems. This computational protocol was based on a meta-dynamics conformational search as implemented in CREST,23–25 combined with energies, geometries and VCD spectra obtained using DFT. We showed that the protocol allows for the identification of relevant conformations, and that the Boltzmann-averaged spectrum agrees well with the corresponding experimental spectrum.
In this work, we investigate to what extent the AC of cyclic peptides can be determined with VCD using this computational protocol. More specifically, we investigate the maximum number of chiral centers a cyclic peptide can have in order to be able to unambiguously assign the AC with VCD.
Methods
In order to investigate to what extent the AC of cyclic peptides can be determined with VCD, we use our previously published computational protocol18 to compute VCD spectra for all stereoisomers of a given cyclic peptide and compare them to an experimental VCD spectrum of a stereoisomer with known AC.Investigated chiral peptides
We have selected a series of eight tetrapeptides and hexapeptides with two, three and four chiral centers (Fig. 1).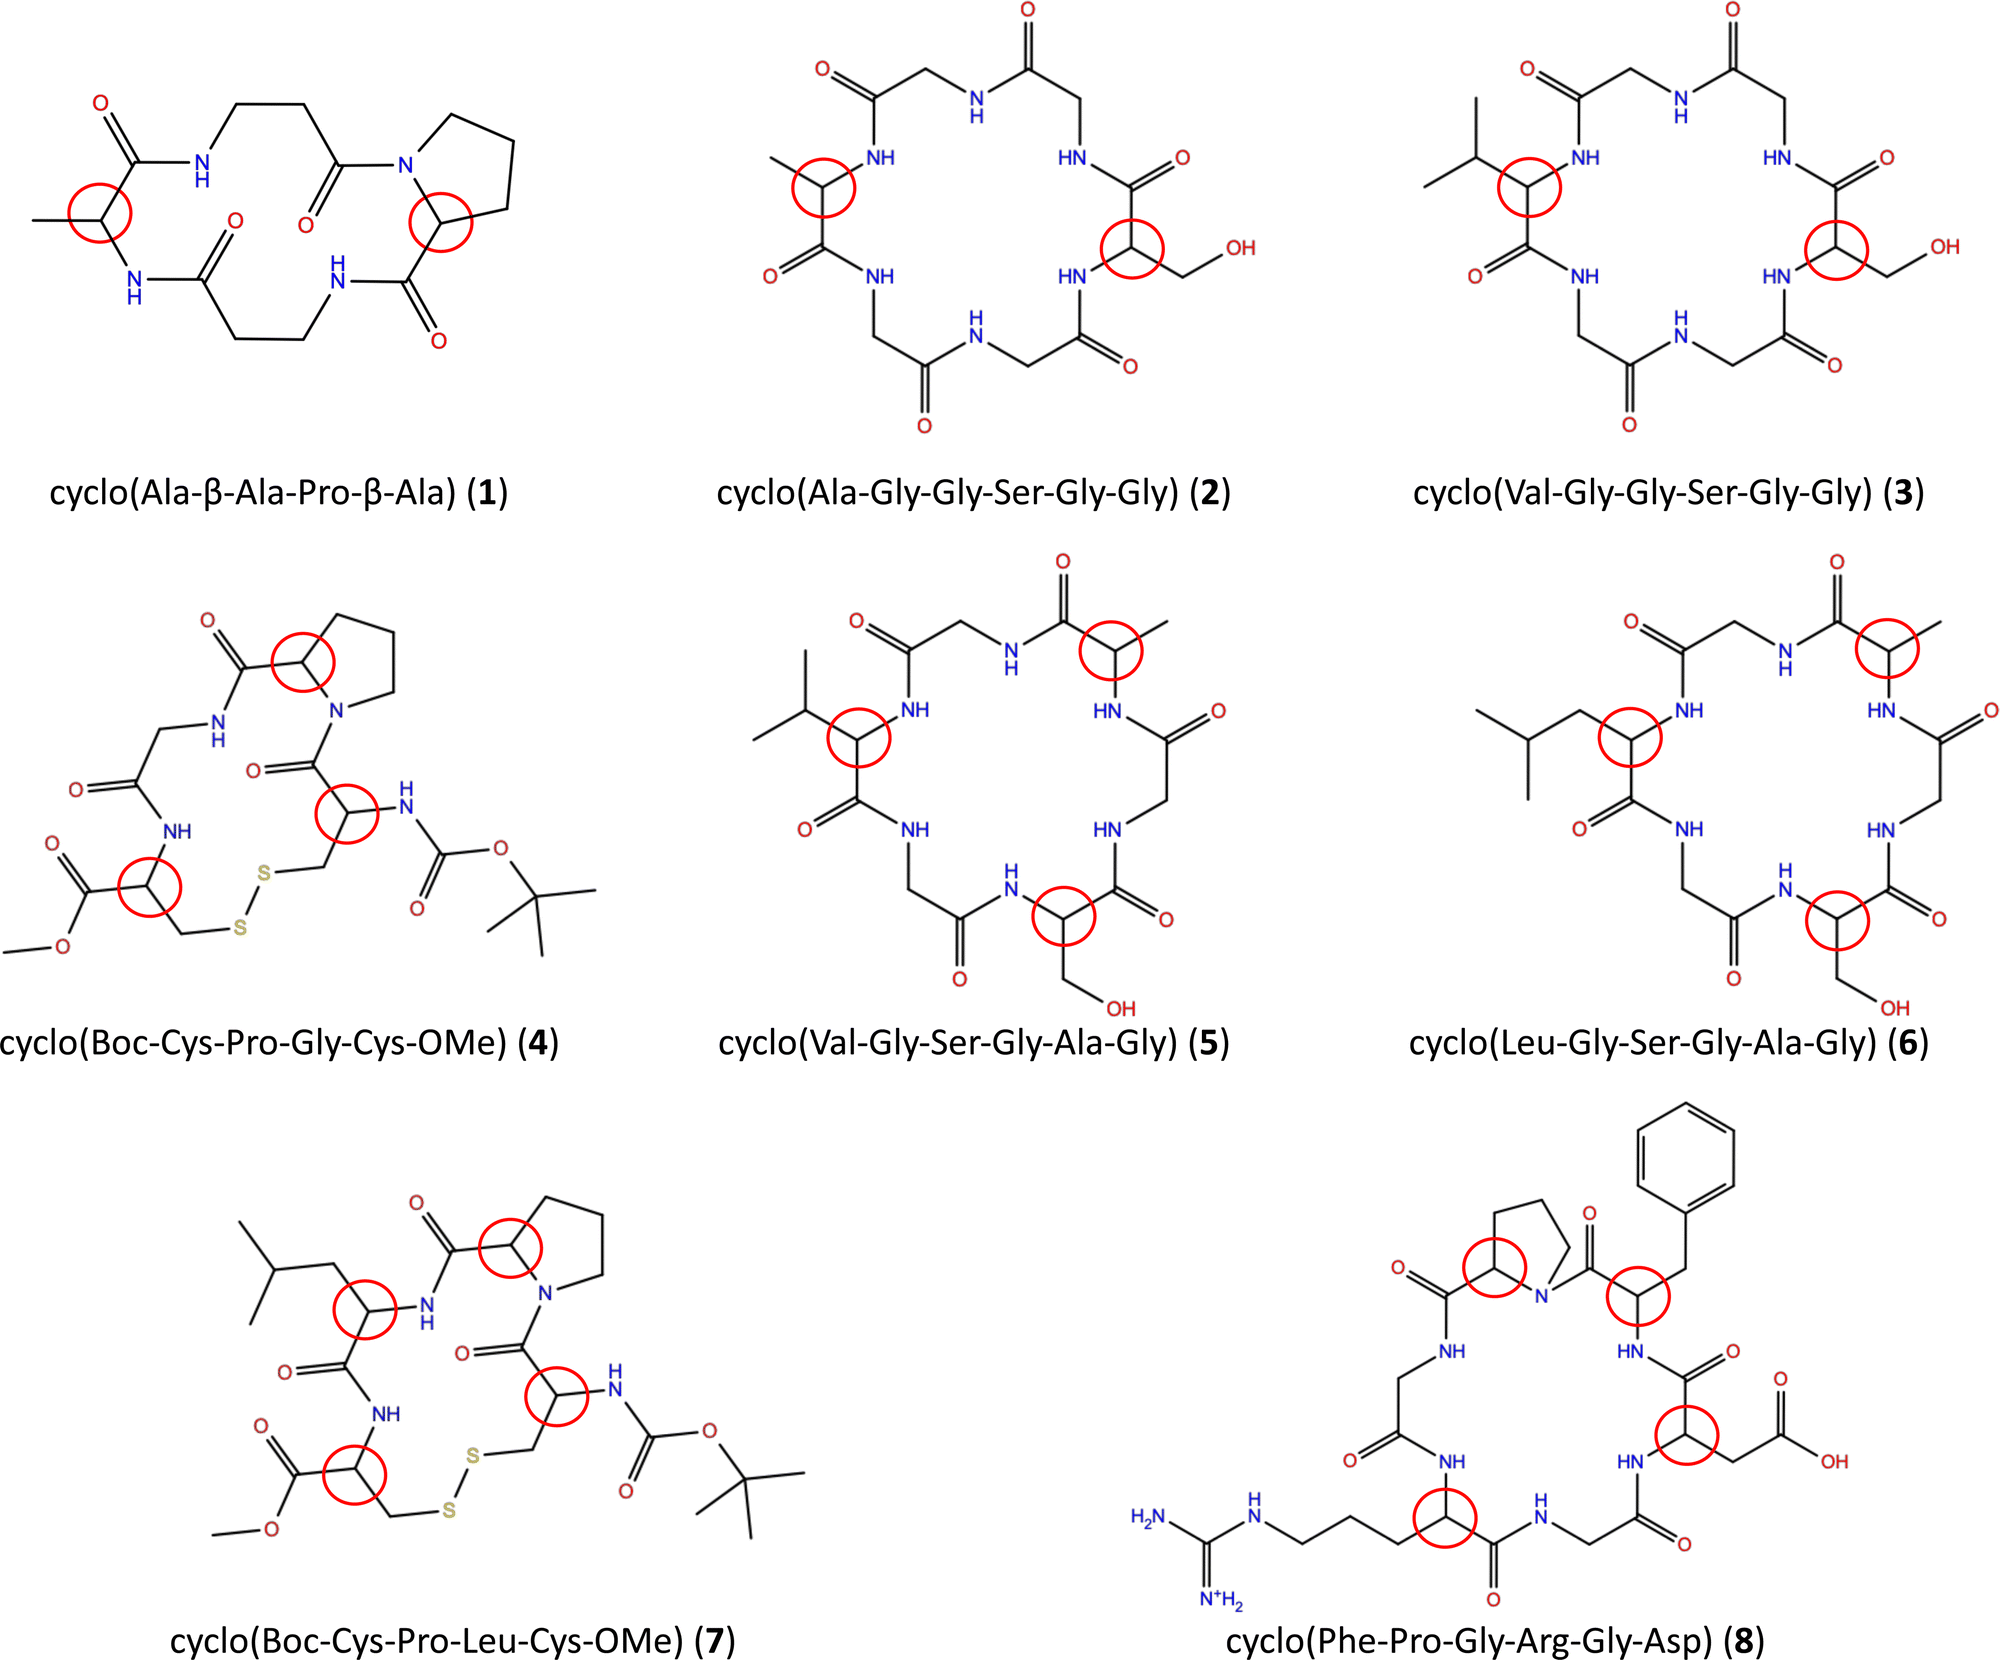 | ||
| Fig. 1 Structure of the investigated chiral peptides. Red circles indicate chiral centers. | ||
With the exception of β-alanine in 1 and glycine in 2–6 and 8, all amino acids have one chiral center. The AC of a chiral peptide is indicated by naming the stereochemistry of each chiral amino acid, following the order of the amino acids. For example, SR-cyclo(Ala-β-Ala-Pro-β-Ala) (1) indicates that alanine has the S configuration and proline has R wheres as RSR-cyclo(Val-Gly-Ser-Gly-Ala-Gly) (5) indicates that the chiral amino acids are R-valine, S-serine and R-alanine.
The experimental spectra for tetrapeptides 1,26419 and 719 as well as for the hexapeptide 827 were taken from the literature. Cyclic hexapeptides 2, 3, 5 and 6 were synthesized and their VCD spectra measured as part of this study.
Synthesis of cyclic hexapeptides
Hexapeptides 2, 3, 5 and 6 were prepared from fluorenylmethoxycarbonyl (Fmoc)-protected amino acids by solid-phase peptide synthesis28 using the Fmoc strategy29 as described in detail elsewhere.30 Using 2-chlorotrityl chloride resin and Fmoc-Gly-OH as the first amino acid, linear peptide precursors were made by an automated peptide synthesizer (Biotage Initiator+ Alstra). The linear peptides were cleaved from the resin, head-to-tail cyclized in solution, and side-chain deprotected. Crude peptides were purified by preparative reversed-phase high-performance liquid chromatography. A detailed protocol for the peptide synthesis as well as mass spectrometry and NMR characterization of the synthesised peptides is included in the ESI.†Measurement of IR and VCD spectra
IR absorption and VCD spectra of cyclic peptides were measured using an Invenio R FTIR spectrometer equipped with a PMA50 module for polarization measurements (Bruker) at 8 cm−1 resolution using a demountable BaF2 cell and a 100 μm Mylar spacer, with photoelastic modulator module set to 1600 cm−1. The peptides were dissolved in DMSO-d6 at a concentration of 25 mg mL−1, and 50 μL of this peptide solution was deposited on the bottom cell window and covered with the top window. Six blocks of 22![[thin space (1/6-em)]](https://www.rsc.org/images/entities/char_2009.gif) 500 scans (16 hours of total accumulation time) were collected and averaged. Spectra of DMSO-d6 measured at the same conditions were subtracted from the sample spectra. The experimental spectra measured in this work (2, 3, 5 and 6) are available at DataversNO.31
500 scans (16 hours of total accumulation time) were collected and averaged. Spectra of DMSO-d6 measured at the same conditions were subtracted from the sample spectra. The experimental spectra measured in this work (2, 3, 5 and 6) are available at DataversNO.31
Computational details
IR and VCD spectra were calculated using our recently developed computational protocol.18 A conformational search was performed with meta-dynamics as implemented in CREST 2.10.24,25 The conformer ensemble was then re-ranked by a DFT single-point energy calculation (B3LYP32,33/6-31+G*34,35/CPCM36,37). Conformers within 2.5 kcal mol−1 of the lowest-lying conformer after the DFT single-point energy calculation were geometry optimized, and the resulting structures were used to calculate IR and VCD intensities. If less than 20 conformers were within the 2.5 kcal mol−1 range after the single-point energy calculation, we included the lowest-energy conformations above 2.5 kcal mol−1 up to a total of 20 conformers to ensure that the conformational space was sufficiently sampled. The single-point energy calculations, geometry optimizations and VCD calculations were performed at the DFT level (B3LYP/6-31+G*/CPCM) using Gaussian 16 (Rev. B.01).38 For more details on the computational protocol, we refer to our previous work.18 Replication data for this work including geometries and Boltzmann averages are available at DataverseNO.31Final VCD spectra were generated as Boltzmann averages based on free energies for the unique conformers by the DrawSpectrum program.39 The calculated spectral intensities are scaled such that the peak with the highest intensity in the computed spectrum matches the peak with the highest intensity in the experimental spectrum. For the molecules measured in this work (2, 3, 5 and 6), a Lorentzian bandshape with a full width at half maximum (FWHM) of 10 cm−1 was applied. For the molecules measured elsewhere, the broadening was chosen to be the same as used for the calculated spectra in those works: 10 cm−1 for 1 measured by Vass et al.,26 16 cm−1 for 4 and 7 measured by Merten et al.19 and 10 cm−1 for 8 measured by Bouř et al.27
Since the stereoisomers occur in pairs of enantiomers that have equal IR spectra and equal but opposite-signed VCD spectra, we have reduced the computational workload by calculating the spectra for only one enantiomer in each pair. Thus, we applied the computational protocol including the conformational search for two diastereomers of the cyclic peptides with two chiral centers; for four diastereomers of the cyclic peptides with three chiral centers; and for eight diastereomers of the cyclic peptides with four chiral centers.
Comparison of the experimental and computed spectra
The most important vibrations for peptides are located in the amide I spectral region (1800–1600 cm−1), associated mostly with C![[double bond, length as m-dash]](https://www.rsc.org/images/entities/char_e001.gif) O stretching modes, and the amide II spectral region (1600–1480 cm−1), associated mostly with N–H bending modes. We compare experimental and computed VCD spectra for the 1800–1400 cm−1 region with the exception of 8, where experimental data is available for the 1800–1500 cm−1 region only.
O stretching modes, and the amide II spectral region (1600–1480 cm−1), associated mostly with N–H bending modes. We compare experimental and computed VCD spectra for the 1800–1400 cm−1 region with the exception of 8, where experimental data is available for the 1800–1500 cm−1 region only.
In general, frequencies calculated with DFT do not match the experimentally observed frequencies15,40–42 and they are usually scaled to obtain a better agreement with experiment. To our knowledge, there is no established method to determine the frequency scaling factors for spectra recorded in solvent and several ad hoc schemes are in use. One way is to choose the scaling factor that gives the best visual agreement with the experiment. In this work, however, we compute the overlap between the experimental spectrum and spectra computed with different frequency scaling factors and choose the frequency scaling factor giving the largest combined VCD and IR overlap between experimental and computed spectra. Overlap integrals Sspec are calculated with DrawSpectrum39 as43–46
 | (1) |
As discussed in our previous work,18 the experimental gap between the amide I and II spectral regions is poorly reproduced in computed spectra of cyclic peptides. Therefore, the same frequency scaling factor cannot be used for both spectral regions to calculate the overlap integral of both regions combined. Hence, we have chosen to compute overlap integrals for the amide I region (1800–1600 cm−1) and amide II region (1600–1400 cm−1) separately and use two different scaling factors for the two regions. For 8, the experimental spectra is measured from 1800 cm−1 to 1500 cm−1 and the amide II region for this molecule is 1600–1500 cm−1.
For each region, the scaling factor that gives the highest value for combined VCD and IR overlap given as
 | (2) |
To mimic a situation in which an entirely unknown AC is assigned, scaling factors were determined individually for all stereoisomers of each chiral peptide. This makes chemical sense due to their different specific solute–solvent interactions, but only for different diastereomers. However, without prior information on the AC, the same procedure has to be followed for the two stereoisomers in an enantiomeric pair, to avoid optimizing the frequency scaling factor of the correct stereoisomer to the VCD spectrum of its enantiomer. Hence, frequency scaling factors were also determined individually for enantiomers, resulting typically in positive overlap integrals for both enantiomers and VCD spectra that are not mirror images of each other. For each stereoisomer, scaling factors that give a negative SVCD are discarded. In cases where all investigated scaling factors lead to a negative SVCD, the spectra are not scaled. The resulting frequency scaling factors are collected in Tables S1–S3 (ESI†).
One could in theory use overlap integrals to determine which stereoisomer matches the experimental VCD spectrum best. Indeed, Bogaerts et al. used overlap integrals between calculated and experimental VCD and Raman optical activity (ROA) spectra to determine the AC of two rigid compounds with six and seven chiral centers.17 Koenis et al. used spectral overlap between calculated and experimental VCD to show that the AC of a rigid molecule with six chiral centers can be determined with VCD only.15 For the molecules investigated in this work, we found that the overlap integrals are not reliable enough to be used for this purpose. The overlap integrals calculated using eqn (1) are extremely sensitive to small changes in frequencies. Indeed, a small change in the frequency scaling factor may change the AC assignment based on the overlap integral. In addition, the largest overlap integrals may correspond to a stereoisomer that shows an entirely different pattern in the VCD spectrum and which would therefore immediately be discarded by the trained eye. In Fig. 2, the experimental VCD spectrum (SS) and the calculated spectra of all stereoisomers of 3 are shown together with the respective overlap integrals. By solely looking at the overlap integrals, the RS stereoisomer is clearly in best agreement with the experiment. However, by looking at the pattern of the amide I region of the spectra, the RS stereoisomers has a −/+/− pattern which does not correspond to the experimental +/− pattern.
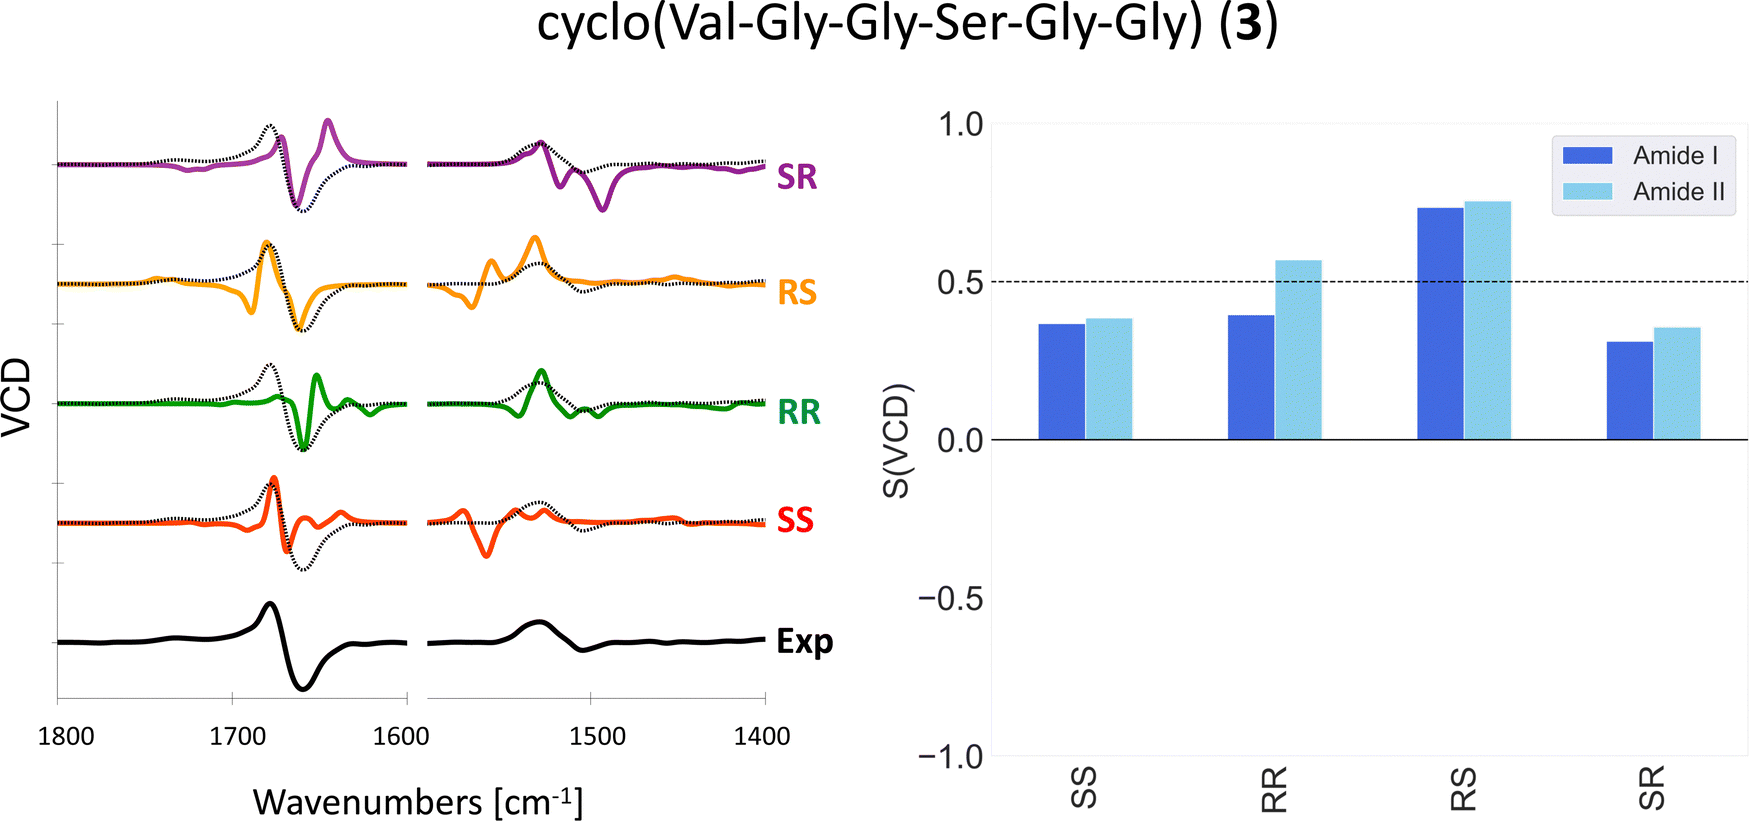 | ||
| Fig. 2 Experimental and computed (B3LYP/6-31+G*/CPCM) VCD spectra (left) and overlap integrals (right) of 3 in DMSO-d6. Different scaling factors are used for the amide I and amide II regions, see Table S1 (ESI†). The experimental spectrum is overlaid with the computed spectra as a dotted black line. | ||
Thus, we included all possible stereoisomers in our analysis and use visual inspection to determine which computed spectrum/spectra match the experimental spectrum best.
We primarily use the experimental pattern in the intense amide I region to select the matching computed spectrum. If this is not possible or when several computed spectra match the pattern in the amide I region, we also include the amide II region in this analysis. Another source of information is the relative intensity of the amide I and amide II regions. We do not take into account the separation between the amide I and II regions, as it is likely that explicit solvent modelling is needed to correctly reproduce this separation.18,27
Results
In the following, we present results for the cyclic peptides with two chiral centers (1–3), followed by those with three (4–6) and those with four chiral centers (7–8).Cyclic peptides with two chiral centers
The experimental and computed spectra for cyclic peptides 1, 2 and 3 are shown in Fig. 3.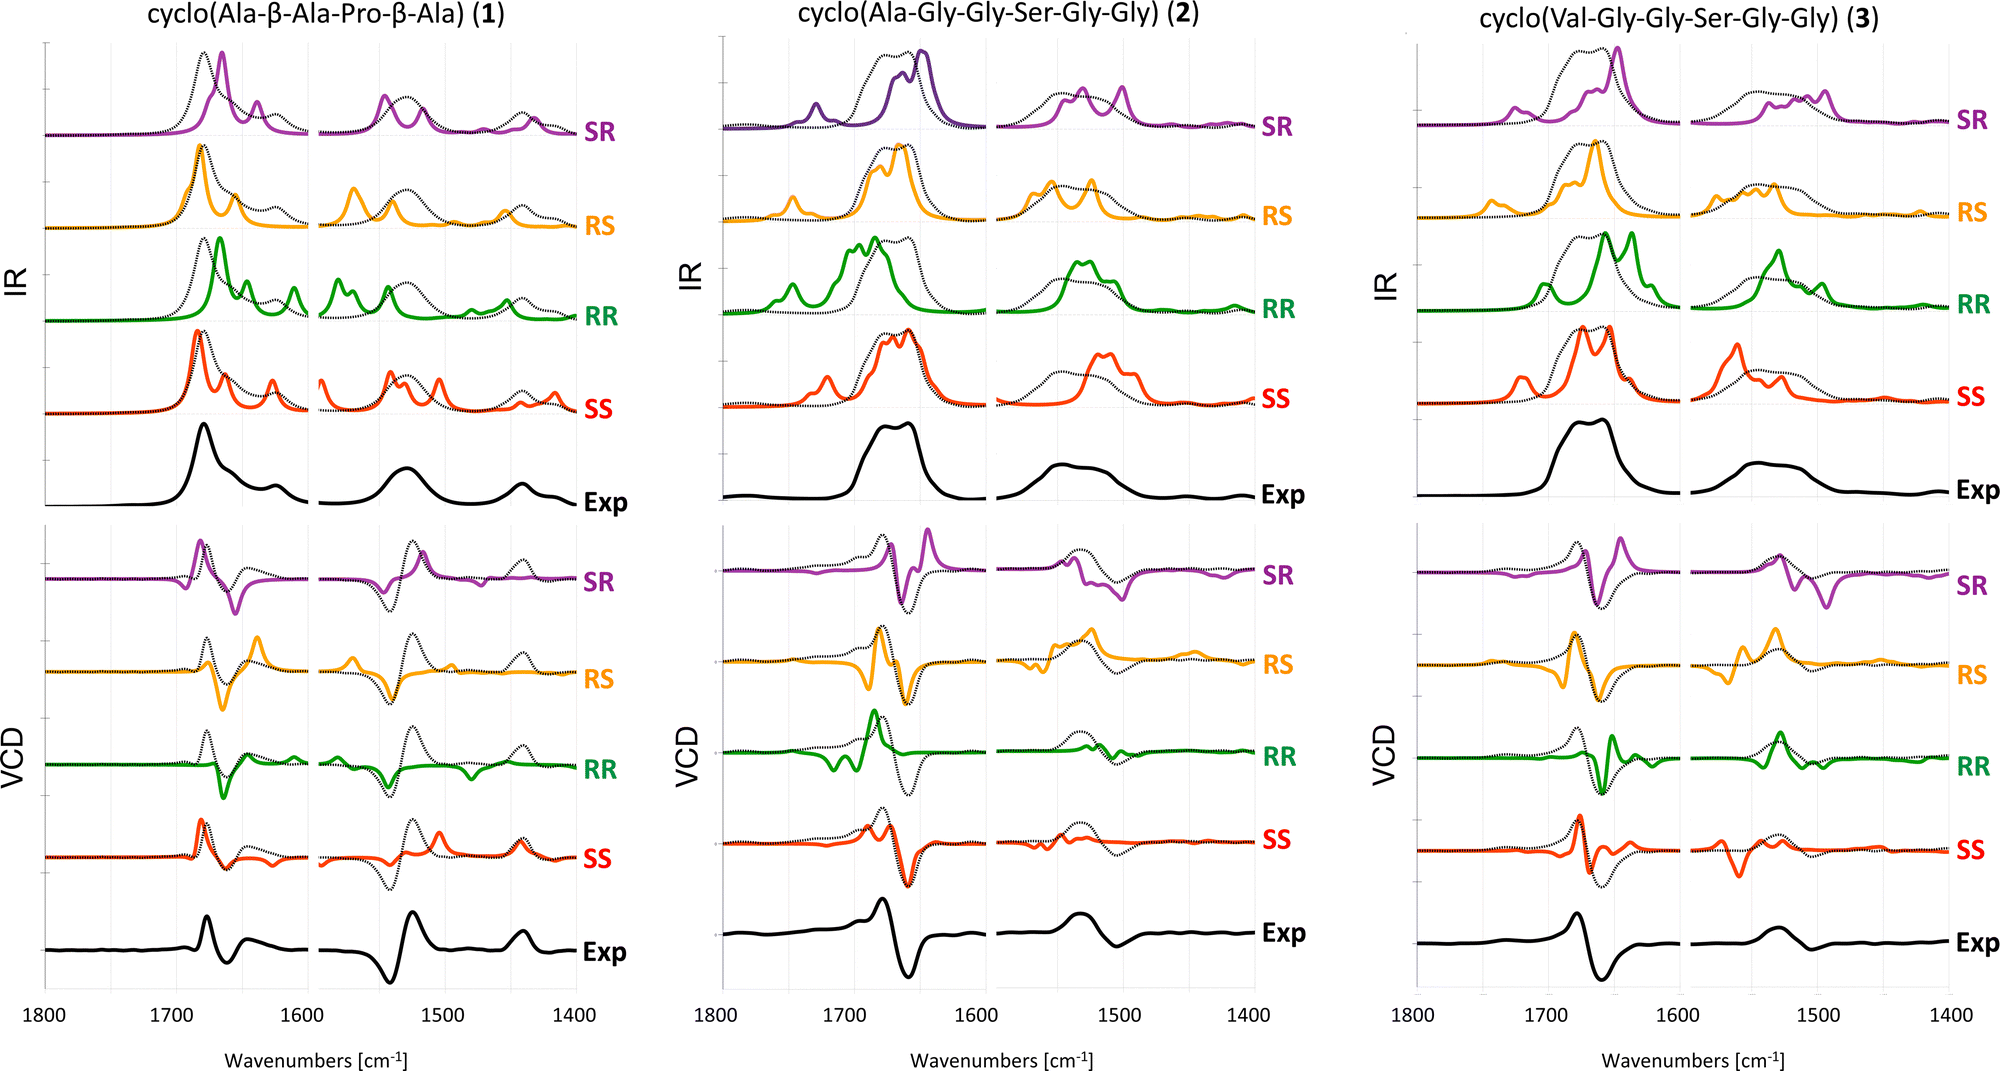 | ||
| Fig. 3 Experimental and computed (B3LYP/6-31+G*/CPCM) IR (top) and VCD spectra (bottom) of 1 in ACN-d326 and 2 and 3 in DMSO-d6. Different scaling factors are used for the amide I and amide II regions, see Table S1 (ESI†). The experimental spectrum is overlaid with the computed spectra as a dotted black line. | ||
For tetrapeptide 1, the experimental VCD spectrum (SS) is in fair agreement with calculated spectra for both the SS and SR stereoisomers in the amide I region. However, the experimental positive band slightly below 1450 cm−1 is only reproduced for the SS stereoisomer. In this particular case, the IR spectrum can help in assigning the AC. Indeed, the experimental absorption band around 1625 cm−1 is reproduced as a third peak in the amide I region only for the calculated spectra of the SS and RR stereoisomers. For hexapeptide 2, the experimental (SS) +/+/− pattern in the amide I region is reproduced only in the computed VCD spectrum of the SS stereoisomer.
For hexapeptide 3, the experimental (SS) +/− pattern in the amide I region is similarly reproduced only in the computed VCD spectrum of the SS stereoisomer.
In summary, the AC of the three investigated cyclic peptides with two chiral centers can be determined by VCD. For tetrapeptide 1, the calculated SS spectrum reproduces the experimental pattern in the entire investigated frequency range (1800–1400 cm−1), whereas for hexapeptides 2 and 3, only the amide I region in the experimental spectra is reliably reproduced by the calculations. This may be caused by the longer and more flexible peptide backbone in 2 and 3 compared to 1.
Cyclic peptides with three chiral centres
The experimental and computed spectra for cyclic peptides 4, 5 and 6 are shown in Fig. 4.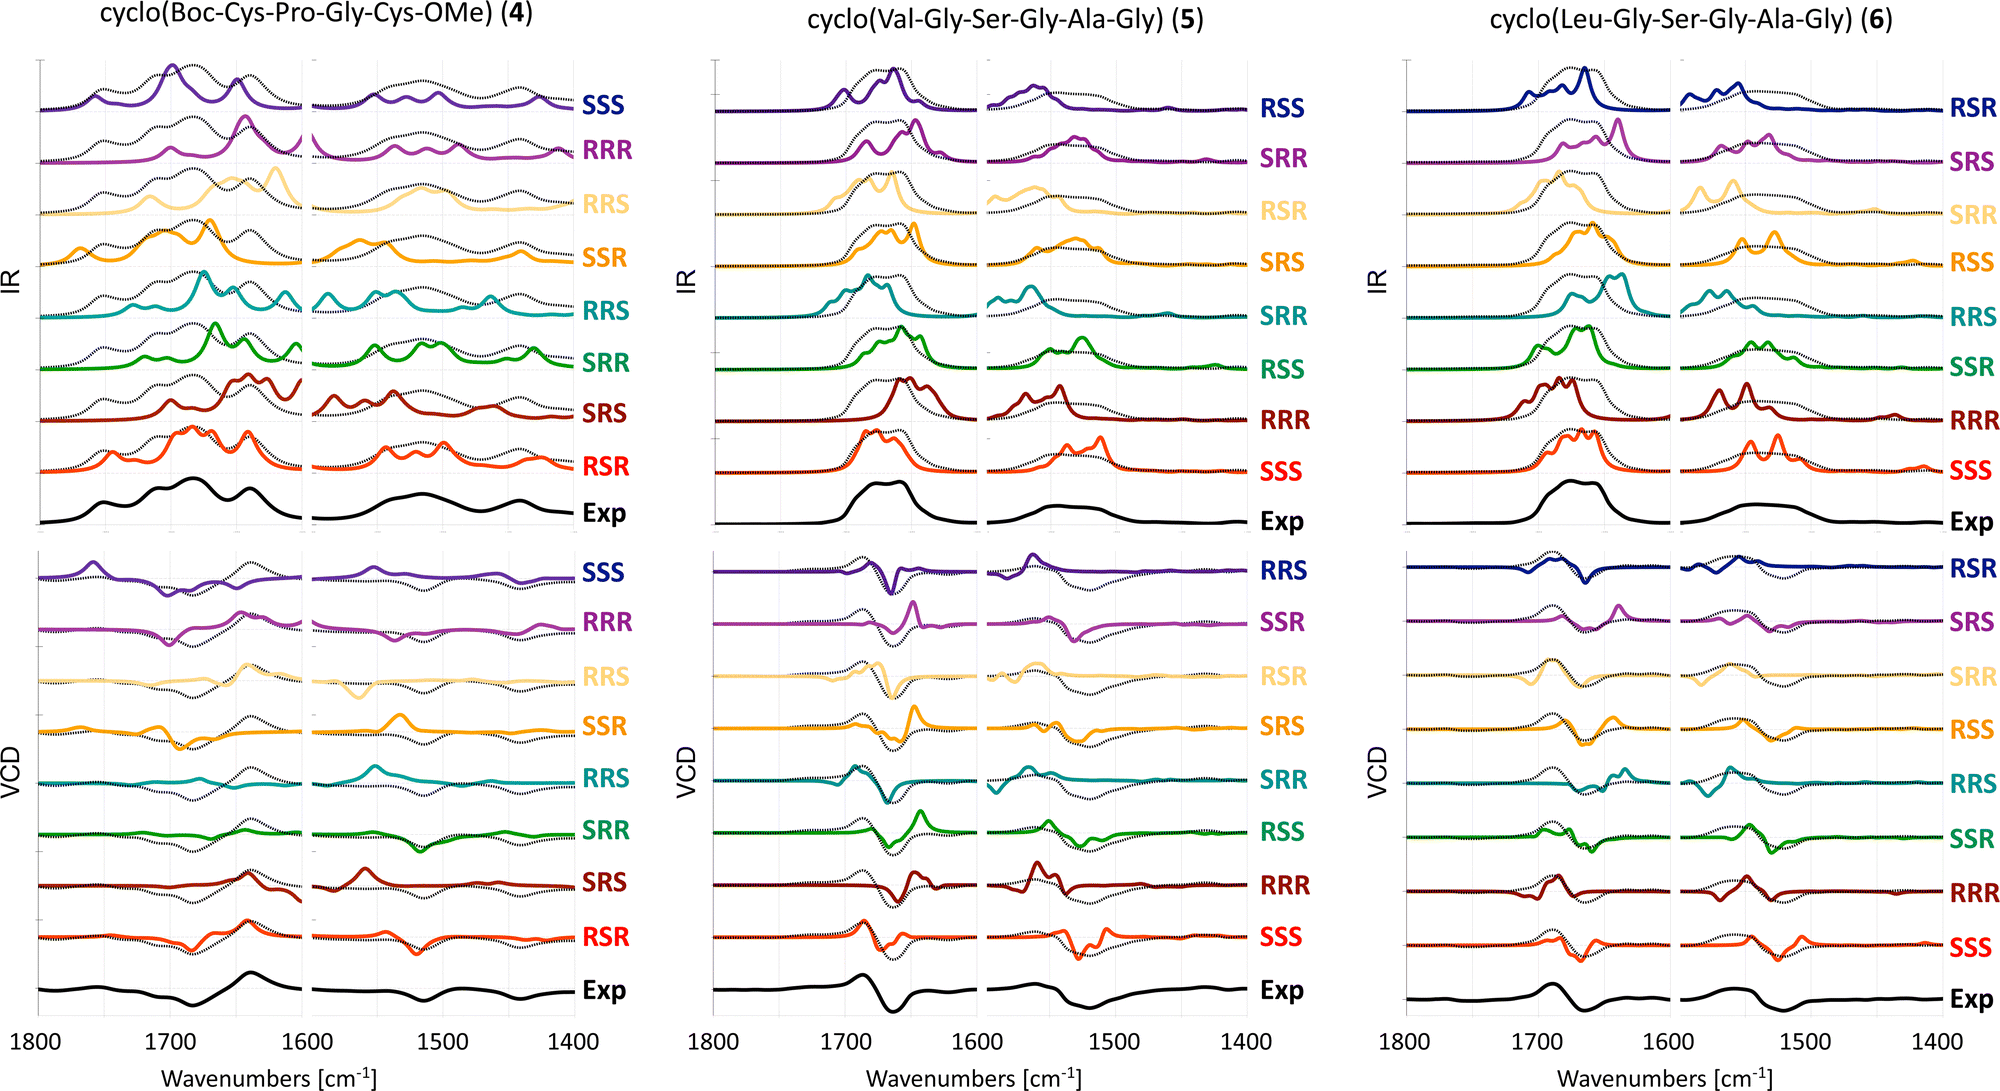 | ||
| Fig. 4 Experimental and computed (B3LYP/6-31+G*/CPCM) IR (top) and VCD spectra (bottom) of 4 in ACN-d319 and 5 and 6 in DMSO-d6. Different scaling factors are used for the amide I and amide II regions, see Table S2 (ESI†). The experimental spectrum is overlaid with the computed spectra as a dotted black line. | ||
For tetrapeptide 4, the experimental (RSR) −/+ couplet in the amide I region as well as the negative band slightly above 1500 cm−1 are reproduced in the computed VCD spectra of RSR, SRR, and RRR stereoisomers. However, the intensity of the amide I region in the computed spectrum of the SRR stereoisomer is too low when compared to the experiment. The relative intensities of bands in the amide I and II regions are reasonable for the RRR stereoisomer, but the negative band in experimental VCD spectra around 1450 cm−1 has a −/+ couplet shape in the computed spectra. Thus, the correct RSR stereoisomer matches best with the experimental VCD spectrum. For hexapeptide 5, the experimental (SSS) +/− couplet in both the amide I and II regions is reproduced only in the computed VCD spectrum for the SSS stereoisomer. For hexapeptide 6, the experimental (SSS) +/− couplet in the amide I region is reproduced in the computed VCD spectrum of both the SSR and SSS stereoisomers. The experimental +/− couplet in the amide II region is reproduced better for the SSR stereoisomer than for the SSS stereoisomer, which shows a +/−/+ spectral pattern. Based on the amide II region, one could erroneously assign SSR as the AC, or conclude that the AC cannot be reliably assigned with VCD only.
In summary, the AC of two out of three cyclic peptides with three chiral centers can be correctly assigned with VCD.
Cyclic peptides with four chiral centres
The experimental and computed spectra for cyclic peptides 7 and 8 are shown in Fig. 5. Experimental spectra for two stereoisomers of tetrapeptide 7 are available.19 Hence, two separate assignments can be made. We will refer to those as 7a (RSSR) and 7b (RSRR). For four chiral centers, 16 different absolute configurations are possible. Here we present only computed spectra for eight stereoisomers with the highest resemblance to experimental VCD spectra based on the visual comparison as described in the methods section. The remaining eight stereoisomers are shown in Fig. S1 (ESI†).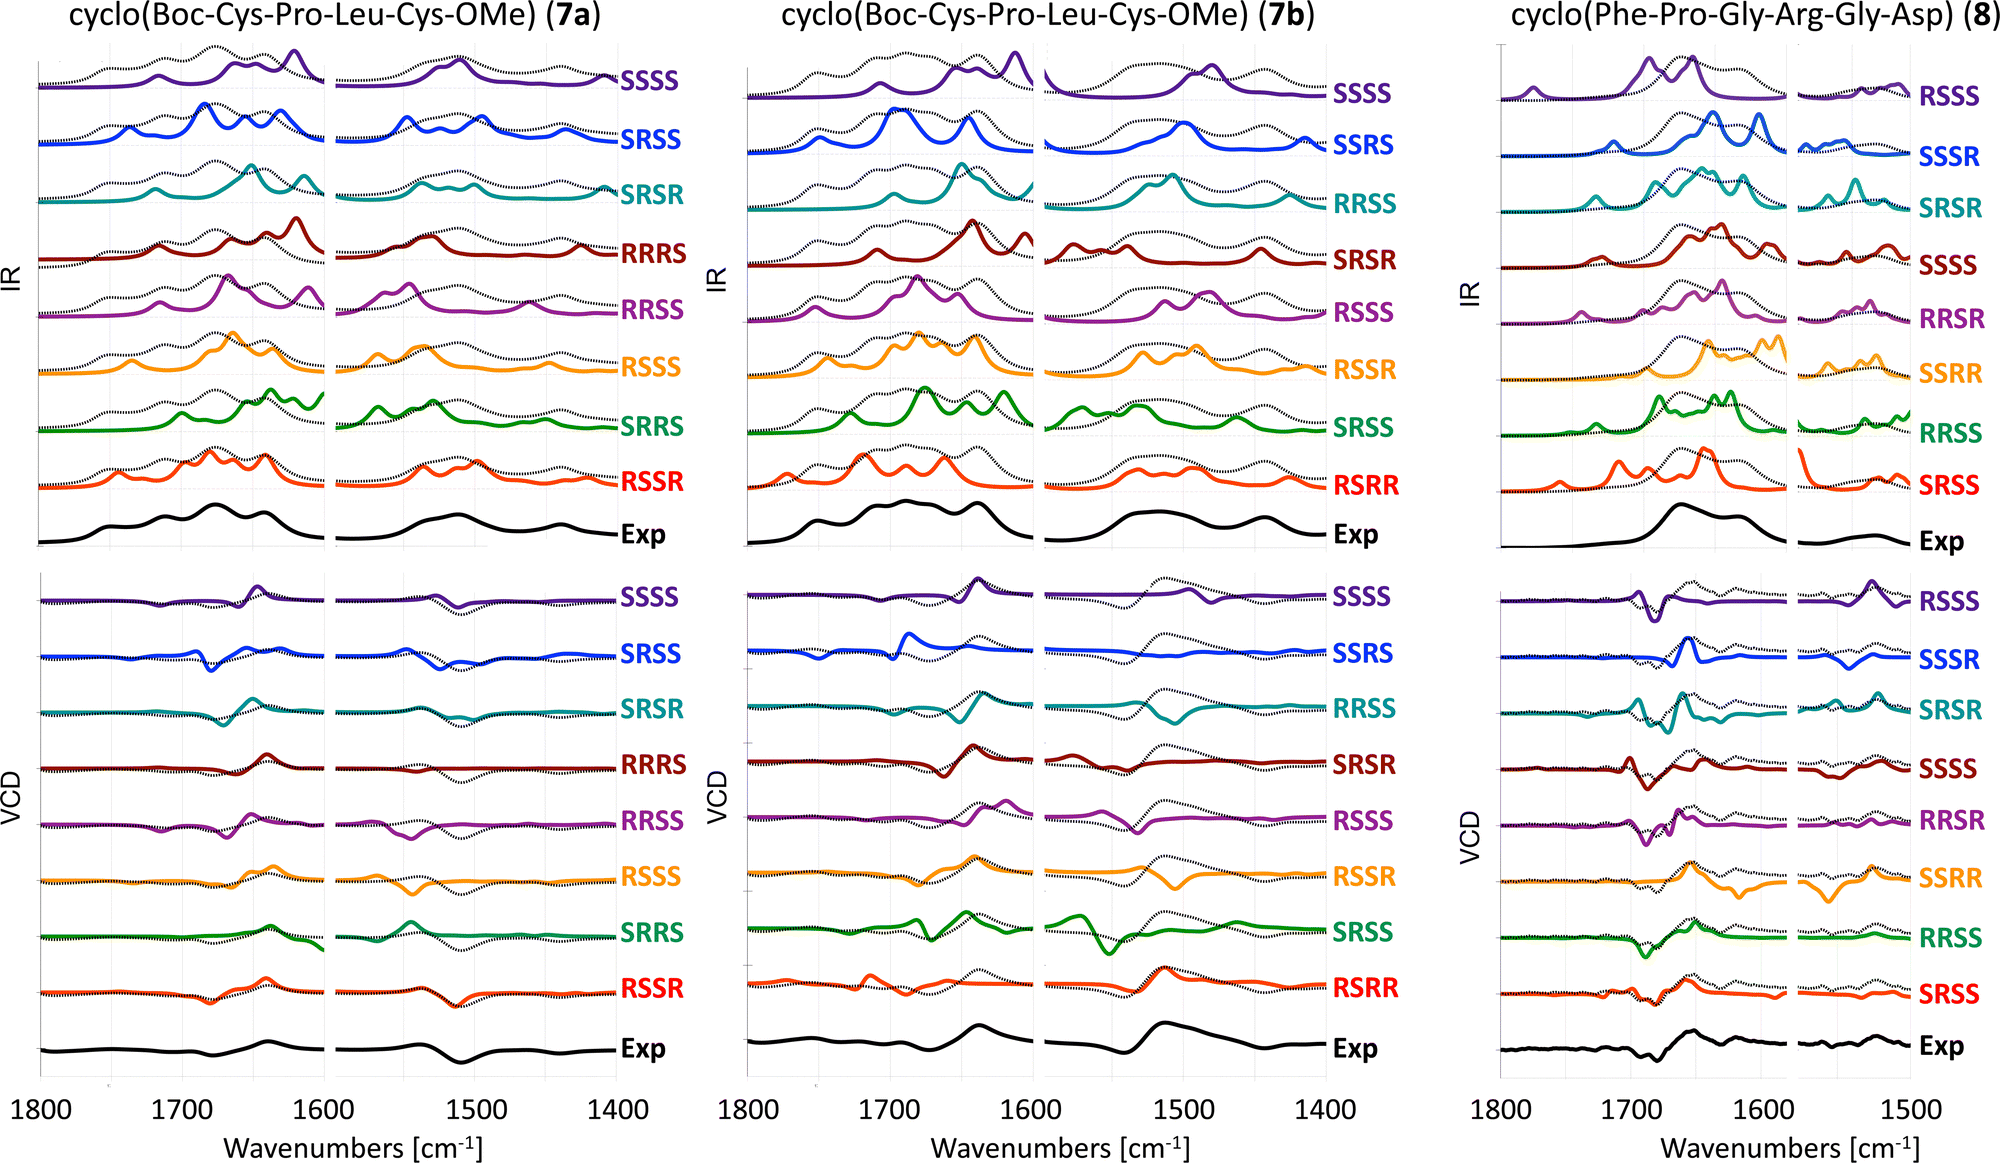 | ||
| Fig. 5 Experimental and computed (B3LYP/6-31+G*/CPCM) IR (top) and VCD spectra (bottom) of 7a in ACN-d3,197b in ACN-d319 and 8 in TFE.27 Different scaling factors are used for the amide I and amide II regions, see Table S3 (ESI†). The experimental spectrum is overlaid with the computed spectra as a dotted black line. | ||
For tetrapeptide 7a, the experimental (RSSR) −/+ couplet in the amide I region is reproduced in the computed VCD spectra of six stereoisomers. Two of these can be eliminated due to a negative band between 1800–1700 cm−1 that is not observed in the experimental spectrum (RRSS and SSSS). For the four remaining stereoisomers, only calculated spectra for the RSSR and RSSS stereoisomers reproduce the +/− couplet in the amide II region. At best, the determination of the AC can be limited to two options. For tetrapeptide 7b, the experimental (RSRR) −/+ couplet in the amide I region is reproduced in the computed VCD spectra of six stereoisomers. The correct RSRR stereoisomer is not among those six, showing a positive band at 1700 cm−1 that is not observed in the experiment. The RSRR stereoisomer is, however, the only one reproducing the experimental −/+ couplet in the amide II region. For hexapeptide 8, the experimental (SRSS) −/−/+ spectral pattern in the amide I region is reproduced in the computed VCD spectra of three stereoisomers: SRSS, RRSS and RRSR. The experimental spectrum does not show an intense signal in the amide II region, which is in line with computed spectra of these three stereoisomers. At best, the determination of the AC can be limited to three options.
In summary, the AC cannot be correctly assigned with VCD for any of the three investigated cyclic peptides with four chiral centers.
Discussion and conclusion
We have investigated to what extent VCD can be used to determine the AC of cyclic tetra- and hexapeptides with two, three and four chiral centers by comparing experimental VCD spectra with computed VCD spectra of all stereoisomers. Although others have used overlap integrals to determine the AC previously,17,47 we have shown that they are not reliable for the systems investigated in this work. Hence, we have based our AC assignment on visual inspection. We have shown that we can assign the AC in this way for all three cyclic peptides with two chiral centers, for two out of three cyclic peptides with three chiral centers and for none of the cyclic peptides with four chiral centers. The higher the number of chiral centers and the longer and more flexible the cyclic peptide, the more difficult it is to determine the AC. In the cases where the AC cannot be determined with VCD alone, one can at best limit the number of possible stereoisomers. At worst, an erroneous assignment is made based on VCD alone.Although somewhat disappointing, it is not surprising that VCD alone cannot always determine the AC of molecules with three or more chiral centers. Other works have been successful in determining the AC of such molecules and have achieved this by combining VCD with other types of spectroscopies. Hopmann et al. combined VCD, ROA and NMR to determine the AC of a highly flexible natural product with two chiral centers and an asymmetrically substituted double bond.48 Dinku et al. combined VCD and NMR to determine the AC of a tricyclic triterpene acid with three chiral centers and three asymmetrically substituted double bonds.49 Bogaerts et al. combined VCD and ROA to determine the AC of two rigid compounds with six and seven chiral centers.17 Thus, combining VCD with other techniques such as ROA and NMR is a preferred strategy to correctly and reliably determine the AC of large and flexible molecules with multiple chiral centers.8,14 We hypothesize that this strategy also works for cyclic peptides 6–8, for which the AC could not be assigned with VCD only. Although we have shown that VCD independently can determine the correct AC for cyclic peptides 1–5, a more unambiguous assignment can be made by combining several techniques.
Our study also shows that in the absence of additional experimental data, it is important to calculate spectra for all possible stereoisomers of a flexible molecule with multiple chiral centers, to avoid an erroneous assignment based on an accidental agreement. Such an erroneous assignment becomes more probable with a higher number of chiral centers in a molecule.
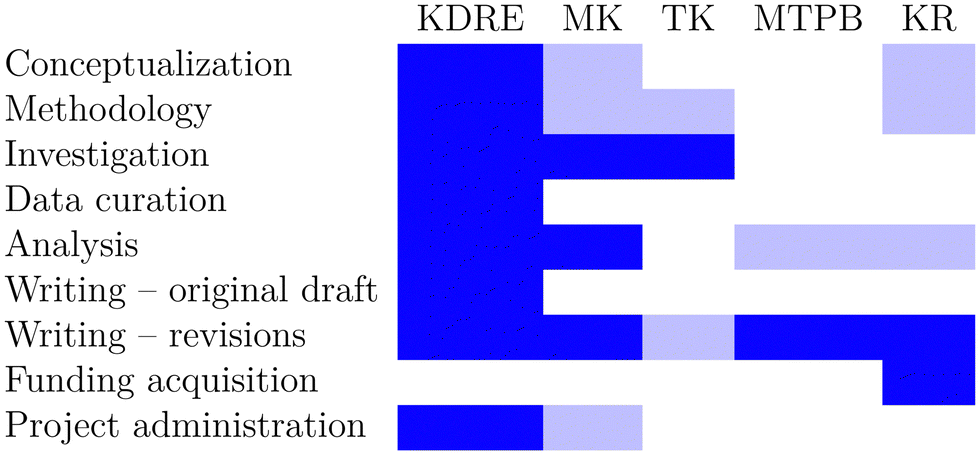
Author contributions
We use the CRediT taxonomy of contributor roles.50,51 The “Investigation” role also includes the “Validation” role. The “Analysis” role also includes the “Formal analysis” and “Visualization” roles. The “Funding acquisition” role also includes the “Resources” role. We visualize contributor roles in the following authorship attribution matrix, as suggested in ref. 52 (Table 1).
|
Conflicts of interest
There are no conflicts to declare.Acknowledgements
This work has received support from the Research Council of Norway through a Centre of Excellence Grant (Grant No. 262695) and a research project grant (Grant No. 269425). The calculations were performed on resources provided by Sigma2 – the National Infrastructure for High Performance Computing and Data Storage in Norway (Grant No. NN4654K). The authors are grateful to C. Merten, E. Vass, P. Bour, and T. Keiderling for helpful discussions and for kindly sharing experimental data.References
- X. Jing and K. Jin, A gold mine for drug discovery: strategies to develop cyclic peptides into therapies, Med. Res. Rev., 2020, 40, 753–810 CrossRef CAS PubMed.
- M. A. Abdalla and L. J. McGaw, Natural Cyclic Peptides as an Attractive Modality for Therapeutics: A Mini Review, Molecules, 2018, 23, 2080 CrossRef PubMed.
- A. Zorzi, K. Deyle and C. Heinis, Cyclic peptide therapeutics: past, present and future, Curr. Opin. Chem. Biol., 2017, 38, 24–29 CrossRef CAS PubMed.
- S. W. Smith, Chiral Toxicology: It's the Same Thing…Only Different, Toxicol. Sci., 2009, 110, 4–30 CrossRef CAS PubMed.
- C. S. Kim, J. Oh and T. H. Lee, Structure elucidation of small organic molecules by contemporary computational chemistry methods, Arch. Pharm. Res., 2020, 43, 1114–1127 CrossRef CAS PubMed.
- F. J. Devlin, P. J. Stephens and P. Besse, Are the absolute configurations of 2-(1-hydroxyethyl)-chromen-4-one and its 6-bromo derivative determined by X-ray crystallography correct? A vibrational circular dichroism study of their acetate derivatives, Tetrahedron: Asymmetry, 2005, 16, 1557–1566 CrossRef CAS.
- M. Menna, C. Imperatore, A. Mangoni, G. Della Sala and O. Taglialatela-Scafati, Challenges in the configuration assignment of natural products. A case-selective perspective, Nat. Prod. Rep., 2019, 36, 476–489 RSC.
- J. Bogaerts, R. Aerts, T. Vermeyen, C. Johannessen, W. Herrebout and J. M. Batista, Tackling Stereochemistry in Drug Molecules with Vibrational Optical Activity, Pharmaceuticals, 2021, 14, 877 CrossRef CAS PubMed.
- M. Krupová, J. Kessler and P. Bouř, Recent trends in chiroptical spectroscopy: theory and applications of vibrational circular dichroism and Raman optical activity, ChemPlusChem, 2020, 85, 561–575 CrossRef PubMed.
- P. Stephens, F. Devlin and J. Cheeseman, VCD spectroscopy for organic chemists, CRC Press, 2012, pp. 1–360 Search PubMed.
- S. S. Wesolowski and D. E. Pivonka, A rapid alternative to X-ray crystallography for chiral determination: case studies of vibrational circular dichroism (VCD) to advance drug discovery projects, Bioorg. Med. Chem. Lett., 2013, 23, 4019–4025 CrossRef CAS PubMed.
- D. Kurouski, Advances of Vibrational Circular Dichroism (VCD) in bioanalytical chemistry. A review, Anal. Chim. Acta, 2017, 990, 54–66 CrossRef CAS PubMed.
- J. Batista Jr, E. W. Blanch and V. D. S. Bolzani, Recent advances in the use of vibrational chiroptical spectroscopic methods for stereochemical characterization of natural products, Nat. Prod. Rep., 2015, 32, 128–132 RSC.
- C. Merten, T. P. Golub and N. M. Kreienborg, Absolute Configurations of Synthetic Molecular Scaffolds from Vibrational CD Spectroscopy, J. Org. Chem., 2019, 84, 8797–8814 CrossRef CAS PubMed.
- M. A. J. Koenis, E. H. Tiekink, D. M. E. van Raamsdonk, N. U. Joosten, S. A. Gooijer, V. P. Nicu, L. Visscher and W. J. Buma, Analytical chemistry on many-center chiral compounds based on vibrational circular dichroism: absolute configuration assignments and determination of contaminant levels, Anal. Chim. Acta, 2019, 1090, 100–105 CrossRef CAS PubMed.
- P. L. Polavarapu and E. Santoro, Vibrational optical activity for structural characterization of natural products, Nat. Prod. Rep., 2020, 37, 1661–1699 RSC.
- J. Bogaerts, F. Desmet, R. Aerts, P. Bultinck, W. Herrebout and C. Johannessen, A combined Raman optical activity and vibrational circular dichroism study on artemisinin-type products, Phys. Chem. Chem. Phys., 2020, 22, 18014–18024 RSC.
- K. D. R. Eikås, M. T. P. Beerepoot and K. Ruud, A Computational Protocol for Vibrational Circular Dichroism Spectra of Cyclic Oligopeptides, J. Phys. Chem. A, 2022, 126, 5458–5471 CrossRef PubMed.
- C. Merten, F. Li, K. Bravo-Rodriguez, E. Sanchez-Garcia, Y. Xu and W. Sander, Solvent-induced conformational changes in cyclic peptides: a vibrational circular dichroism study, Phys. Chem. Chem. Phys., 2014, 16, 5627–5633 RSC.
- T. Vermeyen and C. Merten, Solvation and the secondary structure of a proline-containing dipeptide: insights from VCD spectroscopy, Phys. Chem. Chem. Phys., 2020, 22, 15640–15648 RSC.
- C. Cappelli and B. Mennucci, Modeling the Solvation of Peptides. The Case of (s)-NAcetylproline Amide in Liquid Water, J. Phys. Chem. B, 2008, 112, 3441–3450 CrossRef CAS PubMed.
- B. Mennucci, C. Cappelli, R. Cammi and J. Tomasi, Modeling solvent effects on chiroptical properties, Chirality, 2011, 23, 717–729 CrossRef CAS PubMed.
- S. Grimme, C. Bannwarth, S. Dohm, A. Hansen, J. Pisarek, P. Pracht, J. Seibert and F. Neese, Fully Automated Quantum-Chemistry-Based Computation of Spin–Spin-Coupled Nuclear Magnetic Resonance Spectra, Angew. Chem., Int. Ed., 2017, 56, 14763–14769 CrossRef CAS PubMed.
- S. Grimme, Exploration of Chemical Compound, Conformer, and Reaction Space with Meta-Dynamics Simulations Based on Tight-Binding Quantum Chemical Calculations, J. Chem. Theory Comput., 2019, 15, 2847–2862 CrossRef CAS PubMed.
- P. Pracht, F. Bohle and S. Grimme, Automated exploration of the low-energy chemical space with fast quantum chemical methods, Phys. Chem. Chem. Phys., 2020, 22, 7169–7192 RSC.
- E. Vass, Z. Majer, K. Kőhalmy and M. Hollósi, Vibrational and chiroptical spectroscopic characterization of γ-turn model cyclic tetrapeptides containing two β-Ala residues, Chirality, 2010, 22, 762–771 CAS.
- P. Bouř, J. Kim, J. Kapitan, R. Hammer, R. Huang, L. Wu and T. Keiderling, Vibrational circular dichroism and IR spectral analysis as a test of theoretical conformational modeling for a cyclic hexapeptide, Chirality, 2008, 20, 1104–1119 CrossRef PubMed.
- R. B. Merrifield, Solid Phase Peptide Synthesis. I. The Synthesis of a Tetrapeptide, J. Am. Chem. Soc., 1963, 85, 2149–2154 CrossRef CAS.
- W. Chan and P. White, Fmoc Solid Phase Peptide Synthesis: A Practical Approach, Oxford University Press, Oxford, 1999 Search PubMed.
- E. A. Karlsen, W. Stensen, E. Juskewitz, J. Svenson, M. Berglin and J. S. M. Svendsen, Anti-Colonization Effect of Au Surfaces with Self-Assembled Molecular Monolayers Functionalized with Antimicrobial Peptides on S. epidermidis, Antibiotics, 2021, 10, 1516 CrossRef CAS PubMed.
- K. D. R. Eikås, M. Krupova, T. Kristoffersen, M. T. P. Beerepoot and K. Ruud, Replication Data for: can the absolute configuration of cyclic peptides be determined with vibrational circular dichroism?, DataverseNO V1, 2023 DOI:10.18710/FBHIJK, DataverseNO,V1.
- A. D. Becke, A new mixing of Hartree Fock and local density functional theories, J. Chem. Phys., 1993, 98, 1372–1377 CrossRef CAS.
- C. Lee, W. Yang and R. G. Parr, Development of the Colle-Salvetti correlation-energy formula into a functional of the electron density, Phys. Rev. B: Condens. Matter Mater. Phys., 1988, 37, 785–789 CrossRef CAS PubMed.
- A. D. McLean and G. S. Chandler, Contracted Gaussian basis sets for molecular calculations. I. Second row atoms, Z = 11–18, J. Chem. Phys., 1980, 72, 5639–5648 CrossRef CAS.
- R. Krishnan, J. S. Binkley, R. Seeger and J. A. Pople, Self-consistent molecular orbital methods. XX. A basis set for correlated wave functions, J. Chem. Phys., 1980, 72, 650–654 CrossRef CAS.
- V. Barone and M. Cossi, Quantum Calculation of Molecular Energies and Energy Gradients in Solution by a Conductor Solvent Model, J. Phys. Chem. A, 1998, 102, 1995–2001 CrossRef CAS.
- M. Cossi, N. Rega, G. Scalmani and V. Barone, Energies, structures, and electronic properties of molecules in solution with the C-PCM solvation model, J. Comput. Chem., 2003, 24, 669–681 CrossRef CAS PubMed.
- M. J. Frisch et al. Gaussian 16 Revision B.01, Gaussian Inc., Wallingford CT, 2016 Search PubMed.
- V. Liegeois, DrawSpectrum Version 1.6.100, 2015 Search PubMed.
- J. P. Merrick, D. Moran and L. Radom, An Evaluation of Harmonic Vibrational Frequency Scale Factors, J. Phys. Chem. A, 2007, 111, 11683–11700 CrossRef CAS PubMed.
- B. Mennucci and J. M. Martínez, How to Model Solvation of Peptides? Insights from a Quantum-mechanical and Molecular Dynamics Study of N-Methylacetamide. 1. Geometries, Infrared, and Ultraviolet Spectra in Water, J. Phys. Chem. B, 2005, 109, 9818–9829 CrossRef CAS PubMed.
- C. Cappelli, C. O. Silva and J. Tomasi, Solvent effects on vibrational modes: ab initio calculations, scaling and solvent functions with applications to the carbonyl stretch of dialkyl ketones, THEOCHEM, 2001, 544, 191–203 CrossRef CAS.
- E. Lamparska, V. Liégeois, O. Quinet and B. Champagne, Theoretical Determination of the Vibrational Raman Optical Activity Signatures of Helical Polypropylene Chains, ChemPhysChem, 2006, 7, 2366–2376 CrossRef CAS PubMed.
- V. Liégeois, O. Quinet and B. Champagne, Vibrational Raman optical activity as a mean for revealing the helicity of oligosilanes: a quantum chemical investigation, J. Chem. Phys., 2005, 122, 214304 CrossRef PubMed.
- G. Zuber and W. Hug, Rarefied Basis Sets for the Calculation of Optical Tensors. 1. The Importance of Gradients on Hydrogen Atoms for the Raman Scattering Tensor, J. Phys. Chem. A, 2004, 108, 2108–2118 CrossRef CAS.
- T. Kuppens, W. Langenaeker, J. P. Tollenaere and P. Bultinck, Determination of the Stereochemistry of 3-Hydroxymethyl-2,3-dihydro-[1,4]dioxino[2,3-b]-pyridine by Vibrational Circular Dichroism and the Effect of DFT Integration Grids, J. Phys. Chem. A, 2003, 107, 542–553 CrossRef CAS.
- M. A. J. Koenis, O. Visser, L. Visscher, W. J. Buma and V. P. Nicu, GUI Implementation of VCDtools, A Program to Analyze Computed Vibrational Circular Dichroism Spectra, J. Chem. Inf. Model., 2020, 60, 259–267 CrossRef CAS PubMed.
- K. H. Hopmann, J. Šebestík, J. Novotná, W. Stensen, M. Urbanová, J. Svenson, J. S. Svendsen, P. Bouř and K. Ruud, Determining the Absolute Configuration of Two Marine Compounds Using Vibrational Chiroptical Spectroscopy, J. Org. Chem., 2012, 77, 858–869 CrossRef CAS PubMed.
- W. Dinku, J. Isaksson, F. G. Rylandsholm, P. Bouř, E. Brichtová, S. U. Choi, S.-H. Lee, Y.-S. Jung, Z. S. No, J. S. M. Svendsen, A. J. Aasen and A. Dekebo, Antiproliferative activity of a novel tricyclic triterpenoid acid from Commiphora africana resin against four human cancer cell lines, Appl. Biol. Chem., 2020, 63, 1–11 Search PubMed.
- L. Allen, J. Scott, A. Brand, M. Hlava and M. Altman, Publishing: credit where credit is due, Nature, 2014, 508, 312–313 CrossRef PubMed.
- A. Brand, L. Allen, M. Altman, M. Hlava and J. Scott, Beyond authorship: attribution, contribution, collaboration, and credit, Learn. Publ., 2015, 28, 151–155 CrossRef.
- A. Tay Researchers are embracing visual tools to give fair credit for work on papers. https://www.natureindex.com/news-blog/researchers-embracing-visual-tools-contribution-matrix-give-fair-credit-authors-scientific-papers Published: 2021-1-22, accessed: 2023-1-29.
Footnote |
| † Electronic supplementary information (ESI) available: Additional IR and VCD spectra of 7a, 7b and 8. Detailed description of peptide synthesis and purification for 2, 3, 5 and 6. NMR spectra of the peptides synthesised in this work: 2, 3, 5 and 6. See DOI: https://doi.org/10.1039/d2cp04942b |
| This journal is © the Owner Societies 2023 |