
 Open Access Article
 This Open Access Article is licensed under a Creative Commons Attribution-Non Commercial 3.0 Unported Licence
United atom and coarse grained models for crosslinked polydimethylsiloxane with applications to the rheology of silicone fluids†
Aditi
Khot
 ab,
Rebecca K.
Lindsey
ac,
James P.
Lewicki
a,
Amitesh
Maiti
a,
Nir
Goldman
ad and
Matthew P.
Kroonblawd
*a
ab,
Rebecca K.
Lindsey
ac,
James P.
Lewicki
a,
Amitesh
Maiti
a,
Nir
Goldman
ad and
Matthew P.
Kroonblawd
*a
aPhysical and Life Sciences Directorate, Lawrence Livermore National Laboratory, Livermore, CA 94550, USA. E-mail: kroonblawd1@llnl.gov
bDepartment of Chemical Engineering, Purdue University, West Lafayette, Indiana 47907, USA
cDepartment of Chemical Engineering, University of Michigan, Ann Arbor, Michigan 48109, USA
dDepartment of Chemical Engineering, University of California, Davis, California 95616, USA
First published on 15th March 2023
Abstract
Siloxane systems consisting primarily of polydimethylsiloxane (PDMS) are versatile, multifaceted materials that play a key role in diverse applications. However, open questions exist regarding the correlation between their varied atomic-level properties and observed macroscale features. To this effect, we have created a systematic workflow to determine coarse-grained simulation models for crosslinked PDMS in order to further elucidate the effects of network changes on the system's rheological properties below the gel point. Our approach leverages a fine-grained united atom model for linear PDMS, which we extend to include crosslinking terms, and applies iterative Boltzmann inversion to obtain a coarse-grain “bead-spring-type” model. We then perform extensive molecular dynamics simulations to explore the effect of crosslinking on the rheology of silicone fluids, where we compute systematic increases in both density and shear viscosity that compare favorably to experiments that we conduct here. The kinematic viscosity of partially crosslinked fluids follows an empirical linear relationship that is surprisingly consistent with Rouse theory, which was originally derived for systems comprised of a uniform distribution of linear chains. The models developed here serve to enable quantitative bottom-up predictions for curing- and age-induced effects on macroscale rheological properties, allowing for accurate prediction of material properties based on fundamental chemical data.
1 Introduction
Silicone materials comprised primarily of polydimethylsiloxane (PDMS) are used for a wide range of applications as elastomers, coatings, adhesives, and oils.1,2 There is a seemingly limitless ability to tune the rheological, mechanical, and shape-filling properties of silicones through addition of fillers and manipulation of side groups, chain mass distributions, and network connectivity.3–5 Even comparatively simple unfilled PDMS materials can exhibit vastly different characteristics owing to differences in the latter two properties, which are frequently controlled through mechanisms that form chemical crosslinks. Chemical crosslinking can stiffen moduli of silicone elastomers and post-cure reactions can lead to undesirable enbrittlement or permanent set.6–8 In silicone liquids, crosslinking leads to increases in viscosity and potentially gelation.6,9–11 While general structure–property trends that link network structure with rheological and mechanical properties are well understood,12,13 it remains difficult to quantitatively predict these macroscale properties from fundamental atomic-scale alterations to network structure. Shear viscosity in particular remains a difficult property to predict as there is no parameter-free theory for the shear viscosity of liquids.14 Indeed, even the oft-followed Arrhenius temperature dependence of liquid shear viscosity cannot be derived from first principles nor the prefactor or activation energy term related to fundamental molecular processes. This shortcoming in theory leaves molecular dynamics (MD) simulations15,16 and experiments17–19 as the main methods by which one can obtain data to fit empirical viscosity models.Classical MD provides a powerful tool to predict, understand, and optimize relationships between network structure and the rheological/mechanical properties of polymer materials.20,21 Standard classical MD uses an all-atom or united-atom (UA) approach where system properties are determined from trajectories obtained by integrating classical equations of motion for each (united) atom. UA simulations typically subsume hydrogen atoms into the heavy parent atom as a first-level coarse graining, for instance treating a methyl (CH3) group as a single particle with a mass of 15 g mol−1. Classical MD depends upon availability of accurate force field (FF) models to describe particle interactions for the particular material of interest. In addition, classical MD is typically limited to sub-ms and sub-μm time and length scales due to the presence of high-frequency bond vibrations (e.g., C–C, C–H, etc.) that necessitate use of a small simulation time step (on the order of 1.0 fs) as well the need to represent each (united) atom individually, which yields a large number of particles in the simulation. In contrast, polymer chain dynamics can involve relaxation processes with lifetimes that span orders of magnitude larger scales.22
These limitations have spurred the development of so-called “bead-spring-type” coarse grain (CG) FFs that treat one or more monomer units as a single particle, hence lowering the overall particle count and essentially averaging out high-frequency bond vibrations. CG-FFs holds promise as an important link in a multiscale modeling framework that can connect fundamental chemical features and reactions with macroscale mechanical and rheological properties. This could accelerate the development cycle of engineering models for curing or aging of polymer materials, which are typically fit top-down to experiments.23–25 CG-FFs can be tuned to a wide variety of experimental and computational data. Characteristic atomic-scale network alterations in silicones have been identified using traditional spectroscopic techniques such as chromatography,26 IR/Raman,11 and NMR.27,28 Density functional theory (DFT) calculations can map potential energy surfaces for chemical reactions,7,29,30 which can be used to predict rates of thermally activated chemistry. Reactive quantum-based MD (QMD) simulations provide a means to predict non-thermal chemistry in silicones such as that resulting from mechanical stress31–34 or radiolysis.35–37 These inputs can be leveraged to create CG-FF models with applicability over a wide range of conditions.
However, the CG-FFs that describe interparticle interactions for a specific material are typically determined on a case-by-case basis38–43 and do not frequently include terms for specific chemical network alterations such as crosslinks. Iterative Boltzmann inversion (IBI) has shown promise as a systematic way to obtain CG-FFs that can yield accurate predictions for mechanical properties of specific polymer systems, including those with crosslinks, provided that the degree of coarse graining remains relatively fine.38–40,42 Despite the widespread use of PDMS and its derivatives,1 there are comparatively few CG models reported for this material. One is a MARTINI-style CG-FF for linear PDMS/peptide block copolymers,44 which remains untested for PDMS mechanical or rheological properties. Huang et al.41 also developed a CG-FF for linear PDMS that similarly remains untested for these properties. To our knowledge, there is currently no CG-FF for PDMS that includes specific terms, such as crosslinking junctions, that arise during chemical curing or damage scenarios. Crosslinking in particular has high relevance as a key step in the curing of silicone elastomers. Post-cure crosslinking can arise from a range of drivers including thermal heating, reactions with unspent curing agents or environmental contaminants (e.g., water, acids, or bases), and exposure to ionizing radiation.6,45–51
In this work, we overcome these challenges through systematic development of a hierarchical pair of UA and CG-FF models for chemically crosslinked PDMS. The associated relaxation timescales for the shear viscosity of low-molar-mass silicone fluids are sufficiently short that they can be resolved with simulations performed at the UA level. This enables rigorous inspection of the impact of crosslinking processes on a macroscale property (i.e., viscosity) through direct comparisons of predictions made with the UA and CG-FF models and also facilitates validation against experimental benchmarks that we obtain here. Fig. 1 shows schematics for the two FF representations considered in this work. The base level model is a relatively fine-grained UA model, where the CH2 and CH3 subunits are treated as a single particle, thereby removing the high-frequency C–H bond vibrations. Here, we use a previously established UA model for linear PDMS, which we extend to include terms for ethyl crosslinks that can be formed during curing52 and radiation aging.6,37 We then use our UA model to parameterize a bead-spring-type CG-FF, where each siloxane monomer unit is represented by a single particle or “bead”. We train our CG-FF to UA data through a combination of IBI and a grid-based search to reproduce densities and heats of vaporization for PDMS liquids comprised of linear chains. We then apply our new models together with the Green–Kubo formalism53 to predict the shear viscosity of crosslinked and uncrosslinked silicone fluids below the gel point that capture states relevant to partial curing and material aging.
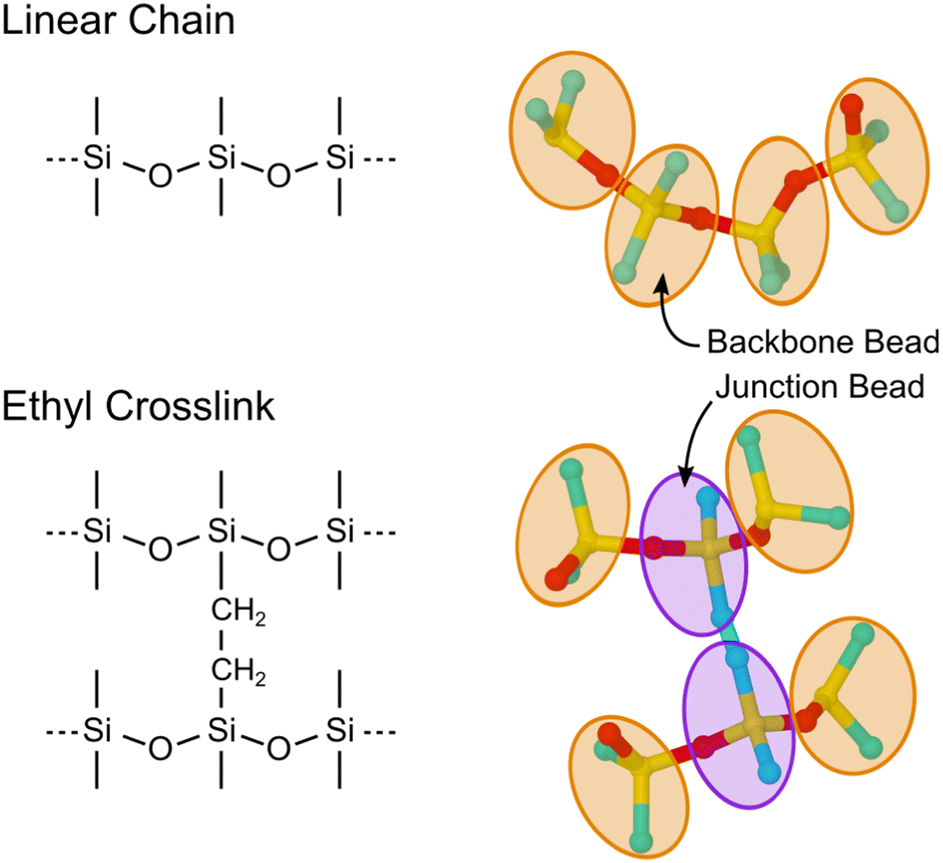 | ||
| Fig. 1 Comparison of the linear PDMS backbone and ethyl crosslinking junctions with UA and CG representations of the segments superimposed. Atoms are colored yellow, red, and cyan for Si, O, and C. The CG beads are drawn to schematically encompass the underlying atoms and are treated as point particles in MD simulations. | ||
2 Experimental details
All silicone fluid samples were obtained from both Gelest Inc., PA and Sigma Aldrich, US as either vinyl or silanol terminated linear PDMS liquids with typical polydispersity index (PDI) values of 1.05–1.20. We note that the PDI is measured as the ratio of the weight-average molar mass Mw and the number-average molar mass Mn, | (1) |
Rheology measurements were performed with a rotational rheometer (TA Instruments ARES G2, operating under strain control) in a parallel plate configuration, with a 1–2 mm constant gap (dependent on liquid viscosity) set between the plates. Each plate was 10 mm in diameter with a polished aluminum surface. Liquid samples were loaded onto the base platen by means of syringe and the top platen was lowered to the gap distance. Excess liquid was removed from the edges of the platens and in the case of very low viscosity liquids, additional liquid was injected into the gap by means of syringe if necessary. For each liquid, viscosity was determined at a fixed strain of 1.5% at room temperature over a shear rate of 0.1–1000 s−1. The kinematic viscosity was determined from the main plateau region of the plot, thus avoiding spuriously high apparent viscosity values at either very low or very high shear rates.
3 Simulation details
Classical MD simulations were performed using LAMMPS54 and with united atom (UA) and coarse grain (CG) force fields (FFs) that are described in detail below. Isochoric–isothermal (NVT) and isobaric–isothermal (NPT) ensembles were sampled using MD simulations at various points in this study. Trajectories with the UA and CG-FFs were respectively integrated with a time step of 1 fs and 10 fs unless otherwise noted. A Nosé–Hoover-style thermostat55,56 and isotropic barostat57 were used with the coupling parameters respectively set to be 100 and 1000 times larger than the time step. All MD simulation snapshots were rendered using OVITO.58The UA-FF model is based on established covalent and non-bonded potentials for linear PDMS chains, which we extend here to include crosslinking interactions. The CG-FF is of a bead-spring type that we parameterize here. Both FFs take the following general form,
 | (2) |
4 Force field parameterization
4.1 United atom force field
Several atomistic models for PDMS exist in the literature, though these have largely been parametrized for recovery of either a single state point or only structural properties. As a result, we perform a down-select of possible parameterizations for incorporation into our crosslinking models. Under hydrostatic stress, choice of non-bonded and bonded parameters is typically decoupled for structurally simple species and non-bonded parameters for moieties are generally transferable to similar species.59 Thus, we first use hexamethyldisiloxane (HMDS) to benchmark candidate UA-FF non-bonded parameters for PDMS, which we later combine with the bonded parameters from ref. 60 that have been shown to yield excellent recovery of the experimental PDMS structure factor. Non-bonded parameters from four existing UA models were considered including: model 1, which was originally intended to predict Henry's Law constants for alkanes that was subsequently fit to PDMS structure and liquid density;61 model 2, which was designed to reproduce structural predictions of a class-II all-atom PDMS model;62 model 3, which was designed to predict mass transport through PDMS;63 and model 4, which was designed to recover HMDS vapor-liquid equilibrium (VLE).60Non-bonded parameter validation for the UA model is focused on VLE prediction since it is an excellent indicator of model (temperature) transferability.64,65 The VLE curves were generated using the MCCCS-MN software package66 through configuration-bias Monte Carlo simulations67–70 in a two-cell NVTμ (Gibbs) ensemble where N, V, T, and μ are the number of particles, volume, temperature, and chemical potential. Constants in these simulations include Ntot = N1 + N2, Vtot = V1 + V2, T1 = T2, and μ1 = μ2, where subscripts “1” and “2” denote simulation cells 1 and 2. Note that in this ensemble the two cells share no explicit interface but remain in thermodynamic contact. Thermal relaxation was achieved through molecular translations, rotations, and configurational-bias moves (i.e., which sample conformational relaxation), with all bond lengths held fixed. Mechanical and chemical potential relaxation were realized through volume exchange and moves that attempt to “swap” molecules between the two simulation cells, respectively. Move probabilities were set to achieve optimal acceptance rates (see ref. 71 and 72). Simulations contained Ntot = 200 molecules and were run for 3 million equilibration moves (i.e., initial configuration “melting,” cooling, volume equilibration, and swap equilibration), followed by 6.5 million production moves, for temperatures up to 0.95 of the experimental critical point (Tc = 518.7 K, ρc = 0.263 g cm−3).73
Fig. 2 shows the density of HMDS at VLE as predicted by the four non-bonded interaction models. Unsurprisingly, we find that the models designed for transport and/or structure recovery yield poor VLE predictions. Model 4, which combined non-bonded parameters trained for VLE recovery with bonded parameters trained for structural recovery, is found to yield the best result. The model targeting Henry's Law constants (model 1) exhibits the next closest VLE performance. We note that 300 K liquid densities for those two models (respectively, 0.856 g cm−3 and 0.849 g cm−3) are both in good agreement with the experimental value of 0.899 g cm−3. Based on this assessment, we use the parameters for model 4 as our “base” model for linear PDMS chains.
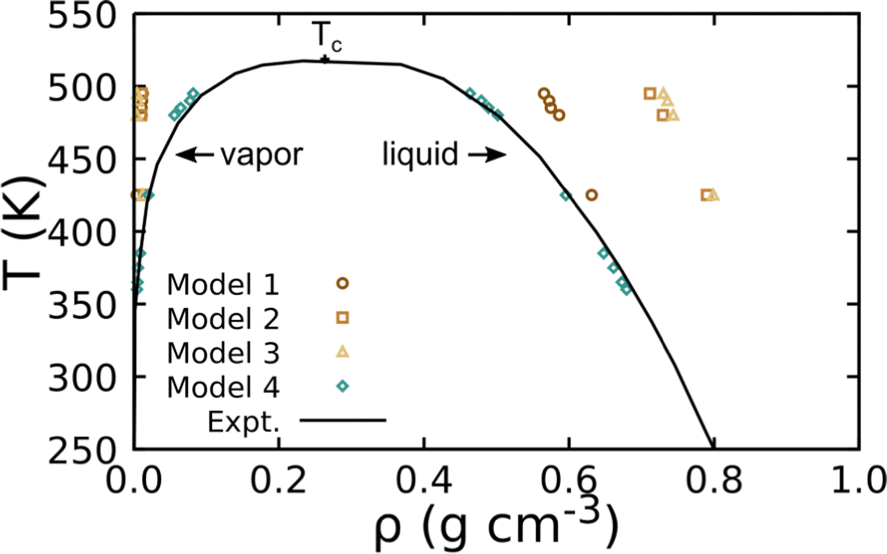 | ||
| Fig. 2 Predicted VLE for HMDS obtained using UA simulations with four different non-bonded models compared to NIST experimental data. The experimental critical point is denoted Tc. | ||
Extending the UA-FF to include ethyl crosslinks requires four unique particle types with implicit hydrogen, including Si, O, CH3, and CH2. Functional forms and parameters for the covalent and non-bonded interactions are collected in Table 1. Covalent terms involving Si, O, and CH3 were taken from the linear chain PDMS FF described above (model 4) while terms involving CH2 were either generalized (i.e., CH3 → CH2), chosen as chemically reasonable estimates, or were taken directly from FFs for other silicon-containing systems.74,75 For instance, the linear chain model included terms for the Si–O–Si–CH3 dihedral, which is expected to have similar symmetry and rotational barriers as the Si–O–Si–CH2 dihedral, so we simply used the same parameters for both (denoted Si–O–Si–CHx in the table). At the same time, the Si–CH2–CH2–Si dihedral was unlike any in the linear chain model, so we adopted the parameters for this dihedral used in ref. 74. We adopt the convention in ref. 74 and 75 that leave the C–Si–C–C and O–Si–C–C dihedrals undefined. Given this somewhat heterogeneous collection of potential energy terms, we carefully validate their accuracy below.
| Bonds | U B(r) = KB(r − r0)2 | |
|---|---|---|
| Bond type | K B (kcal mol−1 Å−2) | r 0 (Å) |
| Si–O | 350.12 | 1.64 |
| Si–CH3 | 189.65 | 1.90 |
| CH2–CH2 | 200.00 | 1.54 |
| Si–CH2 | 187.00 | 1.86 |
| Angles | U A(θ) = KA(θ − θ0)2 | |
|---|---|---|
| Angle type | K A (kcal mol−1 rad−2) | θ 0 (deg.) |
| Si–O–Si | 14.14 | 146.46 |
| O–Si–O | 94.50 | 107.82 |
| CH3–Si–CH3 | 49.97 | 109.24 |
| O–Si–CH3 | 49.97 | 110.69 |
| Si–CH2–CH2 | 49.97 | 109.24 |
| CH2–Si–CH3 | 60.00 | 110.00 |
| CH2–Si–O | 60.00 | 100.00 |
| Dihedrals |
|
||
|---|---|---|---|
| Dihedral type | Order | K D,n (kcal mol−1) | d n (unitless) |
| Si–O–Si–O | n = 1 | 0.225 | +1 |
| Si–O–Si–CHx | n = 3 | 0.010 | +1 |
| Si–CH2–CH2–Si | n = 1 | 2.600 | +1 |
| n = 2 | −0.250 | −1 | |
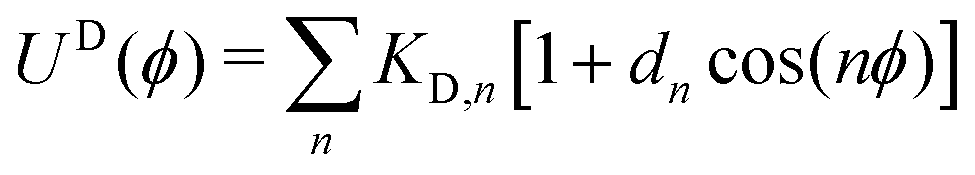
| Non-bonded | See eqn (3) for UNB(r) | ||
|---|---|---|---|
| Atom type | ε (kcal mol−1) | σ (Å) | q (e−) |
| Si | 0.0301061 | 3.51330 | +0.3 |
| O | 0.0866715 | 3.11800 | −0.3 |
| CH3 | 0.241150 | 3.81440 | +0.0 |
| CH2 | 0.241150 | 3.81440 | +0.0 |
As mentioned above, non-bonded interactions were taken from model 4, which uses a Lennard-Jones plus charges functional form:
 | (3) |
Accuracy of the UA-FF covalent potential terms was assessed through a comparison of vibrational power spectra against density functional tight binding78 (DFTB) QMD predictions. We considered two gas-phase molecules. One of these was dodecamethylpentasiloxane (DMPS), a linear 5-mer chain terminated on both ends by Si(CH3)3. The other had an ethyl crosslink between two terminated 3-mer chains. The UA-FF representations of these molecules included terminated end groups with the partial charges for the terminating Si atoms set to q = 0.15 to yield an overall charge-neutral system. The DFTB representations were all-atom (including hydrogen), but we post-processed the trajectories to map the CH3 and CH2 groups to their center of mass positions to facilitate direct comparison to the UA-FF results. The DFTB simulations were performed using the DFTB+ code79 and the pbc-0-3 parameter set (available at https://www.dftb.org), which we previously validated and applied to study siloxane chemistry.29,35–37 Additional DFTB simulation details can be found in those earlier works.
Fig. 3 shows power spectra computed using TRAVIS80 and 100 ps NVT trajectories. The DMPS molecule serves as a test on the established parameters for linear chain PDMS and the crosslinked molecule as a test on our new modifications. Comparison of the spectra for DMPS shows that the frequencies for most of the major peaks are in agreement between DFTB and the UA-FF. A notable exception is that the UA-FF exhibits a modest blue shift of the highest frequencies by ≈100 cm−1. (Note that 100 cm−1 is equivalent to 0.012 eV, which is roughly kBT/2 at 300 K.) Similar agreement is seen for the ethyl crosslinked molecule, indicating that the new FF parameters yield a reasonable description of the missing covalent interactions.
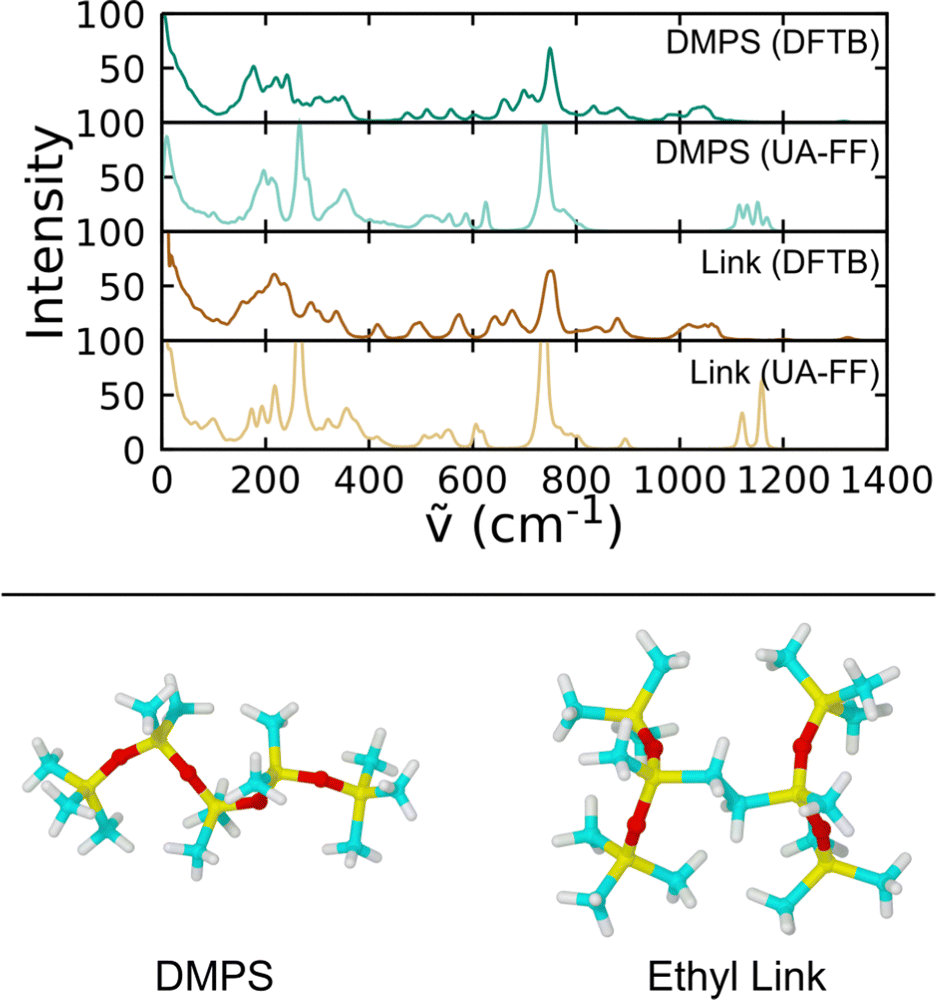 | ||
| Fig. 3 Comparison of vibrational power spectra for linear and crosslinked PDMS molecules in the gas phase at 300 K obtained using DFTB and the UA-FF. | ||
Accuracy of the UA-FF model as applied to the condensed phase was assessed through simulations of low-molar-mass liquids of small linear PDMS chains. We considered four different chain lengths including unterminated 4-, 8-, 12-, and 16-mers. The density at T = 300 K and P = 1 atm was determined through NPT simulations. Liquid configurations with 1440 monomers were prepared through a multistep procedure, with a given configuration containing chains of only a single length. There were 360, 180, 120, and 90 chains for the 4-, 8-, 12-, and 16-mer systems, respectively. First, the chains were placed in a large cubic cell that was dynamically strained during a 20 ps NVT simulation to an (80 Å)3 volume (ρ = 0.350 g cm−3). Then, a 4 ns NPT trajectory was integrated and the average volume and density were determined as the average over the last 2 ns. (We compute that the chain end-to-end vector autocorrelation decays to a value of e−1 within 2 ns for the case of a UA 16-mer system at 300 K, which exhibits the slowest relaxation dynamics of all the systems considered here.) Resulting pressure states and the heat of vaporization
| ΔHvap = 〈Egas〉 − 〈Eliq〉 +RT, | (4) |
| Density system | Expt. (g cm−3) | UA-FF (g cm−3) | UA-FF (%Err wrt Expt.) | CG-FF (g cm−3) | CG-FF (%Err wrt Expt.) | CG-FF (%Err wrt UA-FF) |
|---|---|---|---|---|---|---|
| 4-mer | 0.85 | 0.87 | 2.4 | 0.79 | −7.5 | −9.6 |
| 8-mer | 0.91 | 0.91 | 0.0 | 0.89 | −2.6 | −2.6 |
| 12-mer | 0.93 | 0.92 | −1.1 | 0.9 | −0.9 | 0.2 |
| 16-mer | 0.94 | 0.92 | −2.1 | 0.94 | 0.1 | 2.3 |
| ΔHvap system | Expt. (kcal mol−1) | UA-FF (kcal mol−1) | UA-FF (%Err wrt Expt.) | CG-FF (kcal mol−1) | CG-FF (%Err wrt Expt.) | CG-FF (%Err wrt UA-FF) |
|---|---|---|---|---|---|---|
| 4-mer | 15.1 | 13.40 | −11.3 | 11.59 | −23.2 | −13.5 |
| 8-mer | 26.7 | 21.72 | −19.0 | 21.22 | −20.8 | −2.3 |
| 12-mer | — | 30.71 | — | 29.55 | — | −3.8 |
| 16-mer | — | 38.33 | — | 36.98 | — | −3.5 |
Relative errors were computed with respect to experimental density81 and ΔHvap values41,82 and are generally smaller for the density. The experimental density data exhibited PDI >1 (see eqn (1)) and thus correspond to systems with an average number of monomers per chain that was not necessarily integer valued. We linearly interpolated the experimental data to obtain values for integer-valued degrees of polymerization to directly compare to our monodisperse systems. While the ΔHvap values in ref. 82 obtained by Flaningam were more recently obtained (ca. 1986), we also note for comparison the earlier (ca. 1946) work of Wilcock,83 whose values are consistently lower. Flaningam and Wilcock respectively obtained ΔHvap = 15.1 and 11.5 kcal mol−1 for the linear 4-mer and ΔHvap = 26.7 and 17.2 kcal mol−1 for the linear 8-mer. The purity of Flaningam's samples was substantially higher (>99%) compared to those of Wilcock (≈92% for the 8-mer), which may in part explain these differences.
The error in ΔHvap is of similar magnitude for both the 4-mer and 8-mer. Consistency between the UA-FF and experiment for VLE of (terminated) HDMS indicates these errors in ΔHvap may arise due to the unterminated chain approximation. While undesirable, these errors are relatively modest and indicate that the UA-FF with unterminated chains provides a reasonable description of low-molar-mass PDMS liquids for a bottom-up CG model parameterization.
4.2 Coarse grain force field
Parameterization of the CG-FF involved distinct stages in which we first determined a model for linear chain PDMS and then extended that model to include crosslinking terms. The linear chain PDMS model was fit in two stages. First, gas-phase simulations of isolated chains and iterative Boltzmann inversion (IBI) were used to fit tabulated covalent bond, angle, and proper dihedral potential terms. Second, with the covalent terms set, a grid-based search was used to identify optimum Lennard-Jones terms ε and σ from condensed-phase simulations. The CG-FF does not include electrostatic interactions. Extensions for crosslinking involved determining additional covalent interactions, which were obtained using IBI while keeping those covalent and nonbonded terms determined using linear chains held fixed. We note that the Lennard-Jones r−12 repulsion has been applied to a CG-FF for linear PDMS in the past41 but is steeper than other choices for nonbonded CG potentials (see for example ref. 84 and 85). This constraint may be relaxed in future work focused on improving CG-FF pressure transferability, which might also require adoption of a pressure-corrected85 or multistate86 IBI procedure.Initial guesses for the CG covalent potentials were obtained through Boltzmann inversion of UA distributions for N different molecules. That is,
 | (5) |
 | (6) |
 | (7) |
| g(ϕ) = Hist(ϕ), | (8) |
| UCG(x) = Kx[x − c(x)]2. | (9) |
The potential for a given interaction term was updated iteratively through the IBI procedure using
 | (10) |
 | (11) |
Covalent CG-FF terms for linear PDMS chains were determined using two gas-phase training molecules, namely an unterminated 6-mer and 16-mer. The level of coarse graining treats each Si(CH3)2O monomer as a single bead. Fig. 4 shows a comparison of bonded interaction distributions generated using the UA-FF and the best-fit CG-FF. There is a single bead type, which denote as type “B” for backbone, and similarly there is only one bond, angle, and dihedral type. (These are respectively denoted B–B, B–B–B, and B–B–B–B.) Inspection of Fig. 4 shows that the CG-FF reproduces the UA-FF predictions almost exactly, including subtle shifts in the bimodal angle populations between the 6-mer and 16-mer.
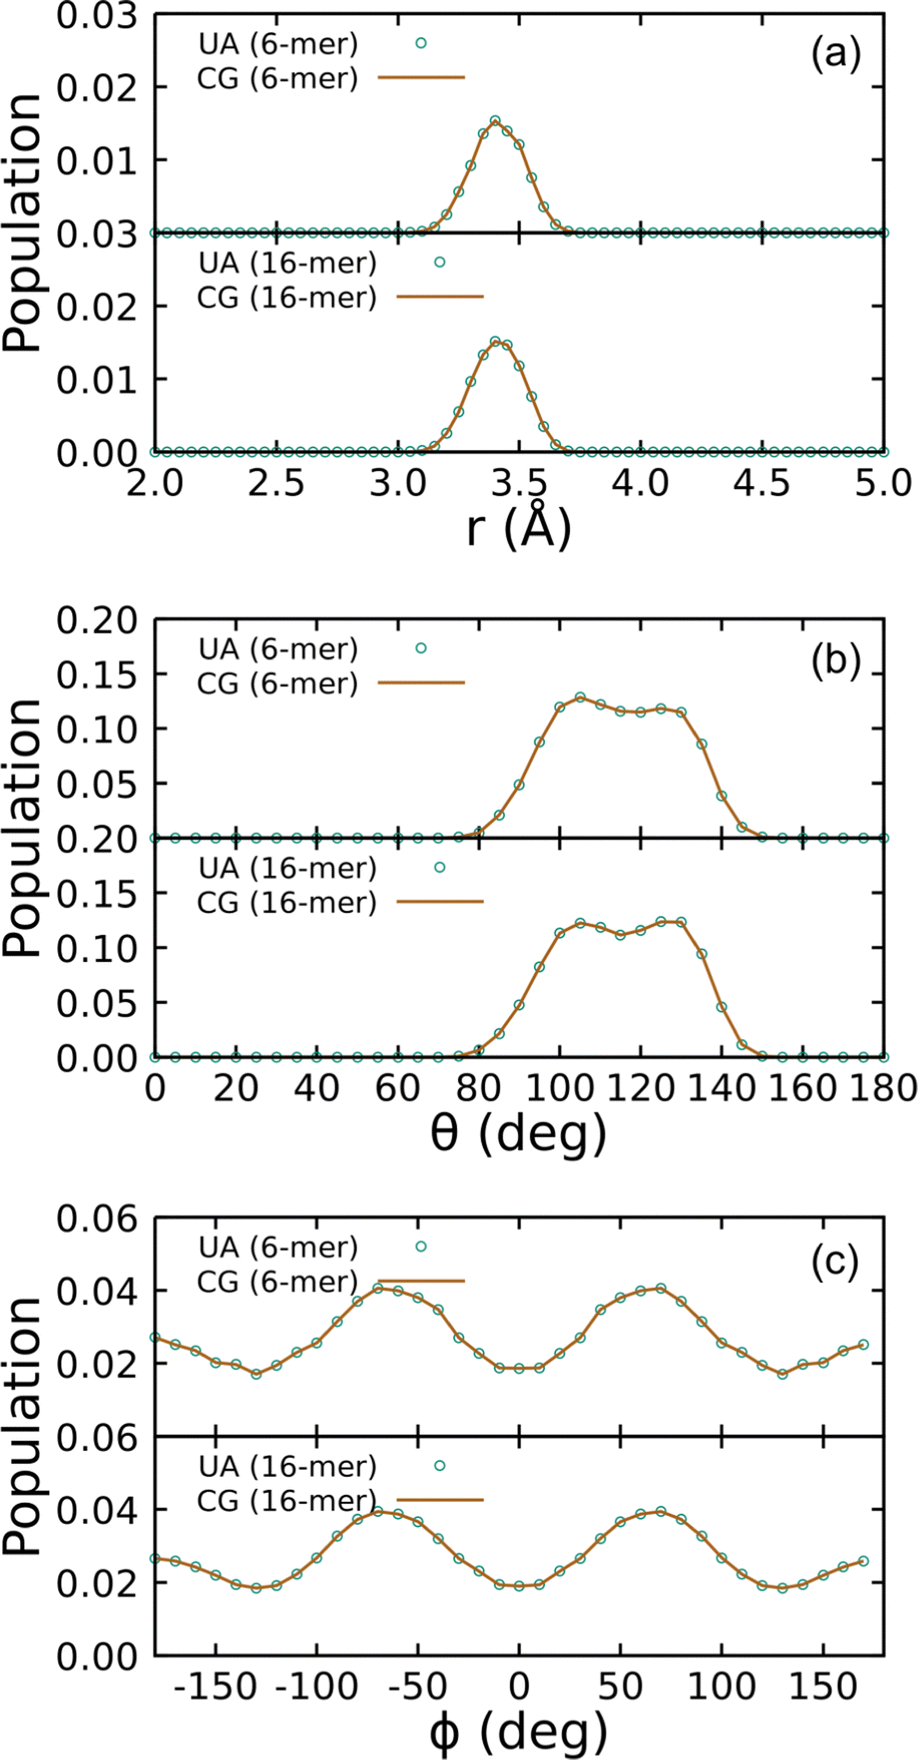 | ||
| Fig. 4 Distributions of (a) bonds, (b) angles, and (c) dihedrals for 6- and 16-mer linear PDMS chains in the gas phase at 300 K using the UA-FF and best-fit CG-FF. | ||
Non-bonded interaction parameters were optimized in a top-down manner to reproduce UA-FF values for the pressure–volume (P–V) equation of state and heat of vaporization ΔHvap of low-molar-mass PDMS fluids at 300 K. We used a grid-based search over σ and ε to find values that minimize the unitless error function
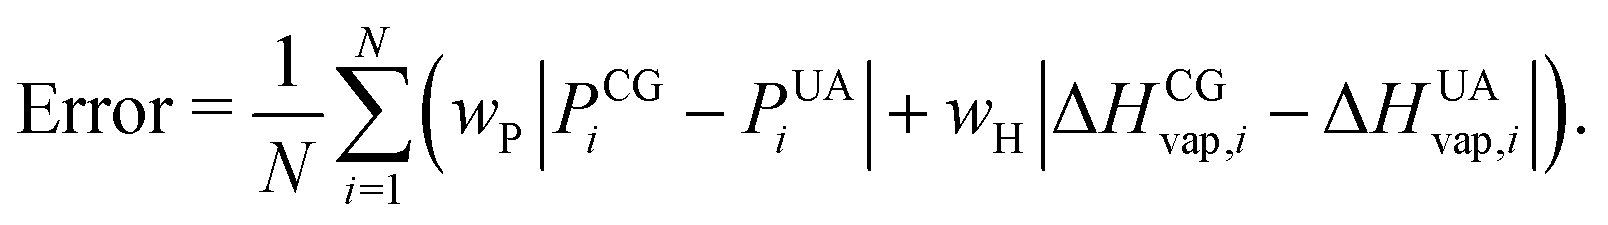 | (12) |
Fig. 5 shows the resulting error surface for fitting the CG-FF σ and ε values. Two minima were identified and the one at σ = 5.776 Å and ε = 0.350 kcal mol−1 was taken to be the best fit. While this value was not the global minimum, it yielded the best balance of error across the 8-, 12-, and 16-mer systems. (The global minimum yields a better pressure for the 12- and 16-mer systems at the expense of much larger errors for the 8-mer system.) Final calculations of the NPT-average density and the corresponding ΔHvap at that density were determined using the optimized potential parameters for 4-, 8-, 12-, and 16-mer systems and are collected in Table 2 for comparison. Of particular note is the similar magnitude and opposing sign of the error in the CG-FF predicted densities for the 4- and 16-mer systems, which reflects the choice to use parameters yielding a local rather than global minimum.
 | ||
| Fig. 5 Error surface (unitless) determining optimum Lennard-Jones parameters for the CG-FF. Chosen parameters are indicated by “+”, which corresponds to a local minimum on the surface. | ||
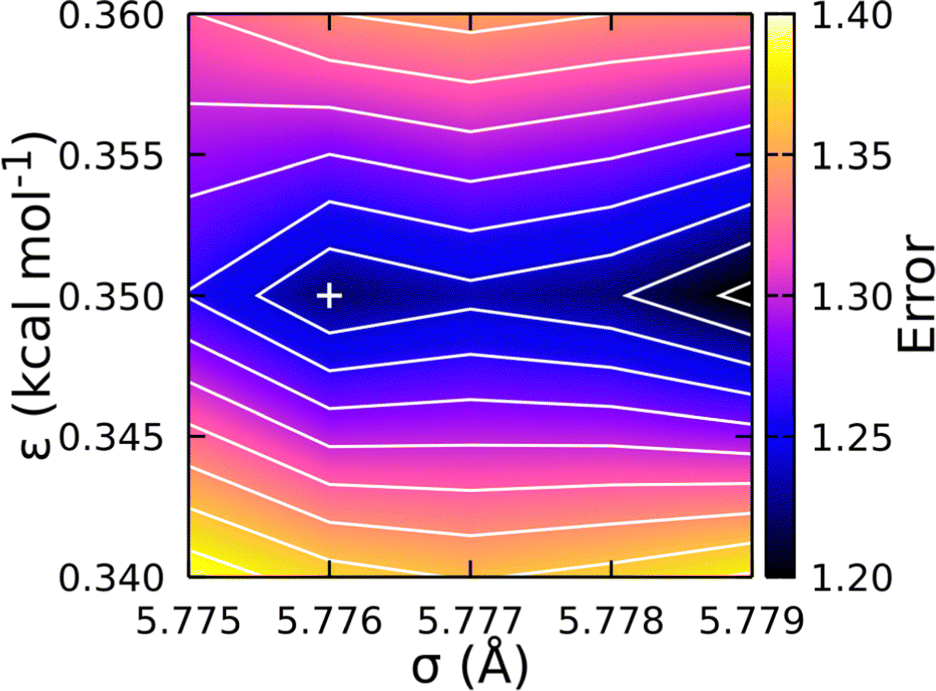
With terms for the linear chain PDMS CG-FF set, we extended the model to account for ethyl-type chemical crosslinks. This extension requires the introduction of two different junction beads, denoted J1 and J2. Two different junction bead types were considered to account for situations in which two adjacent monomers on the same chain are involved in crosslinks, which leads to chemically distinct topology motifs such as the J1–J2 bond, the J1–J2–J2 angle, and the J1–J2–J2–J1 dihedral. Non-bonded potential terms for the junction beads were taken to be the same as for backbone (B-type) beads determined just above. New covalent interactions were defined and fit using the IBI procedure applied to gas-phase simulations of the four molecules shown at the bottom of Fig. 6. Distributions of the various bonds, angles, and dihedrals were obtained using UA-FF simulations of the four crosslinked molecules and are shown in the left-hand column of the figure. Distinct classes were identified from these distributions and were used to define a smaller set of new bond, angle, and dihedral types. Specific interactions belonging to each type are collected in Table 3. Potentials for each interaction type were fit using the same IBI protocol applied to linear chains. The resulting CG distributions are shown in the right-hand column of the figure.
 | ||
| Fig. 6 Distributions of bonds, angles, and dihedrals for the four training molecules in the gas phase at 300 K using the UA-FF and best-fit CG-FF. Descriptions of the bead, bond, angle, and dihedral types are given in the text. | ||
| Bonds | ||||
| Type A | B–B | B–J1 | B–J2 | J2–J2 |
| Type B | J1–J2 | |||
| Angles | ||||
| Type A | B–B–B | B–B–J1 | B–B–J2 | B–J1–B |
| B–J2–J2 | ||||
| Type B | B–J1–J2 | B–J2–J1 | J1–J2–J2 | |
| Dihedrals | ||||
| Type A | B–B–B–B | B–B–B–J1 | B–B–B–J2 | B–B–J1–B |
| B–B–J2–J2 | B–J2–J2–B | |||
| Type B | B–B–J1–J2 | B–B–J2–J1 | B–J2–J2–J1 | |
| Type C | B–J1–J2–B | B–J1–J2–J2 | ||
| Type D | J1–J2–J2–J1 | |||
The fitted CG-FF reproduces most of the UA-FF distributions with good qualitative accuracy. Some fidelity is lost, which can be seen in the generally narrower distributions that is especially apparent for angle type “A”. However, the choice to include only two bond and angle types and four dihedral types is well motivated by the distributions and reduces the complexity of bookkeeping involved with the topology files of crosslinked systems. We note that the likelihood of forming J2-type beads and their corresponding interactions is quite low in systems with randomly distributed crosslinks. For this reason, we did not consider situations where a single bead is involved in more than one crosslink (e.g., having angle J1–J2–J1), which are even less likely.
5 Properties of crosslinked PDMS fluids
5.1 Crosslinking procedure and structural metrics
Molecular-scale configurations of crosslinked liquids were generated through a procedure in which crosslinks were added iteratively over a pico-to-nanosecond scale simulation. This procedure starts with a pre-equilibrated liquid configuration of linear chains and involves four distinct steps:• Select uncrosslinked monomer M1 at random from among the chains in a liquid.
• Identify as M2 the closest monomer to M1 that is not directly bonded to M1. The types of these two monomers are changed from B → J.
• Define a crosslinking bond between monomers M1 and M2, update all bond, angle, and dihedral topology accordingly, and update molecule IDs if the crosslink is between two different chains.
• Equilibrate the system with the new crosslink between M1 and M2 through a simulation consisting of a 10 ps NVT trajectory followed by 90 ps of NPT trajectory.
• Repeat Steps 1–4 to form additional crosslinks.
These steps are modified slightly for UA simulations with explicit methyl and ethyl groups. In this case, one of the CH3 groups is chosen as the M1 site and the nearest CH3 group that is separated by four or more covalent bonds is chosen as the M2 site. The CH3 groups chosen as M1 and M2 are then converted to CH2 groups and the bonds, angles, and dihedrals are updated accordingly. Note that both the UA and CG simulations lose the equivent of an H2 mass with each crosslink, consistent with the chemistry for their formation.
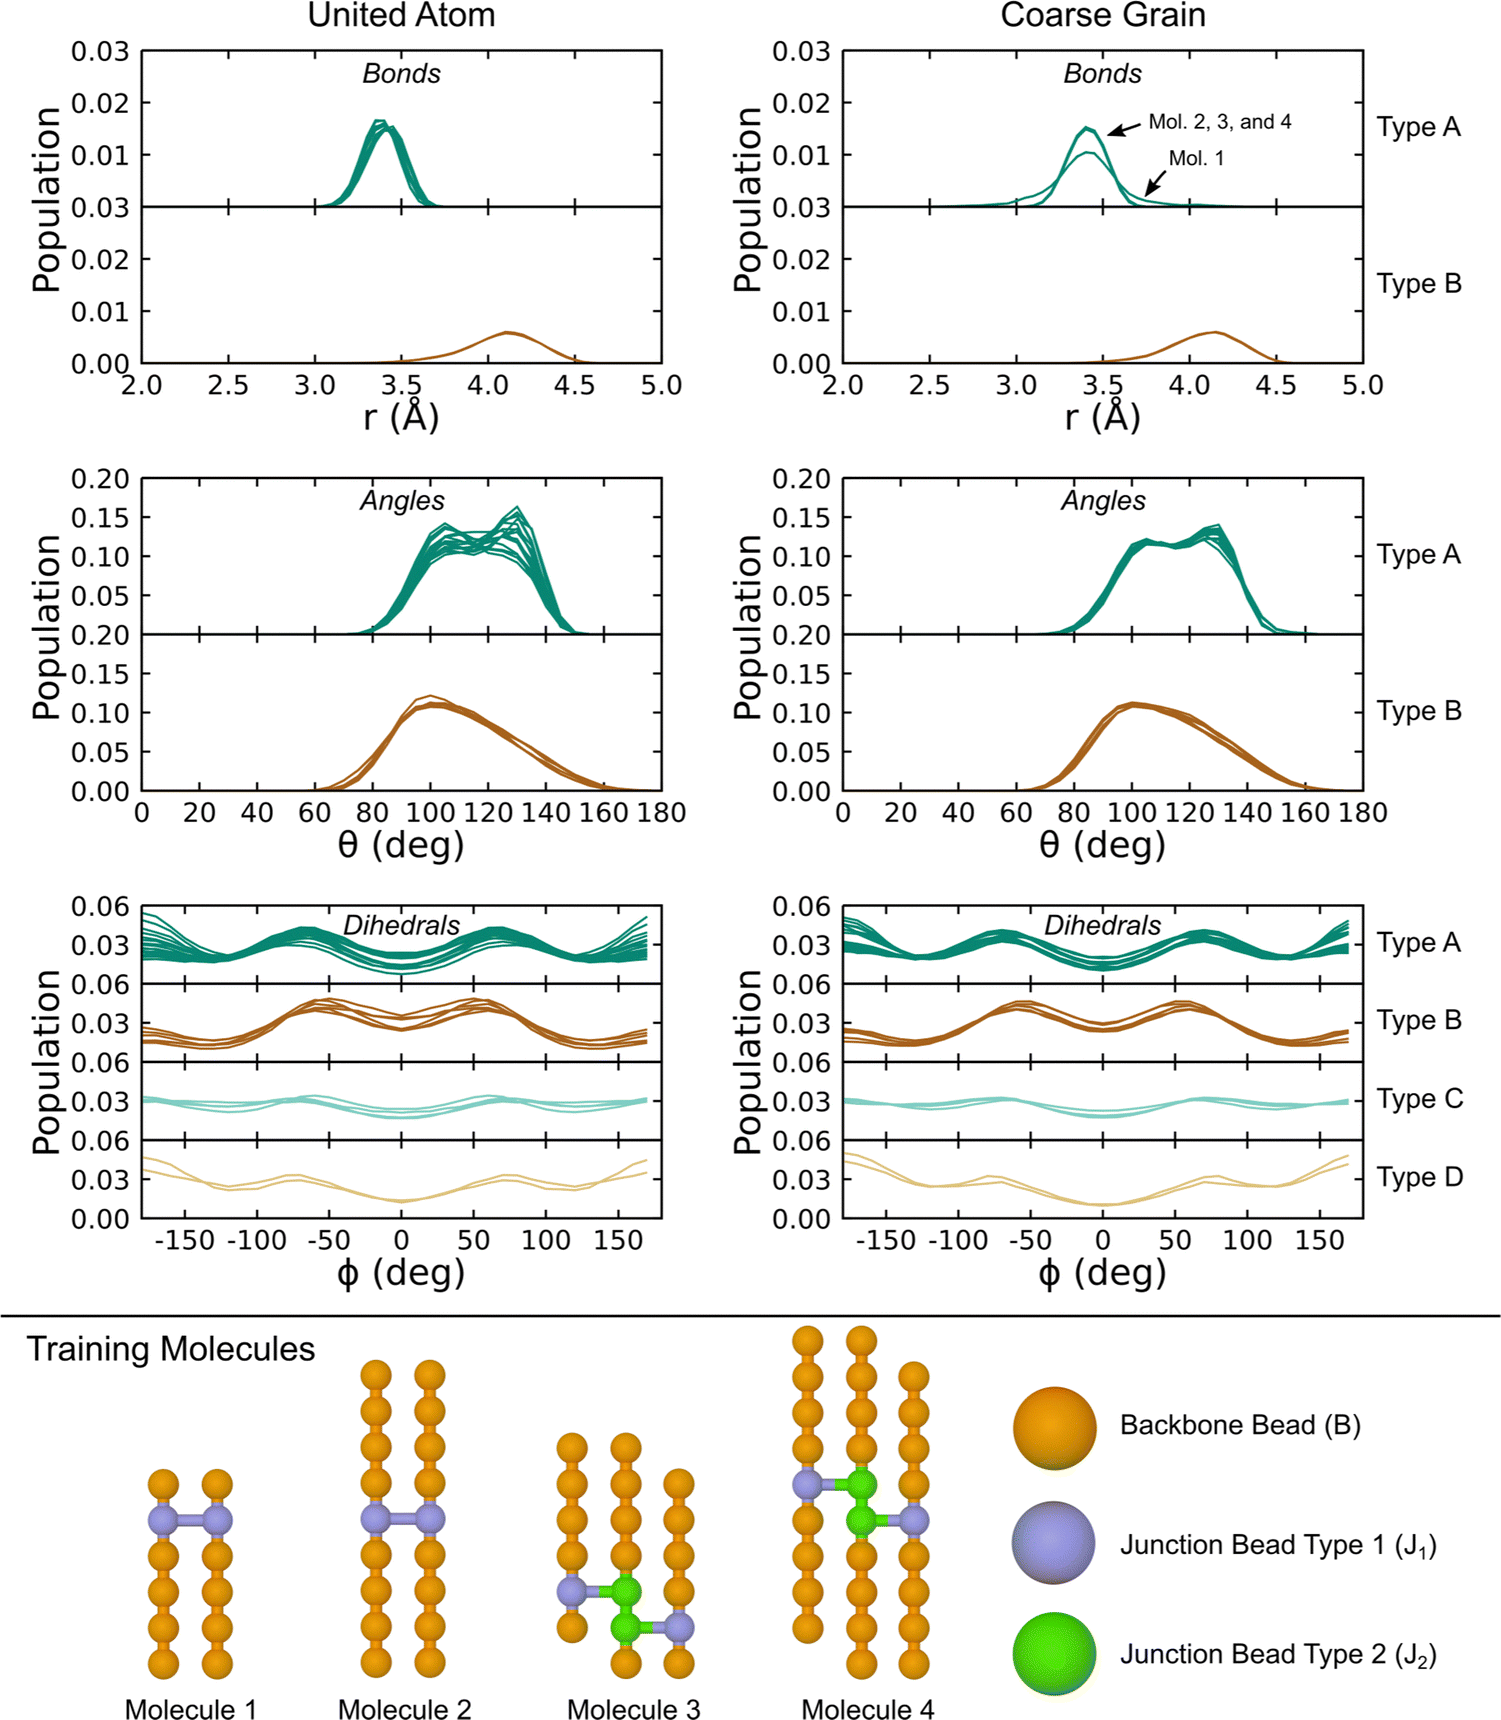
Representative crosslinked liquids were obtained from five independent crosslinking simulations for both the UA-FF and CG-FF models starting from a linear chain liquid with 300 8-mers. These simulations were iterated up to a total of 50 crosslinks over 5 ns. Fig. 7(a) shows the final mass spectrum from one of these simulations and the inset shows a configuration snapshot highlighting the crosslinking sites. Branched chains with up to 40 monomers (mass ≈ 3000 Da) are produced, with the populations of these larger chains decreasing with increasing mass in an exponential-like manner. Crosslinks can form at any point along the chain, including at terminal groups. For instance, the two example configurations with 1 link highlight how links can form between two mid-chain monomers (top) and between a mid-chain monomer and a terminal monomer (bottom). While we do not explore higher-order statistics such as the distribution of chain lengths between linkers, future work might consider quantifying and biasing these distributions to match experimental distributions such as those obtained from multiquantum NMR.87 Configurations containing 1, 2, 5, 10, 20, 30, 40, and 50 crosslinks were extracted for further study.
 | ||
| Fig. 7 (a) Typical chain mass distribution for an 8-mer liquid system with 50 randomly formed crosslinks. The inset shows a UA simulation snapshot with crosslinking atoms as large purple beads, Si–O backbones as black lines, and the primary simulation cell rendered with green lines. Typical crosslinked chain configurations are shown to the right with C, O, and Si atoms colored cyan, red, and yellow and where non-crosslinking methyl groups have been deleted for clarity. (b) Density of a 300-chain 8-mer liquid at 300 K as a function of number of crosslinks predicted using the UA-FF and CG-FF. Data points are MD data and lines are weighted linear least-squares fits. (c) Polydispersity index Mw/Mn during the crosslinking process. Heavy lines indicate the single UA and CG simulations used to seed viscosity calculations and light lines indicate the other four simulations used to determine an average density. | ||
The equilibrium density for a given number of crosslinks was determined through NPT simulations, with the results plotted in Fig. 7(b). We express these densities in units of kg m−3 rather than g cm−3 due to the small variation (1 g cm−3 = 1000 kg m−3). Each data point corresponds to the ensemble average of five contributing simulations. Standard error of the ensemble mean density is on the order of the symbol size in the plot.
Changes in density are largely the result of the structural effects from crosslinking that serve to decrease the equilibrium volume. Formation of 50 crosslinks leads to a mass loss of 1.67 × 10⁻²⁵ kg due to “evolution” of H2. At constant volume, this mass loss would lead to a decrease in the density of approximately 0.5 kg m−3. This contrasts with the observed increase in density of 12.3 kg m−3 for the UA model and 15.7 kg m−3 for the CG model.
Both the UA and CG-FF models yield surprisingly similar density trends with increasing number of crosslinks. Despite an initial offset that arises from the difference in the initial density of the linear liquid, both models predict an approximately linear trend with very similar slope. Weighted linear least-squares fits give slope parameters of 0.243 ± 0.003 and 0.313 ± 0.003 kg m−3 link−1 for the UA and CG models, respectively. Thus, these density trends differ by less than 30%. Similar trends can be seen for linear liquids with increasing chain molar mass in Table 2, with the density of the CG model increasing more rapidly with chain length than the UA one.
Fig. 7(c) shows the PDI for each crosslinking simulation computed using eqn (1). The PDI gives a scalar measure of the chain size distribution and is larger than unity for systems with nonuniform chain distributions. As can be seen from the plot, the PDI increases approximately linearly with increasing number of crosslinks and exhibits only modest run-to-run variability. Discrete jumps arise from the stochastic nature of the crosslinking procedure as chains with multiple branch points are generated. The maximum PDI reached during the crosslinking simulations is ≈1.3.
5.2 Shear viscosity
 | (13) |
 | (14) |
Practical evaluation of η requires determining three separate time scales including the sampling period tsample for recording σαβ, the maximum time lag tblock for computing the ACF, and the total simulation time tsim. The first time scale tsample must be sufficiently small to capture oscillations in the ACF while being large enough to reduce the computational cost of evaluating the ACF through a fast Fourier transform. We initially sampled shear stresses with tsample = 1 fs, but used tsample = 2 fs in our final evaluations as it yielded the same results within uncertainty. The second time scale tblock sets the integral upper limit, which we take to be tblock/2. Here, tblock is perhaps the most important time scale as it must be large enough such that the ACF decays sufficiently close to zero for the integral to converge, but small enough to yield enough samples (Nsample,max = tsim/tblock) of the ACF to obtain good statistics for an ensemble average. In general, tblock cannot be set a priori and convergence with tblock must be determined independently for each case. The last time scale tsim controls the uncertainty of the calculation, as it determines the maximum number of samples Nsample,max of the ACF used for computing the average under the integral.
We adopted a bootstrapping approach for rigorous calculation of uncertainties in the evaluation of eqn (13). We first summarize this approach and then discuss the calculation with a specific example below. The main steps include:
• For a given tsim and tblock, compute the set of Nsample,max independent evaluations of the shear stress ACF.
• Through bootstrapping-based resampling of the set of ACFs, evaluate the average ACF and integrate it to obtain η a total of Nresample times.
• Compute the median η50% value and the 95% confidence interval (CI) as (η2.5%, η97.5%) from the sampling distribution of η obtained through bootstrapping.
• Obtain the optimum tblock as the minimum value for which the median η50% value is within the 95% CI of η computed with all larger tblock values.
For each state point, we performed 10 independent NVT simulations to build up a large cumulative tsim of 200 ns. Note that each contributing NVT simulation was 20 ns long and evenly divisible by all tblock values considered. Specific tblock were chosen to follow a pseudo-logarithmic pattern with the smallest value being 1 ps and the largest being 4000 ps. The minimum ACF set size was Nsample,max = 50 (obtained with the largest tblock), and is sufficiently large for a reliable bootstrapping analysis.
Fig. 8 shows how the bootstrapping uncertainty analysis is parametrically coupled with choices for tsim and tblock for an accurate determination of η in the case of UA simulations of a liquid with uncrosslinked 8-mers at 300 K and 1 atm. Panel (a) shows several representative ACFs from the entire set. Fluctuations with a period smaller than 10 fs are apparent, which are fully captured with our choice of tsample = 2 fs. Panel (b) shows how bootstrapping is used to build up a sampling distribution as a function of the resampling index (or iteration) for several ACF set sizes Nsample computed with fixed tblock = 1 ps. Each point along the x-axis corresponds to an evaluation of η for a given bootstrap resampling of the Nsample ACFs. As Nsample is increased, the resulting distribution of η narrows from η50% = 0.297 mPa s with (η2.5% = 0.191, η97.5% = 0.419) for Nsample = 10 down to η50% = 0.333 mPa s with (η2.5% = 0.330, η97.5% = 0.337) for Nsample = 10![[thin space (1/6-em)]](https://www.rsc.org/images/entities/char_2009.gif) 000. We take the number of bootstrap resamplings to be Nresample = 1000 for all our calculations, which is sufficiently large to obtain a reliable estimate of the distribution for computing the median η50% and its 95% CI. Panel (c) shows how the relative error varies as a function of Nsample. Based on panels (b) and (c) and the computational expense of the analysis with very large Nsample, we set the maximum sample size to be the lesser of 1000 or Nsample,max = tsim/tblock.
000. We take the number of bootstrap resamplings to be Nresample = 1000 for all our calculations, which is sufficiently large to obtain a reliable estimate of the distribution for computing the median η50% and its 95% CI. Panel (c) shows how the relative error varies as a function of Nsample. Based on panels (b) and (c) and the computational expense of the analysis with very large Nsample, we set the maximum sample size to be the lesser of 1000 or Nsample,max = tsim/tblock.
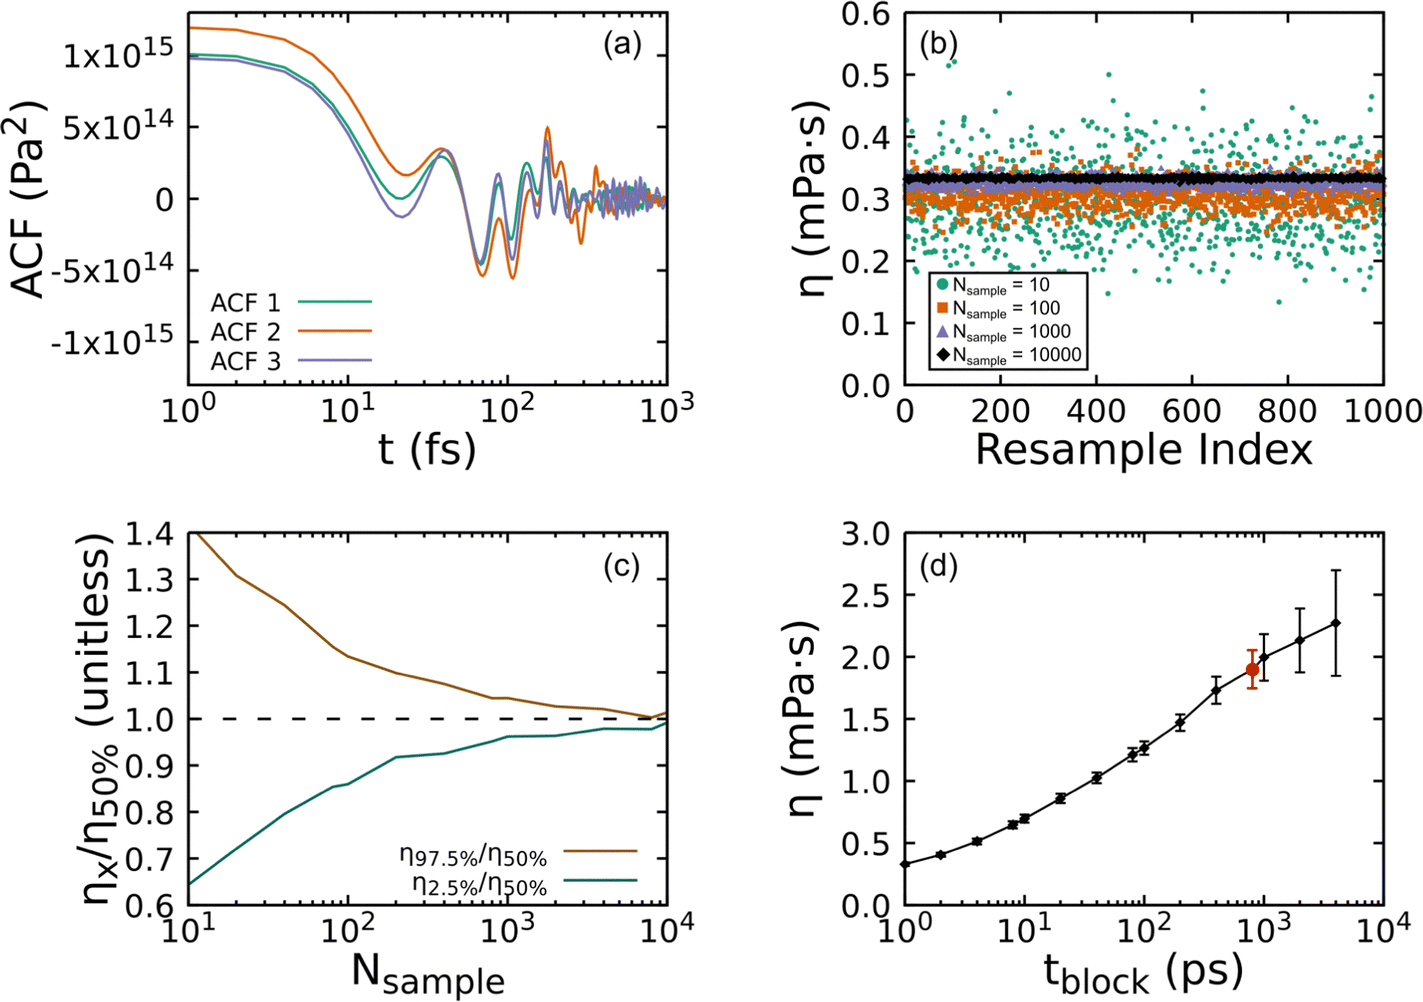 | ||
| Fig. 8 Steps in calculation of shear viscosity for an uncrosslinked 8-mer PDMS liquid at 300 K and 1 atm simulated using the UA-FF. (a) Example shear stress ACFs. (b) Bootstrapping estimates for η computed for fixed tblock = 1 ps with different ACF sample sizes plotted as a function of resampling index. (c) Error in predicted η for fixed tblock = 1 ps plotted as a function of sample size, where error is measured as a ratio of the upper (η97.5%) and lower (η2.5%) bounds for the 95% CI with respect to the median η50%. (d) Convergence of η with respect to tblock, with the optimum tblock = 800 ps highlighted as a red circle symbol. | ||
The final and most important consideration in evaluating η is captured by Fig. 8(d), which shows how η depends on tblock. As can be clearly seen, too small of tblock will yield a value for η that has small uncertainty, but that converges to the wrong value. However, too large of a tblock leads to large uncertainties stemming from too few samples. Given very long simulations, one expects the viscosity to increase with increasing tblock before reaching a plateau that is followed by scatter due to poor statistics.89 This makes identification of the plateau region a key consideration that must be balanced against the computational expense of the underlying simulations and the degree of accuracy and precision required. Ideally, one would seek to minimize sampling beyond the plateau.
As mentioned above, we systematically identified the optimum tblock for each state point as the smallest tblock value for which the resulting median η50% value falls within the 95% CI (2σ uncertainty) for all calculations with larger tblock. This approach inspects for stabilization of the CI and its lower bound rather than the mean or median. In the present example, the optimum is tblock = 800 ps, which is highlighted as a red circle data point in the plot. It should be noted that while the 95% CI has stabilized, the median continues to grow slowly (a trend that is exaggerated by the log scale). Based on this assessment, convergence cannot be statistically ruled out, but remains undetermined. While substantially longer trajectories beyond the 200 ns integrated for each state point would be required to conclusively demonstrate convergence, the values presently obtained can be reasonably interpreted as lower bounds. The optimum tblock derived with this approach is parametrically dependent on the error tolerance. In the present example, adopting a less conservative 68% CI (1σ uncertainty) yields a slightly larger optimum tblock = 1000 ps. We also note that while this example exhibits an apparent (but statistically insignificant) increase in η50% for tblock > 800 ps, other cases exhibit non-monotonic scatter for tblock greater than the derived optimum value.
While viscosity is our primary focus, the equilibrium simulations used to obtain the viscosity can also be used to obtain other dynamical properties. As will be discussed in the following section, these properties are expected to scale with chain length and with the degree of coarse graining. To enrich these comparisons, we computed the diffusion coefficient of the chain center of mass for our systems without crosslinks using the standard definition in terms of mean-squared displacement
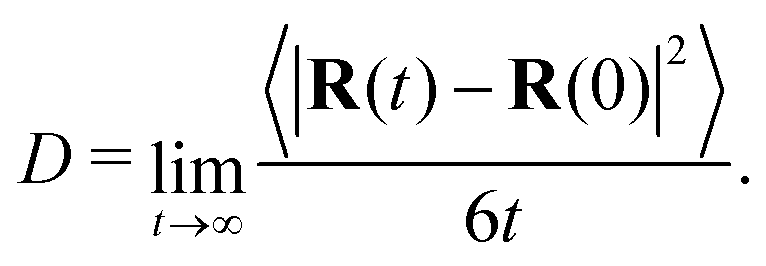 | (15) |
The shear viscosity of silicone fluids was determined as a function of molar mass for linear chain systems through experiments and for both linear and crosslinked chain systems via simulations performed with the UA and CG models. The experiments were performed following the procedure discussed in Section 2 on linear chain systems with a low PDI. Simulations were performed following the procedure described just above to determine the viscosity at 300 K for liquids comprised of 4-, 8-, 12-, and 16-mer linear chains without crosslinks and for crosslinked 8-mer systems. All comparisons below are made considering the kinematic viscosity ν as this is directly measured in experiments, but we note that the magnitude of the kinematic (in cSt units) and dynamic (in mPa s units) viscosities are quite similar as the density in g cm−3 units is close to unity. The collected results from these experiments and simulations are plotted in Fig. 9.
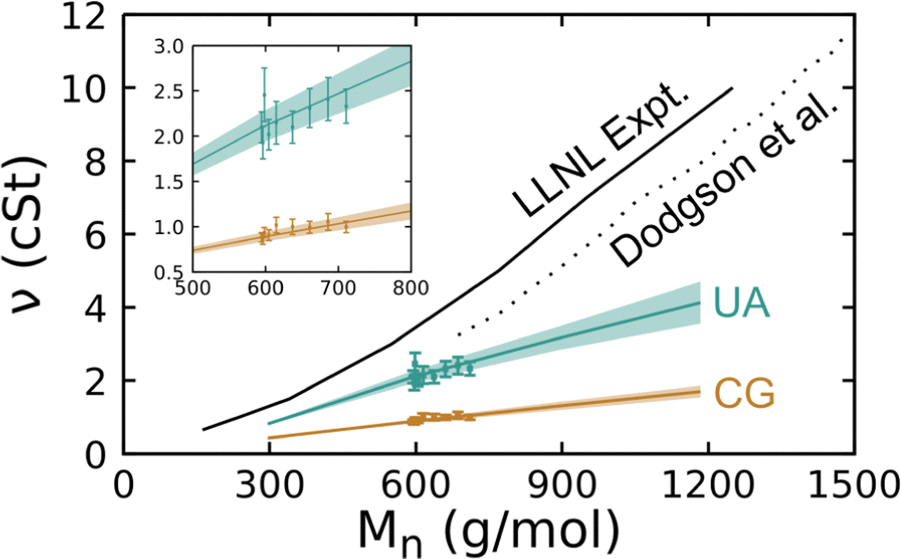 | ||
| Fig. 9 Room-temperature kinematic shear viscosity of PDMS fluids determined via experiments conducted by us (LLNL) and Dodgson et al.95 and via simulations using the UA and CG models plotted as a function of the number-average molar mass Mn. Curves correspond to linear chain systems and symbols to crosslinked systems. Shaded regions about each curve and error bars on data points correspond to a 95% CI. The inset shows a zoomed-in view of the interval with crosslinked system results. | ||
A number of trends are immediately apparent in the plot. We first note that the present experimental results are quite similar to those obtained in the 1980 experiments of Dodgson et al.,95 but are consistently higher by ≈1 cSt. Both simulation models and experiments show an approximately linear increase in viscosity with increasing molar mass over the studied interval. In the case of the 4-mer (Mn = 296 g mol−1), the UA model underpredicts experiment by approximately 50% and that difference grows with increasing chain length. Payal et al.96 found that for n-decane (Mn = 226 g mol−1), all-atom MD yielded a similar viscosity as experiment and that a UA model underpredicted the viscosity by 20%, which is a somewhat smaller difference than we obtain here for PDMS. Larger differences between experiment and UA viscosity predictions for PDMS compared to n-decane may be due to the loss of more degrees of freedom when the methyl groups are coarse-grained to a single particle, but this conjecture cannot be demonstrated with the data at hand. It is well known that the degree of coarse graining of a FF has a direct negative correlation with MD-predicted viscosity values. Thus, it is unsurprising that the UA results underpredict the experiments and that the CG viscosity values are lower still at a given molar mass. What is perhaps surprising is that the predicted viscosities of crosslinked liquids fall within the uncertainty bounds of the linear chains.
As discussed in the introduction, there is no comprehensive physical theory for the viscosity of liquids. This makes experimental and MD-based data sets a key route to determining practically useful correlative relationships. The present data suggest that a simple linear model
| ν(Mn) = A·Mn + B, | (16) |
We performed weighted least-squares fits of eqn (16) to the experimental and simulation data over the interval Mn ∈ [250 g mol−1, 1250 g mol−1] and report the best-fit parameters in Table 4. Note that simulation data uncertainties were taken to be the 95% CIs determined via bootstrapping and the experiments were assumed to have a 5% measurement error in these regressions. As was clear from Fig. 9, there is a notable and statistically significant difference in the slope of ν(Mn) obtained via experiments and the two FF models. However, the general characteristics of the experimental and predicted trends are largely consistent. As both FF models yield essentially the same result – crosslinked systems follow the same ν(Mn) trend as the linear chains – one could reasonably expect that that trend will transfer to physical low-molar-mass PDMS fluids. These simulation results have immediate implications for understanding the comparisons to experiment as the experimental samples exhibit PDI > 1 that is similar in magnitude to the simulated crosslinked systems. This implies that it would be difficult based on viscosity measurements alone to differentiate experimental samples with the same Mn that have PDI variations of a similar magnitude.
| Data set | A (cSt g−1 mol−1) | B (cSt) |
|---|---|---|
| Experiment | 0.0087 ± 0.0003 | −1.5 ± 0.2 |
| United atom | 0.0040 ± 0.0002 | −0.36 ± 0.08 |
| Coarse grain | 0.0014 ± 0.0001 | −0.02 ± 0.04 |
In the light of discussion at the beginning of this subsection, the differences between the UA and CG model predictions for the viscosity could be anticipated in advance. Such differences can be reconciled via a time-scale factor and the hope is that a single factor holds for all dynamical properties and chain lengths. Table 5 compares two such dynamical properties for the linear chain systems, namely the chain center of mass diffusion coefficient D and the kinematic shear viscosity ν. As expected, D is higher for the CG system than the UA one while ν is greater in the UA system than the CG one. Systematic trends with chain length also follow expectations for both the UA and CG systems in that D decreases with chain length while ν increases with chain length. The ratio of the UA- and CG-computed coefficients yields the scaling factor. Both the diffusion scaling factor DCG/DUA and the viscosity scale factor νUA/νCG rapidly converge with respect to chain length. (Note the inverse relationship between D and ν.) These factors converge to a value between 2.4 and 2.8 for chains with eight or more monomers and are statistically indistinguishable within the propagated 95% CIs.
| Length | D UA (Å2 ps−1) | D CG (Å2 ps−1) | D CG/DUA |
|---|---|---|---|
| 4 | 0.0955 ± 0.0020 | 0.2268 ± 0.0028 | 2.37 ± 0.06 |
| 8 | 0.0287 ± 0.0006 | 0.0756 ± 0.0018 | 2.64 ± 0.08 |
| 12 | 0.0143 ± 0.0004 | 0.0395 ± 0.0008 | 2.76 ± 0.10 |
| 16 | 0.0094 ± 0.0004 | 0.0259 ± 0.0008 | 2.76 ± 0.12 |
| Length | ν UA (cSt) | ν CG (cSt) | ν UA/νCG |
|---|---|---|---|
| 4 | 0.81 ± 0.04 | 0.43 ± 0.02 | 1.9 ± 0.1 |
| 8 | 2.09 ± 0.17 | 0.88 ± 0.05 | 2.4 ± 0.2 |
| 12 | 3.14 ± 0.32 | 1.30 ± 0.11 | 2.4 ± 0.3 |
| 16 | 4.13 ± 0.57 | 1.70 ± 0.16 | 2.4 ± 0.4 |
Similar time-scaling arguments can be applied to reconcile discrepancies between the experimentally measured shear viscosity and that predicted by the UA and CG-FFs seen in Fig. 9. The two model-prediction curves can be rendered in much better agreement with the experimental curve simply by rescaling time by a factor of ≈2 for UA-FF and by a factor of ≈6 for CG-FF. (These factors can be obtained from ratios of the slope parameters in Table 4.) A time re-scaling factor of ≈6 for our CG-FF is well within the re-scaling factors that have been found necessary during prior coarse graining studies of polymer liquid systems.22,90 The important result here is that such time re-calibration, done only once, can be applied with high accuracy over a wide range of oligomer sizes.
In all our simulations we assumed that the crosslink density was known. Ideally, one would estimate this density from macroscopic driving factors that create crosslinks. These estimates might derive from duration of exposure to controlled radiation dosages or elevated temperature conditions (as in accelerated aging) or exposure to controlled flows of oxygen for oxidative degradation. Additional material details such as the density of unreacted crosslinking (curing) agents should also be factored into these estimates. However, such “first-principles” estimates necessitate theory and computational machinery that can tie controlled exposure conditions to the rates for bond breaking and formation events involved in network rearrangements. One example of such machinery is our recently developed multiscale model of radiation-induced chemistry, which we applied to polyethylene.100 There is also the question of sensitivity of the property of interest (e.g., viscosity) to exposure conditions, which can be informed by studies such as the present one.
Our recent predictions for polyethylene radiation chemistry100 indicated that a typical γ-radiation aging experiment using a 60Co source at a dose rate of 0.1 Mrad hour−1 leads to 6 × 10⁻⁴ excitations nm−3 hour−1. Assuming PDMS behaves similarly to polyethylene under these conditions, one could expect ≈0.2 excitations hour−1 in a volume element the same size as our simulation cell. While not every radiation-induced excitation will lead to formation of a crosslink – our recent calculations indicate the crosslinking rates may be lower than the “base” excitation rate by an order of magnitude or more in polyethylene – this nonetheless places an upper bound on the number of chemical crosslinks one might reasonably expect to be formed. From these rates, we can expect as an upper bound that two crosslinks would form in our simulation cell per Mrad of γ radiation absorbed. Thus, our 50-crosslink case corresponds to a substantial radiation dose of 25 Mrad. Connecting this to the present density and viscosity predictions, an experiment on a PDMS 8-mer fluid would need to resolve density variations of O(10 kg m3) and viscosity variations of O(0.1 cSt) in order to detect radiation-induced changes for dosages of ≈25 Mrad.
6 Conclusions
Chemical crosslinking plays a key role in determining the rheological and mechanical properties of silicone materials comprised of polydimethylsiloxanes (PDMS). While general theories can qualitatively describe how these properties relate to the distribution of chain masses and network connectivity (e.g., crosslink density), they cannot make quantitative predictions from first principles. At the same time, modern quantum-chemical modeling is providing increasingly detailed information on the atomic nature of network alterations and can even supply fundamental reaction probabilities and rates. Classical molecular dynamics (MD) modeling performed at atomistic and coarse-grain levels holds promise as a means to upscale these chemical insights to make quantitative predictions for macroscale properties. Making quantitative connections between fundamental siloxane chemistry and macroscale mechanics requires investments in two modeling components including: (1) a means to obtain accurate particle-based force fields (FFs) at a sufficient degree of coarse graining that allows for accessing the time and length scales of mechanical/rheological processes in soft materials; and (2), statistically robust ways for measuring mechanical/rheological responses with quantified uncertainties. We address these challenges for silicone materials by developing here a hierarchical pair of FFs for crosslinked PDMS and apply these FFs to predict and understand how crosslinking alters the shear viscosity of low-molar-mass PDMS fluids far below the gel point.The two FFs for crosslinked PDMS developed here employ differing levels of coarse graining and include explicit interaction terms for ethyl crosslinkers that form during curing and when the material is subjected to aging drivers such as ionizing radiation. A foundational atomic-scale FF was based on a well-vetted united atom model for linear PDMS chains, which we extended here to include crosslinking terms. Iterative Boltzmann inversion was used to systematically train a coarse-grain bead-spring-type model for linear and crosslinked PDMS based on a combination of thermodynamic data and structural predictions obtained using the united atom FF. This coarse grain FF treats monomers as single particles and is, to our knowledge, the first coarse grain FF trained specifically for PDMS materials that includes crosslinking terms. Both FFs reproduce the experimental densities of low-molar-mass PDMS liquids at 300 K to within 3% and the experimental heats of vaporization to within 10–30%. Relative differences in these property predictions made at the united-atom and coarse-grain levels were no more than 4%.
We applied these two FFs to predict the shear viscosity of low-molar-mass silicone fluids. The shear viscosity was chosen as a representative macroscale rheological property for which the associated relaxation times were short enough to enable fully converged MD predictions at the united-atom level. This enabled validation of the accuracy of both FFs through direct comparison to experiment. A bootstrapping approach was developed to obtain 95% confidence intervals on shear viscosity predictions obtained using equilibrium MD simulations and the Green–Kubo formalism. The shear viscosity of liquids comprised of linear PDMS chains was found to increase linearly with increasing molar mass, which was in qualitative agreement with our experimental measurements. Specific differences in the magnitudes of the shear viscosity obtained via experiments and the two FF models could be anticipated from dynamical arguments and reconciled with a single time re-calibration factor.
We applied both of the above functionalities to predict how crosslinking influences the structural properties and the shear viscosity of low-molar-mass silicone fluids. The (mass) density of a fluid comprised of PDMS 8-mers was found to increase linearly with increasing crosslink density for both FFs at a similar rate that differed by approximately 30%. The maximum polydispersity index of our branched crosslinked fluids was 1.30, which was achieved when 50 crosslinks were introduced into a computational cell with a volume of ≈310 nm3. Crosslinking was found to induce a systematic, if subtle, increase in the shear viscosity with both FFs. A simple linear empirical relationship was identified between the number-average molar mass and kinematic shear viscosity that held for both linear and crosslinked fluids within propagated uncertainties. While Rouse theory predicts such a trend for liquids comprised of linear chains with uniform distribution, its consistency with our results for branched structures indicates that crosslinking leads to a comparatively modest perturbation in this regime. The predicted magnitude of change in viscosity induced by crosslinking indicates that these effects could plausibly be measured via rheology experiments.
Development of particle-based methods to predict the mechanical and rheological properties of polymer materials with specific chemical alterations holds promise as a means to directly connect quantum-chemical insights to macroscale responses. While the present work focused on rheology of crosslinked PDMS liquids below the gel point, the framework is general. In particular, the models developed here can be directly applied to study partially cured silicone materials or aging of silicone fluids. These FFs also provide a basis to build models for the sorts of MD simulations21 used to predict permanent set of elastomers. Coupling this methodology with our recently proposed multiscale framework100 to obtain rates of radiation-induced chemistry will allow for making quantitative bottom-up predictions for the radiation aging of silicones and other molecular and polymeric materials in the near future.
Conflicts of interest
There are no conflicts to declare.Acknowledgements
A. K. contributed to this work as part of the 2021 Computational Chemistry and Materials Science internship program at Lawrence Livermore National Laboratory, which is gratefully acknowledged. This work was performed under the auspices of the U.S. Department of Energy by Lawrence Livermore National Laboratory under Contract DE-AC52-07NA27344. It has been approved for unlimited release under document number LLNL-JRNL-840690.Notes and references
- B. Arkles, CHEMTECH, 1983, 13, 542–555 CAS.
- M. A. Brooke, Silicon in organic, organometallic, and polymer chemistry, Wiley, New York, USA, 1999 Search PubMed.
- C.-C. Sun and J. Mark, Polymer, 1989, 30, 104–106 CrossRef CAS.
- A. Tiwari, Adv. Chem. Eng. Sci., 2012, 2, 34–44 CrossRef CAS.
- J. P. Lewicki, S. J. Harley, J. A. Finnie, M. Ashmore, C. Bell and R. S. Maxwell, in NMR investigations of network formation and motional dynamics in well-defined model poly(dimethylsiloxane) elastomers, ed. S. J. Clarson, M. J. Owen, S. D. Smith, M. Van Dyke, M. Brook and J. Mabry, American Chemical Society, 2013, ch. 10, pp. 133–154 Search PubMed.
- A. S. Palsule, S. J. Clarson and C. W. Widenhouse, J. Inorg. Organomet. Polym., 2008, 18, 207–221 CrossRef CAS.
- P.-C. Wang, N. Yang, D. Liu, Z.-M. Qin, Y. An and H.-B. Chen, Mater. Des., 2020, 195, 108998 CrossRef CAS.
- A. Maiti, W. Small, M. P. Kroonblawd, J. P. Lewicki, N. Goldman, T. S. Wilson and A. P. Saab, J. Phys. Chem. B, 2021, 125, 10047–10057 CrossRef CAS PubMed.
- A. Charlesby and F. A. Freeth, Proc. R. Soc. London A, 1955, 230, 120–135 CAS.
- R. W. Kilb, J. Phys. Chem., 1959, 63, 1838–1843 CrossRef CAS.
- A. A. Miller, J. Am. Chem. Soc., 1960, 82, 3519–3523 CrossRef CAS.
- P. E. Rouse, J. Chem. Phys., 1953, 21, 1272–1280 CrossRef CAS.
- A. V. Tobolsky, Properties and structure of polymers, Wiley, New York, USA, 1960 Search PubMed.
- S. Bair, in Temperature and pressure dependence of viscosity, ed. Q. J. Wang and Y.-W. Chung, Springer US, Boston, MA, 2013, pp. 3533–3538 Search PubMed.
- N. T. Liesen, G. A. Palermo, I. Kusaka and S. Egusa, J. Chem. Phys., 2020, 153, 024502 CrossRef CAS PubMed.
- M. P. Kroonblawd and H. K. Springer, Propellants, Explos., Pyrotech., 2022, 47, e202100328 CrossRef CAS.
- J. M. Allan and A. S. Teja, Can. J. Chem. Eng., 1991, 69, 986–991 CrossRef CAS.
- J. H. Dymond and H. A. Øye, J. Phys. Chem. Ref. Data, 1994, 23, 41–53 CrossRef CAS.
- G. Centeno, G. Sánchez-Reyna, J. Ancheyta, J. A. Muñoz and N. Cardona, Fuel, 2011, 90, 3561–3570 CrossRef CAS.
- J. T. Padding and W. J. Briels, J. Chem. Phys., 2002, 117, 925–943 CrossRef CAS.
- D. R. Rottach, J. G. Curro, G. S. Grest and A. P. Thompson, Macromol., 2004, 37, 5468–5473 CrossRef CAS.
- J. T. Padding and W. J. Briels, J. Phys.: Condens. Matter, 2011, 23, 233101 CrossRef CAS PubMed.
- A. Maiti, W. Small, J. P. Lewicki, T. H. Weisgraber, E. B. Duoss, S. C. Chinn, M. A. Pearson, C. M. Spadaccini, R. S. Maxwell and T. S. Wilson, Sci. Rep., 2016, 6, 24871 CrossRef CAS PubMed.
- J. M. Knipe, J. Sirrine, A. M. Sawvel, H. E. Mason, J. P. Lewicki, Y. Sun, E. A. Glascoe and H. N. Sharma, Ind. Eng. Chem. Res., 2019, 58, 17266–17276 CrossRef CAS.
- H. N. Sharma, L. N. Dinh, J. H. Leckey, R. S. Maxwell and W. McLean, Ind. Eng. Chem. Res., 2020, 59, 19510–19521 CrossRef CAS.
- H. A. Dewhurst and L. E. S. Pierre, J. Phys. Chem., 1960, 64, 1063–1065 CrossRef CAS.
- D. J. Hill, C. M. Preston, D. J. Salisbury and A. K. Whittaker, Radiat. Phys. Chem., 2001, 62, 11–17 CrossRef CAS.
- D. J. Hill, C. M. Preston and A. K. Whittaker, Polymer, 2002, 43, 1051–1059 CrossRef CAS.
- M. P. Kroonblawd, N. Goldman and J. P. Lewicki, J. Phys. Chem. B, 2019, 123, 7926–7935 CrossRef CAS PubMed.
- Y. Ding, H. Lu, Q. Mou, D. Peng, M. Yu and Y. Wu, Poly. Degrad. Stab., 2022, 195, 109802 CrossRef CAS.
- E. A. Nikitina, V. D. Khavryutchenko, E. F. Sheka, H. Barthel and J. Weis, J. Phys. Chem. A, 1999, 103, 11355–11365 CrossRef CAS.
- E. M. Lupton, F. Achenbach, J. Weis, C. Bräuchle and I. Frank, J. Phys. Chem. B, 2006, 110, 14557–14563 CrossRef CAS PubMed.
- E. M. Lupton, F. Achenbach, J. Weis, C. Bräuchle and I. Frank, Phys. Rev. B: Condens. Matter Mater. Phys., 2007, 76, 125420 CrossRef.
- E. M. Lupton, F. Achenbach, J. Weis, C. Bräuchle and I. Frank, ChemPhysChem, 2009, 10, 119–123 CrossRef CAS PubMed.
- M. P. Kroonblawd, N. Goldman and J. P. Lewicki, J. Phys. Chem. B, 2018, 122, 12201–12210 CrossRef CAS PubMed.
- M. P. Kroonblawd, N. Goldman, A. Maiti and J. P. Lewicki, J. Chem. Theory Comput., 2021, 17, 463–473 CrossRef CAS PubMed.
- M. Kroonblawd, N. Goldman, A. Maiti and J. Lewicki, Phys. Chem. Chem. Phys., 2022, 24, 8142–8157 RSC.
- P. Carbone, H. A. K. Varzaneh, X. Chen and F. Müller-Plathe, J. Chem. Phys., 2008, 128, 064904 CrossRef PubMed.
- V. Agrawal, K. Holzworth, W. Nantasetphong, A. V. Amirkhizi, J. Oswald and S. Nemat-Nasser, J. Polym. Sci. B: Polym. Phys., 2016, 54, 797–810 CrossRef CAS.
- A. Aramoon, T. D. Breitzman, C. Woodward and J. A. El-Awady, J. Phys. Chem. B, 2016, 120, 9495–9505 CrossRef CAS PubMed.
- H. Huang, F. Cao, L. Wu and H. Sun, Mol. Sim., 2017, 43, 1513–1522 CrossRef CAS.
- K. Duan, Y. He, Y. Li, J. Liu, J. Zhang, Y. Hu, R. Lin, X. Wang, W. Deng and L. Li, Mater. Des., 2019, 183, 108130 CrossRef.
- A. Kubo, J.-M. Albina and Y. Umeno, Polymer, 2019, 177, 84–90 CrossRef CAS.
- J. C. Johnson, L. T. J. Korley and M. Tsige, J. Phys. Chem. B, 2014, 118, 13718–13728 CrossRef CAS PubMed.
- N. Grassie and I. Macfarlane, Eur. Polym. J., 1978, 14, 875–884 CrossRef CAS.
- E. F. Griessbach and R. Lehmann, Chemosphere, 1999, 38, 1461–1468 CrossRef CAS PubMed.
- G. Camino, S. Lomakin and M. Lageard, Polymer, 2002, 43, 2011–2015 CrossRef CAS.
- C. Rücker and K. Kümmerer, Chem. Rev., 2015, 115, 466–524 CrossRef PubMed.
- E. Saleh, P. Woolliams, B. Clarke, A. Gregory, S. Greedy, C. Smartt, R. Wildman, I. Ashcroft, R. Hague, P. Dickens and C. Tuck, Addit. Manuf., 2017, 13, 143–148 CAS.
- I. R. Williams, M. B. Mayor and J. P. Collier, Clin. Orthop. Relat. Res., 1998, 356, 170–180 CrossRef PubMed.
- C. V. More, Z. Alsayed, M. S. Badawi, A. A. Thabet and P. P. Pawar, Environ. Chem. Lett., 2021, 19, 2057–2090 CrossRef CAS PubMed.
- P. Mazurek, S. Vudayagiri and A. L. Skov, Chem. Soc. Rev., 2019, 48, 1448–1464 RSC.
- R. Zwanzig, Ann. Rev. Phys. Chem., 1965, 16, 67–102 CrossRef CAS.
- A. P. Thompson, H. M. Aktulga, R. Berger, D. S. Bolintineanu, W. M. Brown, P. S. Crozier, P. J. in 't Veld, A. Kohlmeyer, S. G. Moore, T. D. Nguyen, R. Shan, M. J. Stevens, J. Tranchida, C. Trott and S. J. Plimpton, Comput. Phys. Commun, 2022, 271, 108171 CrossRef CAS.
- S. Nosé, J. Chem. Phys., 1984, 81, 511 CrossRef.
- W. G. Hoover, Phys. Rev. A: At., Mol., Opt. Phys., 1985, 31, 1695 CrossRef PubMed.
- G. J. Martyna, D. J. Tobias and M. L. Klein, J. Chem. Phys., 1994, 101, 4177 CrossRef CAS.
- A. Stukowski, Modell. Simul. Mater. Sci. Eng., 2010, 18, 015012 CrossRef.
- B. L. Eggimann, Y. Sun, R. F. DeJaco, R. Singh, M. Ahsan, T. R. Josephson and J. I. Siepmann, J. Chem. Eng. Data, 2020, 65, 1330–1344 CrossRef CAS.
- M. Thol, F. Dubberke, G. Rutkai, T. Windmann, A. Köster, R. Span and J. Vrabec, Fluid Phase Equilib., 2016, 418, 133–151 CrossRef CAS.
- Z. Makrodimitri, R. Dohrn and I. G. Economou, Macromol., 2007, 40, 1720–1729 CrossRef.
- A. L. Frischknecht and J. G. Curro, Macromol., 2003, 36, 2122–2129 CrossRef CAS.
- R. M. Sok, H. J. C. Berendsen and W. F. van Gunsteren, J. Chem. Phys., 1992, 96, 4699–4704 CrossRef CAS.
- M. G. Martin and J. I. Siepmann, J. Am. Chem. Soc., 1997, 119, 8921–8924 CrossRef CAS.
- L. Zhang and J. I. Siepmann, Theor. Chem. Acc., 2006, 115, 391–397 Search PubMed.
- J. I. Siepmann, M. G. Martin, B. Chen, C. D. Wick, J. M. Stubbs, J. J. Potoff, B. L. Eggimann, M. J. McGrath, X. S. Zhao, K. E. Anderson, J. L. Rafferty, N. Rai, K. A. Maerzke, S. J. Keasler, P. Bai, E. O. Fetisov, M. S. Shah, Q. P. Chen, R. F. DeJaco, J. L. Chen and X. Bai, Monte Carlo for Complex Chemical Systems-Minnesota, https://siepmann.chem.umn.edu/software Search PubMed.
- J. I. Siepmann and D. Frenkel, Mol. Phys., 1992, 75, 59–70 CrossRef CAS.
- J. J. de Pablo, M. Laso, J. I. Siepmann and U. W. Suter, Mol. Phys., 1993, 80, 55–63 CrossRef CAS.
- T. J. H. Vlugt, M. G. Martin, B. Smit, J. I. Siepmann and R. Krishna, Mol. Phys., 1998, 94, 727–733 CrossRef CAS.
- M. G. Martin and J. I. Siepmann, J. Phys. Chem. B, 1999, 103, 4508–4517 CrossRef CAS.
- A. D. C. Morales, I. G. Economou, C. J. Peters and J. I. Siepmann, Mol. Sim., 2013, 39, 1135–1142 CrossRef.
- M. Dinpajooh, P. Bai, D. A. Allan and J. I. Siepmann, J. Chem. Phys., 2015, 143, 114113 CrossRef PubMed.
- I. A. McLure and E. Dickinson, J. Chem. Thermodyn., 1976, 8, 93–95 CrossRef CAS.
- C. D. Lorenz, E. B. Webb, M. J. Stevens, M. Chandross and G. Grest, Tribol. Lett., 2005, 19, 93–98 CrossRef CAS.
- A. C. Raymunt and P. Clancy, Thin Solid Films, 2014, 562, 411–422 CrossRef CAS.
- D. Wolf, P. Keblinski, S. R. Phillpot and J. Eggebrecht, J. Chem. Phys., 1999, 110, 8254 CrossRef CAS.
- N. M. Lacevic, R. S. Maxwell, A. Saab and R. H. Gee, J. Phys. Chem. B, 2006, 110, 3588–3594 CrossRef CAS PubMed.
- M. Elstner, D. Porezag, G. Jungnickel, J. Elsner, M. Haugk, T. Frauenheim, S. Suhai and G. Seifert, Phys. Rev. B: Condens. Matter Mater. Phys., 1998, 58, 7260–7268 CrossRef CAS.
- B. Hourahine, B. Aradi, V. Blum, F. Bonafé, A. Buccheri, C. Camacho, C. Cevallos, M. Y. Deshaye, T. Dumitrica, A. Dominguez, S. Ehlert, M. Elstner, T. van der Heide, J. Hermann, S. Irle, J. J. Kranz, C. Köhler, T. Kowalczyk, T. Kubař, I. S. Lee, V. Lutsker, R. J. Maurer, S. K. Min, I. Mitchell, C. Negre, T. A. Niehaus, A. M. N. Niklasson, A. J. Page, A. Pecchia, G. Penazzi, M. P. Persson, J. Řezáč, C. G. Sánchez, M. Sternberg, M. Stöhr, F. Stuckenberg, A. Tkatchenko, V. W.-Z. Yu and T. Frauenheim, J. Chem. Phys., 2020, 152, 124101 Search PubMed.
- M. Brehm and B. Kirchner, J. Chem. Inf. Model., 2011, 51, 2007–2023 CrossRef CAS PubMed.
- M. Beevers, S. Mumby, S. Clarson and J. Semlyen, Polymer, 1983, 24, 1565–1570 CrossRef CAS.
- O. L. Flaningam, J. Chem. Eng. Data, 1986, 31, 266–272 CrossRef CAS.
- D. F. Wilcock, J. Am. Chem. Soc., 1946, 68, 691–696 CrossRef CAS.
- R. D. Groot and P. B. Warren, J. Chem. Phys., 1997, 107, 4423–4435 CrossRef CAS.
- G. Milano and F. Müller-Plathe, J. Phys. Chem. B, 2005, 109, 18609–18619 CrossRef CAS PubMed.
- T. C. Moore, C. R. Iacovella and C. McCabe, J. Chem. Phys., 2014, 140, 224104 CrossRef PubMed.
- L. N. Dinh, B. P. Mayer, A. Maiti, S. C. Chinn and R. S. Maxwell, J. Appl. Phys., 2011, 109, 094905 CrossRef.
- J. E. Basconi and M. R. Shirts, J. Chem. Theory Comput., 2013, 9, 2887–2899 CrossRef CAS PubMed.
- Y. Zhang, A. Otani and E. J. Maginn, J. Chem. Theory Comput., 2015, 11, 3537–3546 CrossRef CAS PubMed.
- Y. Li, S. Tang, B. C. Abberton, M. Kröger, C. Burkhart, B. Jiang, G. J. Papakonstantopoulos, M. Poldneff and W. K. Liu, Polymer, 2012, 53, 5935–5952 CrossRef CAS.
- V. A. Harmandaris and K. Kremer, Macromol., 2009, 42, 791–802 CrossRef CAS.
- C. Hijón, P. Español, E. Vanden-Eijnden and R. Delgado-Buscalioni, Faraday Discuss., 2010, 144, 301–322 RSC.
- C. A. Lemarchand, M. Couty and B. Rousseau, J. Chem. Phys., 2017, 146, 074904 CrossRef PubMed.
- G. Clavier, R. Blaak, A. Dequidt, F. Goujon, J. Devémy, B. Latour, S. Garruchet, N. Martzel, T. Munch and P. Malfreyt, J. Chem. Phys., 2021, 154, 124901 CrossRef CAS PubMed.
- K. Dodgson, D. Bannister and J. Semlyen, Polymer, 1980, 21, 663–667 CrossRef CAS.
- R. S. Payal, S. Balasubramanian, I. Rudra, K. Tandon, I. Mahlke, D. Doyle and R. Cracknell, Mol. Sim., 2012, 38, 1234–1241 CrossRef CAS.
- M. Doi and S. F. Edwards, The Theory of Polymer Dynamics, Clarendon Press, Oxford, UK, 1986 Search PubMed.
- L. J. Fetters, D. J. Lohse, S. T. Milner and W. W. Graessley, Macromol., 1999, 32, 6847–6851 CrossRef CAS.
- P. Gestoso, E. Nicol, M. Doxastakis and D. N. Theodorou, Macromol., 2003, 36, 6925–6938 CrossRef CAS.
- M. P. Kroonblawd, A. Yoshimura, N. Goldman, A. Maiti, J. P. Lewicki and A. P. Saab, J. Chem. Theory Comput., 2022, 18, 5117–5124 CrossRef CAS PubMed.
Footnote |
| † Electronic supplementary information (ESI) available. See DOI: https://doi.org/10.1039/d2cp04920a |
| This journal is © the Owner Societies 2023 |