
Excited state proton transfer in the triplet state of 8-hydroxy-5-nitroquinoline: a transient absorption and time-resolved resonance Raman spectroscopic study†
Ran
Wang
a,
Fengjin
Zhang
a,
Xinghang
Pan
a,
Xuming
Zheng
a,
Jiadan
Xue
 *ad,
Yong
Du
*b and
Binbin
Xie
*c
*ad,
Yong
Du
*b and
Binbin
Xie
*c
aDepartment of Chemistry, Zhejiang Sci-Tech University, Hangzhou, 310018, China. E-mail: jenniexue@zstu.edu.cn
bCenter for THz Research, China Jiliang University, Hangzhou, 310018, China
cZhejiang Normal University, Hangzhou Institute of Advanced Studies, Hangzhou 310018, China
dKey Laboratory of Surface & Interface Science of Polymer Materials of Zhejiang Province, Zhejiang Sci-Tech University, Hangzhou, 310018, China
First published on 24th November 2022
Abstract
8-Hydroxy-5-nitroquinoline (NO2-QN-OH) is an antimicrobial, anti-inflammatory and anticancer agent, and has been approved for use in the treatment of diseases. Its photosensitivity, however, cannot be overlooked. The photochemistry of 8-hydroxy-5-nitroquinoline in acetonitrile is investigated using transient absorption and time-resolved resonance Raman spectroscopies. By identifying the short-lived intermediates during the photoreaction, it is clear that the Tn state NO2-QN-OH is generated in 0.8 ps via an ultrafast ISC, followed by the IC in 8.5 ps to produce the T1 state. In neat acetonitrile, the T1 state NO2-QN-OH undergoes intramolecular proton transfer and tautomerizes to form T1 state NO2-QNH-O. To our knowledge, this is the first time that the intramolecular excited state proton transfer of hydroxyl-quinolines in an aprotic polar solvent is observed.
1. Introduction
8-Hydroxy-5-nitroquinoline is an antimicrobial1 and anti-inflammatory2 agent approved by the United States Food and Drug Administration (FDA) to treat urinary tract infections.3 It may be useful in the treatment of neurodegenerative diseases4 and also has anticancer properties5 because the nitro group causes redox reactions that alter intracellular signaling, inhibiting tumor cell growth.6 However, 8-hydroxy-5-nitroquinoline, like other NO2 substituted hydroxyaromatic compounds,7–9 tends to undergo photosensitization reactions, such as dissociation, reduction and hydrogen abstraction. Understanding its photochemistry is therefore critical in order to improve the design of new related drugs and help minimize the photo side-effects within such a class of drugs.Hydroxy-quinolines have been extensively studied as good bifunctional prototypes using experimental10–17 and theoretical18–24 methods to reveal photo-induced excited state proton transfer (ESPT) mechanisms. The precise ESPT mechanism of each hydroxy-quinoline varies depending on the distance between –OH and ≥N as well as the surrounding environment.13,16,18,25–30 In these studies, the protic solvent hydrogen-bonded complex11,12,20 and self-association homo-dimer13,16,18,31 models (Scheme 1) have received a lot of attention. 8-Hydroxyquinoline has a short-lived excited singlet state (S1) in both nonpolar and aqueous solvents due to the ultrafast ESPT between neighboring –OH and ≥N groups. The fluorescence up-conversion technique,32 vapor pressure osmometry measurements in conjunction with infrared spectroscopy,16 and time-resolved absorption31 have all been used to study its ESPT mechanism. The experimental results show that in nonpolar solvents such as alkane and cyclohexane, double ESPT occurs simultaneously in 1.7 ± 0.2 ps31via a dimer formed in the ground state.16 In aqueous solutions, the ESPT takes place via hydrated complexes,16,23,32 and protonation and deprotonation processes proceed stepwise, with solvent acidity determining their priority and rate constants.32 However, the experimental results do not rule out the possibility of direct intramolecular proton transfer,16 as shown in Scheme 1. According to theoretical studies, the activation barrier of concerted double ESPT with H2O assistance in the S1 state was 1.2 kcal mol−1,33 while the activation barrier of the direct intramolecular ESPT was 2.222 or 5.433 kcal mol−1.
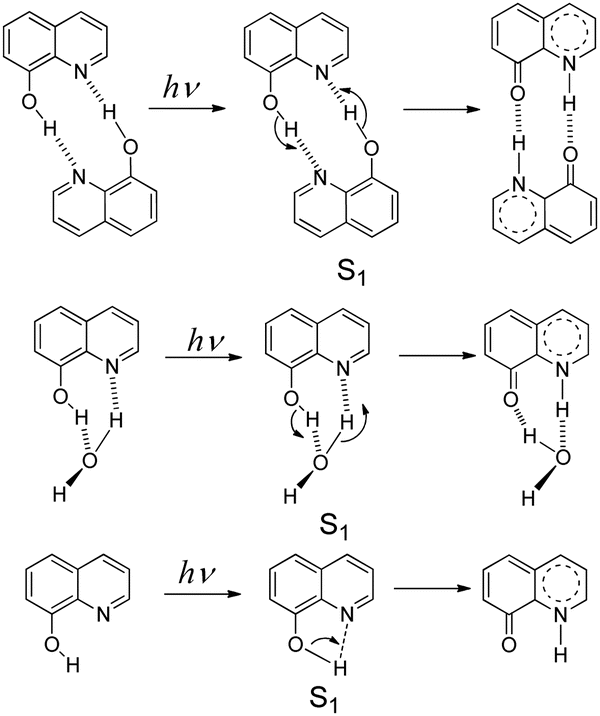 | ||
| Scheme 1 ESPT mechanisms of 8-hydroxyquinoline in the S1 state via the homo-dimer and hydrated complex, as well as the direct intramolecular proton transfer. | ||
8-Hydroxy-5-nitroquinoline, like 8-hydroxyquinoline, is non-fluorescent, but it is unclear whether this is due to the intersystem crossing (ISC) or the ESPT. The ISC of nitro-polycyclic aromatic hydrocarbons (NPAHs) is extremely fast, ranging from 100 fs to a few picoseconds.34–36 The presence of a higher excited triplet state (Tn, n ≥ 2) with a slightly lower energy than the lowest excited singlet state (S1) and a different electron configuration from S1 results in an effective spin–orbit coupling according to the EI-sayed rule.37 The subsequent internal conversion from Tn to T1 can occur in a few to tens of picoseconds,38 resulting in the high-yielding T1 state NPAHs.39,40
Because of the intramolecular charge transfer, the NO2 group substitution in hydroxyaromatic compounds can increase the acidity of the OH group, particularly in the excited state after photo-excitation. According to reports for p-nitrophenylphenol9,41,42 and 4-nitro-1-naphthol,8 the enhanced acidity allows hydroxyaromatic compounds43–45 to ESPT to some organic weak bases, such as t-butylamine (TBA) and alcohols. As a result, 8-hydroxy-5-nitroquinoline may favor an ESPT over 8-hydroxyquinoline. In this work, we use transient absorption and time-resolved resonance Raman spectroscopies to investigate the photochemistry of 8-hydroxy-5-nitroquinoline in acetonitrile, an aprotic polar solvent that differs from the previous experimental environment of 8-hydroxyquinone. The study results indicate that like most NPAHs, ISC is still the major deactivation pathway of 8-hydroxy-5-nitroquinoline. In acetonitrile, the intramolecular ESPT to form a tautomer is dominant, whereas deprotonation is favored even in the presence of a trace amount of water. These findings may help us better understand the photochemistry and the ESPT mechanism of 8-hydroxy-5-nitroquinoline, as well as reduce the photo-induced side effects in drugs containing the 8-hydroxy-5-nitroquinoline unit.
2. Experimental and calculation methods
8-Hydroxy-5-nitroquinoline (97%, Macklin), 5-nitroquinoline (98%, Aladdin), 4-nitro-1-naphthol (>98%, TCI), t-butylamine (TBA, 99.5%, J&K), tetra-butylammonium hydroxide (40 wt% solutions in H2O), perchloric acid (72%) and ferrocene (99%, J&K) were used without further purification. Spectroscopic grade of acetonitrile (MeCN, >99.9%, Spectrum) and distilled water were used to prepare sample solutions.The picosecond transient absorption (TA) spectra were recorded using a commercial transient absorption setup (Harpia, Light Conversion) with a temporal resolution of about 100 fs. The experimental apparatus has previously been described in detail.46–48 In brief, a regenerative Ti/sapphire amplifier (Astrella, Coherent) generates an 800 nm laser pulse (1 kHz, 7 mJ, 40 fs) that was split into two beams. One beam was converted into the pump pulses (320 nm) through an optical parametric amplifier (TOPAS-C, Light Conversion), while the other was used by a CaF2 plate to produce the probe white light (370–760 nm). To eliminate the interference of molecular anisotropy, the polarization angle between the pump and probe pulses was set to 54.7° (magic angle). The pump pulse had an energy of 80 nJ, and the spot size at the sample was about 120 μm in diameter. The optical path is 1 mm long.
The nanosecond TA measurements were performed using a laser flash photolysis system (LP-920, Edinburgh Instruments) as previously described.49–51 The excitation laser pulse was generated using the third harmonic output of an Nd:YAG Q-switched laser. The laser pulse has a 355 nm wavelength, a 10 ns pulse width, and an 80 mJ pulse energy. The probe white light was provided using a 450 W Xe lamp. These two light beams were intersected vertically on a 1 × 1 × 4 (cm) quartz cell. A symmetrical Czerny–Turner monochromator was used to examine the modulated white light. An oscilloscope and a photomultiplier (Hamamatsu R928) were used to detect kinetic signals, and an ICCD (Andor, Oxford Instruments) was used to detect spectral signals. The time resolution of the spectral signal is 100 ns if not mentioned specially.
The nanosecond time-resolved resonance Raman experiment used the same pump laser pulse as the nanosecond TA experiment. The 435 nm Raman probe laser pulse was generated by the first anti-Stokes scattering of hydrogen gas, which was induced by the second harmonic output of the other Nd:YAG Q-switched laser. A pulse delay generator electronically synchronized the two Nd:YAG lasers to control the time delay of the pump and probe lasers, which was monitored with a fast photodiode and a 500 MHz oscilloscope. The pump and probe laser beams were lightly focused onto the flowing liquid sample, and the Raman scattering was collected using an ellipsoidal mirror and detected using a liquid nitrogen-cooled CCD detector. The transient Raman spectra were obtained by subtracting a resonance Raman spectrum with a negative time delay from the one with a positive time delay. The Raman bands of the acetonitrile solvent were used to calibrate the spectra. The experiments have a temporal resolution of about 10 ns and a spectral resolution of about 5 cm−1. A single beam transient Raman spectrum was obtained using 266 nm laser pulses produced by the fourth harmonics of an Nd:YAG Q-switched laser. The Raman spectrum of a high power laser pulse contains more information about the excited state than that of a low power laser pulse. Thus, the difference between the high and low power spectra can be used to characterize the excited state.
Density functional theory (DFT) calculations at the level of (U)B3LYP52,53/6-311++G(d,p) with Gaussian 09W54 were used to obtain information on optimized structures on the ground and T1 states, as well as their energies. The Raman spectra were recorded at the level of B3YLP/6-311+G(d,p). The TS method was used to determine transition states, which were then confirmed using intrinsic reaction coordinate (IRC) scans. The polarizable continuum model (PCM) was used to simulate the polarity effects of acetonitrile as a solvent.
3. Results and discussion
3.1. Ground state geometry in acetonitrile
As shown in Scheme 2, 8-hydroxy-5-nitroquinoline has two isomers, NO2-QN-OH and NO2-QNH-O. The cis form of NO2-QN-OH is more stable than the trans form due to the intramolecular hydrogen-bonding effect. Thus, in the following, NO2-QN-OH will always refer to the cis form. NO2-QN-OH is predicted to have a lower ground state energy than NO2-QNH-O in the gas phase and acetonitrile, with values of 9.3 and 1.2 kcal mol−1, respectively. According to theoretical calculations, the activation barrier for the transformation of NO2-QN-OH to NO2-QNH-O in acetonitrile is 12.8 kcal mol−1. Even with the help of water, which is a good hydrogen bond donor and acceptor as well as a proton mediator during the transformation, the barrier remains 8.6 kcal mol−1. As a result, the dominant species in acetonitrile is NO2-QN-OH (the estimated population is 88% based on Boltzmann distribution). This assertion is supported by the Raman spectral results. Fig. 1 depicts a comparison of experimental Raman spectra of 8-hydroxy-5-nitroquinoline to calculated ones for NO2-QN-OH and NO2-QNH-O. The FT-Raman spectrum of solid state agrees with the calculated spectrum for NO2-QN-OH better than that for NO2-QNH-O because the experimental spectrum lacks a vibrational band near the frequency of 1662 cm−1, which is the characteristic vibrational mode predicted for the carbonyl stretching in NO2-QNH-O and used to distinguish NO2-QNH-O from NO2-QN-OH. The resonance Raman spectrum in acetonitrile solution matches the solid state FT-Raman spectrum. The slight difference in bandwidth and intensity is due to the solvation effect and the fact that the resonance Raman only enhances vibrations that are coupled with electronic transitions.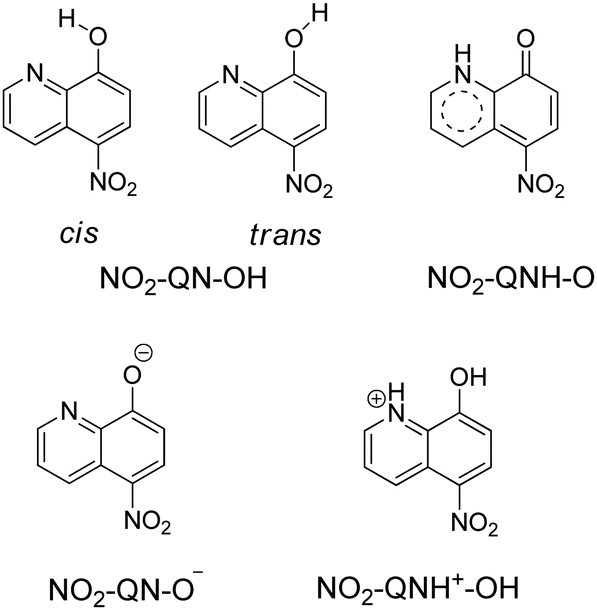 | ||
| Scheme 2 Structures of two 8-hydroxy-5-nitroquinoline isomers, as well as anionic and cationic forms. | ||
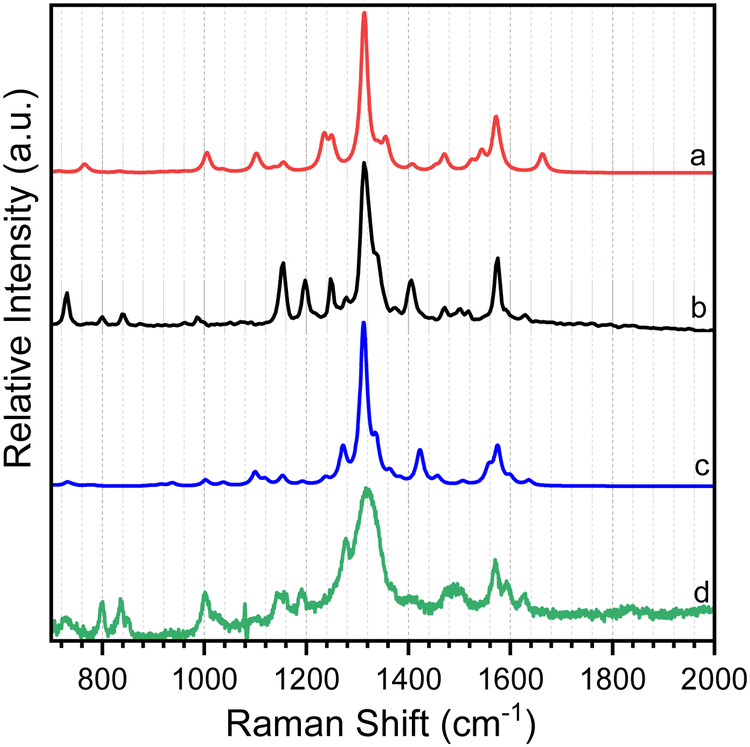 | ||
| Fig. 1 Comparison of calculation predicted Raman spectra for the ground state of (a) NO2-QNH-O and (c) NO2-QN-OH to the experimental (b) FT-Raman spectrum of solid state 8-hydroxy-5-nitroquinoline and (d) 435 nm resonance Raman spectrum of 8-hydroxy-5-nitroquinoline in acetonitrile solution. | ||
3.2. Transient absorption spectral results
Fig. 2 shows picosecond TA spectra recorded after the excitation of 8-hydroxy-5-nitroquinoline in acetonitrile. An absorption band with the maximum at 408 nm was observed at the early delay time (0.8 ps). The intensity of this band decreases over time, and the maximum blue shifts slightly, accompanied by an absorption increase centered at 575 nm. This spectral development has a time constant of 8.5 ps, which was obtained by fitting the kinetic data at 400 nm with an exponential function (Fig. 2C). According to the ultrafast spectroscopic results for 1-nitronaphthanlene, 1-nitropyrene, and their derivatives,55–57 the 0.8 ps spectrum shown in Fig. 2A was assigned the Tn (n ≥ 2) state of NO2-QN-OH, and the spectral evolution in Fig. 2A was identified as the internal conversion from Tn to T1 of NO2-QN-OH. Because the transient absorption lifetimes differ so greatly, we simply use the spectrum at the specific delay times to represent each species rather than the global analysis. The absorption of the T1 state NO2-QN-OH is represented by the 30 ps spectrum in Fig. 2B. Unlike most NPAHs, which have a microsecond lifetime in their T1 states in solution,8,49–51 the T1 state NO2-QN-OH decays within ∼10 ns (Fig. 2B), resulting in transient absorption with an additional band in the 450 to 500 nm range compared to the T1 state NO2-QN-OH. The decay kinetics of the T1 state NO2-QN-OH shows no concentration dependence on the ground state 8-hydroxy-5-nitroquinoline (Fig. 2D).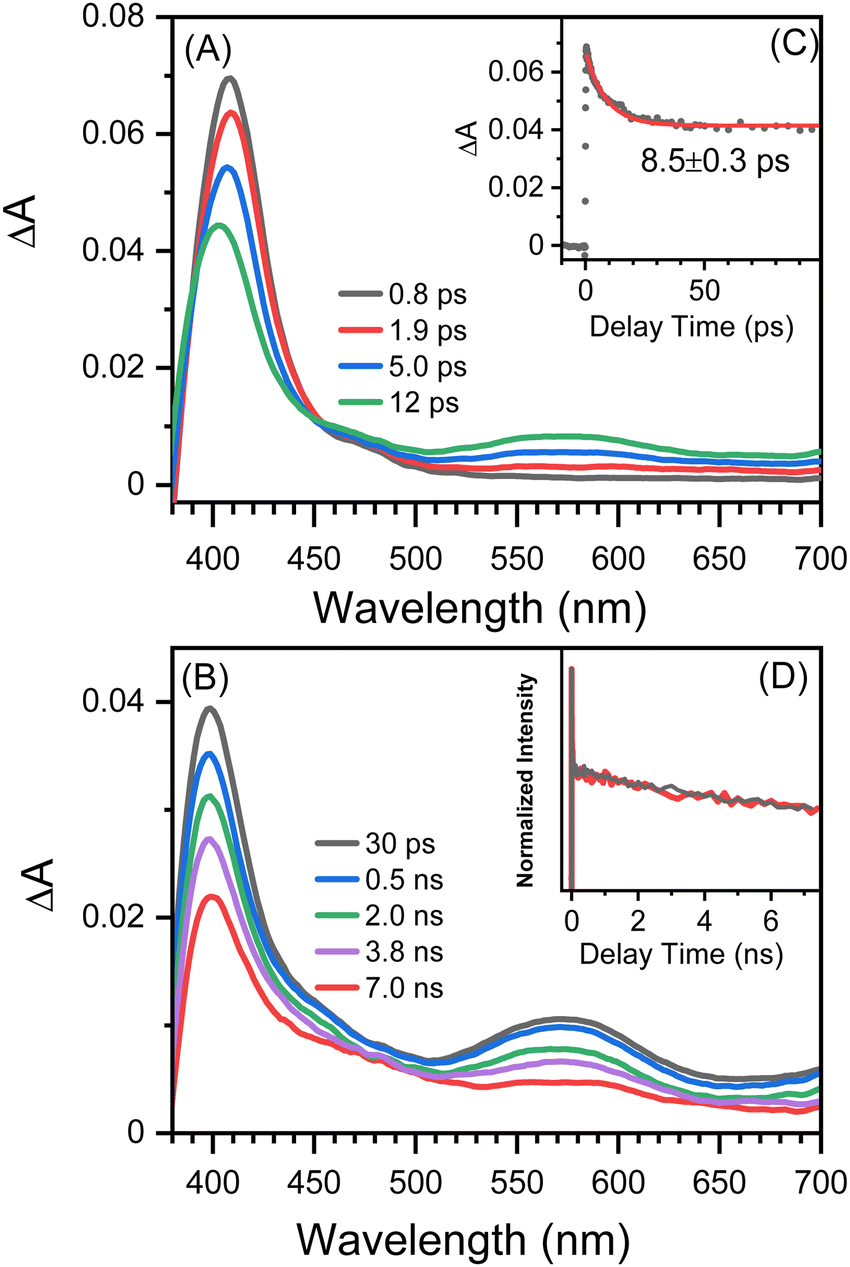 | ||
| Fig. 2 Picosecond TA spectra recorded after excitation of 1.0 mM 8-hydroxy-5-nitroquinoline in acetonitrile solution at (A) early and (B) late observation time windows. (C) The 400 nm kinetics (black dots) fitted with a mono-exponential function (red). (D) Kinetic data monitored at 400 nm in acetonitrile solution with 1.0 mM (black) and 0.5 mM (red) 8-hydroxy-5-nitroquinoline. | ||
Fig. 3 shows the nanosecond TA spectra recorded after excitation of 8-hydroxy-5-nitroquinoline in acetonitrile under argon saturated/air conditions without and with HClO4. Fig. 3A (with 0.1 M HClO4) shows a similar absorption wavelength and shape to that observed at 30 ps in the picosecond TA experiment, with the exception that the longer wavelength absorption band shifts slightly. Because the conjugate acid of the ground state NO2-QN-OH has a dissociation constant of pKa(NH+/N) = 2.0 (Fig. S1, ESI†), the 90% NO2-QN-OH can be protonated to the cationic form NO2-QNH+-OH in presence of 0.1 M acid. As a result, the transient absorption spectra in Fig. 3A are primarily caused by the excitation of NO2-QNH+-OH and are assigned to its T1 state. This assignment is consistent with the absorption spectra of the T1 state 4-nitro-1-naphthol8 and other 1-nitronaphthalene derivatives,50,55,57 which have a strong absorption around 400 nm and a broad band centered at 550 nm. It is not surprising that the quinoline protonation has little effect on the T1 state absorption spectrum, as does 5-nitroquinoline (Fig. S2, ESI†), which has a similar structure to 8-hydroxy-5-nitroquinoline but lacks the hydroxyl group. The combination of picosecond and nanosecond TA spectroscopic data demonstrates that blocking the quinoline N with a proton prevents the T1 state NO2-QN-OH transformation.
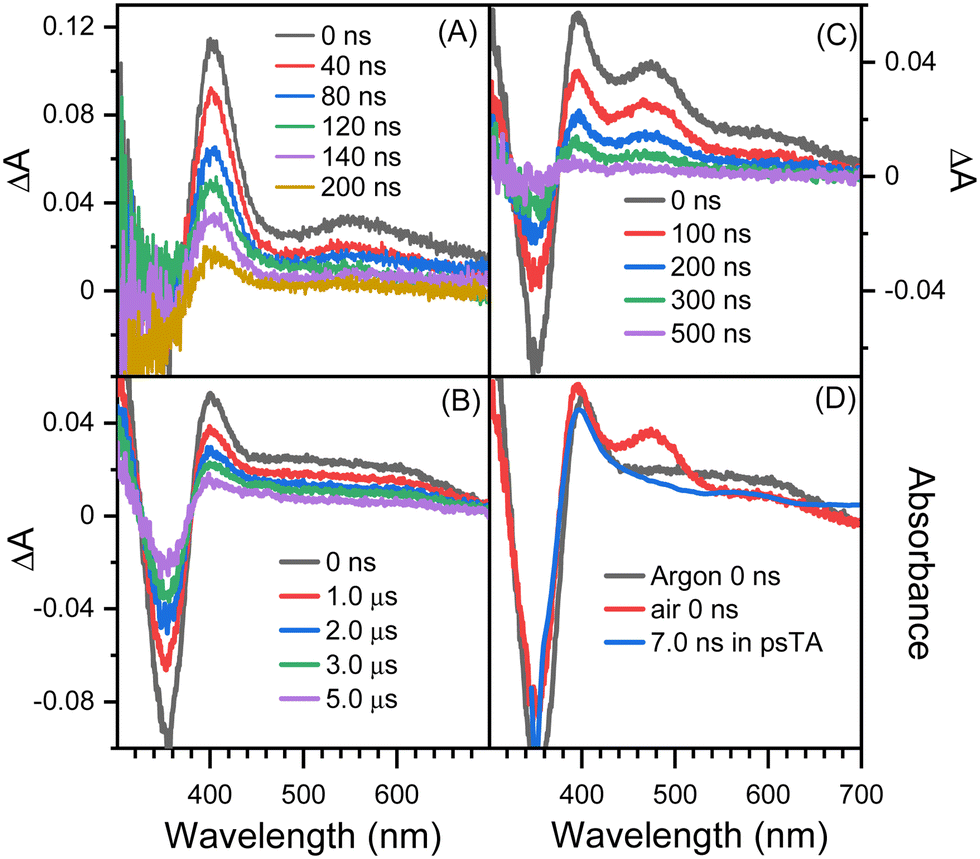 | ||
| Fig. 3 Nanosecond TA spectra recorded after excitation of 8-hydroxy-5-nitroquinoline in (A) argon saturated acetonitrile containing 0.1 M HClO4, (B) argon saturated acetonitrile, (C) acetonitrile under air condition and (D) the comparison of spectra recorded in the nanosecond and picosecond TA experiments. | ||
The spectra in Fig. 3B recorded under argon conditions have an absorption maximum at 400 nm as well as a very broad absorption band with a tail extending to 700 nm. The lifetime of fitting the kinetics at 400 nm is 5.2 μs. Furthermore, the kinetic data (Fig. S3, ESI†) obtained immediately after the excitation laser pulse show that the transient forms within the laser pulse duration and the wavelength dependence match the evolution of picosecond TA spectra shown in Fig. 2B. The transient absorption spectrum shown in Fig. 3B is triplet in nature because it exhibits a second order reaction dependence on ferrocene. Ferrocene has a triplet energy of 40 kcal mol−1,58 which is low enough for most triplets to undergo the triplet–triplet energy transfer and is thus frequently used as a triplet quencher. The reaction rate of the transient towards ferrocene is k = (6.2 ± 0.05) × 109 M−1s−1, which is close to the diffusion rate in acetonitrile and comparable to those for 1-nitronaphthalene derivatives.8,42
The spectra in Fig. 3B are similar to the 7.0 ns spectrum recorded in the picosecond TA experiment, with the main difference being that, unlike the 7.0 ns spectrum, the absorption intensity in the 450–500 nm region is comparable to that at around 600 nm (Fig. 3D). Given that the picosecond TA experiment was performed in air while the spectra shown in Fig. 3B were recorded under argon saturated conditions, the nanosecond TA experiment was also performed in air, and the spectra are shown in Fig. 3C, in which an obvious absorption band in the 430–540 nm range appears. The intensity difference between picosecond and nanosecond TA spectra obtained under identical air conditions in the 430–540 nm region is primarily due to the time resolution difference of the picosecond and nanosecond TA apparatus, as illustrated in the “Experimental Methods” section. By varying the gate width, the 0 ns nanosecond TA spectra with 50, 30 and 15 ns time resolution are shown in Fig. S4 (ESI†). The intensity at 430–540 nm decreases as the width of the gate decreases. This tendency implies that if the instrument's time resolution is narrow enough, the intensity in the 430–540 nm region will be comparable to the 7.0 ns spectrum recorded in the picosecond TA experiment.
The TA results with t-butylamine (TBA) in solutions provide further evidence that the transient species depicted in Fig. 3B (under argon conditions) is a proton donor. TBA, a weak base with a pKa of 10.7, has been used as an efficient proton acceptor in studies of the ESPT of hydroxyaromatic compounds.7,9 As shown in Fig. 4A and B, the transient species produced in the presence of TBA were comparable to those produced in the absence of TBA with the exception of the lower absorption intensity around 450 nm, which was caused by the bleaching of the anionic form NO2-QN-O−. On the basis of the UV-Vis spectra of NO2-QN-O− (Fig. S5, ESI†), it is estimated that 37% of NO2-QN-OH dissociates into NO2-QN-O− in the presence of 1.13 mM TBA in the solution. NO2-QN-O− possesses the strongest absorption band at around 450 nm and a weak absorption at the excitation wavelength (355 nm). The excitation of NO2-QN-O− does not result in the formation of a new absorption band, as observed with TBA in solution at high concentrations (Fig. S6, ESI†). Therefore, the partial dissociation of NO2-QN-OH has no impact on decay kinetics monitoring. The decay kinetics at 400 nm are well described by a single exponential function (Fig. S7, ESI†) and vary with TBA concentrations (Fig. 4C). As indicated by the plot of decay rate constants versus TBA concentrations, the decay rate constants have a linear relationship with TBA concentration. The slope of the line k = (8.2 ± 0.13) × 108 M−1s−1 is the second order rate constant of the transient species towards TBA. This value is comparable to that of 4-nitro-1-naphthol, k = (1.2 ± 0.05) × 109 M−1s−1 (Fig. S8, ESI†), whose structure is similar to NO2-QN-OH. Therefore, the transient species detected in the nanosecond observation window is most likely the T1 state NO2-QNH-O, which decays with the time constant of 5.2 μs. To precisely determine the structure of the transient species, a time-resolved resonance Raman experiment was conducted, which can provide information on the vibrational properties of the short-lived intermediate (see the 3.3 section for details).
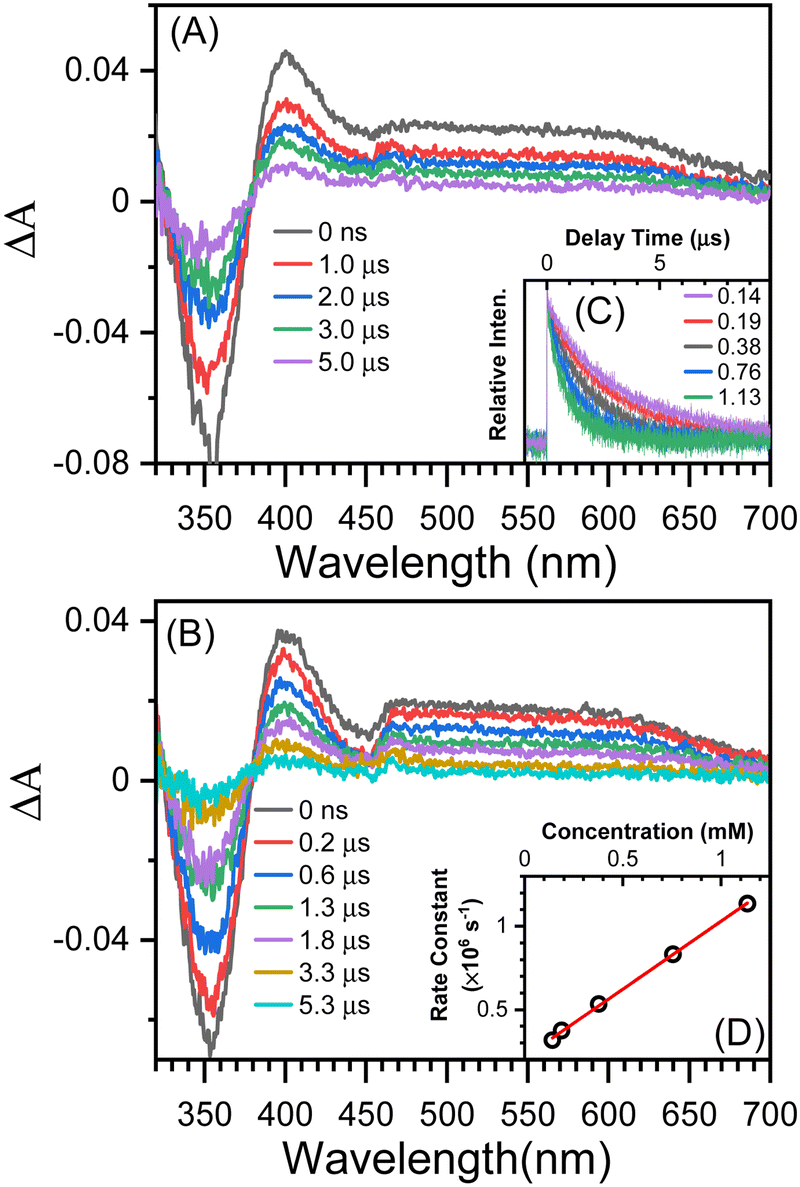 | ||
| Fig. 4 Nanosecond TA spectra recorded after excitation of 8-hydroxy-5-nitroquinoline under argon conditions in acetonitrile solution containing (A) 0.14 mM TBA and (B) 1.13 mM TBA. (C) Kinetic data at 400 nm measured in an acetonitrile solution containing various concentrations (in mM) of TBA. (D) Fit the plot of the pseudo-first order rate constants obtained with data in graph C versus the TBA concentration with a linear function. | ||
3.3. Time-resolved resonance Raman spectra
Time-resolved resonance Raman spectra recorded after excitation of 8-hydroxy-5-nitroquinoline in acetonitrile are displayed in Fig. 5. The intensities of the vibrational bands vary with time in the opposite direction, with some decreasing and others increasing, indicating that these spectra represent two species. One of the species decays over time and has vibrations at 980, 1153, 1290, 1386, 1477, 1505, 1555, 1592 and 1627 cm−1. The other species exhibit continuous increases after excitation in vibrations at 997, 1210, 1551, 1720 and 1819 cm−1. To extract the spectra of these two species, a scaled 10 ns spectrum was subtracted from the 100 ns spectrum to remove the contribution from the species observed at the early delay time. The other was given a similar treatment, and the results are shown in Fig. 6 in spectra (b) and (d). The species that appear later in time is identified as the ground state NO2-QN-O− because the spectrum (b) looks identical to the resonance Raman spectrum of authentic NO2-QN-O− obtained with tetra-butylammonium hydroxide as an organic base. Carbonyl stretching and the combination tone of 817 and 997 cm−1 vibrations are responsible for vibrational bands at 1720 and 1819 cm−1, respectively, which are the characteristic vibrations of the ground state NO2-QN-O−, and are used to identify it.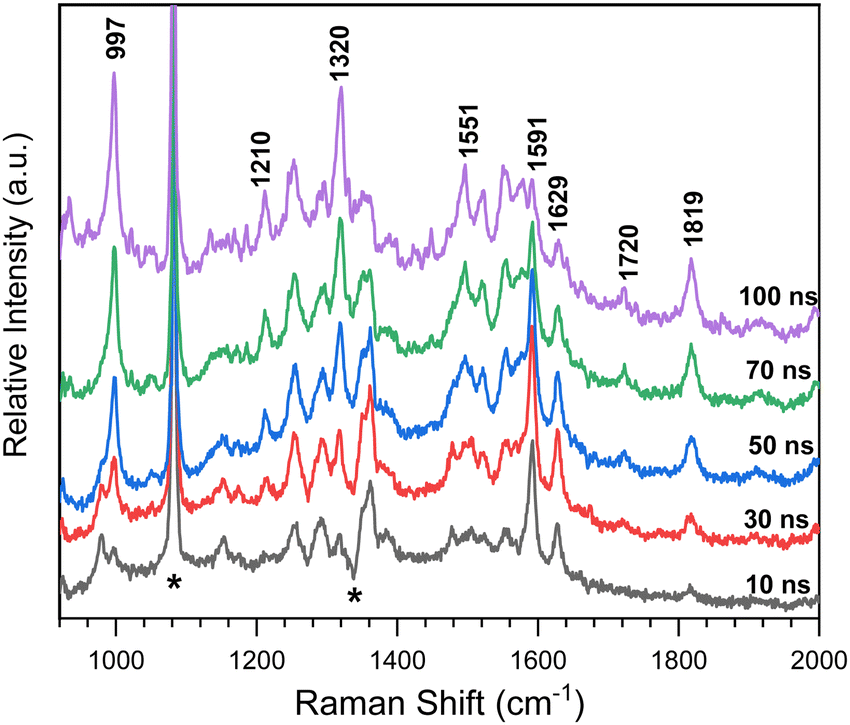 | ||
| Fig. 5 Time-resolved resonance Raman spectra after excitation of 8-hydroxy-5-nitroquinoline in acetonitrile with 435 nm as Raman probe. The delay time between the pump and probe laser has been presented close to the corresponding spectrum. The Raman shifts of some selected Raman bands are labeled in the graph. Star symbols mark solvent subtraction, stray-light, and ambient-light artifacts. | ||
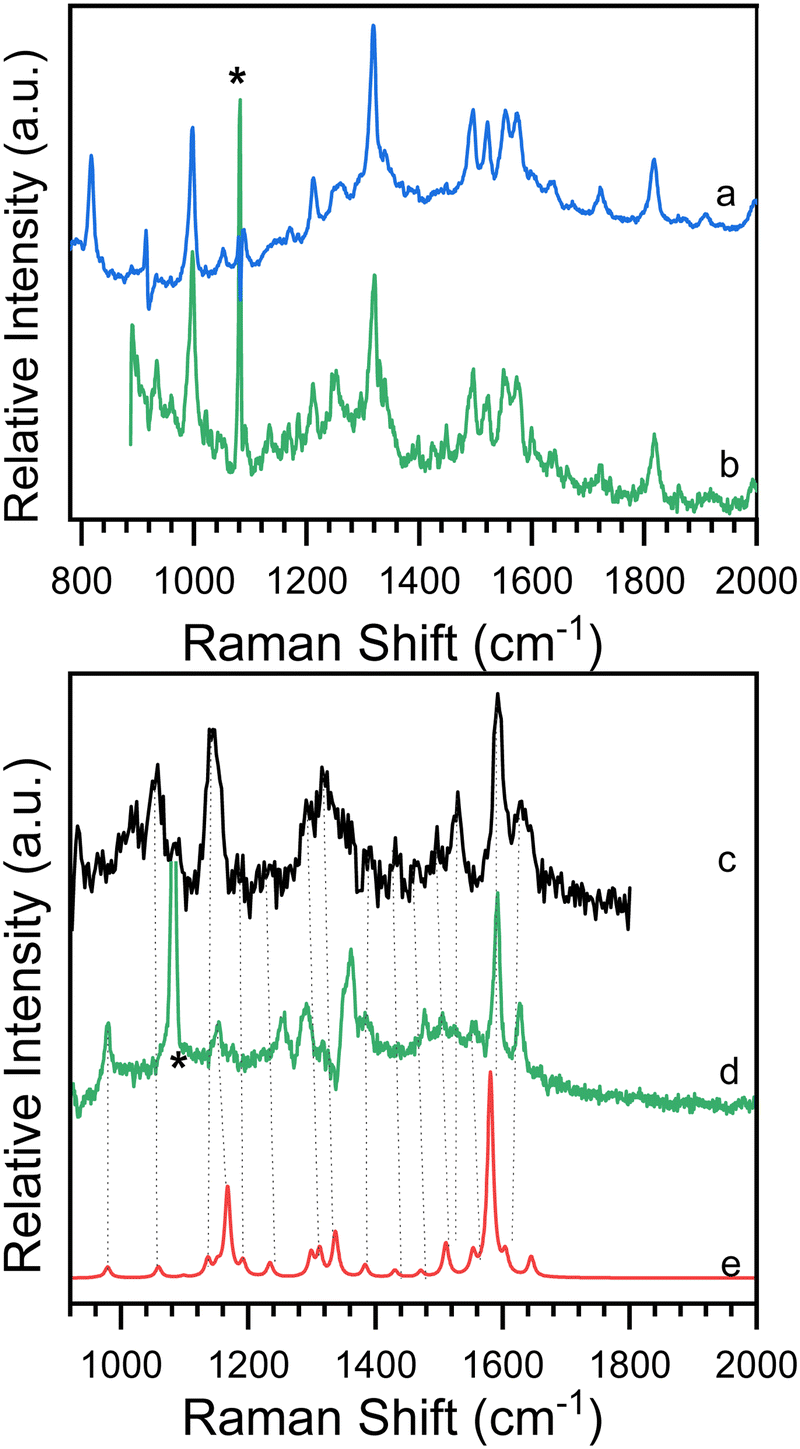 | ||
| Fig. 6 Comparison of experimental resonance Raman spectra observed at (b) later and (d) early time delays in time-resolved resonance Raman experiment and (c) single-beam transient resonance Raman spectrum to (a) the resonance Raman spectrum of authentic NO2-QN-O− and (e) the calculated Raman spectra of the T1 state NO2-QN-O−. Star symbols mark solvent subtraction, stray-light, and ambient-light artifacts. | ||
Fig. 6 also shows a single-beam transient resonance Raman spectrum induced by a 266 nm laser pulse, which is consistent with the early species detected using a 435 nm Raman probe, indicating that they belong to the same species. The spectrum (e) in Fig. 6 depicts the calculated Raman spectrum of the T1 state NO2-QN-O−, which was used to aid in the assignment of the early species. The calculated Raman spectrum of the T1 state NO2-QN-O−shows vibrations at frequencies of 979, 1167, 1299, 1384, 1471, 1511, 1553, 1581 and 1645 cm−1. The average difference between calculated and experimental values for nine vibrational bands is 7.6 cm−1. This implies that the calculated spectrum of the T1 state NO2-QN-O− is in good agreement with the experimental one, and the early species in Fig. 5 is thus assigned to the T1 state NO2-QN-O−. The difference in band intensity pattern and the frequency deviation is due to the fact that the experimental spectrum is resonance enhanced while the calculated spectrum is not. Table S1 in the ESI† provides a detailed comparison and description of the vibrational modes.
3.4. The ESPT mechanism
The transient species detected in TA experiments have lifetimes of 8.5 ps, ∼10 ns and 5.2 μs, respectively. The ∼10 ns species (represented by the 8.5 ps picosecond TA spectrum) is critical in identifying these species. Its absorption spectrum is strikingly similar to that of the T1 state NO2-QNH+-OH, indicating that blocking ≥N with a proton prevents its transformation decay and thus assigns it to the T1 state NO2-QN-OH. Quinoline protonation has little effect on the T1 state absorption, implying that the nonbonding electron of the N atom in quinoline, like 5-nitroquilone, has little contribution to the intramolecular charge transfer. The TBA controlled TA results show that the 5.2 μs species (represented by the nanosecond TA spectrum recorded under argon condition in acetonitrile) is still a proton donor capable of the intermolecular proton transfer with a rate constant controlled by diffusion. The 5.2 μs species is thus assigned to the T1 state NO2-QNH-O. This assignment is supported by the results of 5-nitroquinoline and 4-nitro-1-naphthol, which have only one functional group, either ≥N or –OH, and do not undergo the transformation in the sub-picosecond time scale. All of these findings indicate that the direct intramolecular ESPT of 8-hydroxy-5-nitroquinoline occurs in the T1 state and that the ISC takes place prior to the intramolecular S1 state ESPT.In the time-resolved resonance Raman experiment, the S0 state anionic form NO2-QN-O− was detected following its T1 state. This is because the oxygen in the solution quenched the T1 state NO2-QN-O−, causing it to return to its corresponding S0, which also absorbs at the detective wavelength. The time-resolved resonance Raman spectroscopy makes use of a liquid-flowing sample system that is designed to be exposed to air. The T1 state NO2-QN-O− detected in Raman studies that differ from those detected in nanosecond TA measurements performed under argon conditions are the result of trace amounts of water rather than oxygen. Despite the fact that acetonitrile is 99.9% pure, the concentration of water can reach 10−2–10−3 M.28 Furthermore, the humidity of the air influences the water content. The water residue can be effectively reduced by using an argon saturated solution. This is supported by the nanosecond TA results obtained by varying the argon purge times (Fig. S9, ESI†) and water volumes (Fig. S10, ESI†). The results indicate that the presence of water causes dissociation. It should be noted that the ground state NO2-QN-O− was observed immediately after the laser excitation in the presence of bulk water, such as a water volume percentage ≥6%. This suggests another pathway for dissociation via the S1 state NO2-QN-O−, which is produced by excitation of the ground state hydrogen-bonded complex formed by 8-hydroxy-5-nitroquinoline and water molecules.
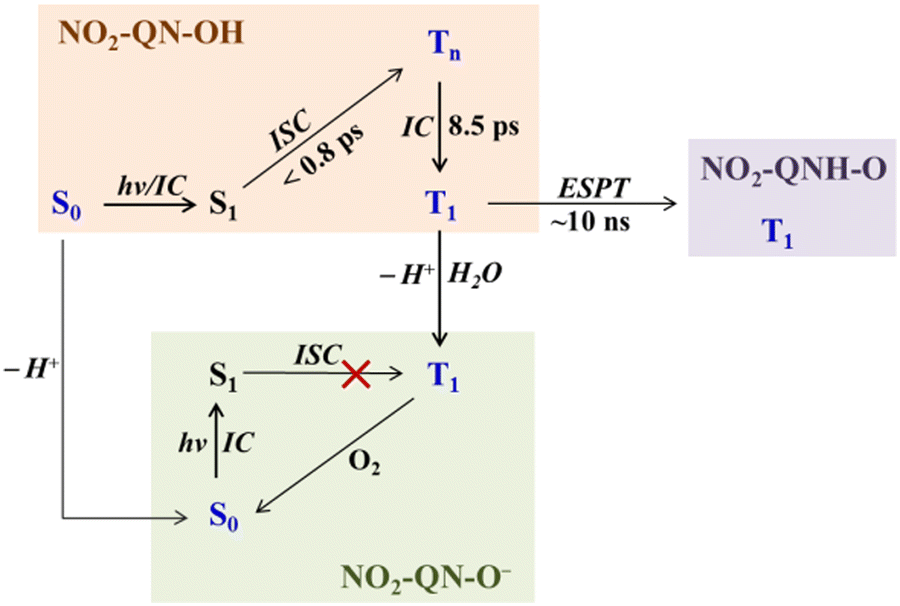
As a result, the photochemistry of 8-hydroxy-5-nitroquinoline was proposed, as shown in Scheme 3. In neat acetonitrile, the T1 state NO2-QN-OH undergoes intramolecular ESPT to form the T1 state of NO2-QNH-O, which has a much lower energy than NO2-QN-OH. In the presence of a trace amount of water, the excited state NO2-QN-OH dissociates to form NO2-QN-O−. Here, the dissociation in the S1 state was ruled out because the ISC of NO2-QN-O− is inefficient, as no signal of the T1 state NO2-QN-O− was observed after direct excitation of ground state NO2-QN-O− (Fig. S6, ESI†). Under air conditions (in the presence of trace water), 4-nitro-1-naphthol cannot dissociate in its T1 state. This difference could be because the dissociation of the T1 state 4-nitro-1-naphthol aided by a water cluster is a diffusion-controlled reaction, and therefore the water concentration determines the lifetime of its T1 state.8 This suggests that the adjacent –OH and ≥N in 8-hydroxy-5-nitroquinoline may stabilize the presence of water, allowing deprotonation to occur via the hydrogen-bonding complex. In the presence of water, the dissociation effectively competes with the direct intramolecular ESPT, which is not surprising given that –OH is more acidic than >NH. Furthermore, our calculations show that the presence of H2O molecules cannot help to lower the activation barrier of ESPT in the T1 state. The substitution of the NO2 group at the para position of the OH group significantly increases the acidities of 4-nitro-1-naphthol and 8-hydroxy-5-nitroquinoline 2–3 pKa when compared to the unsubstituted ones. The enhanced acidity and long lifetime of the T1 state 4-nitro-1-naphthol enable it to undergo a proton transfer with weak bases.8 Similarly, the same properties of the T1 state 8-hydroxy-5-nitroquinoline could allow intramolecular ESPT to occur without the need for a proton mediator. On the other hand, the dimer model can be ruled out because dimers are difficult to form in polar solvents at the concentrations used in these TA and Raman experiments.
 | ||
| Scheme 3 The proposed photochemistry of 8-hydroxy-5-nitroquinoline in neat acetonitrile and with water present, where the blue color represents the species observed with spectroscopic experiments. | ||
8-Hydroxy-5-nitroquinoline has been shown to have antibacterial activity by chelating iron cations with the quinoline N and the hydroxyl O, resulting in iron starvation. Due to the formation of drug-ion complexes, the antibacterial activity of 8-hydroxy-5-nitroquinoline is reduced in the presence of some certain divalent metal cations, such as Mg2+ and Mn2+, which are the major cationic species involved in bacterial metabolism. Because the anion NO2-QN-O− is easier to chelate with the divalent cation, less anion is expected to be produced before the drug reaches its effective position. As a result of our findings, drugs delivered in an aqueous environment should be protected from light.
4. Conclusion
In this work, we used transient absorption and time-resolved resonance Raman spectroscopies to investigate the photochemistry of 8-hydroxy-5-nitroquinoline (NO2-QN-OH) in acetonitrile under argon and air conditions. Based on the acid and t-butylamine (TBA) controlled TA results, calculated Raman spectra for possible species, and spectroscopic and kinetic reports for 1-nitronaphthalene derivatives, we identify the key intermediates and propose the photochemistry mechanism, as depicted in Scheme 3. When NO2-QN-OH is photoexcited, the ISC occurs in 0.8 ps to form the Tn state, followed by the IC in 8.5 ps to produce the T1 state. The fate of the T1 state NO2-QN-OH is affected by its environment. In neat acetonitrile, it undergoes a direct intramolecular proton transfer, yielding the tautomeric T1 state NO2-QNH-O. The NO2 group accelerates the ISC and increases the acidity of the hydroxyl group, so that the intramolecular ESPT of hydroxyl-quinoline in an aprotic polar solvent was observed for the first time. Even in the presence of trace amounts of water, the deprotonation of the T1 state NO2-QN-OH efficiently competes with the intramolecular proton transfer. A comparison with 4-nitro-1-naphthol indicates that the stabilization of water by neighboring –OH and ≥N in 8-hydroxy-5-nitroquinoline aids dissociation. These findings provide essential spectroscopic information for a better understanding of the ESPT mechanism of 8-hydroxy-5-nitroquinoline, which is useful for reducing the photo-induced side effects in drugs containing the 8-hydroxy-5-nitroquinoline unit.Conflicts of interest
There are no conflicts to declare.Acknowledgements
This work was supported by the National Natural Science Foundation of China for J. X. (Grant No. 21973082), Y. D. (No. 62275238) and B. X. (No. 21903068) and the National Key Research and Development Program of China (Grant No. 2019YFA0709400). We thank Prof. Yan Wan in Beijing Normal University for the assistance with the picosecond TA experiment.References
- K. Liu, Y. Abouelhassan, Y. Zhang, S. Jin and R. W. Huigens Iii, ACS Infect. Dis., 2022, 8, 1594–1605 CrossRef CAS.
- W. Suwanjang, S. Prachayasittikul and V. Prachayasittikul, PeerJ, 2016, 4, e2389 CrossRef PubMed.
- A. Sobke, M. Klinger, B. Hermann, S. Sachse, S. Nietzsche, O. Makarewicz, P. M. Keller, W. Pfister and E. Straube, Antimicrob. Agents Chemother., 2012, 56, 6021–6025 CrossRef CAS.
- T. Van Hau, W. Ruankham, W. Suwanjang, N. Songtawee, P. Wongchitrat, R. Pingaew, V. Prachayasittikul, S. Prachayasittikul and K. Phopin, Chem. Res. Toxicol., 2019, 32, 2182–2191 Search PubMed.
- H. Jiang, J. E. Taggart, X. Zhang, D. M. Benbrook, S. E. Lind and W. Q. Ding, Cancer Lett., 2011, 312, 11–17 CrossRef CAS PubMed.
- V. Oliveri and G. Vecchio, Eur. J. Med. Chem., 2016, 120, 252–274 CrossRef CAS.
- B. C. Westlake, M. K. Brennaman, J. J. Concepcion, J. J. Paul, S. E. Bettis, S. D. Hampton, S. A. Miller, N. V. Lebedeva, M. D. E. Forbes, A. M. Moran, T. J. Meyer and J. M. Papanikolas, Proc. Natl. Acad. Sci. U. S. A., 2011, 108, 8554–8558 CrossRef CAS.
- F. Zhang, D. Zhang, Y. Du, P. Jin, Y. Zhao, X. Zheng and J. Xue, Phys. Chem. Chem. Phys., 2018, 20, 11876–11881 RSC.
- X. Pan, T. Han, J. Long, B. Xie, Y. Du, Y. Zhao, X. Zheng and J. Xue, Phys. Chem. Chem. Phys., 2022, 24, 18427–18434 RSC.
- S.-Y. Park and D.-J. Jang, J. Am. Chem. Soc., 2010, 132, 297–302 CrossRef CAS PubMed.
- S. Y. Park, Y. S. Lee, O. H. Kwon and D. J. Jang, Chem. Commun., 2009, 926–928 RSC.
- O.-H. Kwon, Y.-S. Lee, B. K. Yoo and D.-J. Jang, Angew. Chem., 2006, 118, 429–433 CrossRef.
- H. Lim, S.-Y. Park and D.-J. Jang, J. Phys. Chem. A, 2010, 114, 11432–11435 CrossRef CAS PubMed.
- S. Y. Park, H. B. Kim, B. K. Yoo and D. J. Jang, J. Phys. Chem. B, 2012, 116, 14153–14158 CrossRef CAS.
- W. Wang, M. Marshall, E. Collins, S. Marquez, C. Mu, K. H. Bowen and X. Zhang, Nat. Commun., 2019, 10, 1170 CrossRef PubMed.
- E. Bardez, I. Devol, B. Larrey and B. Valeur, J. Phys. Chem. B, 1997, 101, 7786–7793 CrossRef CAS.
- M. A. Codescu, M. Weiss, M. Brehm, O. Kornilov, D. Sebastiani and E. T. J. Nibbering, J. Phys. Chem. A, 2021, 125, 1845–1859 CrossRef CAS PubMed.
- J. Zhao, J. Chen, Y. Cui, J. Wang, L. Xia, Y. Dai, P. Song and F. Ma, Phys. Chem. Chem. Phys., 2015, 17, 1142–1150 RSC.
- B. Kang, K. C. Ko, S. Y. Park, D. J. Jang and J. Y. Lee, Phys. Chem. Chem. Phys., 2011, 13, 6332–6339 RSC.
- W. H. Fang, J. Am. Chem. Soc., 1998, 120, 7568–7576 CrossRef CAS.
- M. Guglielmi, I. Tavernelli and U. Rothlisberger, Phys. Chem. Chem. Phys., 2009, 11, 4549–4555 RSC.
- S. C. Lan and Y. H. Liu, Spectrochim. Acta, Part A, 2015, 139, 49–53 CrossRef CAS PubMed.
- Y.-H. Liu, S.-M. Wang, C. Zhu and S. H. Lin, New J. Chem., 2017, 41, 8437–8442 RSC.
- T. Udagawa, I. Hattori, Y. Kanematsu, T. Ishimoto and M. Tachikawa, Int. J. Quantum Chem., 2022, 122, e26962 CrossRef CAS.
- T. D. Nekipelova, F. E. Gostev, V. A. Kuzmin and O. M. Sarkisov, Photochem. Photobiol. Sci., 2006, 5, 815–821 CrossRef CAS.
- M. S. Mehata, H. C. Joshi and H. B. Tripathi, Chem. Phys. Lett., 2002, 359, 314–320 CrossRef CAS.
- M. S. Mehata, Chem. Phys. Lett., 2007, 436, 357–361 CrossRef CAS.
- J. L. Pérez-Lustres, F. Rodriguez-Prieto, M. Mosquera, T. A. Senyushkina, N. P. Ernsting and S. A. Kovalenko, J. Am. Chem. Soc., 2007, 129, 5408–5418 CrossRef.
- B. Bhattacharya and A. Samanta, J. Phys. Chem. B, 2008, 112, 10101–10106 CrossRef CAS PubMed.
- I. Presiado, Y. Erez, R. Gepshtein and D. Huppert, J. Phys. Chem. C, 2009, 113, 20066–20075 CrossRef CAS.
- C. M. Cheatum, M. M. Heckscher and F. F. Crim, Chem. Phys. Lett., 2001, 349, 37–42 CrossRef CAS.
- S.-Y. Park, P. Ghosh, S. O. Park, Y. M. Lee, S. K. Kwak and O.-H. Kwon, RSC Adv., 2016, 6, 9812–9821 RSC.
- W. H. Fang and Q.-S. Li, Chem. Phys. Lett., 2003, 367, 637–644 CrossRef.
- W. Rodriguez-Cordoba, L. Gutierrez-Arzaluz, F. Cortes-Guzman and J. Peon, Chem. Commun., 2021, 57, 12218–12235 RSC.
- M. A. Larsen, J. Thogersen, A. B. Stephansen, J. Peon, T. I. Solling and S. R. Keiding, J. Phys. Chem. A, 2016, 120, 28–35 CrossRef CAS PubMed.
- M. M. Brister, L. E. Piñero-Santiago, M. Morel, R. Arce and C. E. Crespo-Hernández, J. Phys. Chem. Lett., 2016, 7, 5086–5092 CrossRef CAS PubMed.
- E. F. Plaza-Medina, W. Rodriguez-Cordoba and J. Peon, J. Phys. Chem. A, 2011, 115, 9782–9789 CrossRef CAS.
- J. S. Zugazagoitia, E. Collado-Fregoso, E. F. Medina-Plaza and J. Peon, J. Phys. Chem. A, 2009, 113, 805–810 CrossRef CAS PubMed.
- M. M. Brister, L. E. Piñeo-Santiago, M. Morel, R. Arce and C. E. Crespo-Hernández, J. Phys. Chem. A, 2017, 121, 8197–8206 CrossRef CAS PubMed.
- R. A. Vogt and C. E. Crespo-Hernández, J. Phys. Chem. A, 2013, 117, 14100–14108 CrossRef CAS PubMed.
- X. F. Tang, P. K. Jia, Y. Zhao, J. Xue, G. Cui and B. B. Xie, Phys. Chem. Chem. Phys., 2022, 24, 20517–20529 RSC.
- J. Long, Z. Ye, Y. Du, X.-M. Zheng and J.-D. Xue, Chin. J. Chem. Phys., 2020, 33, 635–641 CrossRef CAS.
- S. Y. Park, Y. M. Lee, K. Kwac, Y. Jung and O. H. Kwon, Chem. – Eur. J., 2016, 22, 4340–4344 CrossRef CAS.
- S. Y. Park, T. G. Kim, M. J. Ajitha, K. Kwac, Y. M. Lee, H. Kim, Y. Jung and O. H. Kwon, Phys. Chem. Chem. Phys., 2016, 18, 24880–24889 RSC.
- A. Adhikari, J.-H. Park, H.-W. Nho and O.-H. Kwon, J. Mol. Liq., 2020, 320, 114346 CrossRef CAS.
- M. Tao, L. Wen, D. Huo, Z. Kuang, D. Song, Y. Wan, H. Zhao, J. Yan and A. Xia, J. Phys. Chem. B, 2021, 125, 11275–11284 CrossRef CAS PubMed.
- M. Tao, Y. Li, Q. Huang, H. Zhao, J. Lan, Y. Wan, Z. Kuang and A. Xia, J. Phys. Chem. Lett., 2022, 13, 4486–4494 CrossRef CAS.
- J. Kong, W. Zhang, G. Li, D. Huo, Y. Guo, X. Niu, Y. Wan, B. Tang and A. Xia, J. Phys. Chem. Lett., 2020, 11, 10329–10339 CrossRef CAS.
- Z. Ye, Y. Du, X. Pan, X. Zheng and J. Xue, J. Photochem. Photobiol., A, 2021, 408, 113106 CrossRef CAS.
- D. Zhang, P. Jin, M. Yang, Y. Du, X. Zheng and J. Xue, J. Phys. Chem. A, 2018, 122, 1831–1837 CrossRef CAS.
- P. Jin, J. Long, Y. Du, X. Zheng and J. Xue, Spectrochim. Acta, Part A, 2019, 217, 44–50 CrossRef CAS PubMed.
- A. D. Becke, J. Chem. Phys., 1993, 98, 5648–5652 CrossRef CAS.
- C. Lee, W. Yang and R. G. Parr, Phys. Rev. B: Condens. Matter Mater. Phys., 1988, 37, 785–789 CrossRef CAS.
- M. J. Frisch, G. W. Trucks, H. B. Schlegel, G. E. Scuseria, M. A. Robb, J. R. Cheeseman, G. Scalmani, V. Barone, B. Mennucci, G. A. Petersson, et al., Gaussian 09, Revision D.01, Gaussian, Inc., Wallingford CT, 2009 Search PubMed.
- C. Reichardt, R. A. Vogt and C. E. Crespo-Hernández, J. Chem. Phys., 2009, 131, 224518 CrossRef PubMed.
- C. E. Crespo-Hernández, G. Burdzinski and R. Arce, J. Phys. Chem. A, 2008, 112, 6313–6319 CrossRef.
- R. A. Vogt, C. Reichardt and C. E. Crespo-Hernández, J. Phys. Chem. A, 2013, 117, 6580–6588 CrossRef CAS.
- W. G. Herkstroeter, J. Am. Chem. Soc., 1975, 97, 4161–4167 CrossRef CAS.
Footnote |
| † Electronic supplementary information (ESI) available. See DOI: https://doi.org/10.1039/d2cp04315g |
| This journal is © the Owner Societies 2023 |