 Open Access Article
Creative Commons Attribution 3.0 Unported Licence
Dielectric switching in correlation with the structural phase transitions in tetrapropylammonium perchlorate†
Monika
Trzebiatowska
 a,
Dorota A.
Kowalska
 a,
Marek A.
Gusowski
 *b,
Ewelina
Jach
 b and
Agnieszka
Ciżman
 b
b
aInstitute of Low Temperature and Structure Research, Polish Academy of Sciences, 50-422 Wrocław, Poland
bFaculty of Fundamental Problems of Technology, Wrocław University of Science and Technology, Wybrzeże Wyspiańskiego 27, 50-370, Wrocław, Poland. E-mail: marek.gusowski@pwr.edu.pl
First published on 5th December 2022
Abstract
The crystals of the tetrapropylammonium perchlorate ([(CH3CH2CH2)4N]ClO4, TePrAClO4) compound undergo two reversible phase transitions: at ca. T1 = 284 K and at ca. T2 = 445 K. The observed phase transitions and distinct dielectric and relaxation effects are due to the dynamic motions of the organic cations and anionic framework. The crystals become ordered at low temperatures, then disordered at room temperature (propyl chains of the organic part as well as perchlorate ions are disordered over the mirror plane at c = 1/4 and 3/4) and highly disordered at high temperatures. The comparable changes in the wavenumber and FWHM shifts (IR and Raman spectroscopy) in the case of tetrapropylammonium and perchlorate ions in the phase transition at T1 and slightly more significant changes for organic cations (juxtaposed with perchlorate ions) in the phase transition at T2 lead to a conclusion that the phase transition at T1 is equally driven by motions of the two ions, while the phase transition at T2 is more influenced by the motions of organic cations. The phase transition at T2 with its large entropy change resembles the behavior found in liquid crystals. The dielectric function values can be switched and tuned in the low- and high-dielectric states, which may indicate the potential application of this material in sensors or actuators.
Introduction
Some compounds may hide some of their properties for a very long time before being rediscovered. In particular, the family of perchlorate salts with simple amines is underrated in this regard. However, their great come back has been noticed as they often show ferroelectric or ferroelastic properties combined with the presence of phase transitions. A remarkable example of this return is the case of a complex of tetraethylammonium perchlorate (abbreviated hereafter as TeEClO4). This crystal was first discovered in the 1990s1,2 and it took over ten years to discover it as a molecular ferroelectric.3 It has been found that this crystal is ferroelectric at room temperature (RT), with a very high polarization value, and it undergoes a phase transition (PT) at 360/380 K (cooling/heating) from the polar monoclinic Cc to (most probably) the nonpolar cubic Fm![[3 with combining macron]](https://www.rsc.org/images/entities/char_0033_0304.gif) m space group. This PT is followed by a sudden change in the values of the dielectric function. It has been concluded that the ferroelectric properties of the low-temperature (LT) phase originate from the relative displacement of cations (tetraethylammonium) and anions (perchlorate) in the same layer and that the material possesses a high number of crystallographically equivalent polarization directions, equal to 24.
m space group. This PT is followed by a sudden change in the values of the dielectric function. It has been concluded that the ferroelectric properties of the low-temperature (LT) phase originate from the relative displacement of cations (tetraethylammonium) and anions (perchlorate) in the same layer and that the material possesses a high number of crystallographically equivalent polarization directions, equal to 24.
Other examples of perchlorates complexed with ammonium molecules include their complexes with guanidinium (Gua)4,5 several N-heterocyclic ammonium cations such as piperazinium (Pipa),6 and derivatives of piperidinium (Pipd),7 1,4-diazabicyclo[2.2.2]octane (Dabco),8 and imidazolium (Im).9 These materials mostly possess a perovskite-like structure with incorporated potassium ions, wherein the perchlorate anions along with K+ create a 3D framework with voids complemented by the protonated ammonium cations. They all experience a phase transition at a certain temperature, covering the range of 300–450 K. An extreme case of multiple PTs is observed in PipaKClO4 with three subsequent phase transitions, going from Pbca through Pbcm with an increasing disorder of both H2Pipa2+ and ClO4− ions and with an increase in temperature. Some crystals exhibit additional extraordinary features, such as an electromechanical coupling found in ImKClO4 with a piezoresponse exceeding by 150% that of the well-known lead zirconate titanate (PZT) ceramics and almost 300% that of the VDF-TrFE polymer.9
All perchlorate complexes have been proved to be stable up to a very high temperature of 500 K and even beyond which makes them good candidates for different applications, such as thermal imaging, mechanical actuation or data storage.10
Attracted by the numerous interesting features of perchlorates, such as ferroelectricity, piezoelectricity, and dielectric switching as well as their interesting and sometimes unexpected phase transitions, we have decided to search for other perchlorate-based materials. It has been shown, in the case of the long-known material: tetrapropylammonium perchlorate, [(CH3CH2CH2)4N]ClO4, that new surprising features may appear. The study of this materials has been so far only limited to a low-temperature (LT) crystal structure.11 No other results have been found regarding this, as we will show, fascinating material.
Experimental
Synthesis
All reagents (analytical grade) used for the synthesis were commercially purchased from Sigma-Aldrich and used without further purification. In order to obtain (CH3CH2CH2)4N·ClO4, 5 mmol of (CH3CH2CH2)4NCl and 5 mmol of HClO4 were dissolved in 20 ml of methanol. The solution was allowed to stand at room temperature. The crystals were harvested after two days. The corresponding PXRD diagrams at different temperatures are presented in Fig. S1 in the ESI.†Structure analysis
The single-crystal X-ray diffraction patterns were collected on an Oxford X’Calibur four-circle diffractometer operating with graphite-monochromated MoKα radiation (λ = 0.71073 Å). The Oxford open-flow heating-cooling system maintained nonambient temperatures. For data processing, CrysAlis PRO12 and CrysAlis RED13 software programs were used. The crystal structures were solved by direct methods and refined using the SHELX crystallographic software package.14 Olex215 software was used to prepare data for publication. Diamond16 software was used to create graphical representations of the crystal structure. The crystallographic details concerning the crystal, data collection and refinement details are presented in Table 1 and Table S1 (ESI†).| Phase | LTa | RT |
|---|---|---|
| a Data can be compared with those previously measured by Fujihara et al.11 at 173 K. b The non-standard setting of the space group Pnma was chosen for comparison with the LT phase. | ||
| Crystal data | ||
| Crystal system | Orthorhombic | Orthorhombic |
| Space group | P212121 (no. 19) | Pnam (no. 62)b |
| Temperature (K) | 100 | 295 |
| a, b, c (Å) | 13.215(3), 12.106(3), 9.641(2) | 13.655(4), 12.257(4), 9.758(3) |
| V (Å3) | 1542.4(6) | 1634.4(9) |
| μ (mm−1) | 0.26 | 0.24 |
| Data collection | ||
| Refl. measured/unique/observed [I > 2σ(I)] | 43![[thin space (1/6-em)]](https://www.rsc.org/images/entities/char_2009.gif) 339/3943/3795 339/3943/3795 |
40![[thin space (1/6-em)]](https://www.rsc.org/images/entities/char_2009.gif) 477/1767/1409 477/1767/1409 |
| R int | 0.023 | 0.030 |
(sin![[thin space (1/6-em)]](https://www.rsc.org/images/entities/char_2009.gif) θ/λ)max (Å−1) θ/λ)max (Å−1) |
0.676 | 0.625 |
| Refinement | ||
| R[F2 > 2σ(F2)], wR(F2), S | 0.024, 0.063, 1.08 | 0.038, 0.111, 1.05 |
| Data/parameters/restraints | 3943/169/0 | 1767/171/0 |
| Extinction coefficient | 0.0051(10) | 0.0059(11) |
| Δρmax, Δρmin (e Å−3) | 0.23, −0.33 | 0.18, −0.23 |
| Absolute structure | Refined as an inversion twin | — |
| Abs. struct. param. | 0.42(5) | — |
All non-hydrogen atoms were refined anisotropically. The positions of the H atoms from TePrA+ moieties were refined with fixed C—H distances using HFIX 23 and HFIX 137 (for terminal carbon atoms) instructions. The attempts to collect single-crystal X-ray diffraction data for TePrAClO4 after the second phase transition (PT2) at 445 K were unsuccessful. The single-crystal cracking was observed and then the conversion into powder occurred. For the completion of crystal characterization, the high temperature powder X-ray diffraction (PXRD) studies were performed on a PANalytical X’Pert diffractometer equipped with a PIXcel solid-state linear detector. For the sample heating/cooling from RT to 478 K an Anton Paar high-temperature attachment was utilized. CuKα radiation (λ = 1.5418 Å), generated at 40 kV and 30 mA, in reflection mode was used for registering X-ray diffraction patterns. Data treatment was carried out using PANalytical X’Pert HighScore Plus software.
IR and Raman spectroscopy
The temperature-dependent infrared spectra were measured in a heating mode on KBr pellets in the range 4000–550 cm−1 using a Nicolet iN10 Fourier transform IR spectrometer equipped with a ZnSe-Linkam cryostat cell THMS600 with a temperature stability of 0.1 K, a liquid nitrogen (LN2) cooled mercury-cadmium-telluride detector, a permanently aligned 15× objective, a 0.7 numerical aperture with a working distance set at 16 mm.The Raman spectra were measured in heating mode using a Renishaw InVia Raman spectrometer equipped with a confocal DM 2500 Leica optical microscope, a thermoelectrically cooled CCD as a detector, and an Ar+ laser operating at 488 nm. The spectral resolution in IR and Raman experiments was set at 2 cm−1. Due to the sublimation of the sample and its subsequent deposition on a measurement window, which blocked the laser beam, we had to stop the experiment at 470 K, just before the second PT, although the onset of the second PT can be still observed as the laser heat led to additional heating of the sample.
DSC measurements
Differential scanning calorimetry (DSC) measurements, over the temperature range 200–450 K with a heating rate of 10 K min−1, were performed using a Mettler Toledo DSC-1 instrument. The measurements were carried out by heating and cooling the polycrystalline samples in aluminum crucibles under a nitrogen atmosphere at atmospheric pressure.Dielectric measurements
The complex dielectric permittivity ε (ε = ε′ − iε′′) of TePrAClO4 compounds was measured using the Dynamic Impedance Spectroscopy (DIS) method on a Novocontrol Alpha Analyzer in a frequency range 10 Hz–1 MHz and in the temperature range from 200 K to 450 K. The powder-pressed pellet plates deposited with silver conducting paste were used and the measuring AC voltage was 1 V.Results and discussion
Thermal properties
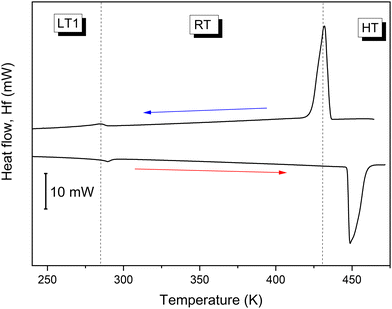
In order to detect heat anomalies during the cooling and heating processes related to the phase transition triggered by temperature, the DSC method has been used. The DSC scans of TePrAClO4 reveal two reversible heat anomalies at around 284 K and 445 K (Fig. 1).The PT observed at 284 K (PT1) plotted in Fig. 1 can be regarded rather as a continuous phase transition due to the quasi-continuous character of entropy changes, approaching 10 J mol−1 K−1, which puts the title crystal in the same row as other perchlorate perovskites, such as dabco-KClO4 or piperazinium-NaClO4.8 Using the Boltzmann equation, the number of disordered sites in the RT phase is calculated to be 2.8, suggesting a disorder in this phase.
Sharp anomalous peaks at 432 K upon cooling and at 449 K upon heating (PT2) together with a large hysteresis of about 17 K and step-like changes of entropy around the phase transition temperature (Fig. 2) suggest a discontinuous first-order character of the PT of the TePrAClO4 compound at T2. Moreover, a large entropy change associated with the PT, reaching 130 J mol−1 K−1, suggests a great number of degrees of freedom and a giant disorder in the HT phase, where both TePrA+ and ClO4− ions could become disordered. The entropy value is still much higher here than those reported for trimethylethylammonium-ClO4, which is around 40 J mol−1 K−1.17 Actually, it is close to the values obtained for phase changes in liquid crystals, which may go up to several hundreds of J mol−1 K−1.18 There is a clear dependence of the ΔS on the composition of the molecules constituting liquid crystals. For example, each methyl or methylene unit (here contained in the four propyl chains in TePrA+ cation) contributes around 18 and 7 J mol−1 K−1, respectively, to the overall ΔS in the phase change from the crystal at RT to the isotropic liquid at HT.18,19 Therefore, we might suspect that a similar transition takes place at HT in the title crystal, resulting in an extremely disordered crystal resembling a quasi-isotropic liquid.
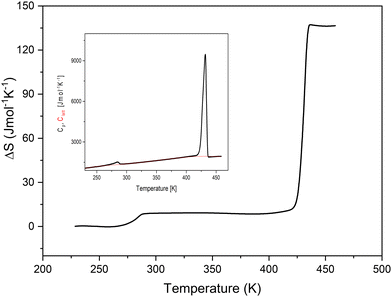 | ||
| Fig. 2 The temperature dependence of entropy changes of TePrAClO4. The inset shows the measured specific heat (Cp) and calculated lattice heat (Clatt). | ||
Structural data
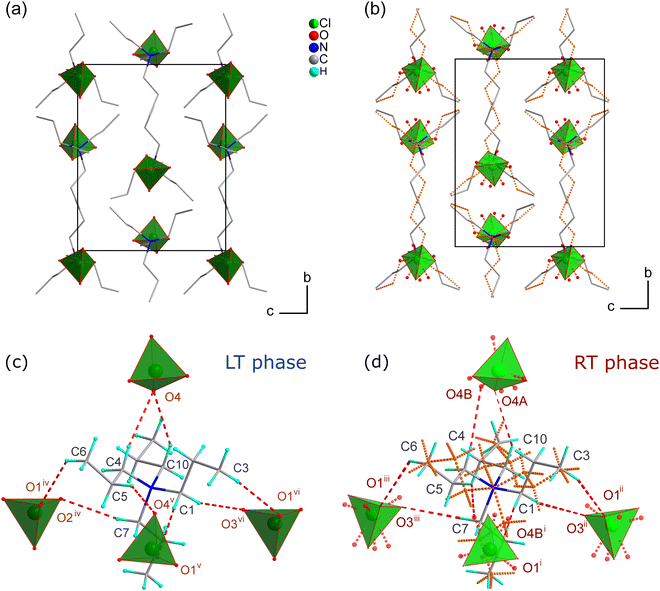
The X-ray diffraction studies have shown that TePrAClO4 crystallizes at RT in the orthorhombic system with the Pnam symmetry (RT phase), which is characterized by a disorder of propyl chains and perchlorate anions. Upon cooling, the structure undergoes a reversible phase transition (PT1) to the ordered orthorhombic LT phase with the P212121 symmetry (Fig. 3) at T1 = 284 K. Due to the symmetry reduction at the PT point, the sample becomes twinned. | ||
| Fig. 3 The symmetry change in TePrAClO4 as the temperature increases from (a) the LT phase to (b) the RT phase. | ||
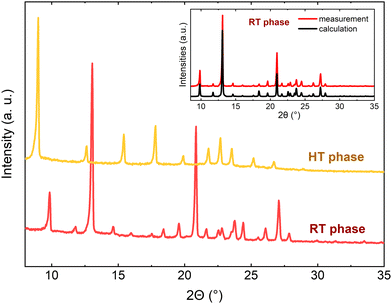
In the HT phase, the quality of the crystal was insufficient for single-crystal X-ray diffraction analysis, so the second reversible phase transition (PT2), at T2 = 445 K, to the HT phase was confirmed by powder X-ray diffraction (Fig. S1, ESI†). The comparison of the PXRD pattern of the RT phase with the simulated one based on the crystal data proves good purity of the measured sample (shown in the inset of Fig. 4). A reduction in the number of diffraction peaks in the PXRD diagrams is observed (e.g. the diffraction peaks at 11.8, 16, 18.4, 20.8, 24.4, 26.1, and 27.9° disappeared) as the temperature increases, thus we suspect that the change leads to a highly symmetric structure, although we are not able to provide a more accurate description. The structure of the HT phase cannot be indexed unambiguously even if based on the known RT phase. The attempts made to solve the structure of the HT phase failed, presumably due to the lack of a simple transformation between the unit cell of RT and HT phases as well as a magnifying inherent disorder. It must be noted that the poor quality and highly disordered crystals in the HT phase can be regarded as characteristic features for organic-inorganic hybrid compounds with perchlorate anions, such as TeEClO43 or with chloromethyl-triethylammonium cations’ RT phase.20
The asymmetric unit comprises two disordered ions: TePrA+ with C and H atoms disordered over a mirror plane perpendicular to the c-axis direction and ClO4− with disordered O atoms (Fig. S2b and S3b, ESI†). Due to the presence of disorder, the perchlorate ions are strongly distorted, the six tetrahedral angles are ranging from 93.4(6)–127.4(9)°. The TePrA+ ions are aligned in layers in the structure (Fig. 5b). The perchlorate ions are located among them creating together a net of hydrogen bonds (HBs) that stabilize the structure (Fig. 5d and Table S2, ESI†). Each of the ClO4− ions is surrounded by four TePrA+ cations and also every cation has four perchlorate anions as neighbours.
IR and Raman spectroscopy
The observed IR and Raman modes along with their assignment are given in Table S3 (ESI†). The factor group analysis has been omitted due to the fact that both tetrapropylammonium (TePrA+) cations and perchlorate anions are disordered at higher temperatures. The temperature-dependent IR spectra in full range and their details are presented in Fig. S5 and S6 (ESI†), respectively, while the Raman spectra are shown in Fig. S7 and S8 (ESI†), respectively. We have plotted the relations of some selected bands’ position and their corresponding full widths at half maximum (FWHMs) as the function of temperature in Fig. S9 (IR) and S10 (Raman) (ESI†).Basically, the observed bands originate from internal vibrations of TePrA+ cations and perchlorate anions as well as their translations and hindered rotations. The two phase transitions are clearly visible in both IR and Raman spectra, even though the Raman experiment had to be stopped in the middle of the PT2 due to the reasons explained in the Experimental section. The spectra show that PT1 should rather be regarded as first-order, while PT2 is abrupt and thus definitely of first order. Additionally, PT2 occurs with much larger thermal effect (based on the FWHMs changes) compared to PT1.
Since the literature for the assignment of vibrations of both ClO4− and TePrA+ ions is quite rich,21–28 we will further focus on two features: (i) the real symmetry of the crystal and (ii) the influence of temperature on its behavior near PTs.
Normally, an unperturbed tetrahedral ClO4− anion has nine normal modes. Its vibrational representation under the Td point group is: A1 + E + 2F2, leading to four vibration frequencies groups (in wavenumbers): symmetric stretching νsClO4− (A1) at ca. 930 cm−1, symmetric bending δsClO4− (E) at ca. 460 cm−1, asymmetric stretching νasClO4− (F2) at ca. 1100 cm−1 and asymmetric bending δasClO4− (F2) at ca. 620 cm−1. All of them are Raman active, but only two of them, of F2 symmetry, are also infrared active.23,29 However, due to the placement in a crystal, with the imposed site and factor-group symmetry, the bands should be split into several more. The main difference between the two phases (LT and RT) is the absence/presence of an inversion center, which means that in the LT phase, some modes are both IR- and Raman-active, while in the RT phase, they should be either IR- or Raman active (mutual exclusion rule). For example, when the anion is placed in C1 site symmetry and factor group D2 (LT-phase = P212121), the A1 mode should be composed of one Raman-active A mode and three IR-and-Raman active B1, B2 and B3 modes; while in Cs site symmetry with imposed factor group D2h (in RT phase = Pnam), A1 will transform into Raman-active: Ag, B3g and IR-active B1u, B2u. Therefore, for this particular mode, we should observe 4 (2) Raman and 3 (2) bands in the LT (RT) phase. In reality, there are 2 (1) Raman and 2 (1) IR modes visible in the LT (RT) phases, respectively. The lesser number of modes may be caused by a very weak absorption/intensity of a given band, a superposition of the bands and a real symmetry being different from expected as well as quite weak intermolecular interactions. The latter two facts are deduced. First, the center of symmetry is manifested in the simplest scenario by the fact that IR-active modes should be absent in theRaman spectra and vice versa. Here, this should apply to the RT phase; however, the observations prove different: the counterparts are observed both in IR and Raman spectra (though usually not with the same absorption/intensity). This leads to a conclusion that despite an apparent centrosymmetric arrangement, the real symmetry of the crystal is distorted resulting in the persistent absence of the center of symmetry, at least to a certain extent. Second, the splitting of totally symmetric A1 mode may result only from the factor group splitting. Thus, the rather weak intermolecular interactions are confirmed here as the A1 mode is split into a lesser number of modes than expected from the group theory. In general, the number of modes for ClO4− anions is smaller than anticipated except for the νasClO4− (F2) mode with the center at ca. 1100 cm−1. This band consists of multiple superimposed bands that originate from mutual interactions of the modes within one anion.
The case of TePrA+ cations is much more complicated than that of ClO4− anions in terms of symmetry considerations because one should examine every propyl chain separately (due to some differences in the bond lengths and angles) and it is practically impossible given the disorder at higher temperatures. Therefore, we will discuss its vibrations only with respect to its thermal features.
The disorder at higher temperatures is clearly seen in both IR and Raman spectra including the vibrations of both organic and inorganic ions (see Fig. 6 and Fig. S6, S8, ESI†). In Fig. S9 and S10 (ESI†), we have presented the values of wavenumber and FWHM of some selected bands, which showed the most remarkable changes upon the PTs. Basically, all the bands broaden and shift with temperature increase. There are two sudden changes during the cooling/heating corresponding to both PTs observed in DSC. The temperatures obtained by IR/Raman spectroscopy agree with the ones from DSC quite well. In the figures cited above, one can see that PT1 (LT-to-RT transition) is less pronounced than PT2 (RT-to-HT), though still clearly noticeable.
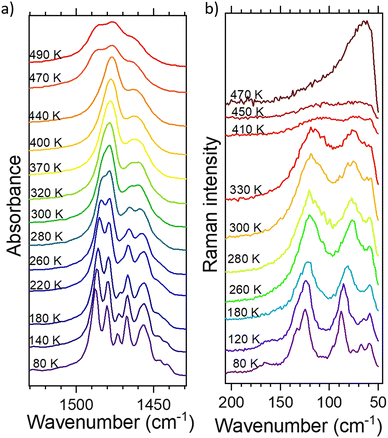 | ||
| Fig. 6 The thermal evolution of: (a) deformation CH3 and CH2 vibrations (IR) and (b) translations and librations of ClO4− and TePrA+ ions. | ||
The changes regarding ClO4− anion include wavenumber shifts towards lower values by <1 cm−1 for PT1 and a few cm−1 during PT2 for νsClO4−, δasClO4− and librations of this anion, while its translations move drastically from over 120 cm−1 down to almost 60 cm−1 in PT2 (depicted in Fig. S9 (IR) and S10 (Raman), ESI†). The FWHM values approach 1–3 cm−1 in PT1 and up to 17 cm−1 in PT2 (although Raman spectra did not go beyond the PT2 point due to the difficulties described in the Experimental section). They are comparable with those obtained for inorganic perchlorates, like e.g. KClO4.26 The band corresponding to νsClO4− (Fig. S6, ESI†) in IR spectra does not change the center of gravity but one can notice that it loses its features as the temperature increases and becomes much broader at the final temperature. This clearly proves the onset of the disorder in the perchlorate tetrahedral, specifically taking into account its libration dynamics so well presented in Fig. 6b, leading to a conclusion that the anions are set free above 470 K.
The thermal changes inside the TePrA+ cations encompass both the modes of CH3 and CH2 moieties as well as skeleton vibrations. This disorder is particularly well represented in Fig. 6 above PT2. In Fig. 6a, we can observe that the central band at ca. 1478 cm−1 (the main one at 280–440 K) rapidly gains intensity above PT1 and then starts to disappear above PT2 making its neighbor at 1486 cm−1 well noticeable again (below 280 K and above 470 K). This band merging suggests further symmetry increase above PT2, roughly >470 K. In the case of deformation modes, the wavenumbers shift by 1–2 cm−1 in PT1 and up to 4 cm−1 in PT2, while their FWHMs increase up to 3/13 cm−1 in PT1/PT2 during heating, respectively. This is similar to the changes observed in other crystals containing amines, such as formamidinium27 or (multiple)methylammonium.28 The band splitting during the temperature decrease imposed by the symmetry change is best observed for deformations ωCH2 during the PT2 transition (Fig. S10a, ESI†). The skeleton vibrations presented here as νCC modes in Fig. S9b (ESI†) are of particular interest as they show greater changes than the methyl(ene) groups. Their wavenumber shifts by 3/7 cm−1 and FWHM – by 1/15 cm−1 (PT1/PT2). This indicates that the motion of TePrA+ ions is not only bound to the rearrangement of protons in the molecules but also to the rotation of the skeleton itself. Taking these facts into account together with the thermal behavior of translations and librations of these cations shown in Fig. 6b and Fig. S10d (ESI†), one can conclude that PT1 is driven equally by the motions of the TePrA+ and ClO4− ions, while in PT2 the motions of the organic cations have bigger impact compared to the inorganic anions. The observations are consistent with DSC conclusions that PT2 bears resemblance to the phase changes found in liquid crystals when going from crystal at RT to isotropic liquid since the band broadening suggests a melt-like phase.
Dielectric properties
The complex impedance spectroscopy measurements were performed to investigate temperature-variable changes in dielectric function. The frequency dependence on the real (ε′) and imaginary (ε′′) parts of complex dielectric permittivity is shown in Fig. 7.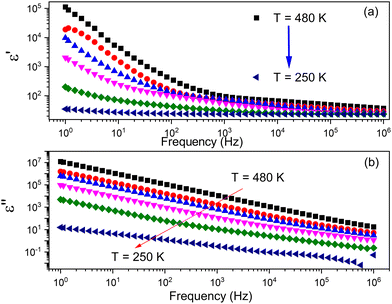 | ||
| Fig. 7 The frequency dependence on (a) real and (b) imaginary parts of complex permittivity of the TePrAClO4 compound. | ||
The behavior of the dielectric function (Fig. 7a) exhibits a gradual decline with increasing frequency, while at high frequencies, it remains almost constant and increases with increasing temperature at a given frequency. This dielectric dispersion can be explained by polarization processes. As the frequency increases, the ions cannot follow the applied field, and as a result, a rapid polarization occurs. A high value of the dielectric permittivity at low frequency can be contributed to the presence of space charge polarization, which generates a potential barrier, and results in polarization of bound charge, which leads to higher values of the real part of permittivity.30,31 The frequency dependence of the imaginary part of complex permittivity ε′′ at different temperatures is shown in Fig. 7b. The curve shows almost linear behavior at all temperatures over the entire frequency spectra, which makes an evidence of Ohmic behavior in dielectrics.
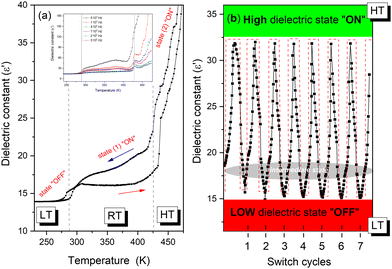
The variation of the real part (ε′) of the dielectric permittivity as a function of temperature at various frequencies performed on a pressed pellet of TePrAClO4 is shown in Fig. 8. At low temperatures, a step-like anomaly at around T1 = 284 K has been found during the heating and cooling process, whose behavior indicates a structural phase transition. The dielectric permittivity remains almost stable below T1, in the LT phase, proving an ordered phase, corresponding to its low-dielectric state. Above 320 K, at RT, ε′ increases along with temperature, indicating a disturbance of thermal fluctuation and polarization. The order of the ε′ value in the LT and HT phases is comparable to the nonpolar analogues that show also slight dielectric changes.3 In addition, to investigate the stability in high- and low-dielectric states, the cycles of reversible dielectric switches have been performed (see Fig. 8b).32,33 It is shown that with a periodic variation of temperature and the passage of time, the value of the dielectric constant during the transition from the HT to LT state remains stable with no decay after several cycles. What is more, during the comparison of the initial dielectric signal between LT and HT phases, no observable weakening during the heating-cooling cycles is reported. This behavior points to switching properties with nearly zero time delay32,33 and some potential applications may arise as time-stable and temperature-sensitive devices.
To investigate the electrical response of the material and relaxation processes of materials, the complex modulus M*(ω) formalism has been analyzed.34 The complex electric modulus was calculated from the complex electric permittivity given by the following relation:
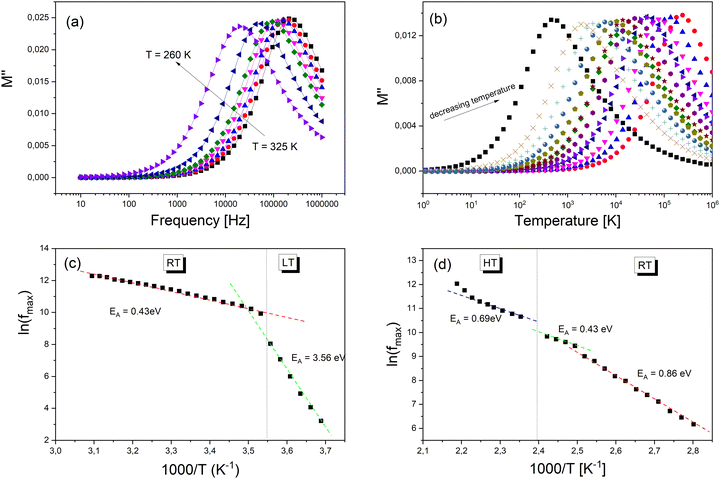
The evaluation of the imaginary part (M′′) of electric modulus as a function of the temperature around PT1 and PT2 transitions is shown in Fig. 9a and b. It is clearly seen that in both cases M′′ exhibits a single relaxation peak shifted to a higher frequency with increasing temperature. This proves that the observed relaxations are temperature-dependent. The variation of the relaxation frequency, which corresponds to the frequency at which the M′′ peak is well defined, is presented in Fig. 9a and b. The observed relation of fmax(1/T) shows a linear behavior and fulfills the Arrhenius law fmax = foe−EA/kt, where fo is the characteristic phonon frequency, EA is the activation energy for relaxation, and k is Boltzmann's constant. Using the best least-square fits, the changes in activation energy of dielectric processes resulting from temperature changes have been exposed (Fig. 9c and d). The PTs apparent in the Raman spectroscopy as well in the DSC scans are confirmed by the change of the curve slope at fmax. The observed relaxation process in Fig. 9c with visible changes of its activation energy after PT1 most probably corresponds to an ordering of molecular moieties, like TePrA+ below 284 K.
Moreover, the variation in the activation energy values in the temperature range between 357 and 476 K visible in Fig. 9d can be explained by the movement in both the cationic and anionic parts. This huge mobility of structure elements in the HT phase is in agreement with the specific data heat and structural results. At the same time, the HT phase is stable up to 520 K which is confirmed by thermogravimetric analysis (Fig. S11, ESI†).
Conclusions
The crystals of the TePrAClO4 compound undergo two reversible phase transitions at ca. T1 = 284 K and at ca. T2 = 445 K with extraordinarily large heat and entropy changes for the latter one. The observed phase transition, dielectric and relaxation effects are due to the dynamic motions of the organic cations and anionic framework. Notably, the dielectric function values can be switched and tuned in the low- and high-dielectric states, which may indicate the potential application of this material in sensors or actuators.By means of single-crystal XRD, we have been able to structurally characterize the disordered Pnam RT phase of TePrAClO4. The propyl chains of the organic part as well as perchlorate ions are disordered over the mirror plane at c = 1/4 and 3/4. The diffraction measurement confirmed that below PT1, the crystal becomes ordered and its structure is described by the P212121 space group, LT phase. To verify the structural changes taking place above PT2, the PXRD experiments were performed. The observed reduction in the number of diffraction peaks above PT2 indicates that the HT structure has higher symmetry. The reason for such a change can be found in the increasing level of disorder inherent to the HT phase with entropy change reaching a quite extreme 130 J mol−1 K−1.
The IR and Raman spectroscopies have proven the order-disorder phase transitions observed using other methods. The main findings are as follows: (i) the persistent absence of the center of symmetry has been deducted from the breaking of the mutual-exclusion rule, (ii) weak intermolecular interactions based on a lesser number of A1 bands than calculated for a perfect factor-group splitting, (iii) comparable changes in the wavenumber and FWHM shifts in the case of TePrA+ and ClO4− ions in PT1 and slightly more significant changes for TePrA+ cations (juxtaposed with ClO4− ions) in PT2 lead to the conclusion that PT1 is equally driven by motions of the two ions, while PT2 is more influenced by the motions of organic cations. The most remarkable changes occur in the range of hindered rotations of both ions proving a high degree of disorder and higher symmetry above PT2. It is suggested that PT2 bears a resemblance to the phase change found in liquid crystals when transforming from the crystal at RT to an isotropic liquid.
Conflicts of interest
There are no conflicts to declare.References
- G. A. Williams, Crystal Structure of Tetraethylammonium Bromopentacarbonyltungstate(0), Aust. J. Chem., 1995, 48, 1045–1048 CrossRef.
- J. Kivikoski, J. A. K. Howard, P. Kelly and D. Parker, Tetraethylammonium Perchlorate at 150 K, Acta Crystallogr., Sect. C: Cryst. Struct. Commun., 1995, 51, 535–536 CrossRef.
- H. Y. Ye, J. Z. Ge, Y. Y. Tang, P. F. Li, Y. Zhang, Y. M. You and R. G. Xiong, Molecular Ferroelectric with Most Equivalent Polarization Directions Induced by the Plastic Phase Transition, J. Am. Chem. Soc., 2016, 138, 13175–13178 CrossRef CAS PubMed.
- M. Szafrański, Simple guanidinium salts revisited: Room-temperature ferroelectricity in hydrogen-bonded supramolecular structures, J. Phys. Chem. B, 2011, 115, 8755–8762 CrossRef PubMed.
- Q. Pan, Z. B. Liu, H. Y. Zhang, W. Y. Zhang, Y. Y. Tang, Y. M. You, P. F. Li, W. Q. Liao, P. P. Shi, R. W. Ma, R. Y. Wei and R. G. Xiong, A Molecular Polycrystalline Ferroelectric with Record-High Phase Transition Temperature, Adv. Mater., 2017, 29, 1–7 Search PubMed.
- Y. L. Sun, C. Shi and W. Zhang, Distinct roomerature dielectric transition in a perchlorate-based organic-inorganic hybrid perovskite, Dalton. Trans., 2017, 46, 16774–16778 RSC.
- P. P. Shi, Q. Ye, Q. Li, H. T. Wang, D. W. Fu, Y. Zhang and R. G. Xiong, Crystal structures, phase transitions, and switchable dielectric behaviors: Comparison of a series of N-heterocyclic ammonium perchlorates, Dalton. Trans., 2015, 44, 8221–8231 RSC.
- Y. L. Sun, X. Bin Han and W. Zhang, Structural Phase Transitions and Dielectric Switching in a Series of Organic-Inorganic Hybrid Perovskites ABX3 (X = ClO4− or BF4−), Chem. – Eur. J., 2017, 23, 11126–11132 CrossRef CAS PubMed.
- Y. Zhang, Y. Liu, H. Y. Ye, D. W. Fu, W. Gao, H. Ma, Z. Liu, Y. Liu, W. Zhang, J. Li, G. L. Yuan and R. G. Xiong, A molecular ferroelectric thin film of imidazolium perchlorate that shows superior electromechanical coupling, Angew. Chem., Int. Ed., 2014, 53, 5064–5068 CrossRef CAS PubMed.
- L. W. Martin and A. M. Rappe, Thin-film ferroelectric materials and their applications, Nat. Rev. Mater., 2016, 2, 16087 CrossRef.
- T. Fujihara, M. Kato and A. Nagasawa, Tetra-n-propylammonium perchlorate, Acta Crystallogr., Sect. E: Struct. Rep. Online, 2005, 61, 1439–1440 CrossRef.
- CrysAlis PRO, Rigaku Oxford Diffraction, 2018.
- CrysAlis RED, Rigaku Oxford Diffraction, 2019.
- G. M. Sheldrick, Crystal structure refinement with SHELXL, Acta Crystallogr., Sect. C: Struct, Chem, 2015, 71, 3–8 Search PubMed.
- O. V. Dolomanov, L. J. Bourhis, R. J. Gildea, J. A. K. Howard and H. Puschmann, OLEX2: A complete structure solution, refinement and analysis program, J. Appl. Crystallogr., 2009, 42, 339–341 CrossRef CAS.
- K. Brandenburg and M. Berndt, Diamond, Crystal Impact GbR, Bonn, Germany, 1997.
- H. Ono, S. Ishimaru, R. Ikeda and H. Ishida, Bull. Chem. Soc. Jpn., 1997, 70, 2963–2972 CrossRef CAS.
- W. E. Acree and J. S. Chickos, Phase change enthalpies and entropies of liquid crystals, J. Phys. Chem. Ref. Data, 2006, 35, 1051–1330 CrossRef CAS.
- Y. Ogawa and K. Ootani, Phase transitions of dimeric liquid crystals containing long odd-numbered methylene spacers, Polym. J., 1999, 31, 51–54 CrossRef CAS.
- T. Ying, Y. Huang, N. Song, Y. Tan, Y. Tang, Z. Sun, J. Zhuang and X. Dong, Dielectric switching from a high temperature plastic phase transition in two organic salts with chiral features, Mater. Adv., 2022, 3, 1581–1586 RSC.
- M. Trzebiatowska-Gusowska and A. Gągor, The order-disorder state of diaminoalkanes in Cu-based metal-organic materials, J. Coord. Chem., 2017, 70, 1536–1547 CrossRef CAS.
- J. G. Contreras, C. A. López and G. V. Seguel, “Vibrational Spectra of Tetrapropylammonium Trichlorozincate(II)”, Spectrosc. Lett., 1985, 18, 71–78 CrossRef CAS.
- E. Szostak and A. Migdał-Mikuli, Thermal analysis, phase transitions and molecular reorientations in [Fe(OS(CH3)2)6](ClO4)2, J. Therm. Anal. Calorim., 2017, 129, 1151–1158 CrossRef CAS.
- D. L. Lewis, E. D. Estes and D. J. Hodgson, The infrared spectra of coordinated perchlorates, J. Cryst. Mol. Struct., 1975, 5, 67–74 CrossRef CAS.
- B. B. Holló, V. M. Petruševski, G. B. Kovács, F. P. Franguelli, A. Farkas, A. Menyhárd, G. Lendvay, I. E. Sajó, L. Nagy-Bereczki, R. P. Pawar, I. M. Szilágyi, E. Bódis and L. Kótai, Thermal and spectroscopic studies on a double-salt-type pyridine-silver perchlorate complex having κ1-O coordinated perchlorate ions, J. Therm. Anal. Calorim., 2019, 138, 1193–1205 CrossRef.
- A. R. Aliev, I. R. Akhmedov, M. G. Kakagasanov and Z. A. Aliev, Pre-Transition Phenomena in the Temperature Range of Structural Phase Transitions in Perchlorate Crystals, Russ. J. Phys. Chem. A, 2020, 94, 1363–1368 CrossRef CAS.
- M. Trzebiatowska, A. Gągor, L. Macalik, P. Peksa and A. Sieradzki, Phase transition in the extreme: a cubic-to-triclinic symmetry change in dielectrically switchable cyanide perovskites, Dalton. Trans., 2019, 48, 15830–15840 RSC.
- M. Trzebiatowska, The spectroscopic study of phase transitions in the series of cyanide perovskites, Spectrochim. Acta, Part A, 2021, 245, 118957 CrossRef CAS PubMed.
- Y. Chen, Y. H. Zhang and L. J. Zhao, ATR-FTIR spectroscopic studies on aqueous LiClO4, NaClO4, and Mg(ClO4)2 solutions, Phys. Chem. Chem. Phys., 2004, 537–542 RSC.
- M. Abdullah Dar, K. Majid, K. M. Batoo and R. K. Kotnala, Dielectric and impedance study of polycrystalline Li0.35-0.5XCd0.3NiXFe2.35-0.5XO4 ferrites synthesized via a citrate-gel auto combustion method, J. Alloys Compd., 2015, 632, 307–320 CrossRef CAS.
- C. G. Koops, On the dispersion of resistivity and dielectric constant of some semiconductors at audiofrequencies, Phys. Rev., 1951, 83, 121–124 CrossRef CAS.
- K. Pasińska, A. Ciupa, A. Pikul, A. Gągor, A. Pietraszko and A. Ciżman, 1D metal-oxalates H2DABCO[M(C2O4)2]·3H2O (M(ii): Co, Mg, Zn): Phase transitions and magnetic, dielectric, and phonon properties, J. Mater. Chem. C, 2020, 8, 6254–6263 RSC.
- A. Cizman, D. Kowalska, M. Trzebiatowska, W. Medycki, M. Krupiński, P. Staniorowski and R. Poprawski, The structure and switchable dielectric properties of a dabco complex with chromium chloride, Dalton. Trans., 2020, 49, 10394–10401 RSC.
- M. Kaiser, Magnetic and electric modulus properties of in substituted Mg-Mn-Cu ferrites, Mater. Res. Bull., 2016, 73, 452–458 CrossRef CAS.
Footnote |
| † Electronic supplementary information (ESI) available. CCDC 2195872. For ESI and crystallographic data in CIF or other electronic format see DOI: https://doi.org/10.1039/d2cp03665g |
| This journal is © the Owner Societies 2023 |

