
 Open Access Article
 This Open Access Article is licensed under a
 Creative Commons Attribution 3.0 Unported Licence
Booster-microchannel plate (BMCP) detector for signal amplification in MALDI-TOF mass spectrometry for ions beyond m/z 50![[thin space (1/6-em)]](https://www.rsc.org/images/entities/h2_char_2009.gif) 000†
000†
Stefanie
Haugg
 *a,
Marina
Creydt
b,
Robert
Zierold
a,
Markus
Fischer
b and
Robert H.
Blick
a
*a,
Marina
Creydt
b,
Robert
Zierold
a,
Markus
Fischer
b and
Robert H.
Blick
a
aCenter for Hybrid Nanostructures (CHyN), Universität Hamburg, 22761 Hamburg, Germany. E-mail: shaugg@chyn.uni-hamburg.de
bHAMBURG SCHOOL OF FOOD SCIENCE – Institute of Food Chemistry, Universität Hamburg, 20146 Hamburg, Germany
First published on 23rd February 2023
Abstract
Top-down proteomics deals with the characterization of intact biomolecules, which reduces the sample complexity and facilitates the detection of modifications at the protein level. The combination of the matrix-assisted laser desorption/ionization (MALDI) technique with time-of-flight (TOF) mass analysis allows for the generation of gaseous ions in low charge states from high-mass biomolecules, followed by their mass-to-charge ratio (m/z) separation, as high-mass ions drift down the flight tube more slowly than lighter ones. However, the detection efficiency of conventional microchannel plate (MCP) detectors is strongly reduced with decreasing ion velocity—corresponding to an increase in ion mass—which impedes the reliable detection of high-mass biomolecules. Herein, we present a simple modification of the MCP detector that allows for the amplification of the signal from ionized proteins of up to m/z 150![[thin space (1/6-em)]](https://www.rsc.org/images/entities/char_2009.gif) 000. Two circular electrodes were assembled in front of the conventional detector and set to negative electrical voltages to affect the positively charged ions directly before they impinge on the MCP, possibly through a combination of a velocity boost and ion optical effects. In the present study, three booster electrode configurations were experimentally tested to maximize the signal intensification. Compared to the conventional MCP assembly, the signal intensity was amplified in a proof-of-concept experiment by a factor of 24.3 and of 10.7 for the singly charged BSA ion (m/z 66400) and for the singly charged IgG ion (m/z 150000), respectively, by applying the booster-MCP (BMCP) detector.
000. Two circular electrodes were assembled in front of the conventional detector and set to negative electrical voltages to affect the positively charged ions directly before they impinge on the MCP, possibly through a combination of a velocity boost and ion optical effects. In the present study, three booster electrode configurations were experimentally tested to maximize the signal intensification. Compared to the conventional MCP assembly, the signal intensity was amplified in a proof-of-concept experiment by a factor of 24.3 and of 10.7 for the singly charged BSA ion (m/z 66400) and for the singly charged IgG ion (m/z 150000), respectively, by applying the booster-MCP (BMCP) detector.
Introduction
Matrix-assisted laser desorption/ionization-time of flight (MALDI-TOF) instruments are widely used for the mass spectrometric analysis of macromolecules, e.g., native proteins, polysaccharides, large RNA and DNA fragments or synthetic polymers as well as complex biological systems such as viruses and bacteria.1 To determine the m/z values of analytes using MALDI-TOF instruments, the sample is mixed with a matrix that absorbs the energy of a pulsed laser beam and transfers it to the analyte molecules. In this way, ions are usually obtained, which are first accelerated and then pass through a flight tube of known length. Signal amplification is carried out with a secondary electron multiplier (SEM), such as a discrete dynode or a microchannel plate (MCP), from which the analyte ions release electrons upon impact. These electrons are multiplied by means of further dynodes or in the individual channels of the MCP unit. With an anode behind the SEM, the electron shower can be detected. Note, MCP detectors are characterized by good time resolution and high sensitivity due to the amplification effect, which can be further improved by using several MCPs in series. Because of these advantages, MCP detectors are usually built into MALDI-TOF instruments.2For the separation of the individual analyte ions differing in mass and charge in the flight tube of MALDI-TOF devices, all ions initially receive the same kinetic energy (Ekin) in the ion source by the acceleration voltage (U) applied between MALDI sample plate and the opposing electrode, before entering the electrical field-free TOF mass analyzer. Based on eqn (1), high-mass ions have a lower velocity (v) than low-mass ions and need more time (t) to pass the distance of the TOF flight tube (d), so that the ions can be separated according to their mass (m) and charge (q), which equals an integer number (z) of electron charges (e). From the determination of the flight time, the respective m/z value of the analyte ions can be calculated.2
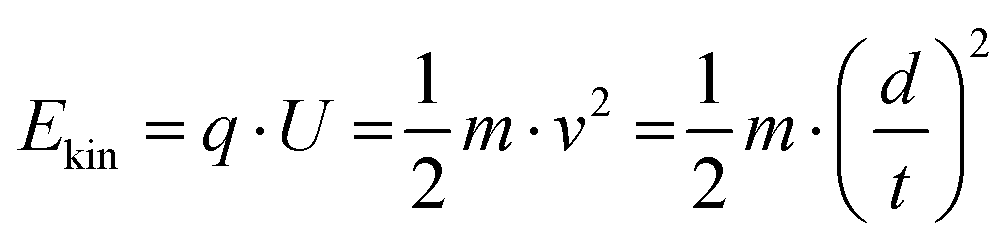 | (1) |
Since the velocity of the ions is inversely proportional to the square root of the ion mass, high-mass molecules exhibit comparatively low velocities. It is known that the probability of secondary electron generation by an ion impact decreases with ion velocity, leading to a significant reduction of the MCP detection efficiency with increasing ion mass. That means that the conversion of ion-to-electron is reduced and more secondary ions are generated instead by the impact of the analyte ion on the MCP. For this reason, the signal intensity decreases considerably for higher mass ions, which leads to major limitations in MALDI-TOF applications.3–7 This effect is further enhanced in complex samples, since small ions that reach the detector first can also lead to oversaturation of the individual MCP channels.8,9
In order to reduce these disadvantages, various strategies and alternative detection methods have been developed over the past 20 years. These approaches include cryogenic detectors operated at temperatures <3 K. Particularly noteworthy are cryogenic detectors with superconducting tunnel junctions, which offer a mass-independent detection with nearly 100% efficiency. However, these designs failed to gain acceptance in routine applications due to the complex and expensive cooling system and because of their small active detector area. Therefore, the production of the only commercially available device in this context (Macromizer from Comet AG launched in 2002) was discontinued.10–12
MCPs are more economically to operate and offer certain characteristics, such as rapid response times, narrow pulse widths, high gain, and a sufficiently large active size, which make them ideal detectors for TOF mass spectrometers.7,13 For this reason, several other approaches to extend the accessible mass range are based on the modification of the conventional MCP detector. On the one hand, the detection mechanism for the electron signal emerging from the backside of the MCP was altered. For example, hybrid designs with photon-dependent components were invented, such as the “high-mass bipolar detector” from Photonis, which enables the detection of ions beyond m/z 100000. In this detector, a scintillator is installed behind the MCP unit which generates a flash of light from the electron shower produced by the MCP upon ion impact. The flash of light, in turn, is amplified by means of a photomultiplier generating a high electrical current output pulse.14,15 Further possibilities for the analysis of higher mass ions arise from the implementation of a pixel detector behind the MCP unit instead of a classical analog-to-digital converter to increase the efficiency of collecting electrons generated by the MCP and thus, increase the signal intensities of high-mass molecules.16
On the other hand, methods were employed to convert the slow moving, high-mass ions into electrons or into smaller secondary ions before impinging on the MCP frontside. For example, the installation of a nanomembrane to which an electric field is applied via a grid, in front of the MCP unit enable the detection of ions up to about m/z 106.17 The principle of this construction is based on the conversion of the kinetic energy of the analyte ions into thermal energy, which in turn leads to mechanical vibrations of the membrane and to phonon-assisted field emission of electrons. The resulting variations of the electron current, which is emitted from the nanomembrane by field emission and subsequently amplified by the MCP unit, are used to sense the arrival of incoming analyte ions.17–22 In addition, the implementation of independent conversion dynodes in front of the actual MCP proved to be particularly suitable. The analyte ions hit the conversion dynode, resulting in the generation of smaller secondary ions. Subsequently, the secondary ions are post-accelerated to high velocities before reaching the MCP by a large electrical potential difference. Since the MCP detection efficiency for ions with higher velocities increases, this detector configuration exhibits an enhanced sensitivity to high-mass analyte ions.2,12,13,23 The commercially available detectors from CovalX are based on this principle, and the developers were able to analyze proteins up to about m/z 106.24
In general, the signal intensity from an MCP detector is improved by enhancing the velocity of the arriving charged particles, which is achieved by their acceleration in a large electrical potential. Typically, the ions are accelerated in the ion source of commercial mass spectrometers by voltages of up to 30 kV. Often, a combination of several electrode configurations can be found in order to allow for additional spatial focusing of the ion beam.11,15,25–27 However, higher acceleration voltages in the ion source would risk electrical discharges and would lead to shorter flight times, which in turn require very fast and expensive measurement equipment to achieve sufficient mass resolution.27
In the present study, an additional electrical potential was supplied to the ions immediately before they reached the MCP detector instead of increasing the acceleration voltage in the ion source. We present a simple modification of the conventional MCP detector: two circular electrodes were placed in front of the MCP and set to negative voltages (up to −4 kV) to affect the approaching positive ions that emerge from the TOF mass analyzer, which showed to improve the signal intensity generated by the MCPs. The configuration that gave the strongest signal enhancement was determined experimentally by varying the voltages applied to the two booster electrodes and changing the distance between them. The results of this study may pave the way for increasing the sensitivity of the MCP-based detector unit for high-mass molecules and provide the basis for alternative detector designs.
Experimental methods
Chemicals
The standard proteins bovine serum albumin (BSA, ≥98%, molecular weight 66400 u) and immunoglobulin G from human serum (IgG, ≥95%, molecular weight 150000 u) were purchased from Sigma-Aldrich (Saint Louis, MO, USA). Acetone, acetonitrile, acetonitrile with 0.1% trifluoroacetic acid (TFA) and water with 0.1% TFA (all LC-MS grade) were obtained from Merck (Darmstadt, Germany). Both MALDI matrices α-cyano-4-hydroxycinnamic acid (α-CHCA) and 2,5-dihydroxybenzoic acid (DHB) were received from Bruker Daltonics (Bremen, Germany). Formic acid (≥99%, LC-MS grade) was acquired from VWR Chemicals (Darmstadt, Germany). Water was purified using an on-site purification system Milli-Q Integral 5 (Merck Millipore, Darmstadt, Germany).
Sample preparation
Initially, various protocols were evaluated for MALDI sample preparation, all of which used manual pipetting for the matrix deposition on the target plate. The best result was achieved with a thin layer method based on a procedure by Signor and Erba,28 which has been slightly modified. First, the two proteins BSA and IgG were dissolved in 0.1% TFA in water and adjusted to a concentration of 3.0 μmoL L−1 and of 1.3 μmoL L−1, respectively. For the MALDI matrix, 7.0 mg of α-CHCA were added to 100 μL of acetone to prepare a saturated solution. Using a 10 μL pipette tip, which was briefly wetted with this solution, a thin layer was applied to the MALDI target (ground steel) and allowed to dry. Furthermore, 20 mg α-CHCA were dissolved in 1 mL of a mixture of acetonitrile and 5% formic acid in water (70:30, v/v). Also, 20 mg DHB was taken up in 1 mL of a mixture of acetonitrile and 0.1% TFA in water (70:30, v/v). These two solutions were mixed in a ratio of 1:1 (v/v). Subsequently, either 2 μL of the BSA or 2 μL of the IgG protein solution were briefly mixed with 2 μL of the solution of α-CHCA and DHB. From this obtained new solution, 0.5 μL was added to the thin layer of α-CHCA. The spots were left to dry in ambient conditions and were then measured directly.
MALDI-TOF instrument
The measurements were carried out on a modified ultrafleXtreme MALDI TOF/TOF system (Bruker Daltonics, Bremen, Germany) in linear positive ion mode. The instrument is equipped with a smartbeam 2 laser. The control of the MALDI source took place via the software flexControl (Bruker Daltonics). The used method was optimized for the measurement of m/z values in the range of 30000 to 210000 with the discrete dynode detector of the mass spectrometer and was provided by the manufacturer of the instrument (U = 25 kV acceleration voltage, 460 ns pulsed ion extraction). The measurements were performed in the positive polarity mode and 100 laser shots at a frequency of 20 Hz were averaged to obtain one mass spectrum. The detector side of the mass spectrometer was modified by removing the discrete dynode detector and replacing it with the BMCP detector. A load lock chamber was installed for convenient exchange of the detectors. Calibration measurements with the conventional MCP detector revealed an adjusted flight path length of about d = 2.21 m.
BMCP operation
The BMCP detector consisted of the following main components: two circular booster electrodes (BEs) separated by polytetrafluoroethylene (PTFE) plates for electrical insulation, two microchannel plates assembled in Chevron configuration (F1552-01, Hamamatsu Photonics, Hamamatsu City, Japan) and a metal anode (Fig. 1). The assembly was fixed by polyetheretherketone (PEEK) screws and nuts, and was sitting on a PTFE pedestal for electrical insulation from the vacuum flange underneath. Each initial measurement was performed at least 24 h after mounting the BMCP detector in high vacuum (below 2 × 10⁻⁵ Pa) to allow for proper degassing and thus, to lower the risk for electrical discharge in the MCPs as recommended by the manufacturer.29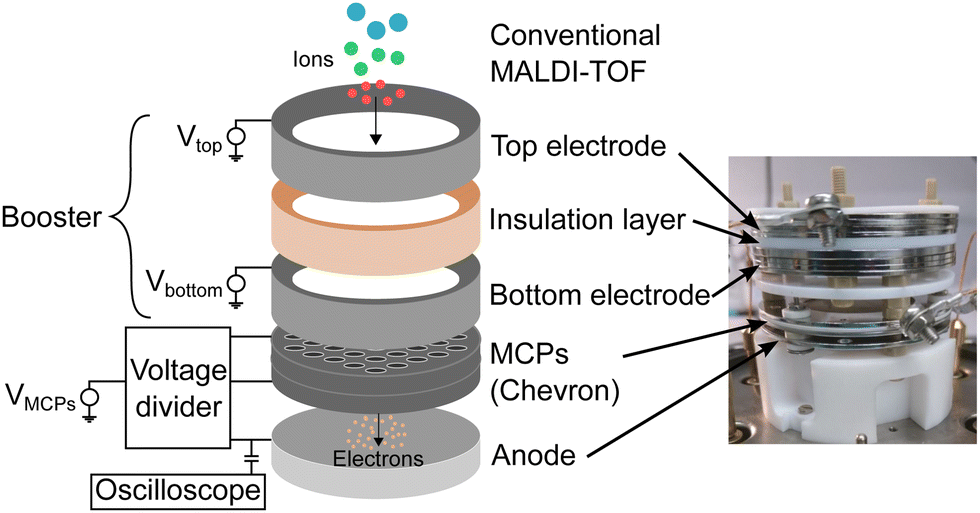 | ||
| Fig. 1 Components and function of the BMCP detector. The booster consists of two circular electrodes (top and bottom) separated by an insulation layer. The ions are affected by the voltages applied to the booster electrodes before impinging on the conventional MCP detector, which causes a signal amplification. | ||
To supply the electrical voltages to the individual components of the BMCP detector, three external high voltage power supplies were used (PS350, Stanford Research Systems, Sunnyvale, CA, USA). Separate power supplies were used to apply negative voltages to each of the two BEs (up to −4 kV). The third device was coupled to a voltage divider circuit to set the input of the first MCP to ground, the second MCP to about +1.8 kV and the anode to +2 kV according to the recommendations by the manufacturer for positive ion detection.29 A capacitor was assembled between the anode and an external oscilloscope (DSO9254A, Keysight Technologies, Santa Rosa, CA, USA) to suppress any DC current noise and to acquire only the AC signal produced by impinging ions. The oscilloscope input was set to 1 MΩ for impedance matching between the oscilloscope and the rest of the circuit to provide a better signal response.18 The external oscilloscope was used to record the signal amplitude in volts as a function of the flight time and the trigger signal from the mass spectrometer was sent to one channel of the oscilloscope to mark the zero-flight time. Then, the signal was acquired for 500 μs (500 MSa s−1 sample rate, 250 kSa sample size). To obtain a single mass spectrum, the signal generated by 100 laser shots was averaged using the averaging function of the oscilloscope. Note, the voltages applied to the MCP-anode assembly were held constant, but the voltages provided to the two BEs were varied independently between zero and −4 kV to maximize the signal intensity generated by arriving ions.
Data processing
Before further evaluation of the measured data, the flight time was converted to the m/z value using eqn (2) with the acceleration voltage of U = 25 kV, the determined flight path length of d = 2.21 m, the electron charge e = 1.602 × 10⁻¹⁹ C and the atomic mass unit u = 1.661 × 10⁻²⁷ kg.2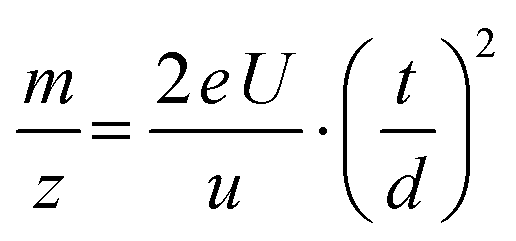 | (2) |
Subsequently, the baseline of the mass spectrum was corrected using the function “msbackadj” from MATLAB (MathWorks, Natick, MA, USA). Then, the intensities of the peaks in the mass spectrum were extracted using the function “mspeaks” for determination of the signal enhancement caused by the different voltage- and distance-configurations tested for the BMCP detector in comparison to the conventional MCP assembly.
Results and discussion
Configuration of the BMCP detector
The present study deals with influencing the analyte ions after they emerge from the TOF tube and shortly before they hit the MCP surface by adding two circular electrodes separated by an insulating layer to the detector as shown in Fig. 1. On the left side, a schematic image presents the individual detector components. Initially, the positive ions are exposed to the negative voltages applied to the top as well as to the bottom BEs. Subsequently, ions leaving the booster part are converted to secondary electrons when hitting the MCP surface. A larger signal intensity is expected to be generated by the same ion when measured with the BMCP instead of with the conventional MCP detector because of a possible gain in ion velocity in combination with ion optical effects caused by the electrical booster potential. Finally, the secondary electron signal is amplified by the MCPs in Chevron configuration and the electron shower that accumulates at the anode is measured with the external oscilloscope. On the right side, a photograph shows a side view of the BMCP assembly as it was used for the measurements.Besides the different voltages applied independently to the two BEs (between zero and −4 kV in 1 kV steps), the distance defined by the PTFE spacer between the BEs was changed. Three distance variants were experimentally tested to determine the configuration that yields the largest signal intensification: a large (6 mm thick insulation layer), a medium (2 mm, shown in Fig. 1), and zero spacing. Note, despite the booster extension, the ions still have direct access to the MCP surface. Thus, measurements with the conventional MCP method are possible without demounting the BMCP detector by setting zero voltage to the BEs, which corresponds to the booster being turned off.
Booster amplification factor for BSA
The intensity variations of the signal generated by singly (BSA1+, at about m/z 66400) and by doubly (BSA2+, at about m/z 33200) charged BSA ions were investigated in dependence on the change of the BE voltages for the three BMCP distance configurations (large, medium and zero spacing). Five mass spectra were obtained for each voltage combination. Mean intensity values and the standard deviations were derived from the five mass spectra per voltage combination for the singly and doubly charged BSA ions in order to account for the changes in signal intensity that are typically related to local deviations of the MALDI sample quality (“sweet spots”).28,30,31 To allow for the direct comparison of the acquired mass spectra, amplification factors (AFs) were determined by normalizing the peak intensities measured with the BMCP to the value that was obtained with the BEs turned off, namely with the conventional MCP detector. Note, the errors of the AFs were derived by Gaussian error propagation using the standard deviations of the peak intensities for calculation.
The results for the measurement of BSA with the three different BMCP detector configurations are summarized in Fig. 2. The AFs found for the large electrode separation are shown in Fig. 2(a), for the medium one in Fig. 2(b) and for the measurements with zero electrode spacing in Fig. 2(c). The AFs for the doubly charged and singly charged BSA ions are presented in the top and bottom row of the image, respectively. For the large and the medium electrode separation, all combinations of electrode voltages between zero and −4 kV were tested in 1 kV steps. Note, for the booster configuration with zero electrode separation—resulting in a single electrode—only one high voltage power supply was used to apply the voltages between zero and −4 kV in 1 kV steps.
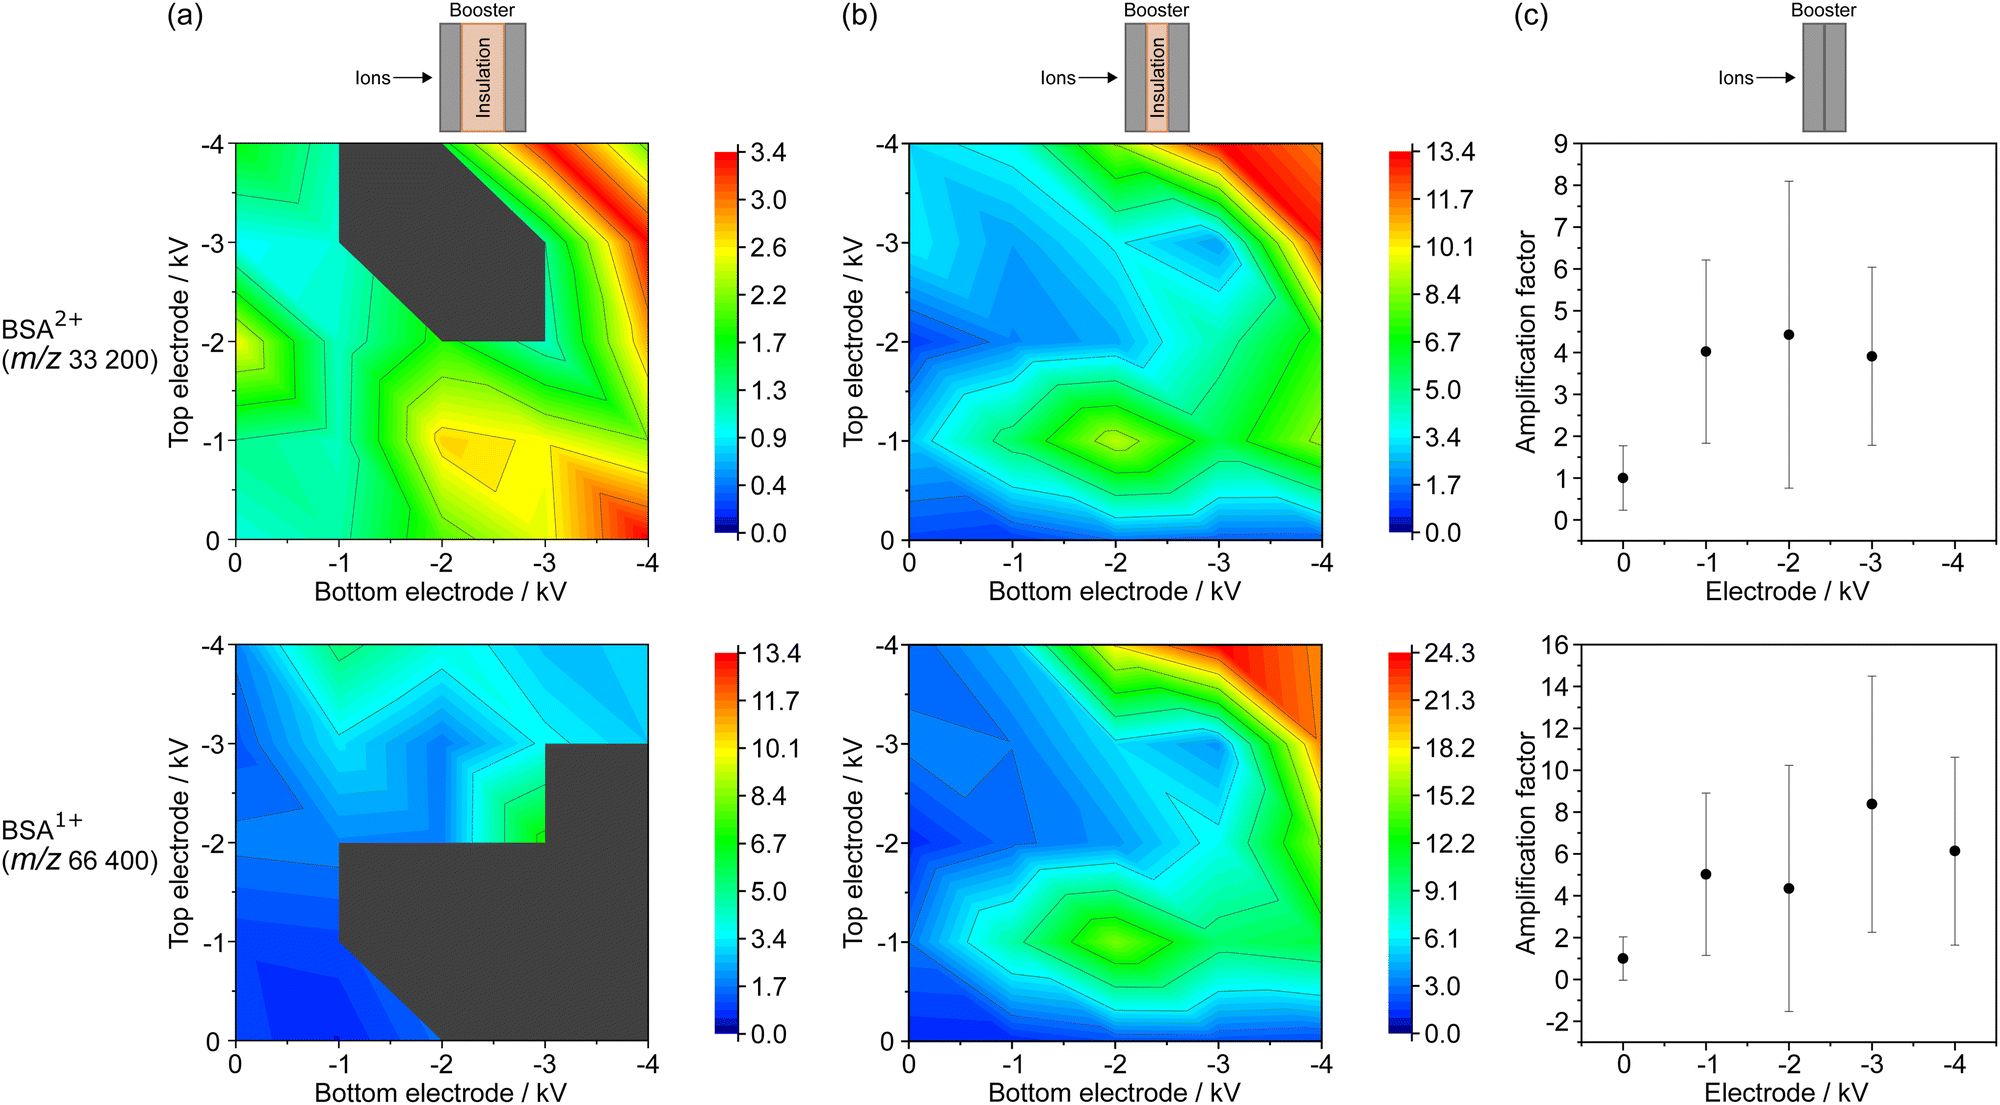 | ||
| Fig. 2 Signal amplification of singly and doubly charged BSA ions for three booster electrode configurations. The separation between the top and the bottom electrode, provided by an insulation layer, was changed from (a) a large distance, to (b) a medium distance, and finally, (c) to zero distance between the two electrodes. The strongest amplification was noticed for the medium electrode spacing. Note, the peak intensities found for BSA2+ and BSA1+ were normalized to the measurements with the booster voltages turned off to extract the signal amplification. The dark gray spaces indicate the absence of a detectable signal. Further, please note the different amplitudes in the color-coded 3D plots. | ||
In the following, the results for the doubly charged BSA ion will first be compared for the different electrode distances. Subsequently, the AFs derived for the singly charged BSA ion will be contemplated. For the large BE distance (Fig. 2(a)), a maximum AF of 3.4 ± 1.0 was found for −3 kV at the bottom and −4 kV at the top BE, and also for the reverse voltage combination. A reduced AF of 2.0 ± 0.7 was obtained for −4 kV at both electrodes. The largest AF of 13.4 ± 7.4 for BSA2+ was found for the medium electrode distance with −3 kV at the bottom and −4 kV at the top BE (Fig. 2(b)). Similar to the results for the large electrode separation, a comparable AF was derived for the reverse voltage combination and a slightly lower AF was found when the same voltage of −4 kV was applied to both BEs. Furthermore, a local maximum of 9.1 ± 5.3 was noticed for −2 kV at the bottom and −1 kV at the top BE. For zero electrode distance, the AF varied between 3.9 ± 2.1 and 4.4 ± 3.7 with changing booster voltage. Note, the signal intensity for −4 kV was not sufficient to derive a value for the AF.
Similar observations as for the doubly charged BSA ion were made for the singly charged BSA ion as shown in the bottom row of Fig. 2. Again, the largest AF of 24.3 ± 8.9 was obtained for the medium electrode spacing (Fig. 2(b)) for a combination of −3 kV at the bottom and −4 kV at the top BEs. Slightly lower AFs were found for the reverse voltage combination and for −4 kV applied to both BEs. Additionally, a local maximum was also discovered at the voltage combination of −2 kV and −1 kV at the bottom and the top electrode, respectively, yielding an AF of 15.0 ± 8.6. Significantly lower AF values were observed for the large electrode separation (Fig. 2(a)) as well as for zero electrode separation (Fig. 2(c)). The largest AF of 13.4 ± 14.7 obtained for the large electrode spacing with −3 kV at the bottom electrode and the top electrode turned off, may possibly be treated as an outlier.
In general, a larger signal amplification was achieved with a higher negative voltage applied to the BEs, independently of the used detector configuration. It is assumed that the observed behavior was generated by an increased acceleration of the positively charged ions with rising negative booster voltage, by ion optical effects, or by a combination of both effects. On the one hand, a higher negative voltage will likely cause a stronger acceleration of the positively charged ions before they hit the MCP surface. Thus, the AF enhancement may be related to the well-known increase of the MCP detection efficiency with rising ion velocity.3,7 The strongest signal intensification for singly and doubly charged BSA ions was observed for the medium electrode separation (Fig. 2(b)). On the other hand, we could identify two well-known—but opposite—ion optical mechanisms that could have led to the observed signal amplification: first, the used electrode configuration may cause—aside from the intended ion acceleration—a certain spatial focusing of the ion beam, as it was noticed for other electrode configurations beforehand.11,15,26,32 Second, the negative electrode booster potential may lead to an ion beam divergency. Thus, the positively charged ion cloud would cover a larger area of the active MCP surface, which may be favorable with regard to the relatively long dead time (millisecond range) of the single channels.33–35 Note, only one of these two opposing ion optical effects may have contributed to the observed increase in signal intensity.
Compared to the findings for the medium spacing, the AFs were reduced for the large electrode separation. In this configuration, the BEs may be too far apart from each other to efficiently accelerate and focus the ions. Possibly, the positively charged ions are attracted by and consequently hit the negative BEs instead of reaching the MCPs because of the extended flight path through the booster. Thus, less ions would have reached the MCP surface for the large electrode distance, which may have led to the observed reduction in signal intensity compared to the medium electrode separation. The AFs found for zero electrode separation are in general larger than the values observed for the large electrode spacing. However, the signal amplification is significantly smaller than for the medium electrode configuration. Thus, it is expected that the single BE (zero electrode spacing) causes a velocity enhancement for the ions, but may not have a distinct influence on the spatial distribution of the ion beam. Typically, assemblies that are designed for ion beam focusing consist of several electrostatic lenses, like the three-element einzel lens, which is a combination of tubular acceleration lenses with opposite polarity.11,26,36,37
Note, the strongest signal amplification was not observed for the highest voltage (−4 kV) applied to both booster electrodes simultaneously, but at a booster voltage combination of −3 kV/−4 kV (bottom/top BE). It is possible that this voltage combination creates an electric field gradient that has an effect on the spatial extent of the ion beam and appears to lead to enhanced detection efficiency at the MCPs. Additionally, local maxima were detected at voltages below −4 kV for the large as well as for the medium electrode separation. Accordingly, the maximum voltages at the BEs are not necessary to achieve a significant signal amplification by the BMCP detector. Moreover, a shift of the local maximum was observed for the AF measured for singly and for doubly charged BSA ions when the detector configuration was changed from medium to large electrode separation. This observation may indicate an effect of the length of the insulating layer between the two BEs on the ion beam focusing properties of the booster.
Booster amplification factor for IgG
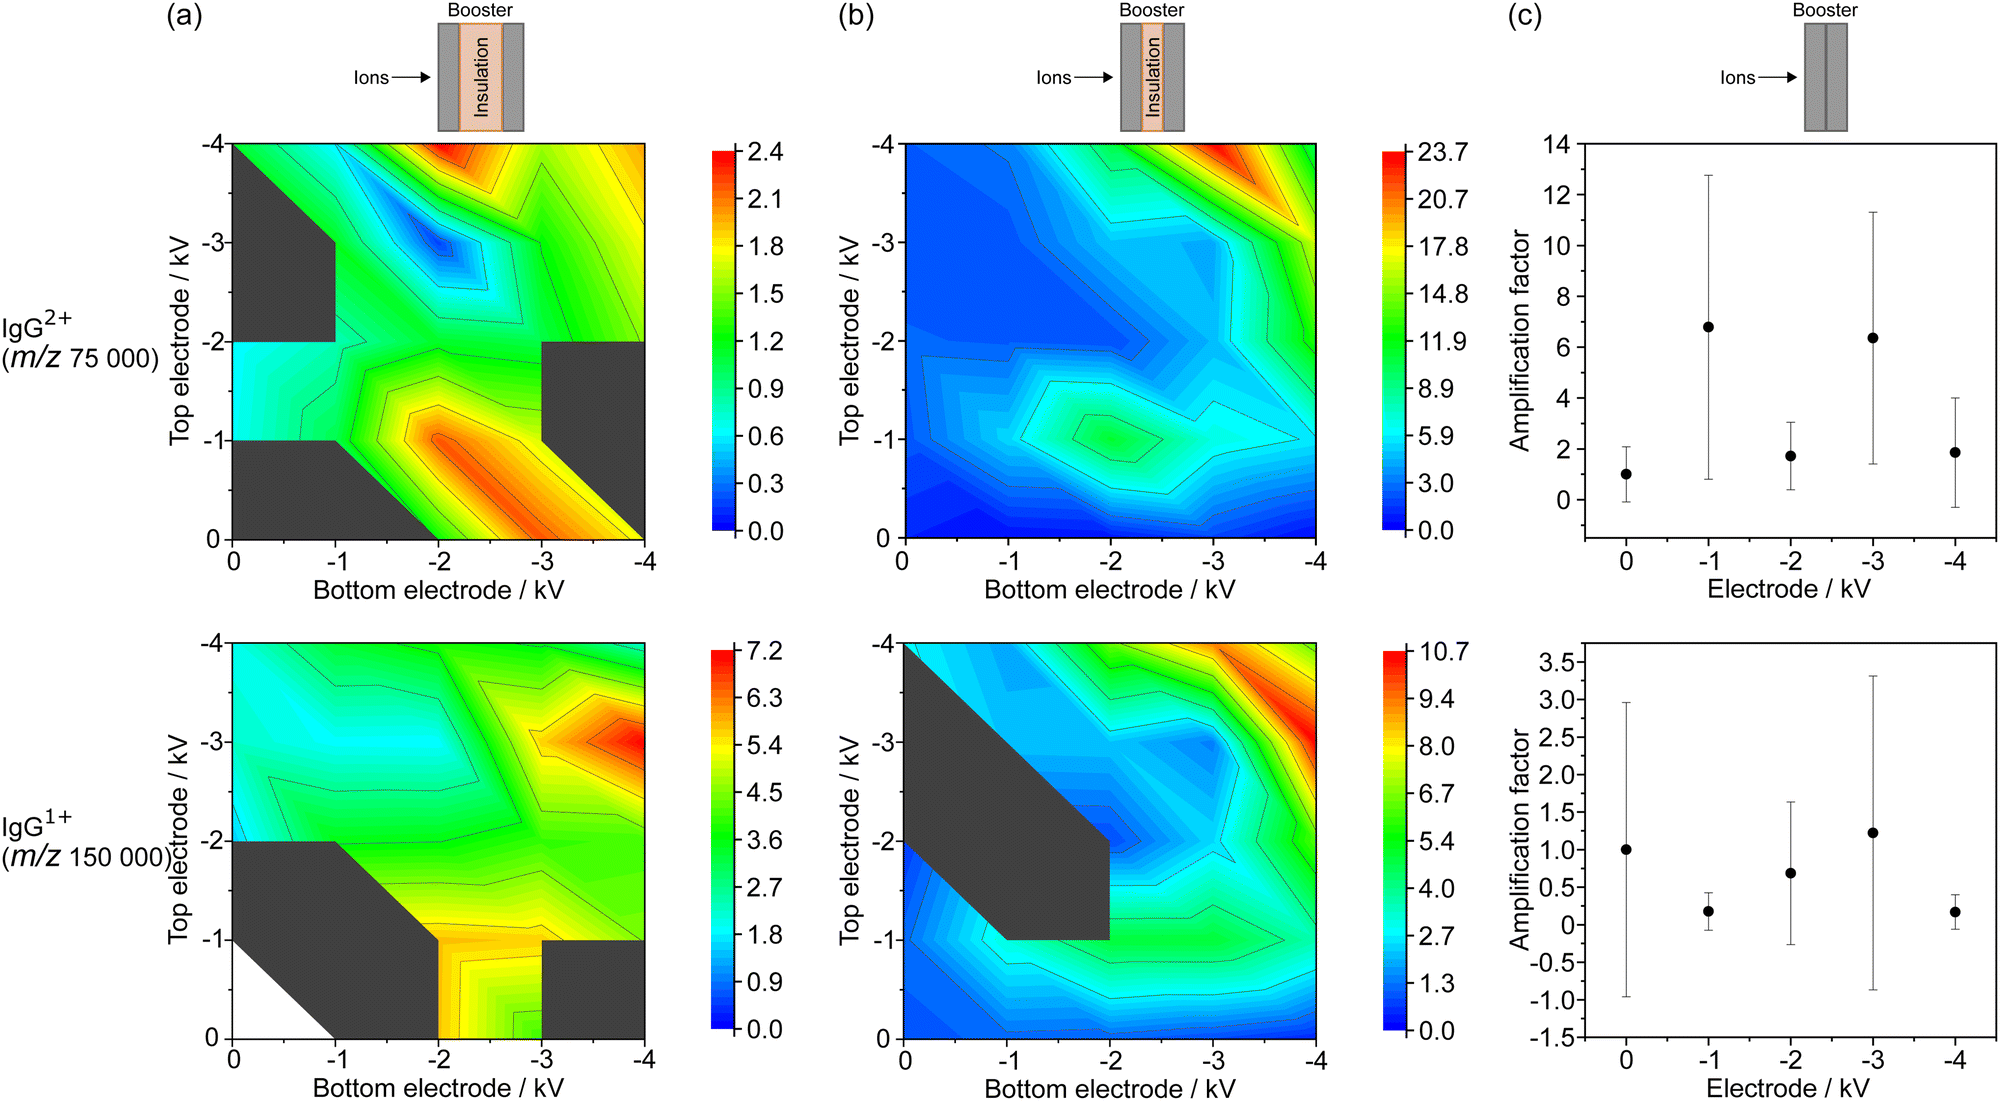
The AFs for IgG were derived from the measurements with the BMCP in the three different configurations, as previously explained for BSA. The results for the doubly (IgG2+, at about m/z 75000) and for the singly (IgG1+, at about m/z 150000) charged IgG ions are summarized in the top and in the bottom row of Fig. 3, respectively. The AFs are given in Fig. 3(a) for the large electrode distance, in Fig. 3(b) for the medium one, and in Fig. 3(c) for zero electrode separation.
 | ||
| Fig. 3 Signal amplification of singly and doubly charged IgG ions for three booster electrode configurations. The separation between the top and the bottom electrode, provided by an insulation layer, was changed from (a) a large distance, to (b) a medium distance, and finally, (c) to zero distance between the two electrodes. The strongest amplification was again noticed for the medium electrode spacing. Note, the peak intensities found for IgG2+ and IgG1+ were normalized to the measurements with the booster voltages turned off to extract the signal amplification, and the gray spaces indicate the absence of a detectable signal. However, the peak intensities measured with the large electrode distance for IgG1+ were normalized to the signal for −1 kV at the bottom and zero voltage at the top electrode, since no sufficient peak intensity was detected for both electrode voltages turned off. | ||
First, the results for the doubly charged IgG ion and second, the observations for the singly charged IgG ion are discussed in the following. For the large electrode separation (Fig. 3(a)), the largest AF of 2.4 ± 2.0 for IgG2+ was found for a bottom/top BE voltage combination of −2 kV/−4 kV. However, the AFs found for −4 kV at both electrodes as well as for both variants of −3 kV/−4 kV, vary within this standard deviation of the AF for −2 kV/−4 kV. For the medium electrode separation (Fig. 3(b)), a much larger AF of 23.6 ± 14.6 was found for −3 kV/−4 kV at the bottom/top BEs. Slightly lower AF values were obtained for the reverse voltage combination, and for −4 kV applied to both BEs. Additionally, a local maximum of 11.1 ± 6.6 was measured for −2 kV/−1 kV at bottom/top BEs. For zero electrode separation (Fig. 3(c)), large variations of the AF between 1.7 ± 1.3 and 6.8 ± 6.0 were noticed for IgG2+.
For the singly charged IgG ion, a maximum AF of 7.2 ± 0.2 was observed at −4 kV at the bottom and −3 kV at the top BE using the large electrode separation, shown in the bottom row of Fig. 3(a). The AF was found to be smaller for the reverse voltage combination and for −4 kV at both BEs. A local maximum of 5.8 was found for −2 kV/−1 kV at the bottom/top BEs. Since the intensity of the signal measured with the booster turned off was not sufficient to be detected and thus to calculate an AF, the peak intensities were normalized to the value found for −1 kV at the bottom electrode and zero volts at the top electrode.
For the medium electrode configuration (Fig. 3(b)), a maximum AF of 10.7 ± 5.2 was found for −4 kV/−3 kV at the bottom/top BEs. For the other BE voltage combinations, comparable trends were observed as for the previously described results of IgG2+ measured with medium electrode distance. For zero electrode separation (Fig. 3(c)), no reliable signal amplification was observed as the AFs vary between 0.2 ± 0.2 and 1.2 ± 2.1.
Similar to the observations for BSA (Fig. (2)), the AFs generally increase with rising applied voltage at the BEs, which could be related to the enhancement in MCP detection efficiency with rising ion velocity and ion focusing effects. Additionally, the medium electrode separation also yielded for IgG the strongest signal intensification compared to the two other BE configurations.
The AF decreased only slightly from BSA1+ at about m/z 66400 to IgG2+ at about m/z 75000, namely from 24.3 to 23.7. However, a significantly lower AF of 10.7 was found for IgG1+ that appears at a much larger m/z of about 150000. This decrease in AF with increasing m/z value is an expected behavior, since the acceleration voltages at the BEs are the same for all approaching ions. Thus, the higher mass ions are still slower than the lighter ones when impinging on the MCP surface, which causes the mass-dependent detection efficiency of the MCPs. Note that the largest AF of the doubly charged IgG ion (at about m/z 75000) was found for a combination of −3 kV at the bottom and −4 kV at the top BE, which is similar to the observations made for the doubly charged BSA ion (at about m/z 33200) and for the singly charged BSA ion (at about m/z 66400). However, the strongest amplification for the singly charged IgG ion (at about m/z 150000) was obtained for the reverse BE voltage combination of −4 kV/−3 kV (bottom/top BE). It is known that the expansion of the ion cloud in vacuum is assumed to increase with ion mass in the TOF mass analyzer, leading to a loss of control over the ions’ spatial distribution for higher mass ions.38 Hence, the effect of the electrical booster potential on the spatial extension of the ions is probably mass dependent, as ion clouds with different masses may approach the booster with different degrees of lateral expansion. Furthermore, the local maxima for the medium electrode separation were observed with −2 kV at the bottom and −1 kV at the top BE for BSA2+, BSA1+, as well as for IgG2+. Only for the singly charged IgG ion, another local maximum was observed at a voltage combination of −3 kV/−1 kV at the bottom/top BEs, which may be related to a mass-dependent ion beam expansion.
Optimized BMCP configuration
From the three tested electrode configurations, the medium BE spacing yielded the largest amplification for the signal generated by the boosted ions upon impact on the MCP surface. This configuration seems to cause an efficient ion acceleration, and possibly also a convenient focusing of the ion beam, which results in an enhanced signal intensity compared to the conventional MCP detector. Since the detection mechanism relies on the conversion of analyte ions into secondary electrons using MCPs, the velocity of the ions is still determining the detection efficiency.5–7 Thus, it is expected that the AF reduces with increasing ion mass, since the higher mass ions will still be slower than the lighter ones, as all ions experience the same electrical potential when traversing through the BEs.The direct comparison of the mass spectra obtained with the conventional MCPs (Fig. 4, plotted in black) and with the BMCP having a medium electrode spacing (plotted in color) shows the strong signal enhancement achieved in this study. Selected mass spectra taken for intermediate BE settings are shown in Fig. S1 for BSA and in Fig. S2 for IgG in the ESI† to visualize the variation of the signal intensity with applied voltages. As discussed in the previous two sections, the detected signal was enhanced the most for −3 kV at the bottom and −4 kV at the top BE for BSA (Fig. 4(a), plotted in green), and for the reverse voltage combination for IgG (Fig. 4(b), plotted in blue). Furthermore, a local maximum of the AF was observed for both proteins with the combination of −2 kV at the bottom and −1 kV at the top BE (Fig. S1(a) and S2(a), ESI† plotted in orange). However, using the same voltage at both BEs did not cause the strongest signal enhancement, as shown exemplarily for −3 kV (Fig. S1(b) and S2(b), ESI† plotted in purple) and for −4 kV (Fig. S1(c) and S2(c), ESI† plotted in cyan).
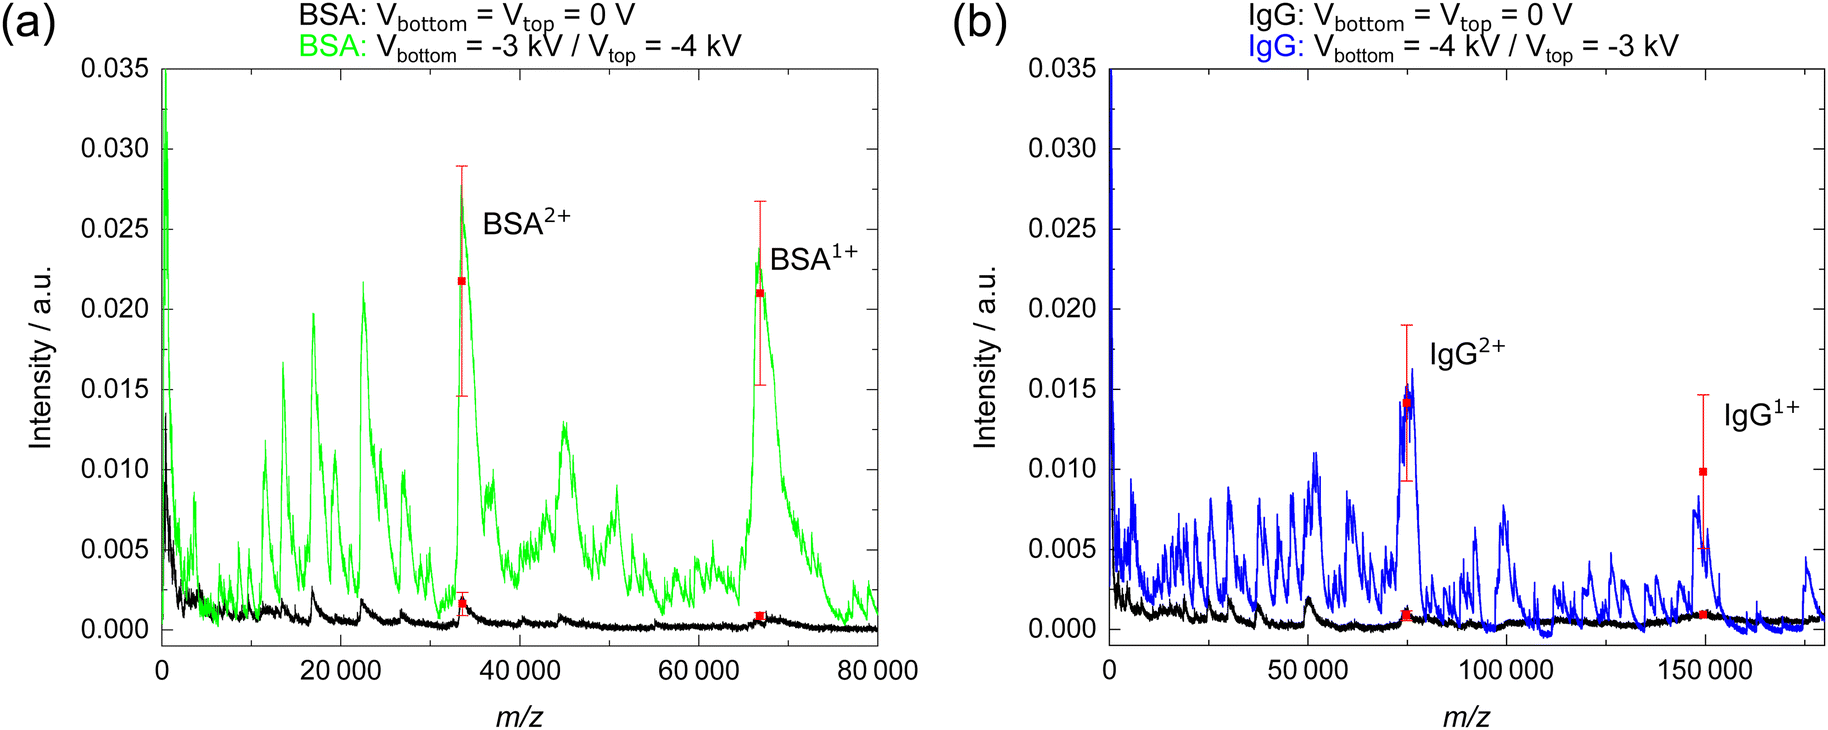 | ||
| Fig. 4 Comparison of single mass spectra measured with the booster turned off (plotted in black) and with the booster electrodes (medium electrode distance) set to the voltages that yielded the largest signal amplification. (a) The signal (green) that appeared for BSA2+ and for BSA1+ was amplified by a factor of 15.5 and of 27.0, respectively, for −3 kV at the bottom and −4 kV at the top electrode. (b) The signal (blue) that appeared for IgG2+ and for IgG1+ was amplified by a factor of 14.3 and of 9.2, respectively, for −4 kV at the bottom and −3 kV at the top electrode. Note, the red squares indicate the mean peak intensities that occurred for the singly and doubly charged ions derived from five individual mass spectra that were measured for the same voltage combination and the error bars show the standard deviations. | ||
In the following, the discussion will focus on the mass spectra obtained for the booster settings that yielded the largest signal amplification for BSA and IgG in comparison to the results for the booster part turned off. The signal for the doubly and singly charged BSA ion (Fig. 4(a)) was amplified by a factor of 15.5 and of 27.0, respectively, when detected with the BMCP (plotted in green) instead of with the conventional MCP (plotted in black). Here, a single spectrum is shown for the voltage combination of −3 kV at the bottom and −4 kV at the top BE, which yielded the largest AFs for BSA. Additionally, the mean peak intensity and the corresponding standard deviation are shown for BSA2+ and for BSA1+ (plotted in red) to indicate the variation among the five mass spectra obtained for this voltage combination. For the doubly charged BSA ion, the mean intensity rose from 0.0016 ± 0.0007 to 0.0218 ± 0.0072, and for the singly charged BSA ion, the intensity increased from 0.0009 ± 0.0002 to 0.0210 ± 0.0057 when using the BMCP. Thus, the absolute change in signal intensity for successively measured mass spectra was found to increase with the AF values and therefore, with the BE voltages. Moreover, the full width at half maximum (FWHM) was derived for the peaks attributed to the singly and to the doubly charged BSA ions in Fig. 4(a) as a measure for the change of mass resolving power when using the BMCP instead of the MCP detector. The FWHM increased from 1300 u to 1900 u for the signal at m/z 33 200 (BSA2+), and decreased from 4300 u to 2900 u for the signal at m/z 66 400 (BSA1+) when the BMCP instead of the conventional MCP detector was used.
A direct comparison of the mass resolving power between the standard detector from Bruker and the MCP/BMCP detector is currently not yet possible, since the ultrafleXtreme MALDI TOF/TOF system offers a superior digitizer that allows for the measurement of a mass spectrum by averaging the signal generated by 500 single laser shots using a frequency of 2000 Hz. In contrast, we could only use a frequency of 20 Hz for firing the laser, which we used to average the signal produced by 100 single laser shots. Possibly, modifications of the BMCP detector measurement, such as the upgrade of the data acquisition system, could allow for a direct comparison of the two systems in the future.
Fig. 4(b) compares a single mass spectrum of IgG measured with the conventional MCP (plotted in black) to one that was acquired with the BMCP detector (plotted in blue). For the shown mass spectra, AF values of 14.3 for IgG2+ and of 9.2 for IgG1+ were found with −4 kV at the bottom and −3 kV at the top BEs. The mean signal intensity (plotted in red) of the five mass spectra at this voltage combination rose for the doubly charged IgG ion from 0.0009 ± 0.0003 to 0.0141 ± 0.0049, and for singly charged IgG ion from 0.0009 to 0.0099 ± 0.0048. Again, an increase of the signal intensity variation is noticed with rising AF value and thus, with growing BE voltages. The FWHM increased from 3700 u to 4200 u for the signal at m/z 75000 (IgG2+), and it was reduced from 10800 u to 3500 u for the signal at m/z 150000 (IgG1+) when using the BMCP detector.
The change of the FWHM with BE setting is shown for both proteins in Fig. S3 of the ESI.† Note, no significant variations of the m/z values were observed for the different ions with changing BE voltage combinations as shown in Fig. S4 of the ESI.†
Increasing of the acceleration voltage in the ion source would be the obvious way to further improve the MCP detection efficiency. However, the applied voltage is in practice limited by the increase of the in-source ion decay with increasing acceleration voltage.39 Hence, the increase of the intensity variations with rising BE voltage may be related to an enhanced probability for fragmentation of the ions when passing through the booster electrodes for acceleration. Furthermore, the variation in peak width with changing BE voltage may be related to the spatial distribution of the ion beam. For instance, a reduction in ion mass resolution was reported elsewhere for the combined use of a conversion dynode and a post-acceleration stage compared to the conventional MCP detector. The observed reduction in resolution was attributed to the influence of the post-acceleration stage on the ion beam.23,40 In the future, the overall reproducibility of the measurements with the BMCP detector could be improved by applying other matrix deposition methods than the herein used manual pipetting. Other matrix deposition techniques, such as sublimation and nebulization, are known to generate MALDI samples with enhanced homogeneity and with increased purity of the deposited matrix, which could reduce the observed signal intensity variation.41–43
Comparison of peak intensities for BSA and IgG revealed a mass-dependent decrease in signal intensity. The mean AF derived for the singly charged BSA ion (24.3) decreased by about 56% for the singly charged IgG ion (10.7). This behavior is also expected since a constant voltage was applied by the BEs to the ions. Thus, the higher mass IgG ion will still arrive at the MCP surface with a slower velocity than the lower mass BSA ion, causing the mass-dependent MCP detection efficiency. In addition, it cannot be ruled out that the decrease in signal intensity for IgG is also related to the spatial expansion of the ion cloud when approaching the booster extension at the MCP detector. Since the ion cloud expansion in vacuum is supposed to increase with ion mass, the decrease in signal intensity could also be related to the loss of higher mass ions when colliding with the BEs instead of reaching the MCP.38 Additionally, several peaks below the m/z values of the doubly charged BSA ion (<m/z 33200) and of the doubly charged IgG ion (<m/z 75000) were noticed in the two mass spectra in Fig. 4, which are assumed to correspond to higher charge states of BSA and IgG. A similar observation has already been made by Choi et al., whereby a strong correlation with the used MALDI matrix was observed.44 Since the multiply charged ions were observed for the MCP as well as for the BMCP measurements, their occurrence is likely related to other influences, such as the properties of the used matrix type.44
When comparing the AF found for the doubly charged BSA ion (m/z 33200) with the value found for the doubly charged IgG ion (m/z 75000), an increase from 13.4 to 23.7 is observed, which indicates a dependence of the AF on the m/z value. In this context, the AF values for higher charge states of BSA ions and of IgG ions were extracted, as shown in Fig. 5. The figure can be separated into the following three m/z regions: first, the signal amplification generated by the booster seems to work most efficient for ions within the m/z range of about 50000–75000 and second, the AF decreases for ions having an m/z value above about 75000 because of the mass-dependent MCP detection efficiency. Third, for m/z values below about 50000, the AF reduces with decreasing m/z value. The ions with lower m/z values have a larger velocity than ions with higher m/z values, since the ion's velocity is inversely proportional to the square root of their m/z value.2 Hence, the accelerating effect of the booster on the ions with lower m/z values may be smaller, because they travel through the booster part faster. Possibly, the reduction of the relative AF with increasing ion velocity (smaller m/z values) is caused by a less effective acceleration generated by the booster than for slower moving ions that have larger m/z values. Note, investigation of other ionized molecules in the future could reveal further details on the observed dependence of the relative signal amplification on the m/z value.
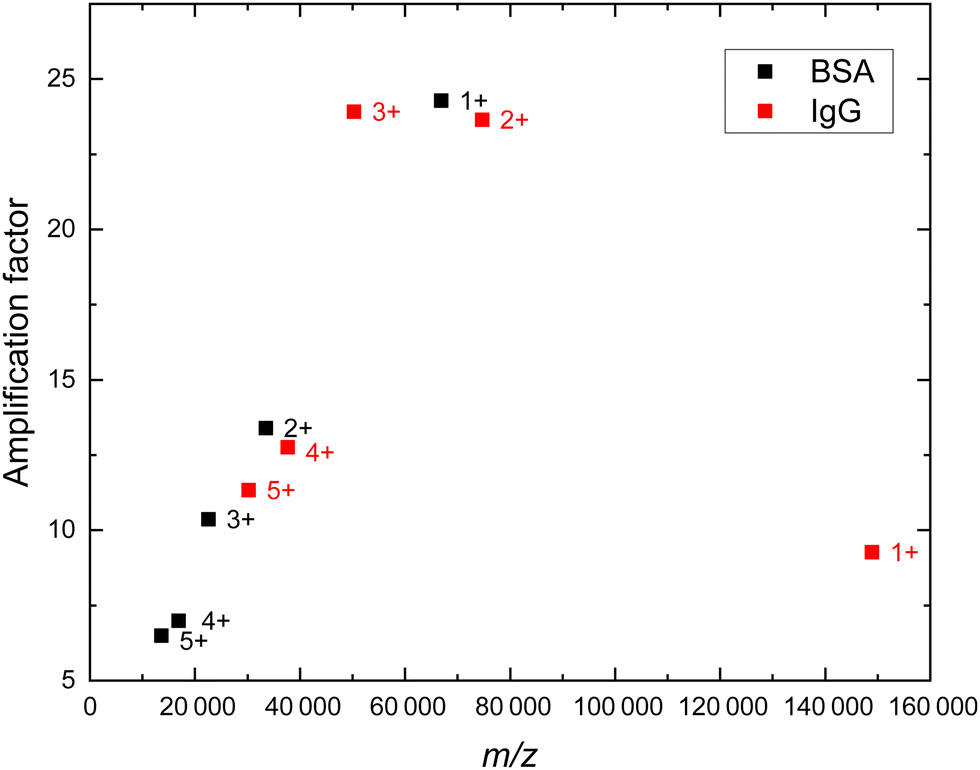 | ||
| Fig. 5 The AF was extracted up to the fifth charge state for BSA ions (plotted in black) and for IgG ions (plotted in red). The AF values and corresponding m/z values that appeared for the BSA ions and for the IgG ions were derived from the mass spectra that were measured for −3 kV/−4 kV at the bottom/top BEs using the medium electrode distance. | ||
Conclusions
Here, a simple extension of the conventional MCP detector was used for signal amplification of standard protein ions up to at least m/z 150000. Three configurations of the BMCP detector were tested to maximize the amplification factor. The medium electrode separation provided the largest signal enhancement by generating a convenient combination of acceleration of the positively charged ions by the negative booster electrodes with ion optical effects. It is likely that the spatial ion beam distribution is affected by the electrical booster potential, causing the enhanced signal intensity observed for this BMCP configuration in contrast to the two other designs. In general, the signal amplification got stronger for larger applied booster voltages. However, the largest amplification factors were found for combinations of −3 kV and −4 kV at the booster electrodes. Additionally, a local amplification factor maximum was detected for the voltage combination of −2 kV at the bottom and −1 kV at the top booster electrode, which offers the possibility to operate the BMCP detector with enhanced sensitivity already at electrical potentials of maximum 2 kV. The absolute signal intensity was found to decrease with increasing mass. This behavior is to be expected since the same booster voltage was used for all masses and thus, the higher mass ions will remain slower than the lighter ones after passing the booster stage. Nevertheless, the influence of the booster part proved to be sufficient to allow reliable detection of m/z values of up to 150000. In the future, the accessibly m/z range of the BMCP may be extended by application of larger electrical voltages to the booster electrodes. Note, the herein presented concept is not limited to proteins but could be applied to the analysis of high-mass substances, e.g., polymers and dendrimers, too. Additionally, a mass gate may be used in combination with the BMCP detector to avoid saturation of the MCP channels by the pulsed deflection of the first arriving low-mass ions, which could lead to further enhancement of the signal generated by high-mass ions.34,45 Such an experiment would require a fast switch (in the order of a few microseconds) between zero (or low) applied voltages to high voltages. Unfortunately, this is not possible with the current setup. Nevertheless, such considerations could be useful for future developments.
Conflicts of interest
There are no conflicts to declare.Acknowledgements
This work was funded by the Cluster of Excellence “CUI: Advanced Imaging of Matter” of the Deutsche Forschungsgemeinschaft (DFG) – EXC 2056 – project ID 390715994. Part of this publication was funded by the Deutsche Forschungsgemeinschaft (DFG, German Research Foundation) under Germany's Excellence Strategy – EXC 2176 ‘Understanding Written Artefacts: Material, Interaction and Transmission in Manuscript Cultures’, project no. 390893796 and was conducted within the scope of the Centre for the Study of Manuscript Cultures (CSMC) at Universität Hamburg.References
- S. Hosseini and S. O. Martinez-Chapa, in Fundamentals of MALDI-TOF-MS Analysis: Applications in Bio-Diagnosis, Tissue Engineering and Drug Delivery, Springer, Singapore, 2017, Chapter 1: Principles and Mechanism of MALDI-TOF-MS Analysis, pp.1–19 Search PubMed.
- J. H. Gross, Mass Spectrometry: A Textbook, Springer International Publishing, Switzerland, 3rd edn, 2017 Search PubMed.
- X. Chen, M. S. Westphall and L. M. Smith, Mass spectrometric analysis of DNA mixtures: Instrumental effects responsible for decreased sensitivity with increasing mass, Anal. Chem., 2003, 75, 5944–5952 CrossRef CAS PubMed.
- A. Brunelle, P. Chaurand, S. Della-Negra, Y. Le Beyec and G. B. Baptista, Surface secondary electron and secondary ion emission induced by large molecular ion impacts, Int. J. Mass Spectrom. Ion Processes, 1993, 126, 65–73 CrossRef CAS.
- A. Verentchikov, W. Ens, J. Martens and K. G. Standing, Detection of large molecular ions by secondary ion and secondary electrom emission, Int. J. Mass Spectrom. Ion Processes, 1993, 126, 75–83 CrossRef CAS.
- G. Westmacott, W. Ens and K. G. Standing, Secondary ion and electron yield measurements for surfaces bombarded with large molecular ions, Nucl. Instrum. Methods Phys. Res., Sect. B, 1996, 108, 282–289 CrossRef CAS.
- R. Liu, Q. Li and L. M. Smith, Detection of large ions in time-of-flight mass spectrometry: Effects of ion mass and acceleration voltage on microchannel plate detector response, J. Am. Soc. Mass Spectrom., 2014, 25, 1374–1383 CrossRef CAS PubMed.
- S. Coeck, M. Beck, B. Delauré, V. V. Golovko, M. Herbane, A. Lindroth, S. Kopecky, V. Y. Kozlov, I. S. Kraev, T. Phalet and N. Severijns, Microchannel plate response to high-intensity ion bunches, Nucl. Instrum. Methods Phys. Res., Sect. A, 2006, 557, 516–522 CrossRef CAS.
- A. Westman, G. Brinkmalm and D. F. Barofsky, MALDI induced saturation effects in chevron microchannel plate detectors, Int. J. Mass Spectrom. Ion Processes, 1997, 169–170, 79–87 CrossRef.
- M. Frank, Mass spectrometry with cryogenic detectors, Nucl. Instrum. Methods Phys. Res., Sect. A, 2000, 444, 375–384 CrossRef CAS.
- R. J. Wenzel, U. Matter, L. Schultheis and R. Zenobi, Analysis of megadalton ions using cryodetection MALDI time-of-flight mass spectrometry, Anal. Chem., 2005, 77, 4329–4337 CrossRef CAS PubMed.
- B. K. Seyfried, J. Siekmann, O. Belgacem, R. J. Wenzel, P. L. Turecek and G. Allmaier, MALDI linear TOF mass spectrometry of PEGylated (glyco)proteins, J. Mass Spectrom., 2010, 45, 612–617 CAS.
- D. W. Koppenaal, C. J. Barinaga, M. B. Denton, R. P. Sperline, G. M. Hieftje, G. D. Schilling, F. J. Andrade and J. H. Barnes IV, MS detectors, Anal. Chem., 2005, 77, 418A–427A CrossRef CAS PubMed.
- Photonis, Scientific Detectors, Advanced performance and BiPolar TOF detectors, https://www.photonis.com/system/files/2019-03/Advanced_and_BiPolar_TOF.pdf., (accessed 10 January 2022).
- A. Zavalin, J. Yang, K. Hayden, M. Vestal and R. M. Caprioli, Tissue protein imaging at 1 μm laser spot diameter for high spatial resolution and high imaging speed using transmission geometry MALDI TOF MS, Anal. Bioanal. Chem., 2015, 407, 2337–2342 CrossRef CAS PubMed.
- S. R. Ellis, J. H. Jungmann, D. F. Smith, J. Soltwisch and R. M. A. Heeren, Enhanced detection of high-mass proteins by using an active pixel detector, Angew. Chem., Int. Ed., 2013, 52, 11261–11264 CrossRef CAS PubMed.
- J. Park, Z. Aksamija, H.-C. Shin, H. Kim and R. H. Blick, Phonon-assisted field emission in silicon nanomembranes for time-of-flight mass spectrometry of proteins, Nano Lett., 2013, 13, 2698–2703 CrossRef CAS PubMed.
- J. Park, H. Qin, M. Scalf, R. T. Hilger, M. S. Westphall, L. M. Smith and R. H. Blick, A mechanical nanomembrane detector for time-of-flight mass spectrometry, Nano Lett., 2011, 11, 3681–3684 CrossRef CAS PubMed.
- J. Park, H. Kim and R. H. Blick, Quasi-dynamic mode of nanomembranes for time-of-flight mass spectrometry of proteins, Nanoscale, 2012, 4, 2543–2548 RSC.
- J. Park and R. H. Blick, A silicon nanomembrane detector for matrix-assisted laser desorption/ionization time-of-flight mass spectrometry (MALDI-TOF MS) of large proteins, Sensors, 2013, 13, 13708–13716 CrossRef CAS PubMed.
- J. Park and R. H. Blick, Mechanical modulation of phonon-assisted field emission in a silicon nanomembrane detector for time-of-flight mass spectrometry, Sensors, 2016, 16, 200 CrossRef PubMed.
- H. Kim, J. Park, Z. Aksamija, M. Arbulu and R. H. Blick, Ultrananocrystalline diamond membranes for detection of high-mass proteins, Phys. Rev. Appl., 2016, 6, 064031 CrossRef.
- A. van Remoortere, R. J. M. van Zeijl, N. van den Oever, J. Franck, R. Longuespée, M. Wisztorski, M. Salzet, A. M. Deelder, I. Fournier and L. A. McDonnell, MALDI imaging and profiling MS of higher mass proteins from tissue, J. Am. Soc. Mass Spectrom., 2010, 21, 1922–1929 CrossRef CAS PubMed.
- R. Wenzel, U. Rohling, A. Nazabel and F. Hillenkamp, Detector Device for High Mass Ion Detection, a Method for Analyzing Ions of High Mass and a Device for Selection between Ion Detectors, US Pat., 2011/0001043 A1, 2011 Search PubMed.
- F. M. Green, I. S. Gilmore and M. P. Seah, TOF-SIMS: Accurate mass scale calibration, J. Am. Soc. Mass Spectrom., 2006, 17, 514–523 CrossRef CAS PubMed.
- Z. Liu and K. L. Schey, Optimization of a MALDI TOF-TOF mass spectrometer for intact protein analysis, J. Am. Soc. Mass Spectrom., 2005, 16, 482–490 CrossRef CAS PubMed.
- U. Bahr, U. Röhling, C. Lautz, K. Strupat, M. Schürenberg and F. Hillenkamp, A charge detector for time-of-flight mass analysis of high mass ions produced by matrix-assisted laser desorption/ionization (MALDI), Int. J. Mass Spectrom. Ion Processes, 1996, 153, 9–21 CrossRef CAS.
- L. Signor and E. Boeri Erba, Matrix-assisted laser desorption/ionization time of flight (MALDI-TOF) mass spectrometric analysis of intact proteins larger than 100 kDa, J. Visualized Exp., 2013, 79, e50635 Search PubMed.
- Hamamatsu Photonics, Electron Tube Division, MCP (Microchannel Plate) Assembly, https://www.hamamatsu.com/content/dam/hamamatsu-photonics/sites/documents/99_SALES_LIBRARY/etd/MCP_assembly_TMCP0003E.pdf, (accessed 10 January 2022).
- A. El-Aneed, A. Cohen and J. Banoub, Mass spectrometry, review of the basics: Electrospray, MALDI, and commonly used mass analyzers, Appl. Spectrosc. Rev., 2009, 44, 210–230 CrossRef.
- W. C. Chang, L. C. L. Huang, Y.-S. Wang, W.-P. Peng, H. C. Chang, N. Y. Hsu, W. Bin Yang and C. H. Chen, Matrix-assisted laser desorption/ionization (MALDI) mechanism revisited, Anal. Chim. Acta, 2007, 582, 1–9 CrossRef CAS PubMed.
- S. Kurnosenko and E. Moskovets, On the high-resolution mass analysis of the product ions in tandem time-of-flight (TOF/TOF) mass spectrometers using a time-dependent re-acceleration technique, Rapid Commun. Mass Spectrom., 2010, 24, 63–74 CrossRef CAS PubMed.
- E. Liénard, M. Herbane, G. Ban, G. Darius, P. Delahaye, D. Durand, X. Fléchard, M. Labalme, F. Mauger, A. Mery, O. Naviliat-Cuncic and D. Rodríguez, Performance of a micro-channel plates position sensitive detector, Nucl. Instrum. Methods Phys. Res., Sect. A, 2005, 551, 375–386 CrossRef.
- C.-C. Wang, Y.-H. Lai, Y.-M. Ou, H.-T. Chang and Y.-S. Wang, Critical factors determining the quantification capability of matrix-assisted laser desorption/ionization-time-of-flight mass spectrometry, Philos. Trans. R. Soc., A, 2016, 374, 20150371 CrossRef PubMed.
- J. L. Wiza, Microchannel plate detectors, Nucl. Instrum. Methods, 1979, 162, 587–601 CrossRef CAS.
- S.-H. Lai, M.-L. Chu, J.-L. Lin and C.-H. Chen, Development of a focused high-energy macromolecular ion beam, Analyst, 2021, 146, 2936–2944 RSC.
- F. Hinterberger, Ion optics with electrostatic lenses, CAS – CERN Accelerator School: Small Accelerators, Helmholtz-Institut für Strahlen- und Kernphysik, University of Bonn, Germany, 2006 Search PubMed.
- J. Lee, H. Chen, T. Liu, C. E. Berkman and P. T. A. Reilly, High resolution time-of-flight mass analysis of the entire range of intact singly-charged proteins, Anal. Chem., 2011, 83, 9406–9412 CrossRef CAS PubMed.
- A. Hedin, P. Hakansson and B. U. R. Sundqvist, On the detection of large organic ions by secondary electron production, Int. J. Mass Spectrom. Ion Processes, 1987, 75, 275–289 CrossRef CAS.
- T. C. Cain, D. M. Lubman and W. J. Weber Jr., Differentiation of bacteria using protein profiles from matrix-assisted laser desorption/ionization time-of-flight mass spectrometry, Rapid Commun. Mass Spectrom., 1994, 8, 1026–1030 CrossRef CAS.
- R. Fernández, J. Garate, L. Martín-Saiz, I. Galetich and J. A. Fernández, Matrix sublimation device for MALDI mass spectrometry imaging, Anal. Chem., 2019, 91, 803–807 CrossRef PubMed.
- J. A. Hankin, R. M. Barkley and R. C. Murphy, Sublimation as a method of matrix application for mass spectrometric imaging, J. Am. Soc. Mass Spectrom., 2007, 18, 1646–1652 CrossRef CAS PubMed.
- Y. Chen, J. Allegood, Y. Liu, E. Wang, B. Cachón-González, T. M. Cox, A. H. Merrill and M. C. Sullards, Imaging MALDI mass spectrometry using an oscillating capillary nebulizer matrix coating system and its application to analysis of lipids in brain from a mouse model of Tay-Sachs/Sandhoff disease, Anal. Chem., 2008, 80, 2780–2788 CrossRef CAS PubMed.
- H. Choi, D. Lee, Y. Kim, H.-Q. Nguyen, S. Han and J. Kim, Effects of matrices and additives on multiple charge formation of proteins in MALDI–MS analysis, J. Am. Soc. Mass Spectrom., 2019, 30, 1174–1178 CrossRef CAS PubMed.
- R. C. Beavis and B. T. Chait, Factors affecting the ultraviolet laser desorption of proteins, Rapid Commun. Mass Spectrom., 1989, 3, 233–237 CrossRef CAS PubMed.
Footnote |
| † Electronic supplementary information (ESI) available. See DOI: https://doi.org/10.1039/d2cp02361j |
| This journal is © the Owner Societies 2023 |