
 Open Access Article
 This Open Access Article is licensed under a
 Creative Commons Attribution 3.0 Unported Licence
Dissolution–precipitation synthesis and thermal stability of magnesium whitlockite†
Agne
Kizalaite
a,
Vytautas
Klimavicius
b,
Vytautas
Balevicius
 b,
Gediminas
Niaura
b,
Andrei N.
Salak
c,
Jen-Chang
Yang
d,
Sung Hun
Cho
e,
Tomoyo
Goto
ef,
Tohru
Sekino
e and
Aleksej
Zarkov
*a
b,
Gediminas
Niaura
b,
Andrei N.
Salak
c,
Jen-Chang
Yang
d,
Sung Hun
Cho
e,
Tomoyo
Goto
ef,
Tohru
Sekino
e and
Aleksej
Zarkov
*a
aInstitute of Chemistry, Vilnius University, Naugarduko 24, LT-03225 Vilnius, Lithuania. E-mail: aleksej.zarkov@chf.vu.lt
bInstitute of Chemical Physics, Vilnius University, Sauletekio 3, LT-10257 Vilnius, Lithuania
cDepartment of Materials and Ceramics Engineering/CICECO-Aveiro Institute of Materials, University of Aveiro, 3810-193 Aveiro, Portugal
dGraduate Institute of Nanomedicine and Medical Engineering, College of Biomedical Engineering, Taipei Medical University, 250 Wu-Hsing St., Taipei 11052, Taiwan
eSANKEN (The Institute of Scientific and Industrial Research), Osaka University, 8-1 Mihogaoka, Ibaraki, Osaka 567–0047, Japan
fInstitute for Advanced Co-Creation Studies, Osaka University, 1-1 Yamadaoka, Suita, Osaka 565-0871, Japan
First published on 10th July 2023
Abstract
Magnesium whitlockite (Mg-WH, Ca18Mg2(HPO4)2(PO4)12) is a promising candidate for biomedical application in bone regeneration; however, the fabrication of Mg-WH bioceramics by conventional methods is limited. Mg-WH is known to be thermally unstable and decomposes upon heating. The mechanism of thermal decomposition and phase evolution has not comprehensively been investigated so far. In the present work, Mg-WH was synthesized by a dissolution–precipitation process under hydrothermal conditions. Thermally induced degradation of the synthesized powders was investigated in detail by combining X-ray diffraction (XRD) analysis, infrared spectroscopy (FTIR), Raman spectroscopy as well as 1H and 31P solid-state nuclear magnetic resonance (NMR). The as-prepared Mg-WH powders were annealed at different temperatures in the range from 400 to 1300 °C. It was found that thermal decomposition starts at around 700 °C with the formation of beta-tricalcium phosphate (β-TCP, Ca3(PO4)2) and a mixture of two Ca2P2O7 polymorphs. Thermal decomposition occurs gradually and the co-existence of both Mg-WH and Mg-substituted β-TCP phases was observed in a wide temperature range up to 1200 °C. Complete disappearance of the HPO42− structural unit was confirmed only after annealing at 1300 °C followed by melting at 1400 °C.
1. Introduction
Calcium phosphates (CPs) are major inorganic constituents of human hard tissues.1 This reason makes synthetic CPs widely used in the fields of bone regeneration and dentistry due to their chemical and structural similarities to natural bone.2 While calcium hydroxyapatite (HA, Ca10(PO4)6(OH)2) and beta-tricalcium phosphate (β-TCP, Ca3(PO4)2) are currently the most commonly used CPs; these materials still have some drawbacks.3–6 In recent years, another member of the CP family, namely magnesium whitlockite (Mg-WH, Ca18Mg2(HPO4)2(PO4)12) gained a lot of attention from the scientific community. Although in the literature Mg-WH is often mentioned as the second most abundant biomineral in the human body,7,8 a very recent literature analysis by Shah9 did not confirm this claim, concluding that Mg-WH is exclusively a pathological biomineral. According to Shah, Mg-WH has never been reported to be in the bone extracellular matrix; therefore, Mg-WH does not constitute a biomimetic strategy for bone repair. Nevertheless, such contradictions do not deny the fact that Mg-WH is an osteoconductive and bioresorbable material suitable for the application as a bone graft substitute. Synthetic Mg-WH demonstrated superior biological performance in both in vitro and in vivo studies.4,10–12 Moreover, Mg-WH demonstrated piezoelectric properties, which allows it to be used as a self-powered electrical stimulator for osteogenic, neurogenic and angiogenic differentiation.13,14It was assumed for a long time that synthesis of phase-pure Mg-WH is a challenging task due to the formation of other CPs; however, in recent years this issue was overcame and different successful synthetic approaches were demonstrated.15–17 Depending on the specific purpose in regenerative medicine, CPs can be used in different forms. To the best of our knowledge, to date Mg-WH has already been prepared in the form of powders,16 granules,18 coating on TCP ceramics19 and different composites;10,20,21 however, there are no data on the fabrication of ceramics. Conventional ceramic routes consider sintering at high temperature, which is needed for the densification of materials. It is obvious that such an approach is limited by thermal stability of materials; therefore, the basic knowledge on the thermal degradation of the material is crucial as preparation work for the fabrication of ceramics.
Mg-WH is assumed to be thermally unstable; however, the mechanism of thermal decomposition and phase evolution was not comprehensively investigated so far. Moreover, some contradictions can be found in the literature regarding the thermal stability of WH. For instance, Gopal et al.22 reported that Mg-WH decomposes in two steps by releasing water and transforming into β-TCP. Around 20% of water is released at ca. 780 °C and the remaining amount at around 1035 °C. These results were partially confirmed by Kaliannagounder et al.,13 who concluded that Mg-WH powders retain the WH structure after annealing at 750 °C; however, the powders transform into β-TCP and Ca2P2O7 at 1000 °C. On the other hand, Jang et al.7 did not observe any secondary phase after the heat treatment of Mg-WH even at 1450 °C.
The difference between polycrystalline WH and β-TCP (or Mg-substituted β-TCP) is not distinguishable by means of laboratory XRD, since both these materials have a rhombohedral structure with the R3c space group (#161) and essentially similar values of the lattice parameters.22 This is also the reason why these two names are often used in the literature interchangeably and synonymously. The crystal lattice is composed of two periodically arrayed columns (A and B) along the c-axis. Column B is identical in both β-TCP and Mg-WH structures consisting of Ca2+ and PO43− ions arranged in a pattern: Ca(1)–P(3)O4–P(2)O4–Ca(2)–Ca(3). Compositional differences occur in column A: Ca(5) and Ca(4) positions in β-TCP are occupied by Ca ions, whereas in the WH structure Ca is substituted by Mg and H from HPO42−, respectively.7,23 These structural similarities lead to both materials sharing an almost identical XRD pattern.23,24
Upon heating, Mg-WH releases H2O, which is accompanied by the disappearance of the HPO42− group and the formation of P2O74−; therefore, the HPO42− unit could serve as a specific structural marker to monitor thermally induced degradation. The detection of this species is feasible, employing spectroscopic techniques such as infrared or Raman spectroscopy and solid-state nuclear magnetic resonance (NMR). Despite the fact that both 1H and 31P nuclei are perfect probes for NMR, this technique is very rarely used for the structural characterization of WH. To the best of our knowledge, there are only few studies reporting the use of NMR for the characterization of materials with a WH structure.25–27 At the same time, it is widely used for the investigation of other CPs.28,29
In this work, we present a time-effective and low-cost way to synthesize Mg-WH by a dissolution–precipitation process. The obtained product was evaluated by a full range of characterization techniques to give a comprehensive view on the material. The detailed analysis of the thermal degradation of Mg-WH was performed by annealing the as-prepared material at different temperatures followed by characterization of the obtained products by means of XRD, FTIR and Raman spectroscopy as well as 1H and 31P NMR.
2. Materials and methods
2.1. Synthesis
Mg-WH powders were synthesized via a dissolution–precipitation process under hydrothermal conditions by modifying the previously reported procedure.25 Calcium hydrogen phosphate dihydrate (CaHPO4·2H2O, 99.1%, Eurochemicals) and magnesium acetate tetrahydrate (Mg(CH3COO)2·4H2O, ≥98%, Roth) were used as starting materials. For the synthesis, certain amounts of CaHPO4·2H2O and Mg(CH3COO)2·4H2O corresponding to the Ca-to-Mg molar ratio of 9 were dissolved in a 90 cm3 Teflon liner in a mixture of 50 mL of deionized water and 5.6 mL of 1 M phosphoric acid (H3PO4, 75%, Roth) to obtain a solution with a total metal ion concentration of 0.06 M. The above mixture was stirred with a magnetic stirrer at room temperature until the precursors were fully dissolved. Next, under continuous mixing, concentrated ammonia solution (NH4OH, 25%, Roth) was added until the pH of the reaction medium raised to 6.4. The increase of pH resulted in the instantaneous formation of white precipitates. Then, the reaction mixture was sealed in a Teflon-lined stainless-steel container and transferred into an oven preheated to 160 °C for 3 h. Afterwards, the container was allowed to cool down to room temperature; the resulting product was vacuum filtered, washed with deionized water, and dried at 50 °C in the oven overnight. The synthesis procedure is schematically illustrated in Fig. 1. The obtained powders were further annealed in air for 5 h at temperatures from 400 to 1300 °C with a step of 100 °C.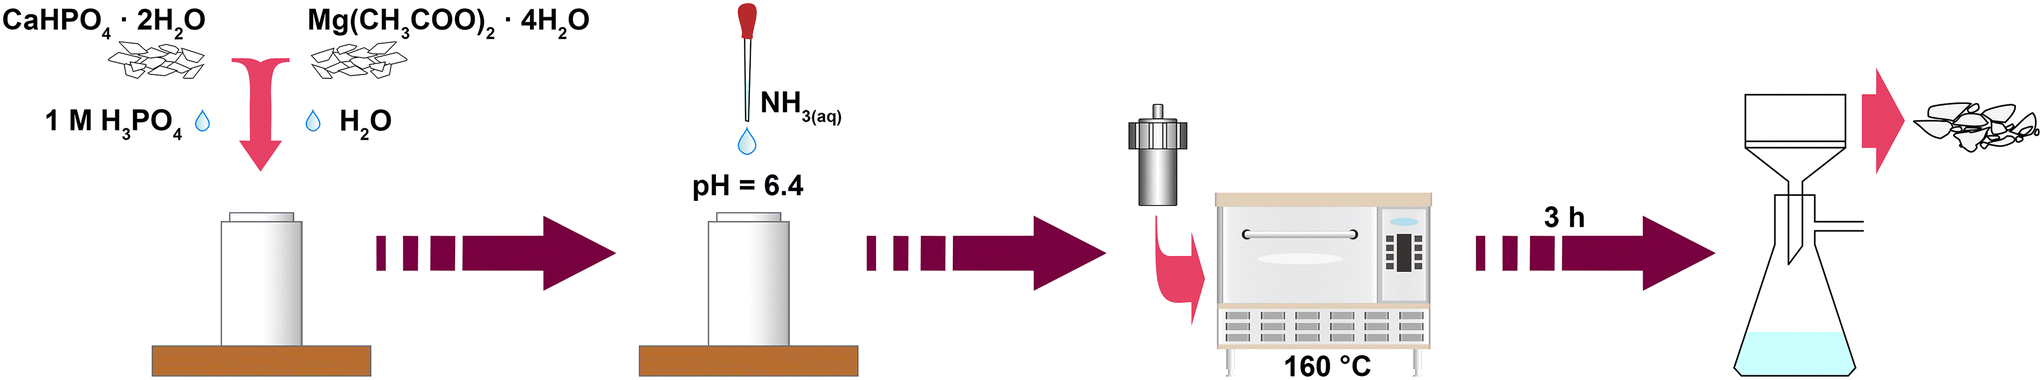 | ||
| Fig. 1 Schematic representation of the synthesis of Mg-WH powders. | ||
2.2. Characterization
Powder X-ray diffraction (XRD) study of the obtained samples was performed using a PANalytical X'Pert Powder diffractometer (Ni-filtered Cu-Kα radiation, λ = 1.5419 Å, PIXcel 1D detector, and the exposition corresponded to about 1 s per step of 0.02° over the angular range of 10–90°) at room temperature. Structural refinement was performed using Match! (software version 3.10.2.173) and FullProf Suite (software version September-2020) programs. Data were fitted using CSD 2046688 as a reference.30 Fourier transform infrared (FTIR) spectra were obtained in the range of 4000–400 cm−1 with a Bruker ALPHA-FTIR spectrometer. Raman spectra were recorded using an inVia Raman (Renishaw, United Kingdom) spectrometer equipped with a thermoelectrically cooled (−70 °C) CCD camera and microscope. The spectra were excited with a 325 nm beam from a continuous wave helium–cadmium (He–Cd) gas laser. The laser power at the sample was restricted to 0.2 mW. A 15×/0.32 NA objective was used during the measurements. The Raman spectra were dispersed by 3600 lines per mm grating. The high-resolution Raman spectra were observed with a 532 nm excitation wavelength, 3000 lines per mm grating, and 20×/0.40 NA objective. The laser power at the sample was 0.5 mW. The spectral slit width determined as the full width at half maximum of the Ne line near 811 cm−1 was found to be 2.4 cm−1. The overall integration time for both 325 and 532 nm excitation wavelengths was 400 s. The position of the Raman bands on the wavenumber axis was calibrated using the polystyrene film (532 nm excitation) or Teflon (325 nm excitation) Raman spectrum. The spectra were background corrected by using a 6 order baseline function fit. Parameters of the bands were determined by fitting the experimental spectra with the Gaussian–Lorentzian shape components using GRAMS/A1 8.0 (Thermo Scientific, USA) software. The morphology of the samples was studied by field emission scanning electron microscopy (FE-SEM, SU9000, Hitachi) and transmission electron microscopy (TEM, JEM-ARM 200F, JEOL Ltd.).Solid-state NMR experiments were carried out at 14.1 T on a Bruker Avance Neo 600 NMR spectrometer operating at 600.3 and 243.0 MHz for 1H and 31P, respectively, using a 2.5 mm Trigamma MAS probe and 2.5 mm zirconia rotors. The temperature was stabilized at 298 K and the MAS rate was set to 10 kHz. For 1H MAS experiments, a pulse sequence employing two π refocusing pulses with a delay of 2 μs was employed to eliminate the signal from the probe background. The 1H 90° excitation pulse was 2.1 μs and 16 scans were accumulated using a repetition delay of 10 s. For 31P MAS measurements, a saturation recovery pulse sequence was used. The saturation pulse train consisted of 20 π/2 pulses followed by 100 s delay. The π/2 excitation pulse was equal to 3.6 μs, and 256 scans were accumulated. 1H → 31P CP MAS measurements were performed with 4 ms CP contact time employing a 100–50% ramp on the 1H channel, and 1024 scans were accumulated using a repetition delay of 10 s. For 31P–31P 1Q–2Q experiments, a standard pulse sequence was used which employs a BABA (back-to-back) 2 rotor period recoupling scheme.31 The 31P π/2 excitation pulse was equal to 3.57 μs, the repetition delay was set to 250 s and 32 scans per 32 increments were accumulated. 1H and 31P spectra were referenced respectively to TMS using adamantane (δ (1H) = 1.85 ppm) and 85% H3PO4 using ADP (ammonium dihydrogen phosphate, NH4H2PO4, δ (31P) = 0.8 ppm).
The N2 adsorption and desorption isotherms of the samples were obtained at −196 °C by using a Brunauer–Emmett–Teller (BET) analyzer TriStar II 3020 (Micromeritics). Prior to the gas sorption measurements, all the samples were outgassed in a N2 atmosphere at 100 °C for 2 h.
Thermogravimetric (TG-DTG) analysis was performed using a Perkin Elmer STA 6000 simultaneous thermal analyzer. A sample of 10 mg was heated from 25 to 900 °C at a heating rate of 10 °C min−1 in a dry flowing air (20 mL min−1).
3. Results and discussion
The XRD analysis confirmed the successful synthesis of single-phase Mg-WH; no diffraction peaks attributed to other crystalline phases were observed in the XRD pattern (Fig. 2a). Rietveld refinement was used for further structural analysis; the refinement was successful with adequate description of all the observed diffraction peaks. The calculated lattice parameters (a = 10.348 Å; c = 37.153 Å) were close to those reported in the literature for both synthetic and natural WH,22,30 though the a parameter was slightly smaller while the c parameter was slightly larger. Besides, the experimental data indicated slightly more intense reflections from the (110), (214) and (220) planes and less intense reflection from the (2010) plane as compared to the calculated data. | ||
| Fig. 2 Results of Rietveld refinement (a), the red circle symbols and the black solid line represent the experimental and calculated intensities, respectively, and the blue line below is the difference between them. The green tick marks indicate the positions of the Bragg peaks; FTIR spectrum (b); 532 nm excited Raman spectrum (c); N2 absorption–desorption isotherm (d) of the as-prepared Mg-WH powder. | ||
Vibrational spectroscopy is crucial for the reliable identification of the WH structure as both Mg-WH and β-TCP are characterized by an identical powder XRD pattern. The most prominent difference between the FTIR and Raman spectra of these two compounds is the band assigned to the HPO42− group (ca. 920 cm−1), which is present only in Mg-WH and absent in β-TCP;7 therefore, it can be assumed as a spectral marker for distinguishing these materials. The above-mentioned signal is clearly visible in both FTIR (Fig. 2b) and Raman (Fig. 2c) spectra of our synthesized material, which confirms the formation of Mg-WH. Other observed bands are ascribed to different phosphate vibration modes; their positions are in good agreement with the data reported for WH in the literature.15,32 It is worth noting that no visible bands associated with other CPs were observed, which agrees well with the XRD data and confirms the purity of the synthesized material.
The BET method was used to measure the surface area of the as-prepared Mg-WH powder. The N2 adsorption–desorption isotherm (Fig. 2d) was assigned to type IV with a type H3 hysteresis loop. The type H3 hysteresis loop is usually indicative to plate-like particle aggregates which result in slit-shape pores.33 The specific surface area (SBET) was calculated to be 36.7 m2 g−1.
SEM and TEM images (Fig. 3) show that the synthesized powder consists of agglomerated irregularly shaped plate-like particles of nanoscale dimensions. The size of the particles varies in the range of approximately 30–80 nm. Although it is known that Mg-WH is prone to form particles with a distinctive polygonal shape,17,19,32 in our case only a closer look allows us to see some well-defined hexagonally shaped particles. The observed morphology of the synthesized powder correlates well with the results of BET analysis. The EDX mapping (Fig. 3c–f) shows that all the elements are uniformly distributed in the sample. The Ca-to-Mg ratio was determined as 9![[thin space (1/6-em)]](https://www.rsc.org/images/entities/char_2009.gif) :0.97, which is close to the theoretical chemical composition of Mg-WH.
:0.97, which is close to the theoretical chemical composition of Mg-WH.
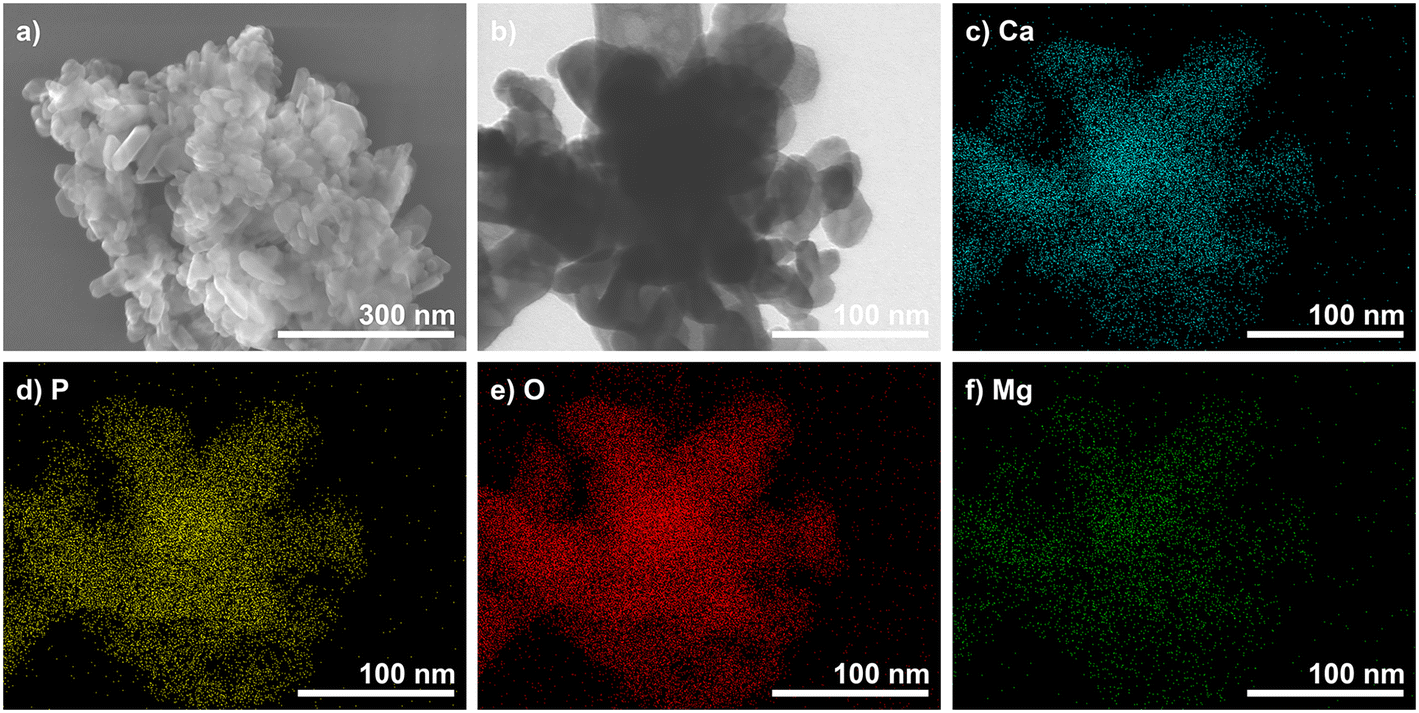 | ||
| Fig. 3 SEM micrograph (a); TEM image (b); EDX mapping images (c–f) of the as-prepared Mg-WH powder. | ||
As mentioned above, Mg-WH is known to be thermally unstable and degradable upon annealing. Thermal degradation of ideally stoichiometric and defect-free Mg-WH is expected to occur according to eqn (1) with a total weight loss of around 0.8 wt%.
| Ca18Mg2(HPO4)2(PO4)12 → 6Ca2.67Mg0.33(PO4)2 + Ca2P2O7 + H2O | (1) |
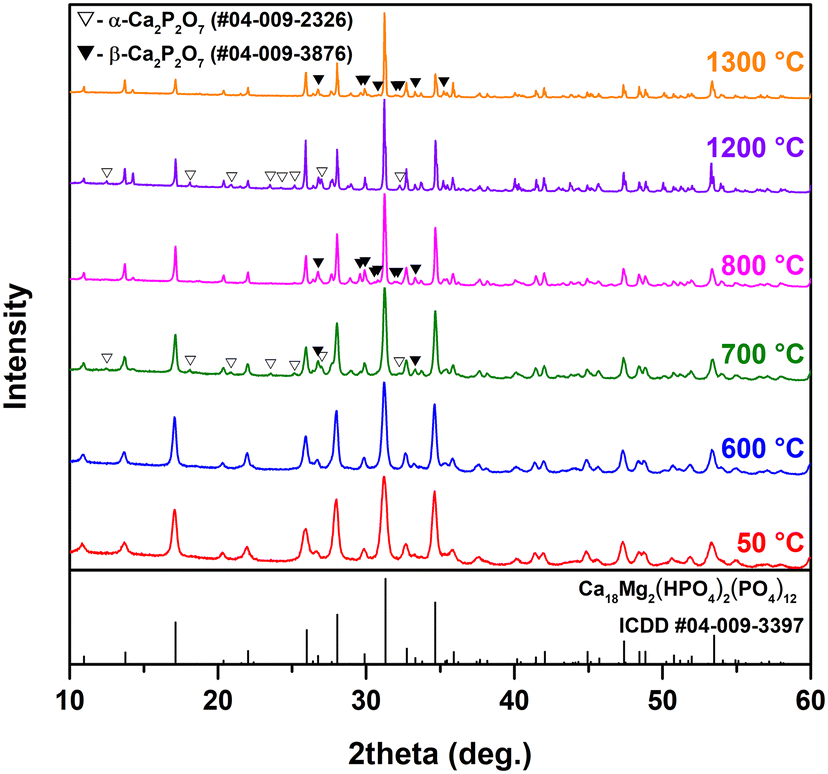
Fig. 4 demonstrates the representative XRD patterns of the Mg-WH samples annealed at different temperatures. The XRD patterns of the Mg-WH samples annealed in the whole range of temperatures from 400 to 1300 °C with a step of 100 °C are given in Fig. S2.†
 | ||
| Fig. 4 XRD patterns of Mg-WH powders annealed at different temperatures. | ||
There were no significant changes in the XRD patterns in terms of arising or disappearing reflection peaks up to 600 °C; the only observed trend was associated with the sharpening of the peaks, which reflects the increase of the grain size and crystallinity of the material. The FWHM values calculated for the (2010) diffraction peak decreased from 0.441° to 0.095° in the transition from as-prepared material to annealed at 1300 °C. The most drastic change reflecting in a 2-fold decrease of FWHM was observed in the range from 600 to 800 °C. The dependence of FWHM on annealing temperature is depicted in Fig. S3.† Evident changes were observed after annealing at 700 °C as two additional phases appeared. Both phases were identified as Ca2P2O7 polymorphs, namely α-Ca2P2O7 and β-Ca2P2O7, which agrees well with the literature data.13,32 Although α-Ca2P2O7 is assumed to be a high-temperature polymorph,34 the simultaneous formation of both species could be explained by the Ostwald step rule.35 After annealing at 800 °C, the diffraction peaks of α-Ca2P2O7 disappeared, and all newly observed reflections corresponded to β-Ca2P2O7. This polymorph was observed in the range from 800 to 1100 °C along with the main WH and/or β-TCP phase. As the annealing temperature reached 1200 °C, β-Ca2P2O7 was replaced by α-Ca2P2O7, which agrees well with the phase transition temperature between the two polymorphs.34 Surprisingly, after the annealing at 1300 °C, the secondary phase was β-Ca2P2O7 again. Since its formation was unexpected, the annealing procedure was repeated three times with different portions of the as-prepared material; however, the results were reproducible. It is worth noting that after annealing at 1300 °C, the sample was partially melted and completely melted at ca. 1400 °C. The observed melting point was lower as compared to the value of 1600 °C reported by Jang et al.7 Summarizing the results of the XRD analysis, it can be concluded that Mg-WH/β-TCP was the dominant product throughout the whole degradation process; however, from the XRD data alone it is impossible to distinguish the co-existence or full replacement of the WH phase by β-TCP.
Rietveld analysis was employed to calculate the lattice parameters and to estimate the structural changes during the Mg-WH decomposition. The obtained data suggest that after the start of the thermal degradation of Mg-WH at 700 °C, Mg2+ ions were transferred to the β-TCP structure occupying Ca(5) and Ca(4) crystallographic positions. It is reasonable considering the structural similarities between these two compounds and the ability of β-TCP to adopt small cations.36,37 According to the literature, the β-TCP structure can adopt around 14 mol% of Mg2+ ions, which preferably occupy 6-fold coordinated Ca(5) sites.38,39 The calculations did not confirm the presence of Mg2+ ions in the Ca2P2O7 structure; however, due to the fact that only a small amount of Ca2P2O7 is visible in the XRD patterns, precise calculations of its Mg content could not be performed. Since the relative Mg content increases during the transformation from WH to β-TCP (from 10 to 11 mol% in Mg-WH and β-TCP, respectively), it was concluded that the Ca(5) position is fully occupied by Mg, while Ca(4) is occupied only partially, which agrees well with previous reports.38,39 The variation of the lattice parameters of Mg-WH/β-TCP in the range of 600–1300 °C is illustrated in Fig. 5; the numerical values and refinement parameters are provided in Table S1.† The dashed lines indicate the lattice parameters of the as-prepared material. In the range from 600 to 700 °C, the c parameter was nearly constant, while the a parameter demonstrated a drastic decrease. A gradual decrease of the a parameter was observed in the range of 700–1100 °C, while the c parameter increased. The opposite trend was observed in the temperature range of 1100–1300 °C, where the c parameter decreased and the a parameter increased. This change of trend might be tied to the closeness to the melting point of the obtained β-TCP and Ca2P2O7 mixture that should be around 1300 °C.40 As was mentioned above, in our case the sample annealed at 1300 °C was partially melted.
 | ||
| Fig. 5 Lattice parameters of Mg-WH/β-TCP annealed at different temperatures. | ||
Fig. 6 shows the FTIR and Raman spectra of the Mg-WH powders annealed at representative temperatures. The spectra of the samples annealed in the whole range of temperatures are given in Fig. S4 and S5.† As it could be expected, the FTIR spectra of β-TCP and Mg-WH are quite similar and show the same band multiplicity due to their very similar phosphate frameworks;30 therefore, the phase transition from Mg-WH to β-TCP or the co-existence of the two materials cannot be clearly observed from the PO4-related bands. Thus, attention should be paid on the band centered at 920 cm−1, which is assigned to the HPO42− group in the Mg-WH structure. First, the intensity of this band increased with an increase of annealing temperature up to 600 °C, which can be attributed to the increased crystallinity of the material. After annealing at higher temperatures, the trend was opposite: the intensity obviously decreased after the thermal treatment at 700 °C and the presence of this signal was indistinguishable after the treatment above 900 °C. This observation is in good agreement with eqn (1); however, it is worth noting that the temperature of the complete disappearance of the band cannot be detected precisely due to the overlapping with other bands. The absorption bands corresponding to Ca2P2O7 can be observed after annealing above 700 °C. The most straightforward way to detect this material is to monitor the presence of absorption bands located at ca. 726 and 754 cm−1, which correspond to the P–O–P bond in β- and α-Ca2P2O7, respectively.41 The temperature of the formation and the type of the Ca2P2O7 polymorph are in good agreement with the XRD results (Fig. 4).
 | ||
| Fig. 6 FTIR (a) and Raman (excitation wavelength is 325 nm) (b) spectra of Mg-WH powders annealed at different temperatures. | ||
In the Raman spectra of Mg-WH, the signal corresponding to the HPO42− group (ca. 926 cm−1) does not overlap with the most intense peak of Mg-WH or β-TCP.42 The Raman spectroscopy data demonstrated the same trend as the FTIR data (Fig. 6b). The intensity of the band ascribed to HPO42− gradually decreased after annealing above 600 °C; however, as compared to FTIR, this band can be easily detected in a broader temperature range. We also tried to detect the Raman spectra with a 532 nm excitation source; however, it was impossible for the samples annealed below 700 °C due to the strong luminescence. High-resolution spectra taken with a 532 nm source are given in Fig. S6.† It is seen that a very weak signal ascribed to HPO42− is observed even in the sample annealed at 1200 °C indicating the co-existence of Mg-WH and β-TCP in a wide temperature range. The signal completely vanishes only at 1300 °C. The Raman spectra also show the bands at 738 and 1047 cm−1 distinctive to β-Ca2P2O7 (ref. 43 and 44) and 776 cm−1 ascribed to the α-Ca2P2O7 structure.44,45 Overall, it can be concluded that FTIR and Raman data correlate well with the XRD results.
The 1H, 31P MAS and 1H–31P CP MAS spectra of the Mg-WH samples are shown in Fig. 7. The spectra of the as-prepared Mg-WH powder look similar to those previously reported for magnesium and zinc whitlockites.25,26 The 1H spectrum consists mainly of a spectral line at 9.8 ppm, which is attributed to the HPO42− moiety in the Mg-WH crystal structure. The 31P MAS spectrum consists of the lines at 1.98, 1.14 and −0.50 ppm attributed to P(2), HP(1)O42− and P(3) moieties, respectively. In addition, a broad line at 0.47 ppm is observed, which is attributed to distorted phosphate moieties also previously detected for Zn-WH.25 The line attributed to distorted phosphates decreases in intensity significantly upon annealing, and thus the 31P MAS spectrum looks more resolved. The same lines are observed in the 1H–31P CP MAS spectrum; however, the line at 1.14 ppm is more intense due to the close proximity of phosphorous to 1H in the HPO42− moiety. The obvious changes in the NMR spectra upon annealing appear at 700 °C. The line attributed to the HPO42− moiety in the 1H MAS spectrum drops in intensity significantly, which shows that the Mg-WH structure is disrupted. This line gradually vanishes upon increasing the annealing temperature to 1300 °C.
 | ||
| Fig. 7 1H MAS, 31P MAS and 1H–31P CP MAS spectra obtained for Mg-WH samples annealed at different temperatures. The spectra corresponding to the detected changes in crystal structures are colored. | ||
In the 31P MAS and 1H–31P CP MAS spectra corresponding to the annealing temperature of 700 °C, the spectral lines attributed to β-TCP and α-Ca2P2O7 (−8.01 and −10.32 ppm) start to emerge (Fig. 7). It is worth noting that Ca2P2O7 polymorphs have no signals in the range from 8 to −4 ppm; therefore, all spectral changes in this region are attributed to the transformation of Mg-WH to Mg-substituted β-TCP.34 For better visibility, the 31P MAS spectra, where the spectral changes were detected, are highlighted in Fig. 8. The lines attributed to Mg-WH completely vanished after annealing at 1200 °C and only the lines attributed to Mg-substituted β-TCP (5.56, 2.90, 1.19, 0.27, −0.37, −2.22 ppm) are seen in the spectral region between 8 and −4 ppm.46 The α-Ca2P2O7 polymorph is transformed into β-Ca2P2O7 (−7.34, −8.15, −8.90, −10.34 ppm) at 800 °C, then back to α-Ca2P2O7 at 1200 °C and ultimately only unresolved traces of Ca2P2O7 are seen after the treatment at 1300 °C (Fig. 7 and 8). The observed trend is similar to those previously described for other techniques.
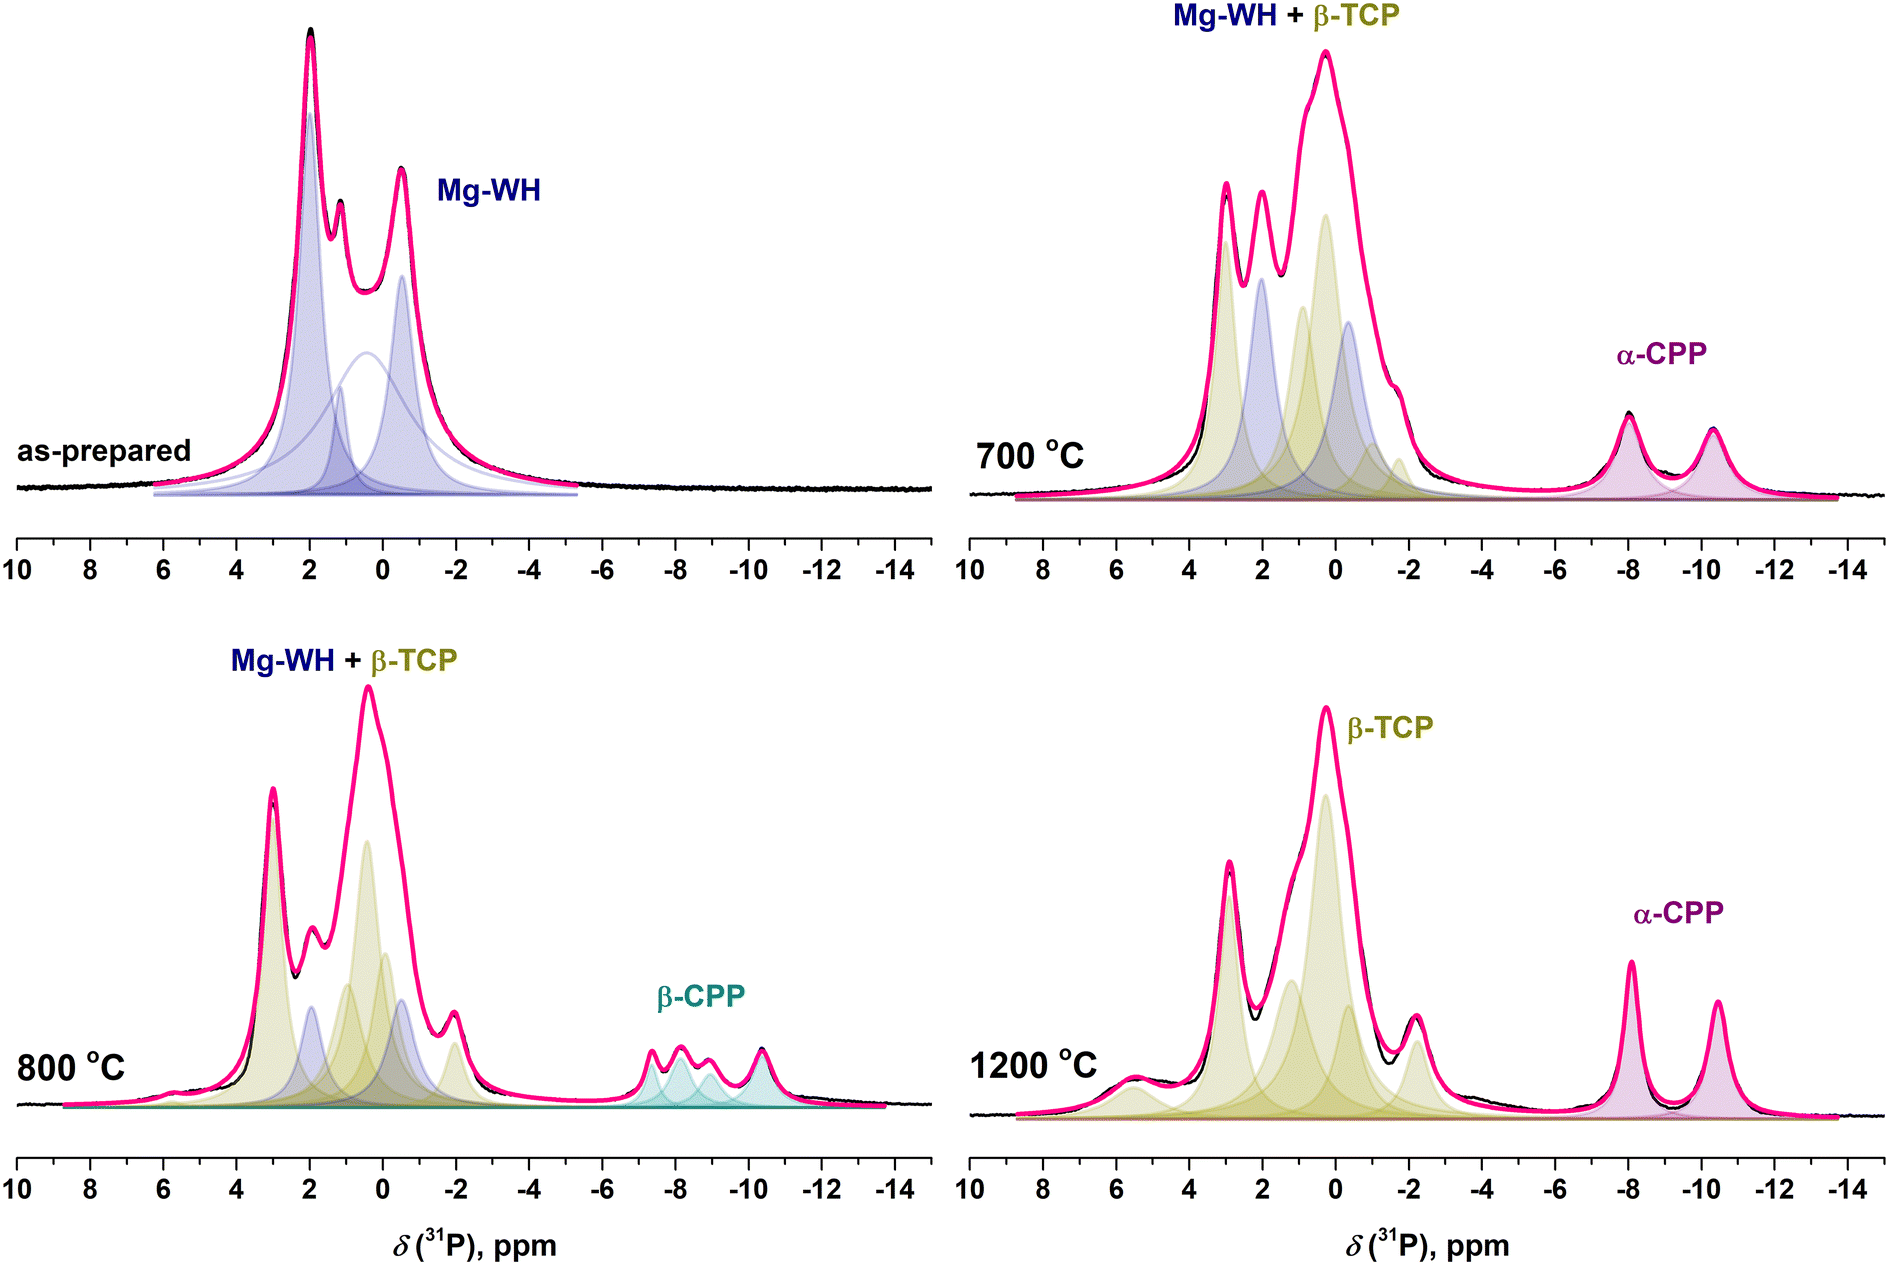 | ||
| Fig. 8 Selected 31P MAS spectra of the as-prepared and annealed Mg-WH samples; annealing temperatures are indicated in the figure. Signals referring to the Mg-WH phase are indicated in blue, to Mg-substituted β-TCP in dark yellow, to α-Ca2P2O7 in purple and to β-Ca2P2O7 in dark cyan. Cumulative fit is indicated in pink. | ||
In order to justify the spectral fitting in Fig. 8, 31P–31P 1Q–2Q spectra were obtained for the samples annealed at various temperatures (Fig. 9) and typical correlations referring to Mg-WH and Mg-substituted β-TCP species were assigned.
 | ||
| Fig. 9 Selected 31P–31P 1Q–2Q spectra of the as-prepared and annealed Mg-WH samples; annealing temperatures are indicated in the figure. Correlations referring to the Mg-WH phase are indicated in blue and to Mg-substituted β-TCP in dark yellow. | ||
The representative SEM micrographs of the Mg-WH samples annealed at different temperatures are given in Fig. 10. The size of the particles increased with increasing annealing temperature; however, agglomerated individual particles can still be seen after annealing at 500 °C. After annealing at 600 °C, the individual particles were hardly distinguishable due to the sintering. Finally, after the heat treatment at 700 °C the porous monoliths without visible grain boundaries were formed; however, as was mentioned above, this drastic change in the morphology is accompanied by the start of the thermal degradation of Mg-WH. The morphological changes correlate very well with the sharpening of diffraction peaks in the XRD patterns (Fig. S3†).
 | ||
| Fig. 10 SEM micrographs of Mg-WH powders annealed at 400 °C (a), 500 °C (b), 600 °C (c) and 700 °C (d). | ||
Taking into account the limitations of employed methods, it can be concluded that the results of all characterization techniques on the thermal degradation of Mg-WH correlate very well. All methods indicated the partial decomposition of Mg-WH accompanied by the formation of the secondary phase at ca. 700 °C. The presence of a negligible amount of HPO42− structural unit was observed up to 1200 °C suggesting the co-existence of both Mg-WH and Mg-substituted β-TCP phases in a wide temperature range. NMR was found to be the most suitable technique for the detection of Mg-WH to Mg-substituted β-TCP structural transformation.
4. Conclusions
In this study, single-phase Mg-WH nanoparticles were successfully synthesized through the dissolution–precipitation process under hydrothermal conditions. Thermally induced degradation and phase transformations of the synthesized powders were investigated in detail by combining XRD analysis, FTIR and Raman spectroscopy as well as 1H and 31P NMR. It was found that the degradation of Mg-WH upon annealing and its conversion to Mg-substituted β-TCP and Ca2P2O7 occur gradually with an increase of annealing temperature. All employed methods indicated that the decomposition of Mg-WH starts at ca. 700 °C. The presence of a negligible amount of HPO42−, which belongs exclusively to the Mg-WH structure, was observed up to 1200 °C suggesting the co-existence of both Mg-WH and Mg-substituted β-TCP phases in a wide temperature range. Although all the techniques were found to be suitable for the observation of the appearance of the Ca2P2O7 phase, 31P NMR was found to be the most straightforward technique for the detection of Mg-WH to Mg-substituted β-TCP structural transformation. The obtained results suggest that the fabrication of phase-pure Mg-WH bioceramics does not seem to be achievable by conventional high-temperature methods; however, the fabrication of Mg-WH-containing multi-phase ceramics could be possible.Conflicts of interest
There are no conflicts to declare.Acknowledgements
This research was funded by a grant WHITCERAM (No. S-LJB-22-1) from the Research Council of Lithuania and supported by the Joint Research Projects under the Bilateral Program (JSPS), RCL JSPS, No. 120224202. The research done in the University of Aveiro was supported by the project CICECO-Aveiro Institute of Materials, UIDB/50011/2020, UIDP/50011/2020 & LA/P/0006/2020, financed by national funds through the FCT/MEC (PIDDAC). V. K., V. B., and G. N. gratefully acknowledge the Center of Spectroscopic Characterization of Materials and Electronic/Molecular Processes (SPECTROVERSUM Infrastructure) for the use of Raman and NMR spectrometers. The authors sincerely acknowledge Dr. Justina Gaidukevic (Vilnius University) for technical assistance.References
- S. V. Dorozhkin, Biomatter, 2011, 1, 121–164 CrossRef PubMed.
- W. Habraken, P. Habibovic, M. Epple and M. Bohner, Mater. Today, 2016, 19, 69–87 CrossRef CAS.
- Y. Pang, D. Li, J. Zhou, X. Liu, M. Li, Y. Zhang, D. Zhang, X. Zhang and Q. Cai, Biomed. Mater., 2022, 17, 065020 CrossRef PubMed.
- H. L. Jang, G. B. Zheng, J. Park, H. D. Kim, H.-R. Baek, H. K. Lee, K. Lee, H. N. Han, C.-K. Lee, N. S. Hwang, J. H. Lee and K. T. Nam, Adv. Healthcare Mater., 2016, 5, 128–136 CrossRef CAS PubMed.
- I. Manjubala, M. Sivakumar, R. V. Sureshkumar and T. P. Sastry, J. Biomed. Mater. Res., 2002, 63, 200–208 CrossRef CAS PubMed.
- R. A. Surmenev, I. Y. Grubova, E. Neyts, A. D. Teresov, N. N. Koval, M. Epple, A. I. Tyurin, V. F. Pichugin, M. V. Chaikina and M. A. Surmeneva, Surf. Interfaces, 2020, 21, 100727 CrossRef CAS.
- H. L. Jang, K. Jin, J. Lee, Y. Kim, S. H. Nahm, K. S. Hong and K. T. Nam, ACS Nano, 2014, 8, 634–641 CrossRef CAS PubMed.
- H. Cheng, R. Chabok, X. Guan, A. Chawla, Y. Li, A. Khademhosseini and H. L. Jang, Acta Biomater., 2018, 69, 342–351 CrossRef CAS PubMed.
- F. A. Shah, Acta Biomater., 2021, 125, 72–82 CrossRef CAS PubMed.
- J. Jeong, J. H. Shim, B. M. Koo, Y. B. Choy and C. Y. Heo, Tissue Eng. Regener. Med., 2022, 19, 83–92 CrossRef CAS PubMed.
- Y. Yang, H. Wang, H. Yang, Y. Zhao, J. Guo, X. Yin, T. Ma, X. Liu and L. Li, ACS Biomater. Sci. Eng., 2020, 6, 5785–5796 CrossRef CAS PubMed.
- H. D. Kim, H. L. Jang, H.-Y. Ahn, H. K. Lee, J. Park, E.-s. Lee, E. A. Lee, Y.-H. Jeong, D.-G. Kim, K. T. Nam and N. S. Hwang, Biomaterials, 2017, 112, 31–43 CrossRef CAS PubMed.
- V. K. Kaliannagounder, N. P. M. J. Raj, A. R. Unnithan, J. Park, S. S. Park, S.-J. Kim, C. H. Park, C. S. Kim and A. R. K. Sasikala, Nano Energy, 2021, 85, 105901 CrossRef CAS.
- L. Wang, Y. Pang, Y. Tang, X. Wang, D. Zhang, X. Zhang, Y. Yu, X. Yang and Q. Cai, Bioact. Mater., 2023, 25, 399–414 CrossRef CAS PubMed.
- C. Wang, K.-J. Jeong, H. J. Park, M. Lee, S.-C. Ryu, D. Y. Hwang, K. H. Nam, I. H. Han and J. Lee, J. Colloid Interface Sci., 2020, 569, 1–11 CrossRef CAS PubMed.
- A. Afonina, A. Kizalaite, A. Zarkov, A. Drabavicius, T. Goto, T. Sekino, A. Kareiva and I. Grigoraviciute-Puroniene, Ceram. Int., 2022, 48, 32125–32130 CrossRef CAS.
- H. L. Jang, H. K. Lee, K. Jin, H.-Y. Ahn, H.-E. Lee and K. T. Nam, J. Mater. Chem. B, 2015, 3, 1342–1349 RSC.
- W.-B. Lee, C. Wang, J.-H. Lee, K.-J. Jeong, Y.-S. Jang, J.-Y. Park, M. H. Ryu, U.-K. Kim, J. Lee and D.-S. Hwang, ACS Appl. Bio Mater., 2020, 3, 7762–7768 CrossRef CAS PubMed.
- X. Guo, X. Liu, H. Gao, X. Shi, N. Zhao and Y. Wang, J. Mater. Sci. Technol., 2018, 34, 1054–1059 CrossRef CAS.
- X. Zhang, W. Liu, J. Liu, Y. Hu and H. Dai, ACS Biomater. Sci. Eng., 2021, 7, 3321–3331 CrossRef CAS PubMed.
- S. Amirthalingam, S. S. Lee, M. Pandian, J. Ramu, S. Iyer, N. S. Hwang and R. Jayakumar, Biomater. Sci., 2021, 9, 2439–2453 RSC.
- R. Gopal, C. Calvo, J. Ito and W. K. Sabine, Can. J. Chem., 1974, 52, 1155–1164 CrossRef CAS.
- T. Konishi and S. Watanabe, Phosphorus Res. Bull., 2021, 37, 1–10 CrossRef CAS.
- R. Gopal and C. Calvo, Nat. Phys. Sci., 1972, 237, 30–32 CrossRef CAS.
- A. Kizalaite, V. Klimavicius, J. Versockiene, E. Lastauskiene, T. Murauskas, R. Skaudzius, T. Yokoi, M. Kawashita, T. Goto, T. Sekino and A. Zarkov, CrystEngComm, 2022, 24, 5068–5079 RSC.
- T. Konishi and S. Watanabe, Phosphorus Res. Bull., 2021, 37, 21–25 CrossRef CAS.
- T. Konishi and S. Watanabe, Phosphorus Res. Bull., 2022, 38, 18–24 CrossRef CAS.
- C. Gervais, C. Bonhomme and D. Laurencin, Solid State Nucl. Magn. Reson., 2020, 107, 101663 CrossRef CAS PubMed.
- V. Klimavicius, A. Maršalka, A. Kizalaite, A. Zarkov, A. Kareiva, K. Aidas, J. Hirschinger and V. Balevicius, Phys. Chem. Chem. Phys., 2022, 24, 18952–18965 RSC.
- F. Capitelli, F. Bosi, S. C. Capelli, F. Radica and G. Della Ventura, Crystals, 2021, 11, 225 CrossRef CAS.
- M. Feike, D. E. Demco, R. Graf, J. Gottwald, S. Hafner and H. W. Spiess, J. Magn. Reson., Ser. A, 1996, 122, 214–221 CrossRef CAS.
- A. Kizalaite, I. Grigoraviciute-Puroniene, D. R. C. Asuigui, S. L. Stoll, S. H. Cho, T. Sekino, A. Kareiva and A. Zarkov, ACS Biomater. Sci. Eng., 2021, 7, 3586–3593 CrossRef CAS PubMed.
- K. S. W. Sing, Pure Appl. Chem., 1985, 57, 603–619 CrossRef CAS.
- D. Griesiute, E. Garskaite, A. Antuzevics, V. Klimavicius, V. Balevicius, A. Zarkov, A. Katelnikovas, D. Sandberg and A. Kareiva, Sci. Rep., 2022, 12, 7116 CrossRef CAS PubMed.
- R. A. Van Santen, J. Phys. Chem., 1984, 88, 5768–5769 CrossRef CAS.
- K. Matsunaga, T. Kubota, K. Toyoura and A. Nakamura, Acta Biomater., 2015, 23, 329–337 CrossRef CAS PubMed.
- L. Sinusaite, A. Kareiva and A. Zarkov, Cryst. Growth Des., 2021, 21, 1242–1248 CrossRef CAS.
- R. Enderle, F. Götz-Neunhoeffer, M. Göbbels, F. A. Müller and P. Greil, Biomaterials, 2005, 26, 3379–3384 CrossRef CAS PubMed.
- J. C. Araújo, M. S. Sader, E. L. Moreira, V. C. A. Moraes, R. Z. LeGeros and G. A. Soares, Mater. Chem. Phys., 2009, 118, 337–340 CrossRef.
- M. Maciejewski, T. J. Brunner, S. F. Loher, W. J. Stark and A. Baiker, Thermochim. Acta, 2008, 468, 75–80 CrossRef CAS.
- D. Griesiute, E. Raudonyte-Svirbutaviciene, A. Kareiva and A. Zarkov, CrystEngComm, 2022, 24, 1166–1170 RSC.
- L. Sinusaite, A. Popov, A. Antuzevics, K. Mazeika, D. Baltrunas, J.-C. Yang, J. L. Horng, S. Shi, T. Sekino, K. Ishikawa, A. Kareiva and A. Zarkov, Mater. Sci. Eng., C, 2020, 112, 110918 CrossRef CAS PubMed.
- V. C. Ghantani, M. K. Dongare and S. B. Umbarkar, RSC Adv., 2014, 4, 33319–33326 RSC.
- P. Gras, C. Rey, O. Marsan, S. Sarda and C. Combes, Eur. J. Inorg. Chem., 2013, 2013, 5886–5895 CrossRef CAS.
- B. C. Cornilsen and R. A. Condrate, J. Inorg. Nucl. Chem., 1979, 41, 602–605 CrossRef CAS.
- E. Boanini, M. Gazzano, C. Nervi, M. R. Chierotti, K. Rubini, R. Gobetto and A. Bigi, J. Funct. Biomater., 2019, 10, 20 CrossRef CAS PubMed.
Footnote |
| † Electronic supplementary information (ESI) available. See DOI: https://doi.org/10.1039/d3ce00602f |
| This journal is © The Royal Society of Chemistry 2023 |