 Open Access Article
Pirfenidone–flavonoid cocrystals with reduced solubility and dissolution rate†
Lingshan
Meng
ab,
Duanxiu
Li
 bc,
Yujing
Zhu
b,
Jianming
Wang
d,
Zongwu
Deng
 b and
Hailu
Zhang
 *ab
*ab
aNano Science and Technology Institute, University of Science and Technology of China, Suzhou 215123, P. R. China
bLaboratory of Pharmaceutical Solid-State Chemistry, Suzhou Institute of Nano-Tech and Nano-Bionics, Chinese Academic of Sciences, Suzhou 215123, P. R. China. E-mail: hlzhang2008@sinano.ac.cn; Fax: +86 512 62603079; Tel: +86 512 62872713
cGuangdong Institute of Semiconductor Micro-Nano Manufacturing Technology, Foshan 528200, P. R. China
dCrystal Formulation Services, Suzhou 215127, P. R. China
First published on 15th August 2023
Abstract
Pirfenidone (PFD) is an orally administered medication used for the treatment of idiopathic pulmonary fibrosis. PFD has excessive solubility and high daily dosage. A sustained-release solid form of PFD is desired to improve the rapid absorption and elimination of this highly soluble drug, as well as dose related side effects. Ketone⋯hydroxyl (C![[double bond, length as m-dash]](https://www.rsc.org/images/entities/char_e001.gif) O⋯H–O) hydrogen bonding was employed as a heterosynthon for pharmaceutical cocrystal design. And two PFD–flavonoid cocrystals, PFD–hesperetin (PFD–HES, 1
O⋯H–O) hydrogen bonding was employed as a heterosynthon for pharmaceutical cocrystal design. And two PFD–flavonoid cocrystals, PFD–hesperetin (PFD–HES, 1![[thin space (1/6-em)]](https://www.rsc.org/images/entities/char_2009.gif) :
:![[thin space (1/6-em)]](https://www.rsc.org/images/entities/char_2009.gif) 1) and PFD–genistein (PFD–GEN, 2
1) and PFD–genistein (PFD–GEN, 2![[thin space (1/6-em)]](https://www.rsc.org/images/entities/char_2009.gif) :
:![[thin space (1/6-em)]](https://www.rsc.org/images/entities/char_2009.gif) 1), were successfully obtained here. These two cocrystals were characterized by single crystal and powder X-ray diffraction (XRD), Fourier transform infrared spectroscopy (FTIR), differential scanning calorimetry (DSC), thermogravimetric analysis (TGA), and dynamic vapor sorption (DVS). Dissolution studies revealed that cocrystals have significantly reduced solubility and intrinsic dissolution rate (IDR) by orders of magnitude in pH 1.2 and 6.8 media, which would provide positive contribution to better drug performance of PFD.
1), were successfully obtained here. These two cocrystals were characterized by single crystal and powder X-ray diffraction (XRD), Fourier transform infrared spectroscopy (FTIR), differential scanning calorimetry (DSC), thermogravimetric analysis (TGA), and dynamic vapor sorption (DVS). Dissolution studies revealed that cocrystals have significantly reduced solubility and intrinsic dissolution rate (IDR) by orders of magnitude in pH 1.2 and 6.8 media, which would provide positive contribution to better drug performance of PFD.
Introduction
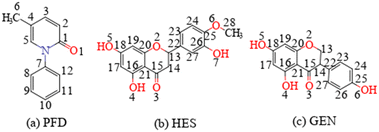
Pharmaceutical cocrystals, crystalline single-phase complexes composed of an active pharmaceutical ingredient (API) and a cocrystal former (coformer) in a definite stoichiometric ratio held together via noncovalent interactions, are indispensable members of the solid form family of APIs due to their powerful ability to enhance physicochemical and pharmacokinetic properties of pure drug compounds.1–4 Among the various application scenarios of pharmaceutical cocrystals, solubilization and dissolution rate enhancement should be the most frequently mentioned topics for about 40% of marketed drugs, and 80–90% drug candidates have low solubility, which hinders satisfactory in vivo absorption and bioavailability.5–8 Solubilities and dissolution rates are positively related, though they are thermodynamic parameters and kinetic concepts, respectively.9,10 Thus, these two topics are often discussed together. In contrast to the above applications, some orally administered pharmaceuticals with excessive solubility (much greater than 1 mg mL−1) require a reduced solubility and dissolution rate to improve their pharmacokinetic behaviour.11–14 For example, sulfacetamide (12.5 mg mL−1 in pH 7.0 buffer) can form a cocrystal with caffeine. The reduced solubility and dissolution rate of the cocrystal are beneficial to address the poor residence time and faster elimination issues of the parent drug.12The API discussed in this study, pirfenidone (PFD, Scheme 1a), faces a similar problem. PFD is an orally administered medication used for the treatment of idiopathic pulmonary fibrosis.15 PFD has a solubility of ca. 20 mg mL−1. Its rapid absorption and short elimination half-life indicate suboptimal bioavailability.16 The recommended daily dosage of PFD is also high (2403 mg), which will cause severe side effects.16,17 A sustained-release formulation is believed to be able to maintain plasma concentration over a longer duration of time, thereby increasing bioavailability and reducing dosage (or dosing frequency) and dose related side effects.16–19
Recently, two cocrystals of PFD with fumaric acid and trimesic acid were reported by A. Ghosh.18 These forms exhibit drastically reduced solubility and dissolution rates, and have the potential to be developed as sustained release formulations.17,18 For these cocrystals, a ketone⋯carboxylic acid interaction was employed as a heterosynthon for cocrystal design. Phenolic hydroxyl is another typical proton donor group, and often demonstrates higher molecular electrostatic potential extremum than the carboxylic acid group.20 Therefore, two polyphenolic flavonoid compounds, hesperetin (HES, Scheme 1b) and genistein (GEN, Scheme 1c), were selected as coformers in this contribution. The lower solubility of flavonoids21,22 would likely produce PFD cocrystals with a reduced solubility and dissolution rate.23
Experimental
Materials and reagents
PFD (≥99%) was obtained from Shanghai Haohong Biomedical Technology Co., Ltd. HES (≥97%) and analytical grade solvents were purchased from Shanghai Titan Scientific Co., Ltd. GEN (≥98%) was sourced from Dalian Meilun Biological Technology Co., Ltd. All chemicals were used as received without further purification.Preparation of a PFD–HES cocrystal (1![[thin space (1/6-em)]](https://www.rsc.org/images/entities/h3_char_2009.gif) :
:![[thin space (1/6-em)]](https://www.rsc.org/images/entities/h3_char_2009.gif) 1)
1)
A powder sample of PFD–HES was obtained through the slurry method. A mixture of PFD (92.5 mg, 0.5 mmol) and HES (60.8 mg, 0.2 mmol) was suspended in 5 mL of water and stirred at room temperature for 72 h. The resulting solid sample was isolated and dried in a vacuum drying oven at 37 °C overnight.
The powder cocrystal was dissolved in a mixed solvent of water and methanol (1![[thin space (1/6-em)]](https://www.rsc.org/images/entities/char_2009.gif) :
:![[thin space (1/6-em)]](https://www.rsc.org/images/entities/char_2009.gif) 1, v/v). The resulting solution was evaporated slowly at room temperature. Light yellow block-shaped crystals were harvested after 4 days.
1, v/v). The resulting solution was evaporated slowly at room temperature. Light yellow block-shaped crystals were harvested after 4 days.
Preparation of a PFD–GEN cocrystal (2![[thin space (1/6-em)]](https://www.rsc.org/images/entities/h3_char_2009.gif) :
:![[thin space (1/6-em)]](https://www.rsc.org/images/entities/h3_char_2009.gif) 1)
1)
A powder sample of PFD–GEN was synthesized using the same protocol as PFD–HES. For single crystal preparation, the powder sample of PFD–GEN was dissolved in EtOAc and left to evaporate slowly at room temperature. Colourless block-shaped crystals were obtained after 4 days.
Single crystal X-ray diffraction (single crystal XRD)
Single crystal XRD data of PFD–HES and PFD–GEN were collected on a Bruker D8 VENTURE diffractometer using Mo Kα radiation (λ = 0.71073 Å) at 200 K and Cu Kα radiation (λ = 1.54178 Å) at 273 K, respectively. The structure was solved by direct methods using the Olex2 program,24 and refined with the full matrix least-squares method. Hydrogen atoms on oxygen were found from difference electron density maps, and all C bonded hydrogen atoms were fixed geometrically at calculated positions. The non-H atoms were refined anisotropically. For PFD–HES, HES displayed positional disorder at the chiral center, and the relative ratio was refined to 0.15/0.85. The crystallographic data are given in Table 1. Hydrogen bond parameters of the cocrystals are summarized in Table 2.| Name | PFD–HES | PFD–GEN |
|---|---|---|
| Formula | C28H25NO7 | C39H32O7N2 |
| Formula weight | 487.49 | 640.68 |
| Temperature/K | 200 | 273 |
| Crystal system | Orthorhombic | Monoclinic |
| Space group | Pbca | Cc |
| a/Å | 16.0415 (10) | 18.9053 (6) |
| b/Å | 6.6425 (4) | 8.2831 (2) |
| c/Å | 44.992 (3) | 20.9395 (5) |
| α/° | 90 | 90 |
| β/° | 90 | 98.594 (2) |
| γ/° | 90 | 90 |
| Volume/Å3 | 4794.2 (5) | 3242.19 (15) |
| Z | 8 | 4 |
| D/g cm−3 | 1.351 | 1.313 |
| Total no. of reflns | 4864 | 6267 |
| Unique no. of reflns | 3666 | 5684 |
| No. of parameters | 337 | 443 |
| R int | 0.0707 | 0.0675 |
| GOF | 1.070 | 1.127 |
| μ/mm−1 | 0.098 | 0.740 |
| F(000) | 2048 | 1344 |
| θ range/° | 1.559–26.399 | 4.271–72.806 |
| R 1[I > 2σ(I)]/R1 | 0.0670/0.0878 | 0.0566/0.0604 |
| wR2[I > 2σ(I)]/wR2 | 0.1828/0.1960 | 0.1742/0.1822 |
| CCDC no. | 2234187 | 2217636 |
| D–H⋯A | H⋯A (Å) | D⋯A (Å) | D–H⋯A (deg) | Symmetry codes |
|---|---|---|---|---|
| PFD−HES | ||||
| O7–H7⋯O1 | 1.71 | 2.629 (3) | 169 | x, 1 + y, z |
| O4–H4⋯O3 | 1.67 | 2.587 (3) | 149 | |
| O5–H5⋯O3 | 1.62 | 2.665 (2) | 174 | −1/2 + x, 1/2 − y, 1 − z |
| PFD−GEN | ||||
| O6–H6⋯O1A | 1.72 (8) | 2.678 (5) | 169 (7) | |
| O5–H5⋯O1B | 1.82 | 2.628 (5) | 170 | x, 2 − y, 1/2 + z |
| O4–H4⋯O3 | 1.63 (7) | 2.601 (4) | 162 (7) | |
Powder X-ray diffraction (powder XRD)
Powder XRD patterns were collected on a Bruker D8 Advance X-ray powder diffractometer. Cu Kα radiation with a wavelength of 1.5406 Å was used as the X-ray source. The tube current and voltage of the generator were 40 mA and 40 kV, respectively. The diffraction data were collected over a 2θ range of 3 to 40°, with a step size of 0.02° at room temperature.Differential scanning calorimetry (DSC) and thermogravimetric analysis (TGA)
DSC measurements were conducted using a TA Discovery 250 differential scanning calorimeter. An accurately weighed sample (3–5 mg) was placed in a sealed aluminium pan and heated from 30 °C until melted at a scan rate of 10 °C min−1 under a nitrogen gas flow of 50 mL min−1. TGA was performed using a Mettler Toledo TGA 2 system. The sample was placed in a ceramic alumina pan and heated from 30 °C until decomposed at a scan rate of 10 °C min−1 under a nitrogen gas flow of 20 mL min−1.Fourier transform infrared spectroscopy (FTIR)
FTIR spectra were measured on a Nicolet 6700 IR spectrometer. The sample was mixed with potassium bromide and compressed into a translucent disc at a pressure of 20 MPa. The data were collected over the wavenumber range from 400 cm−1 to 4000 cm−1 with a resolution of 2 cm−1.Intermolecular interaction energy calculation
CrystalExplorer software (version 21.5) was used to calculate the pairwise intermolecular interaction energy in PFD and two cocrystals at the B3LYP/6-31G(d,p) level.25 For PFD–HES, the minor disorder part was removed before the calculation. The molecule–molecule distances of calculated pairs are all within 3.8 Å. The total interaction energy is divided into four parts, namely electrostatic, polarization, dispersion, and exchange–repulsion terms with scale factors of 1.057, 0.740, 0.871, and 0.618, respectively.Dynamic vapor sorption (DVS)
The humidity-dependent hygroscopicity of PFD and cocrystals were tested on a DVS Intrinsic dynamic gravimetric water sorption analyser (SMS Ltd., London, UK) at 25.0 °C. About 20 mg of each sample was placed in a quartz sample pan and the relative humidity (RH) varied from 0% to 95% and then to 0% with a step size of 5% RH. The equilibration criterion of each step is either dm/dt ≤ 0.002% per min or a maximum equilibration time of 3 h.High performance liquid chromatography (HPLC)
The PFD concentrations were measured using a Waters 2535 HPLC system with a GraceSmart RP C18 column (4.6 mm × 250 mm, 5 μm). A mixture of water and acetonitrile (45![[thin space (1/6-em)]](https://www.rsc.org/images/entities/char_2009.gif) :
:![[thin space (1/6-em)]](https://www.rsc.org/images/entities/char_2009.gif) 55, V/V) was used as a mobile phase with a flow rate of 1.0 mL min−1 at 37 °C. The injection volume was 10 μL. The absorbance was monitored at a wavelength of 231 nm using a photodiode array detector at 37 °C.
55, V/V) was used as a mobile phase with a flow rate of 1.0 mL min−1 at 37 °C. The injection volume was 10 μL. The absorbance was monitored at a wavelength of 231 nm using a photodiode array detector at 37 °C.
Equilibrium solubility of PFD and cocrystal eutectic solubility
The equilibrium solubility of PFD and cocrystal eutectic solubilities were tested in pH 1.2 HCl solution and pH 6.8 phosphate buffer using the shake flask method. An excess amount of each sample (PFD: 200 mg; cocrystal: 132 mg of PFD–HES, 87 mg of PFD–GEN, corresponding to 50 mg of PFD) was added to 5 mL of dissolution medium, and treated at 37 °C for 72 h. Less cocrystal samples (corresponding to 50 mg of PFD, rather than 200 mg) were used because these forms clearly demonstrated decreased solubility. After equilibrium, 1 mL of solution was withdrawn and filtered for HPLC analysis. Three parallel experiments were performed to reduce accidental errors. The solid residues after the equilibrium solubility tests were collected and analysed by powder XRD. The pH value of the dissolution medium after the solubility test was also measured (ESI,† Table S1).Intrinsic dissolution rate (IDR)
The IDRs of PFD and two cocrystals were measured on paddle apparatus (RC-6, Tianguang Optical Instruments Co., Ltd.). 400 mg of each sample was compressed at 200 MPa for 1 min to obtain a test tablet (Φ = 10 mm). The tablet was wrapped in parafilm, leaving only one surface exposed. Dissolution was performed in 500 mL of pH 1.2 HCl solution or pH 6.8 phosphate buffer medium at a paddle speed and water bath temperature of 100 rpm and 37 ± 0.2 °C, respectively. At predetermined time intervals (10 min), 1.0 mL of aliquot was extracted, filtered, and analysed by HPLC. The IDR test for each sample was performed in triplicate.Results and discussion
Single crystal structure analysis
![[thin space (1/6-em)]](https://www.rsc.org/images/entities/b_char_2009.gif) :
:![[thin space (1/6-em)]](https://www.rsc.org/images/entities/b_char_2009.gif) 1) cocrystal.
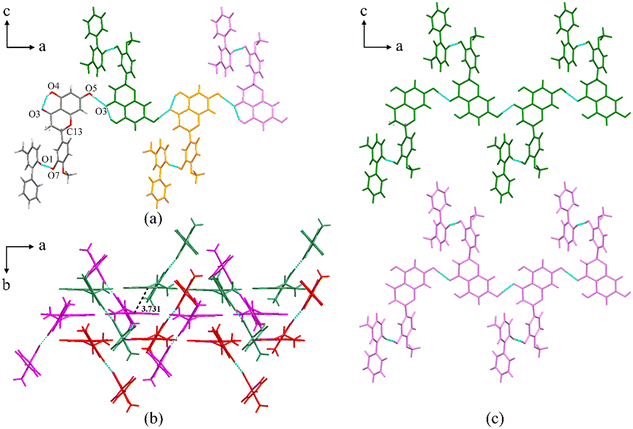
PFD–HES crystallizes in the orthorhombic crystal system with the space group Pbca (Z = 8). Each asymmetric unit consists of one PFD molecule and one HES molecule linked through an O7–H7⋯O1 interaction (Fig. 1a, coloured by element). For HES, a conservative intramolecular hydrogen bond, O4–H4⋯O3, is present, which also exists in crystal structures of HES26 and reported HES cocrystals.27–29 Positional disorders exist on the chiral center of HES, indicating that two different enantiomers can substitute mutually at the same asymmetric position. Along the a-axis, the asymmetric unit is infinitely expanded via O5–H5⋯O3, forming a one-dimensional (1D) molecular chain structure (Fig. 1a). Along the b-axis, the molecular chains are stacked in an antiparallel manner (Fig. 1b). And π⋯π interactions between the adjacent chains (centroid to centroid distance: 3.731 Å) can be detected (Fig. 1b). Along the c-axis, the molecular chains are arranged parallelly (Fig. 1c), forming a 2D molecular sheet. Thus, the whole 3D structure is formed through the 1D molecular chain assembling along two orthogonal directions.
1) cocrystal.
PFD–HES crystallizes in the orthorhombic crystal system with the space group Pbca (Z = 8). Each asymmetric unit consists of one PFD molecule and one HES molecule linked through an O7–H7⋯O1 interaction (Fig. 1a, coloured by element). For HES, a conservative intramolecular hydrogen bond, O4–H4⋯O3, is present, which also exists in crystal structures of HES26 and reported HES cocrystals.27–29 Positional disorders exist on the chiral center of HES, indicating that two different enantiomers can substitute mutually at the same asymmetric position. Along the a-axis, the asymmetric unit is infinitely expanded via O5–H5⋯O3, forming a one-dimensional (1D) molecular chain structure (Fig. 1a). Along the b-axis, the molecular chains are stacked in an antiparallel manner (Fig. 1b). And π⋯π interactions between the adjacent chains (centroid to centroid distance: 3.731 Å) can be detected (Fig. 1b). Along the c-axis, the molecular chains are arranged parallelly (Fig. 1c), forming a 2D molecular sheet. Thus, the whole 3D structure is formed through the 1D molecular chain assembling along two orthogonal directions.
![[thin space (1/6-em)]](https://www.rsc.org/images/entities/b_char_2009.gif) :
:![[thin space (1/6-em)]](https://www.rsc.org/images/entities/b_char_2009.gif) 1) cocrystal.
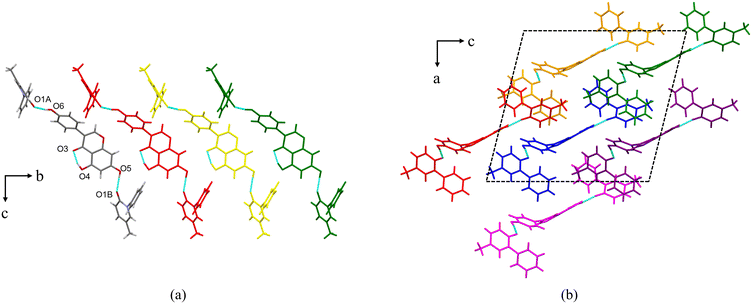
PFD–GEN crystallizes in the monoclinic crystal system with the space group Cc (Z = 4). Each asymmetric unit contains two PFD molecules and one GEN molecule (Fig. 2a, coloured by element). These three molecules are connected via O5–H5⋯O1B and O6–H6⋯O1A. Additionally, an intramolecular hydrogen bond, O4–H4⋯O3, is also present. For the two PFD molecules, the torsion angles (C1–N1–C7–C12) between two 6-member rings are ±58.65° and ±59.65°, which are smaller than that in PFD–HES (±70.52°) and close to that in the PFD crystal (52.23°/−51.99°, CSD refcode: KOMJOO and KOMJOO01). The two reported PFD structures (in the chiral P21 space group) are mirror-symmetric in the same crystal form. The geometry optimization for PFD at the B3LYP/6-31G(d) level (−51.91°) mentions that PFD conformations in the PFD crystal and PFD–GEN cocrystal are in relatively low energy states.
1) cocrystal.
PFD–GEN crystallizes in the monoclinic crystal system with the space group Cc (Z = 4). Each asymmetric unit contains two PFD molecules and one GEN molecule (Fig. 2a, coloured by element). These three molecules are connected via O5–H5⋯O1B and O6–H6⋯O1A. Additionally, an intramolecular hydrogen bond, O4–H4⋯O3, is also present. For the two PFD molecules, the torsion angles (C1–N1–C7–C12) between two 6-member rings are ±58.65° and ±59.65°, which are smaller than that in PFD–HES (±70.52°) and close to that in the PFD crystal (52.23°/−51.99°, CSD refcode: KOMJOO and KOMJOO01). The two reported PFD structures (in the chiral P21 space group) are mirror-symmetric in the same crystal form. The geometry optimization for PFD at the B3LYP/6-31G(d) level (−51.91°) mentions that PFD conformations in the PFD crystal and PFD–GEN cocrystal are in relatively low energy states.
Along the b-axis, the asymmetric units are arranged in parallel to form a molecular column structure (Fig. 2a and b). The columns are further inserted vertically into the ac plane to form the final 3D structure (Fig. 2b).
Intermolecular interaction energy
The above structural analyses provide qualitative pictures of the intermolecular interactions in the cocrystals. Energy calculations using the solved structures, on the other hand, can provide quantitative information (ESI,† Table S2–S7). For the PFD crystal, only two weak C–H⋯O intermolecular interactions exist.30 And the interaction energies of these two molecular pairs are −21.7 and −18.7 kJ mol−1, respectively (ESI,† Table S2). Such interactions are not the strongest ones in this structure. A pair of PFD molecules that are closest but not hydrogen-bonded interacts more strongly (−30.0 kJ mol−1), with the dispersion effect accounting for the majority of the interaction (ESI,† Table S2).Since phenolic hydroxyl groups have stronger proton donor capacity compared with C–H, the C![[double bond, length as m-dash]](https://www.rsc.org/images/entities/char_e001.gif) O⋯H–O hydrogen-bonded PFD/HES (−46.6 kJ mol−1, Fig. 1a, ESI,† Table S3) and PFD/GEN (−51.6/−50.5 kJ mol−1, Fig. 2a, ESI,† Table S5 and S6) pairs exhibit stronger interactions than the hydrogen-bonded PFD pairs in the PFD crystal. These data quantitatively support the availability of the ketone⋯hydroxyl supramolecular synthon. In the PFD, PFD–HES, and PFD–GEN structures, the total intermolecular interaction energies for each PFD molecule are −208.0 (ESI,† Table S2), −215.0 (ESI,† Table S3), and −231.3 kJ mol−1 (ESI,† Table S5 and S6), respectively. The enhanced interactions in the cocrystals make it more difficult for PFD to detach from the lattices, which may be beneficial for reducing the dissolution rate of PFD.
O⋯H–O hydrogen-bonded PFD/HES (−46.6 kJ mol−1, Fig. 1a, ESI,† Table S3) and PFD/GEN (−51.6/−50.5 kJ mol−1, Fig. 2a, ESI,† Table S5 and S6) pairs exhibit stronger interactions than the hydrogen-bonded PFD pairs in the PFD crystal. These data quantitatively support the availability of the ketone⋯hydroxyl supramolecular synthon. In the PFD, PFD–HES, and PFD–GEN structures, the total intermolecular interaction energies for each PFD molecule are −208.0 (ESI,† Table S2), −215.0 (ESI,† Table S3), and −231.3 kJ mol−1 (ESI,† Table S5 and S6), respectively. The enhanced interactions in the cocrystals make it more difficult for PFD to detach from the lattices, which may be beneficial for reducing the dissolution rate of PFD.
Powder XRD
Fig. 3 shows the simulated and experimental powder XRD patterns of the starting materials and two cocrystals. The experimental patterns of the cocrystal samples agree very well with the simulated patterns, indicating that the powder samples were successfully synthesized and have high physical purity. For PFD–HES, the feature diffraction peaks appear at 2θ = 3.94, 11.84, 14.53, 15.56, 16.44, 17.33, 22.14, and 25.90°. And PFD–GEN exhibits the Bragg diffraction signals at 2θ = 8.57, 11.71, 13.70, 17.14, 20.67, 21.97, 23.64, and 25.79°.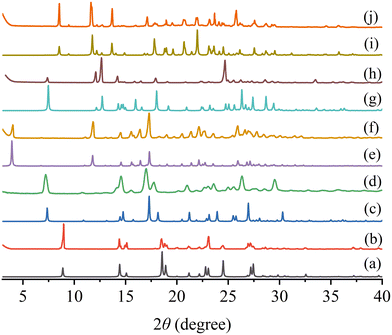 | ||
| Fig. 3 Simulated (a, c, e, g, and i) and experimental (b, d, f, h, and j) powder XRD patterns of PFD (a and b), HES (c and d), PFD–HES (e and f), GEN (g and h) and PFD–GEN (i and j). | ||
FTIR spectra analysis
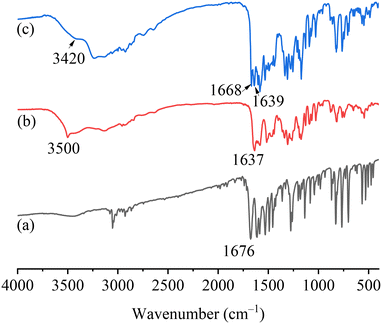
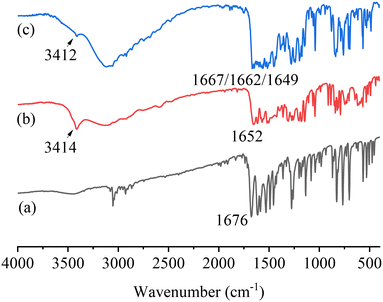
The FTIR spectra of PFD, HES, and PFD–HES are shown in Fig. 4. The PFD sample exhibits the C1![[double bond, length as m-dash]](https://www.rsc.org/images/entities/char_e001.gif) O1 stretching vibration at 1676 cm−1. For HES, the absorption peaks at 1637 and 3500 cm−1 can be assigned to the C15
O1 stretching vibration at 1676 cm−1. For HES, the absorption peaks at 1637 and 3500 cm−1 can be assigned to the C15![[double bond, length as m-dash]](https://www.rsc.org/images/entities/char_e001.gif) O3 and O–H stretching vibration, respectively. After cocrystal formation, the feature peaks of C1
O3 and O–H stretching vibration, respectively. After cocrystal formation, the feature peaks of C1![[double bond, length as m-dash]](https://www.rsc.org/images/entities/char_e001.gif) O1 (1668 cm−1) and O–H (3420 cm−1) have changed markedly, indicating the hydrogen bonding sites. The FTIR data provide information consistent with the solved PFD–HES structure. For PFD–GEN (Fig. 5), C1
O1 (1668 cm−1) and O–H (3420 cm−1) have changed markedly, indicating the hydrogen bonding sites. The FTIR data provide information consistent with the solved PFD–HES structure. For PFD–GEN (Fig. 5), C1![[double bond, length as m-dash]](https://www.rsc.org/images/entities/char_e001.gif) O1 also shifts the stretching vibration from 1676 to 1662/1667 cm−1, indicating the formation of stronger hydrogen bonding interactions.
O1 also shifts the stretching vibration from 1676 to 1662/1667 cm−1, indicating the formation of stronger hydrogen bonding interactions.
Thermal analysis
The DSC curves of the cocrystals and their starting materials are presented in Fig. 6. The melting points (Tms) of PFD, HES, and GEN are 109.6, 231.3, and 306.2 °C, respectively, which are all consistent with the reported data.18,31,32 For the two cocrystal samples, the endothermic melting signals appear at 116.4 and 137.8 °C, respectively. TGA curves of PFD and the two cocrystals are given in Fig. S1.† The cocrystal samples exhibit slightly higher decomposition temperature (Tds, 5% weight loss) than PFD (220/214 °C vs. 183 °C). The higher Tm/Td of each cocrystal compared to PFD is beneficial for its thermostability.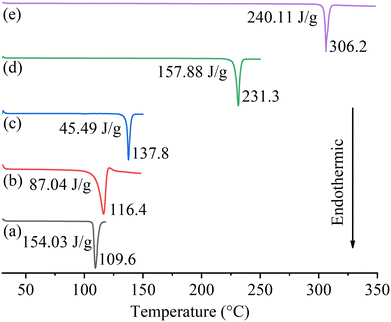 | ||
| Fig. 6 DSC curves of PFD (a), PFD–HES (b), PFD–GEN (c), HES (d), and GEN (e). The melting points and enthalpies of fusion are marked. | ||
Hygroscopicity
APIs will be exposed to various humid environments during storage and manufacture. Excessive moisture sorption will cause problems such as physical and chemical instability. Therefore, non-hygroscopic or slightly hygroscopic performance is highly desired. As shown in Fig. 7, PFD is a non-hygroscopic sample, and the moisture uptake is only 0.31% (w/w) even at 95% RH. The two cocrystal samples demonstrate slightly higher moisture uptakes (0.35%/0.32% at 95% RH). Meanwhile, such water contents also indicate that these samples are non-hygroscopic.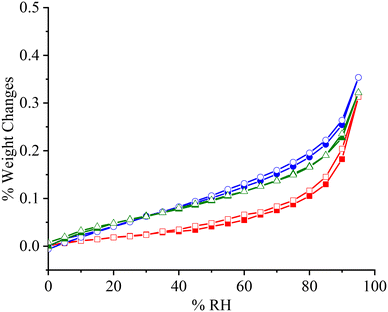 | ||
| Fig. 7 DVS curves of PFD (■, □), PFD–HES (●, ○), and PFD–GEN (▲, Δ). Solid symbol: moisture adsorption; hollow symbol: moisture desorption. | ||
PFD solubility/cocrystal eutectic solubility and dissolution studies
PFD is a highly soluble substance. Its equilibrium solubility in pH 1.2 and pH 6.8 media measured in our lab is 21.76 and 23.85 mg mL−1, respectively (Fig. 8). For PFD–HES, the PFD concentrations (4.98 and 4.41 mg mL−1) were significantly reduced after equilibration in the two test solutions. The solubility was reduced by 77% and 82%, respectively. For PFD–GEN, the solubility reduced more drastically (∼90%). The PFD concentrations after equilibration are 2.92 (pH 1.2) and 2.89 mg mL−1 (pH 6.8), respectively. As mentioned above, the decrease in the solubility of PFD in the cocrystal originates from the usage of less soluble flavonoid molecules. While due to the same reason, the inconsistency in solubility leads to the phase changes (partly transforms into the crystalline form of HES·H2O/GEN) after the solubility tests (ESI,† Fig. S2). Since the cocrystal and coformer solid phases are in equilibrium with the solution, the solubility values reported here correspond to the PFD concentrations of the eutectic points on the ternary phase diagrams. These values are different from stoichiometric solubilities.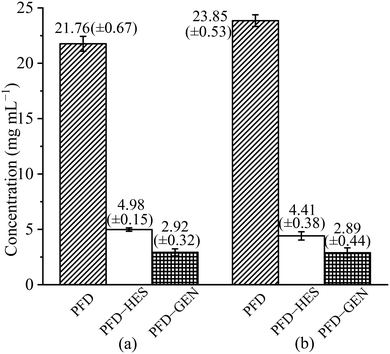 | ||
| Fig. 8 PFD solubility and cocrystal eutectic solubilities of PFD–HES and PFD–GEN in pH 1.2 HCl solution (a) and pH 6.8 phosphate buffer (b) at 37 °C. | ||
The IDR is a kinetic parameter, which may provide closer correlation with the in vivo drug dissolution dynamics than solubility.33 As mentioned above, a sustained-release solid form (slower IDR) of PFD is desired to enhance the pharmaceutical performance. Since the two cocrystals demonstrated significantly reduced eutectic solubilities and PFD molecules have enhanced intermolecular interactions in the cocrystal structures, the new forms are expected to meet our expectation. In the pH 1.2 medium, the IDRs of PFD, PFD–HES, and PFD–GEN are 2.57 × 10⁻³, 1.77 × 10⁻⁴, and 4.14 × 10⁻⁵ mg mL−1 cm−2 min−1, respectively (Fig. 9a, ESI,† Table S8). Compared with the parent PFD sample, the release rates of PFD from the two cocrystals are reduced by 93% and 98%, respectively. In the pH 6.8 solution (Fig. 9b, ESI,† Table S8), the cocrystals exhibit similar performance. The PFD IDRs are reduced from 2.92 × 10⁻³ to 1.77 × 10⁻⁴ and 6.71 × 10⁻⁵ mg mL−1 cm−2 min−1, respectively. The IDR tests highlight the potential of PFD–HES and PFD–GEN as sustained release forms.
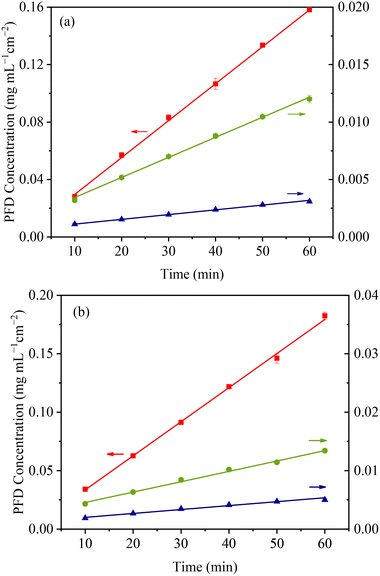 | ||
| Fig. 9 IDR curves of PFD (■), PFD–HES (●), and PFD–GEN (▲) in pH 1.2 (a) and pH 6.8 (b) solutions at 37.0 °C. | ||
When the solubility/dissolution rate of PFD is reduced, its maximum plasma concentration (Cmax) in vivo will likely be lowered. The bioavailability (AUC) may also be reduced or not depending on both plasma concentration and elimination rate. Recently, Ghosh et al. reported that PFD–fumaric acid sustained-release (SR) formulation exhibited lower Cmax (42.82%) and relative bioavailability (83%) in comparison to the commercial PFD formulation in a single-dose pharmacokinetic study. While in the multiple-dose comparative bioavailability study in healthy human volunteers, the SR formulation was found to be bioequivalent (107.60%) to the commercial formulation.17 The PFD–HES and PFD–GEN cocrystals are desired to have similar (lower Cmax and similar bioavailability) or even better (lower Cmax and higher bioavailability) performance. In the next investigation, pharmacokinetic studies of these samples on animals will be conducted. Positive results will be disclosed elsewhere.
Conclusion
In this study, the ketone⋯hydroxyl interaction was employed as a heterosynthon for PFD cocrystal design. Two PFD cocrystals with flavonoid compounds (HES and GEN) were successfully obtained. The existence of ketone⋯hydroxyl hydrogen bonding in cocrystals were clearly revealed by both the solved single crystal structures and FTIR spectra. Both cocrystals have higher Tm and Td than the PFD sample, ensuring their thermodynamic stability. Additionally, both cocrystal samples are non-hygroscopic. No special humidity condition is needed for their storage and manufacture. Compared with the PFD sample, PFD–HES and PFD–GEN have dramatically lower PFD solubility and dissolution rates. Such performance highlights their potential as sustained release PFD solid forms which are desired to improve the rapid absorption and elimination of this highly soluble drug, as well as dose related side effects. This case study will encourage the application of cocrystallization technology for drug solubility/IDR reduction, which is less discussed than solubilization studies.Conflicts of interest
The authors declare no competing financial interest.Acknowledgements
We are grateful for financial support from the National Natural Science Foundation of China (No. 21874148) and the Guangdong Basic and Applied Basic Research Foundation (No. 2019A1515110336). The authors also acknowledge the computing platform of the Innovation Academy for Precision Measurement Science and Technology, CAS, for the calculation support.Notes and references
- B. Geetha, S. Bipul and A. K. Nangia, Chem. Rev., 2022, 122, 11514–11603 CrossRef PubMed.
- M. Karimi-Jafari, L. Padrela, G. M. Walker and D. M. Croker, Cryst. Growth Des., 2018, 18, 6370–6387 CrossRef CAS.
- L. Y. Liu, J. R. Wang and X. F. Mei, CrystEngComm, 2022, 24, 2002–2022 RSC.
- S. N. Wong, Y. C. S. Chen, B. F. Xuan, C. C. Sun and S. F. Chow, CrystEngComm, 2021, 23, 7005–7038 RSC.
- N. J. Babu and A. Nangia, Cryst. Growth Des., 2011, 11, 2662–2679 CrossRef CAS.
- E. Batisai, ChemistryOpen, 2021, 10, 1260–1268 CrossRef CAS PubMed.
- P. Roy and A. Ghosh, CrystEngComm, 2020, 22, 6958–6974 RSC.
- R. Rathi, S. Kaur and I. Singh, Cryst. Growth Des., 2022, 22, 2023–2042 CrossRef CAS.
- A. A. Noyes and W. R. Whitney, J. Am. Chem. Soc., 1897, 19, 930–934 CrossRef.
- S. S. Jambhekar and P. J. Breen, Drug Discovery Today, 2013, 18, 1173–1184 CrossRef CAS PubMed.
- A. J. Smith, P. Kavuru, K. K. Arora, S. Kesani, J. Tan, M. J. Zaworotko and R. D. Shytle, Mol. Pharmaceutics, 2013, 10, 2948–2961 CrossRef CAS PubMed.
- N. R. Goud, R. A. Khan and A. Nangia, CrystEngComm, 2014, 16, 5859–5869 RSC.
- B. F. Xuan, S. N. Wong, Y. J. Zhang, J. W. Weng, H. H. Y. Tong, C. G. Wang, C. C. Sun and C. F. Chow, Cryst. Growth Des., 2020, 20, 1951–1960 CrossRef CAS.
- F. Z. Bu, Y. M. Yu, Y. L. Shen, L. Liu, C. W. Yan, Z. Y. Wu and Y. T. Li, CrystEngComm, 2022, 24, 2777–2790 RSC.
- ESBRIET (Pirfenidone), New Drug Application: 022535, https://www.accessdata.fda.gov/drugsatfda_docs/nda/2014/022535Orig1s000SumR.pdf.
- S. R. Soni and A. Ghosh, Carbohydr. Polym., 2017, 174, 812–822 CrossRef CAS PubMed.
- N. Kumari, P. Roy, S. Roy, P. K. Parmar, S. Chakraborty, S. Das, N. Pandey, A. Bose, A. K. Bansal and A. Ghosh, Mol. Pharmaceutics, 2022, 19, 1557–1572 CrossRef CAS PubMed.
- N. Kumari, B. Bhattacharya, P. Roy, A. A. L. Michalchuk, F. Emmerling and A. Ghosh, Cryst. Growth Des., 2019, 19, 6482–6492 CrossRef CAS.
- H. Meng and Y. Xu, Drug Des., Dev. Ther., 2015, 9, 3369–3376 CAS.
- D. X. Li, M. M. Kong, J. Li, Z. W. Deng and H. L. Zhang, CrystEngComm, 2018, 20, 5112–5118 RSC.
- L. X. Liu and J. Chen, J. Chem. Eng. Data, 2008, 53, 1649–1650 CrossRef CAS.
- J. G. Wu, J. Ge, Y. P. Zhang, Y. Yu and X. Y. Zhang, J. Chem. Eng. Data, 2010, 55, 5286–5288 CrossRef CAS.
- C. Maheshwari, V. André, S. Reddy, L. Roy, T. Duarte and N. Rodríguez-Hornedo, CrystEngComm, 2012, 14, 4801–4811 RSC.
- O. V. Dolomanov, L. J. Bourhis, R. J. Gildea, J. A. K. Howard and H. J. Puschmann, J. Appl. Crystallogr., 2009, 42, 339–341 CrossRef CAS.
- P. R. Spackman, M. J. Turner, J. J. McKinnon, S. K. Wolff, D. J. Grimwood, D. Jayatilaka and M. A. Spackman, J. Appl. Crystallogr., 2021, 54, 1006–1011 CrossRef CAS PubMed.
- W. Shin, S. Kim and K. S. Chun, Acta Crystallogr., Sect. C: Cryst. Struct. Commun., 1987, 43, 1946–1949 CrossRef.
- J. Wang, X. L. Dai, T. B. Lu and J. M. Chen, Cryst. Growth Des., 2021, 21, 838–846 CrossRef CAS.
- K. Chadha, M. Karan, Y. Bhalla, R. Chadha, S. Khullar, S. Mandal and K. Vasisht, Cryst. Growth Des., 2017, 17, 2386–2405 CrossRef CAS.
- P. Kavuru, D. Aboarayes, K. K. Arora, H. D. Clarke, A. Kennedy, L. Marshall, T. T. Ong, J. Perman, T. Pujari, L. Wojtas and M. J. Zaworotko, Cryst. Growth Des., 2010, 10, 3568–3584 CrossRef CAS.
- M. Barbero, M. Mossotti, A. Sironi, G. B. Giovenzana and V. Colombo, Acta Crystallogr., Sect. E: Crystallogr. Commun., 2019, 75, 984–986 CrossRef CAS PubMed.
- Y. J. Zhang, Y. G. Li, L. Liu, Q. H. Guo, R. J. Sa, M. Zhang and B. Y. Lou, Cryst. Growth Des., 2022, 22, 1073–1082 CrossRef CAS.
- X. J. Li, X. N. Liu, J. M. Song, C. G. Wang, J. H. Li, L. C. Liu, X. He, X. H. Zhao and C. C. Sun, Cryst. Growth Des., 2021, 21, 3461–3468 CrossRef CAS.
- M. G. Issa and H. G. Ferraz, Dissolution Technol., 2011, 18, 6–13 CrossRef CAS.
Footnote |
| † Electronic supplementary information (ESI) available: The pairwise intermolecular interaction energy, TGA curves, pH values of dissolution media and powder XRD of residuals after solubility tests, IDR data. CCDC 2234187 and 2217636. For ESI and crystallographic data in CIF or other electronic format see DOI: https://doi.org/10.1039/d3ce00402c |
| This journal is © The Royal Society of Chemistry 2023 |

